1. Introduction
The evolution of wireless communication systems aims to achieve higher transmission rates, greater capacity, and wider bandwidth. This is especially true of fifth-generation technology (5G), which utilizes frequency ranges between two bands—one below 6 GHz and the other in the millimeter wave frequencies—above 24 GHz [
1]. This frequency range is widely used by engineers and researchers and is often designed using specialized simulation programs.
Moreover, virtualization and simulation tools for designing and developing local IP LAN networks or IP devices are an option that allows engineers and developers to design and manage multiple network devices, such as computers, servers, switches, routers, and VLANs in various working environments [
2]. Generally, simulation programs are widely used for the evaluation and analysis of wireless networks. The benefits of simulation are significant, such as simplifying the process of scenario modeling and adding the ability to change parameters easily, which can often be very complex to parameterize in practice [
3].
In reality, many theoretical calculations are required for the evaluation of wireless or microwave connections. This analysis is called link budgeting, a crucial approach to designing system reliability and availability. In microwave systems, a link budget calculates and provides information about losses, the antenna gains of available power at the transmitter, propagation losses, losses from the transmitter and the receiver, and losses caused by environmental factors [
4].
Due to these reasons, the need for the development of new applications to assist in the design of microwave link budgets is very pressing. Meanwhile, existing simulation tools are often prohibitively expensive and necessitate the expertise of a specialist. Public institutions, in particular, face limited research and development budgets compared to multinational corporations. Open-source applications offer greater agility and flexibility and present a promising solution.
In this survey, an effective method is proposed for calculating a link budget through the development of a graphical user interface (GUI) application script and the development of a local network monitoring tool using the Python language. This application presents a simplified calculation of a link budget for two point-to-point microwave wireless Ethernet bridge connection scenarios, which are part of a local LAN network, enabling users to extract information regarding the calculation of specific parameters. Subsequently, the results are compared to five real simulation programs for the scenarios used with the same parameters. The computed results significantly match those of Airlink, the program developed by the company that manufactures the equipment used for the same scenarios.
The main points of this survey’s contribution are as follows:
To propel digital transformation by emphasizing the indispensability of programming expertise in conjunction with wireless communication fundamentals.
To promote technical flexibility and use Python GUI framework development to create an application recommended for problem solving in telecommunications that would provide multifaceted solutions.
The survey is conducted as follows.
Section 2 describes some of the graphical user interface tools developed for radio communications.
Section 3 describes the theoretical background to calculating the link budget for radio transmission.
Section 4 describes the proposed simulation tool. Finally, the results and conclusions of the proposed tools are presented in
Section 5 and
Section 6.
2. Related Work
Several studies have developed graphical user interface software tools in the technical field of telecommunications for further advancement in telecommunication and networks.
The work in [
5] presents an application that uses algorithms for signal diffraction and reflection calculation. This simulation program is based on the updated recommendations of the International Telecommunication Union (ITU-R) radiocommunication sector. This simulation program was developed with Adobe Xd software, and the simulation results are validated through comparison with other professional tools.
The authors of [
6] analyze the path loss prediction in an indoor environment at a frequency of 433 MHz. In this survey, reflection coefficient models are used to optimize the path loss prediction of the propagating signal. This tool is designed using MATLAB, and the results indicated that antenna position is important for channel modeling.
The authors of [
7] study a successful wireless link calculation designed using MATLAB. This MATLAB code was developed to compute and analyze the link budget. This software tool explores all the parameters, gains, and losses that may arise between a transmitter and receiver applied in satellite communication.
Research published in [
8] presents a mobile application developed in MATLAB/GUI to help students understand the basic principles of communication engineering. The results show that the values obtained from a mobile are reliable after comparing them to the calculated values.
Paper [
9] shows the graphical user interface developed using MATLAB. The tool describes the link budget scheme for power-based private wireless data networks and performs an estimation of the coverage and area of a single cell. The estimated results are the same as the existing measurement results.
Enriching the already existing research, this study focuses on the design and calculation of transmission parameters in a point-to-point wireless Ethernet bridge connection. It is also worth mentioning that developing a GUI environment using the Python programming language and the Tkinter library is considered to be a better choice due to its widespread use by engineers, scientists, and students for computer-related tasks [
10,
11]. In summary, creating scenarios using these features provides a cost-effective solution without the need for special equipment or deep technical programming knowledge.
3. Theoretical Background
The link budget is a theoretical calculation that incorporates factors of loss and gain, related to antennas and the propagation channel, in order to examine whether the connection is stable and operates without issues at the maximum distance between the transmitter and the receiver [
6].
3.1. Free Space Loss
It is obligatory to measure the losses due to distance and wavelength. The Free Space Path Loss (FSPL) depends on the frequency of the carrier signal and the distance between the transmitter and the receiver. The model loss can be calculated by
where
d is the distance in km and
f is the frequency in GHz.
3.2. Received (RX) Signal Level Power
The received signal power (dBm) expressed on the receiver is given as follows [
12]:
where
PT is the power of the transmitter,
GT is antenna gain of the transmitter,
GR is the antenna gain of the receiver, and
LFS the free space loss.
3.3. Fade Margin
The fade margin is the difference between the level of the received signal, and the sensitivity of the receiver (in dB), aimed to ensure the required quality of service, is defined as
where
RX is the received signal level power,
PRXth is the sensitivity threshold of the receiver.
3.4. Atmospheric Attenuation
Atmospheric attenuation is mainly caused by atmospheric gasses, and especially at high frequencies, it has a significant impact on the budget for the communication systems connectivity [
13]. The attenuation
γ is defined as
where
γο is the specific attenuation due to dry air and
γw is the specific attenuation due to water vapor. The atmosphere loss is determined by multiplying the specific attenuation
γ by the distance
d that the signal travels.
The power loss from gas attenuation, denoted as
Latm, is defined as
where
γ is the atmospheric attenuation and
d is the distance between the transmitter and the receiver.
4. Operating Interface (GUI) Design
The proposed tool is designed to describe and analyze a specific local network, control the connection of all the IP devices of the local network, calculate all the propagation parameters, and ensure that the signal arrives strong enough for the receivers. In
Figure 1, the application starts and the user has to enter the IP address to check the IP device’s connectivity. If the IP device is connected, the user can insert the microwave parameters in the input. Then, the user clicks the button and the tool executes the calculation and displays the result.
Python is a general-purpose language used in engineering to create multifunctional user interfaces. It is also used in computer engineering, web framework construction, data science, and artificial intelligence (AI). These functions can be performed with distinct features in various systems. Most Python GUI frameworks offer parameters that enable the easy creation of a comprehensive interface with customized formatting [
10]. Notably, there are Python libraries for image processing (e.g., PIL), GUI development (e.g., Tkinter), web programming (e.g., CGI), symbolic mathematics (e.g., SymPy), etc. Specifically, the “Tk” Python library can enhance both the appearance and functionality of the GUI itself. For this purpose, functions can be created and integrated from the interface using action control elements for the processing of input data. The proposed tool being analyzed is developed in a free Python Integrated Development Environment (IDE) called Thonny.
Initially, the user enters the static IP address of the wireless Ethernet bridge or the IP of the devices already connected to the local network that he desires to scan. This selection is made by pressing the button “Ping” and can be executed right after clicking on the depicted topology. When the communication is successful, the user enters the city name and the link budget parameters, and then the application automatically produces all of the computed values, as well as the weather condition, which appears in the appropriate frame. Then, the user has a choice to input two locations (station and Access Point) in order to initiate two web browsing (free online) simulation tools of two industrial companies. With these five simulation tools, the user can also input the same parameters, as in the proposed tool, above, so the user can crosscheck the outcome.
5. Results and Discussion
5.1. Simulation Scenarios
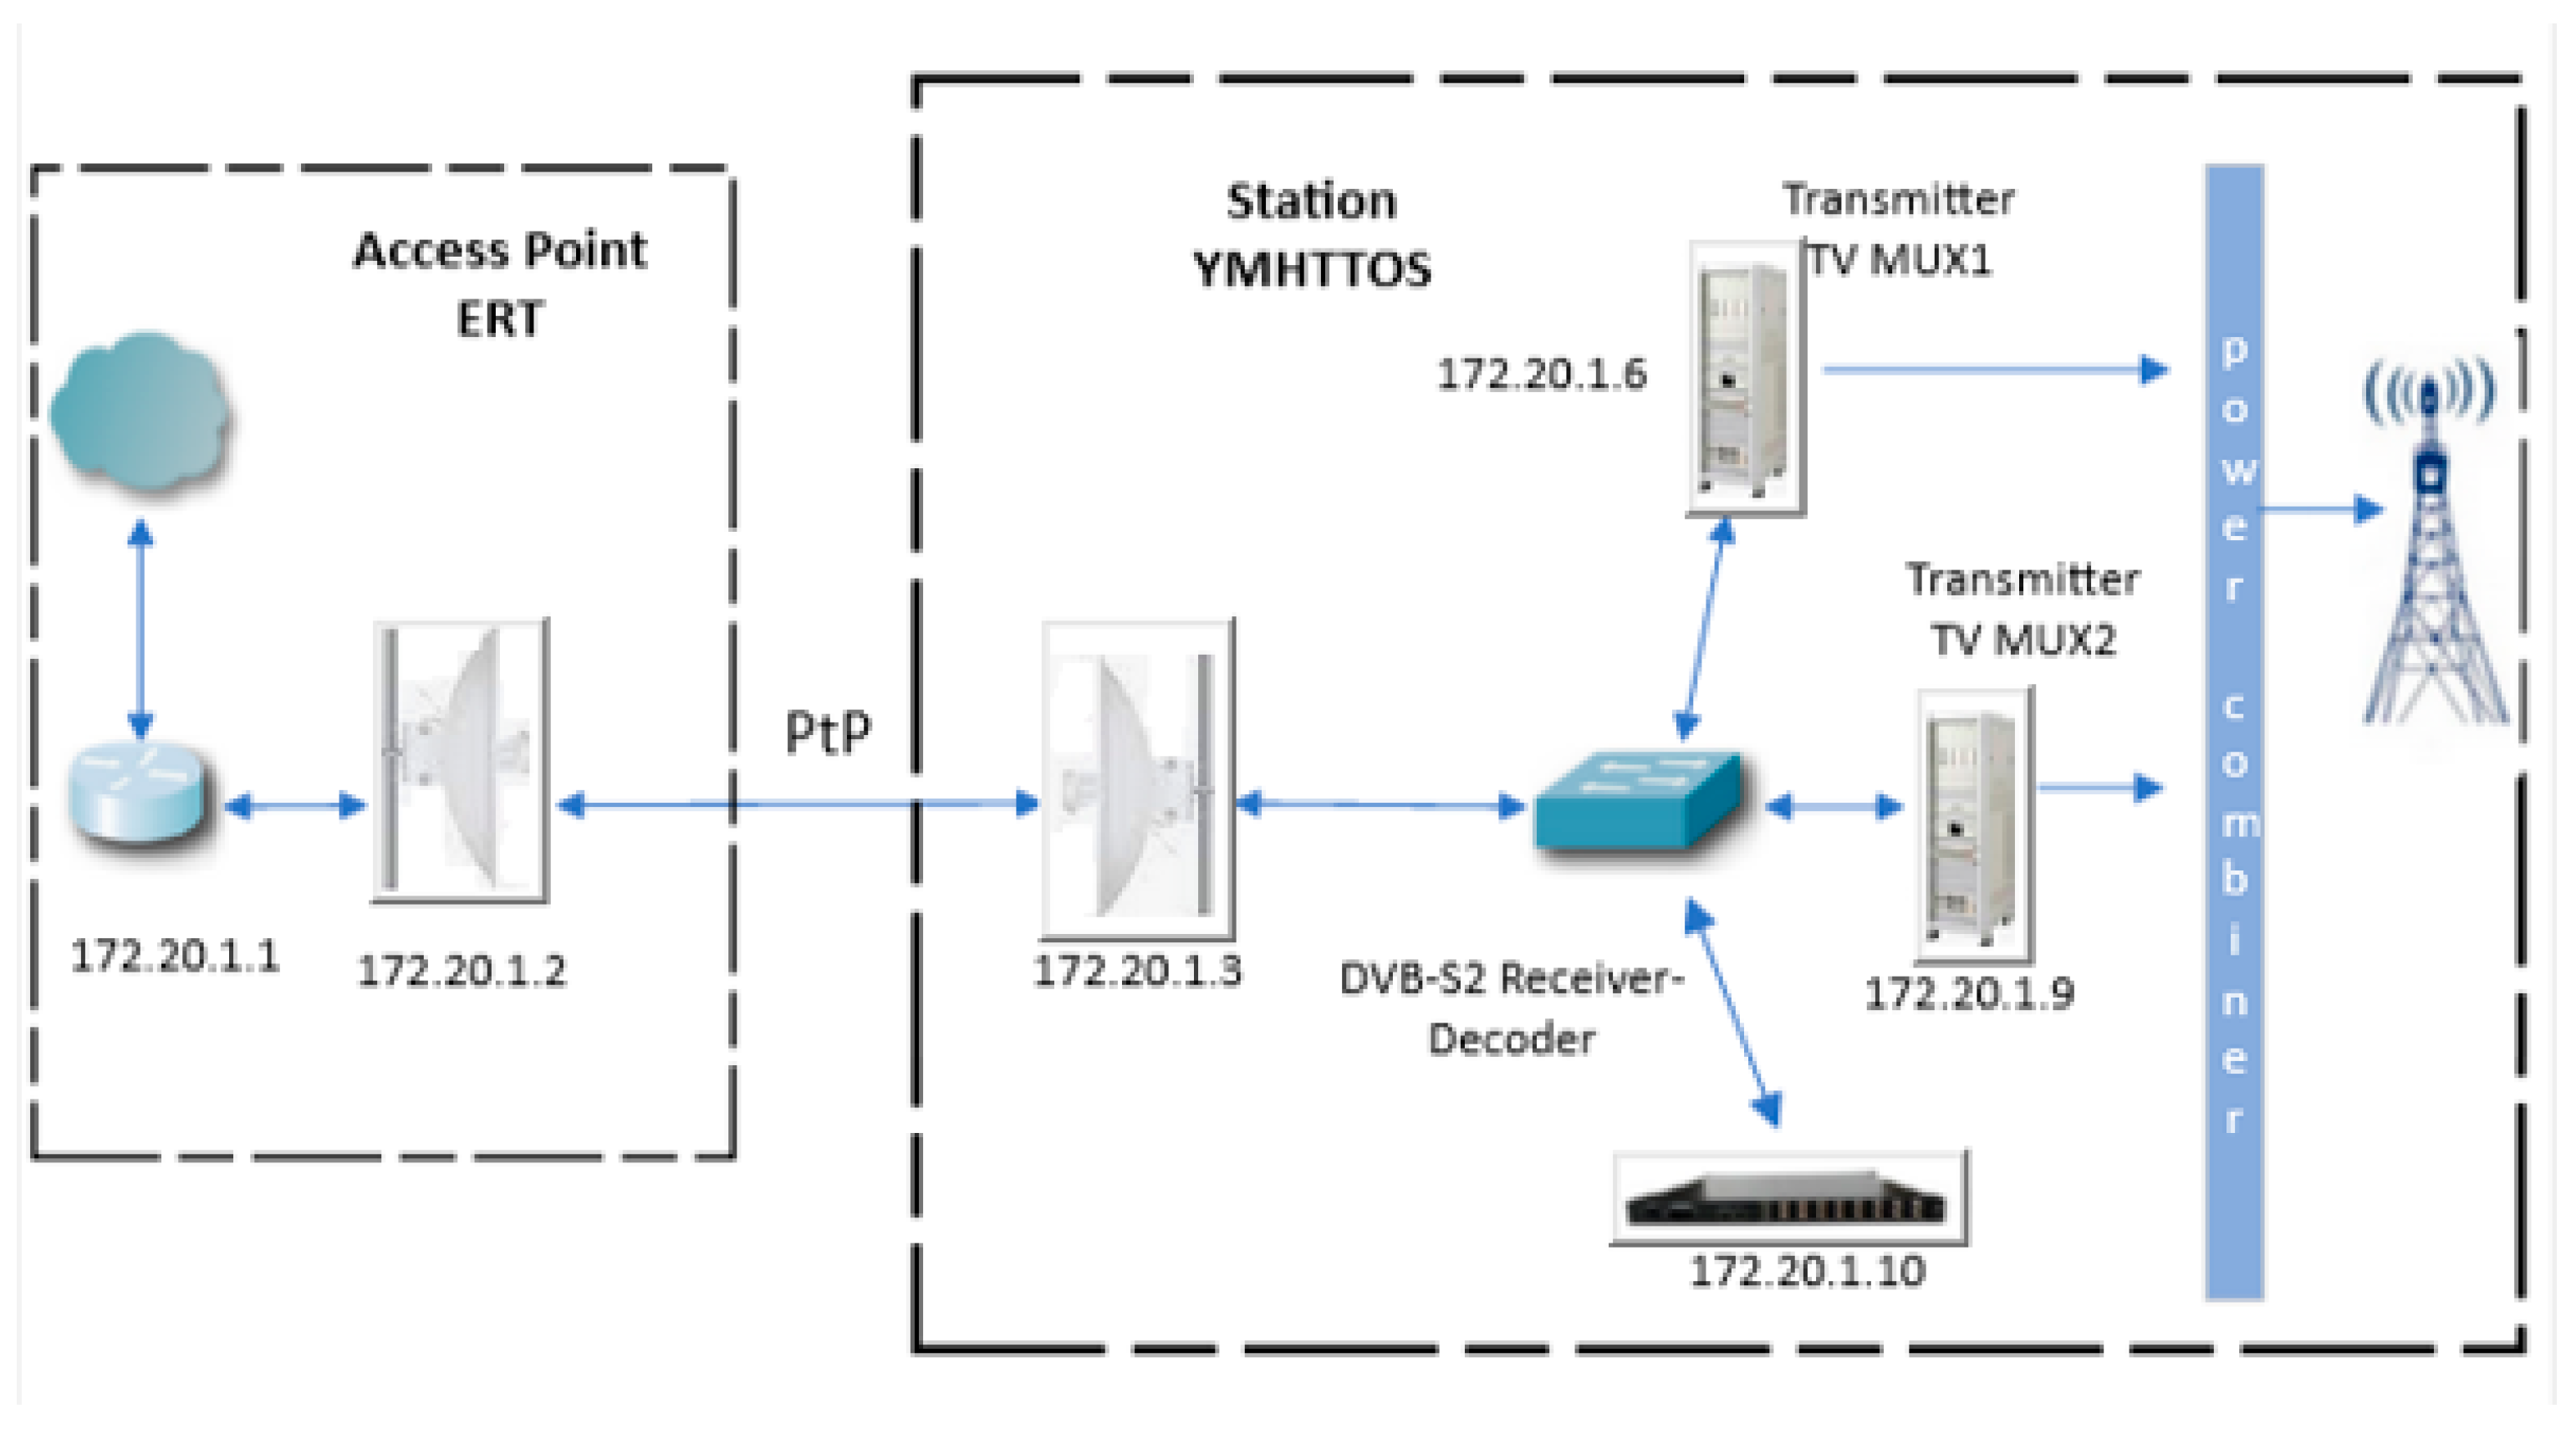
In this section, two experimental scenarios based on real wireless Ethernet bridge connections are analyzed from point to point, as shown in
Figure 2. The height of the TX antenna is 25 m at Aghia Paraskevi (Access Point), and the RX antenna is 55 m high on the transmission tower of Mount Hymettus (station). Both terrestrial microwave points are part of the Hellenic Broadcast Corporation, which is the state-owned public radio and television broadcaster of Greece. The microwave transmission parameters are provided in
Table 1, where both the transmitter and receiver in the link have the same types of antennas. For these experiments, the equipment of the transmitter and the receiver operates in the C and X bands. They are both supplied by the company Ubiquiti Networks. The names of the models are PowerBeam and AirFiber AF-11, and their specifications are described in the relevant datasheets [
14,
15]. The two microwave systems use the Time Division Duplex (TDD) method to send and receive data using a single radio channel.
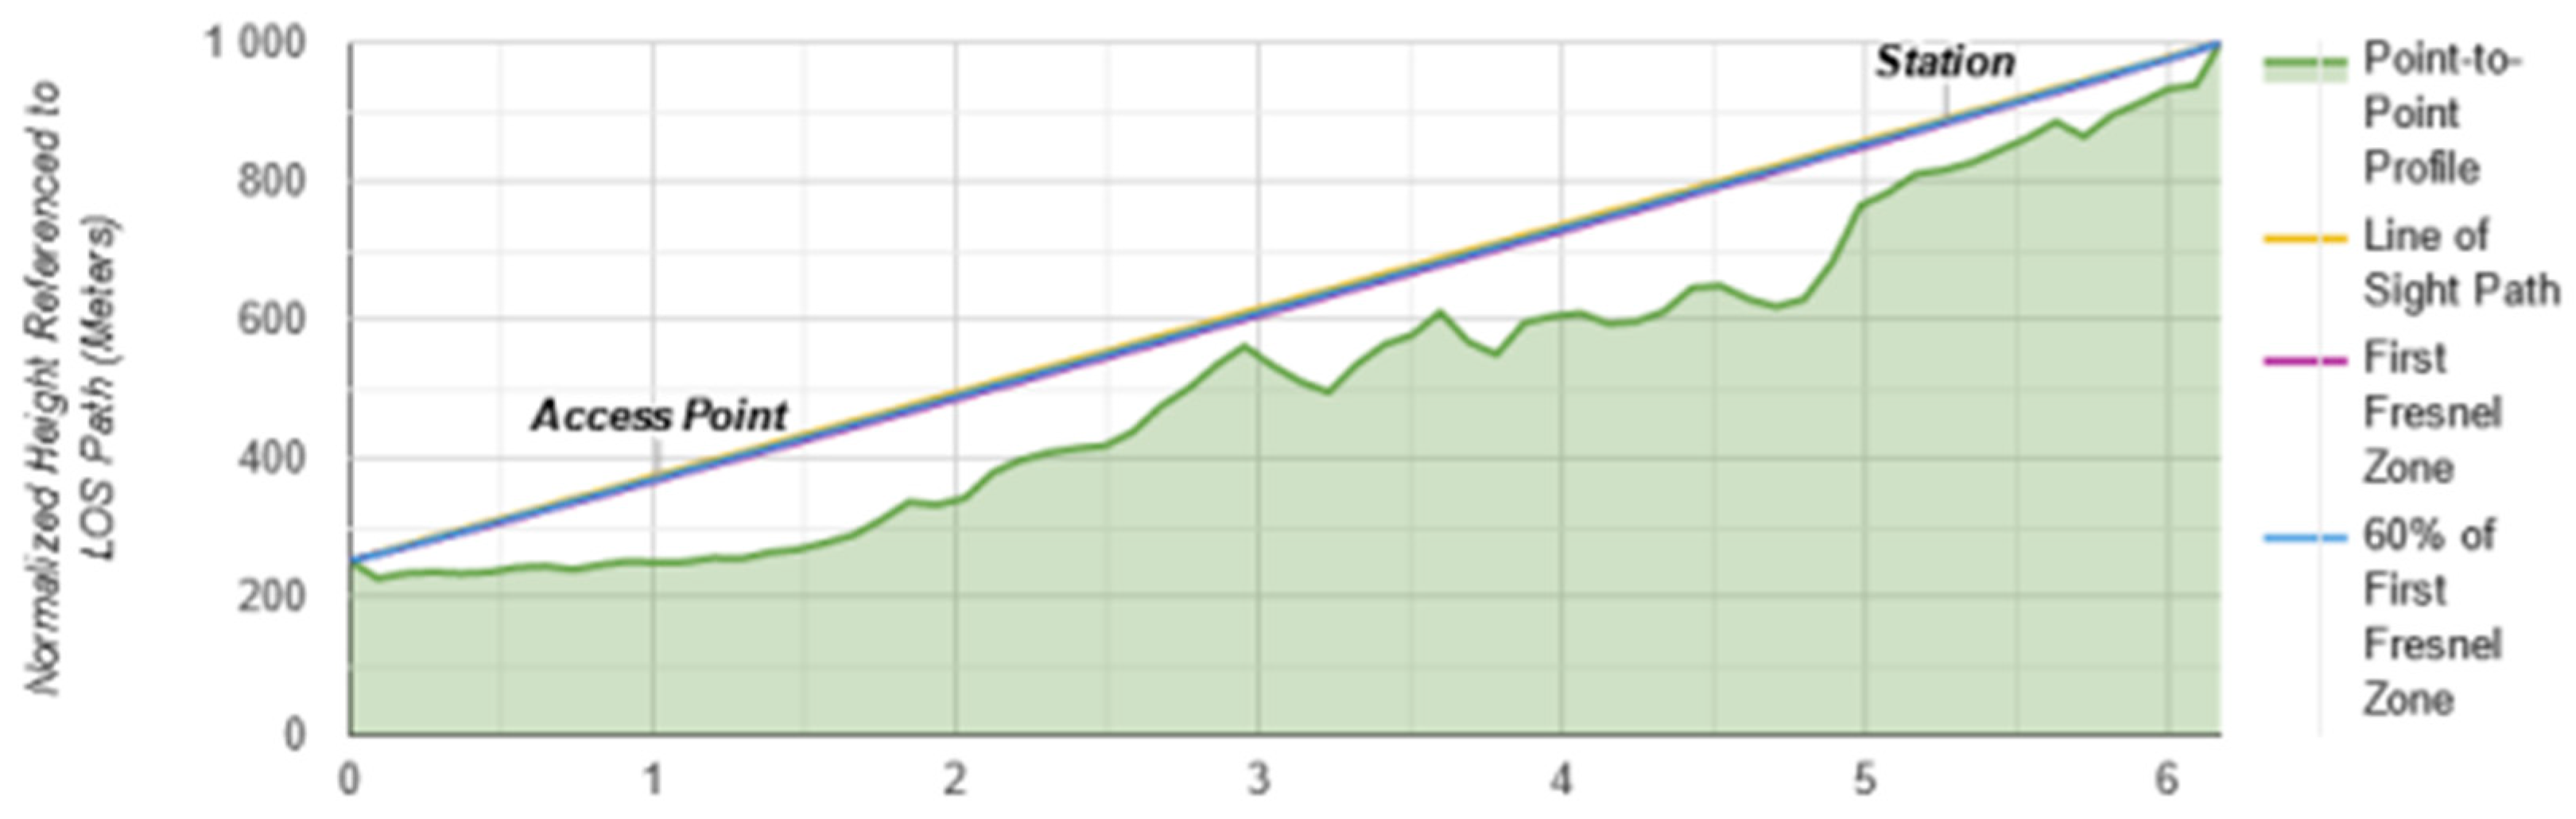
Figure 3 displays the path profile between the transmitter (Access point) and receiver (station) sites.
5.2. Calculation Examples
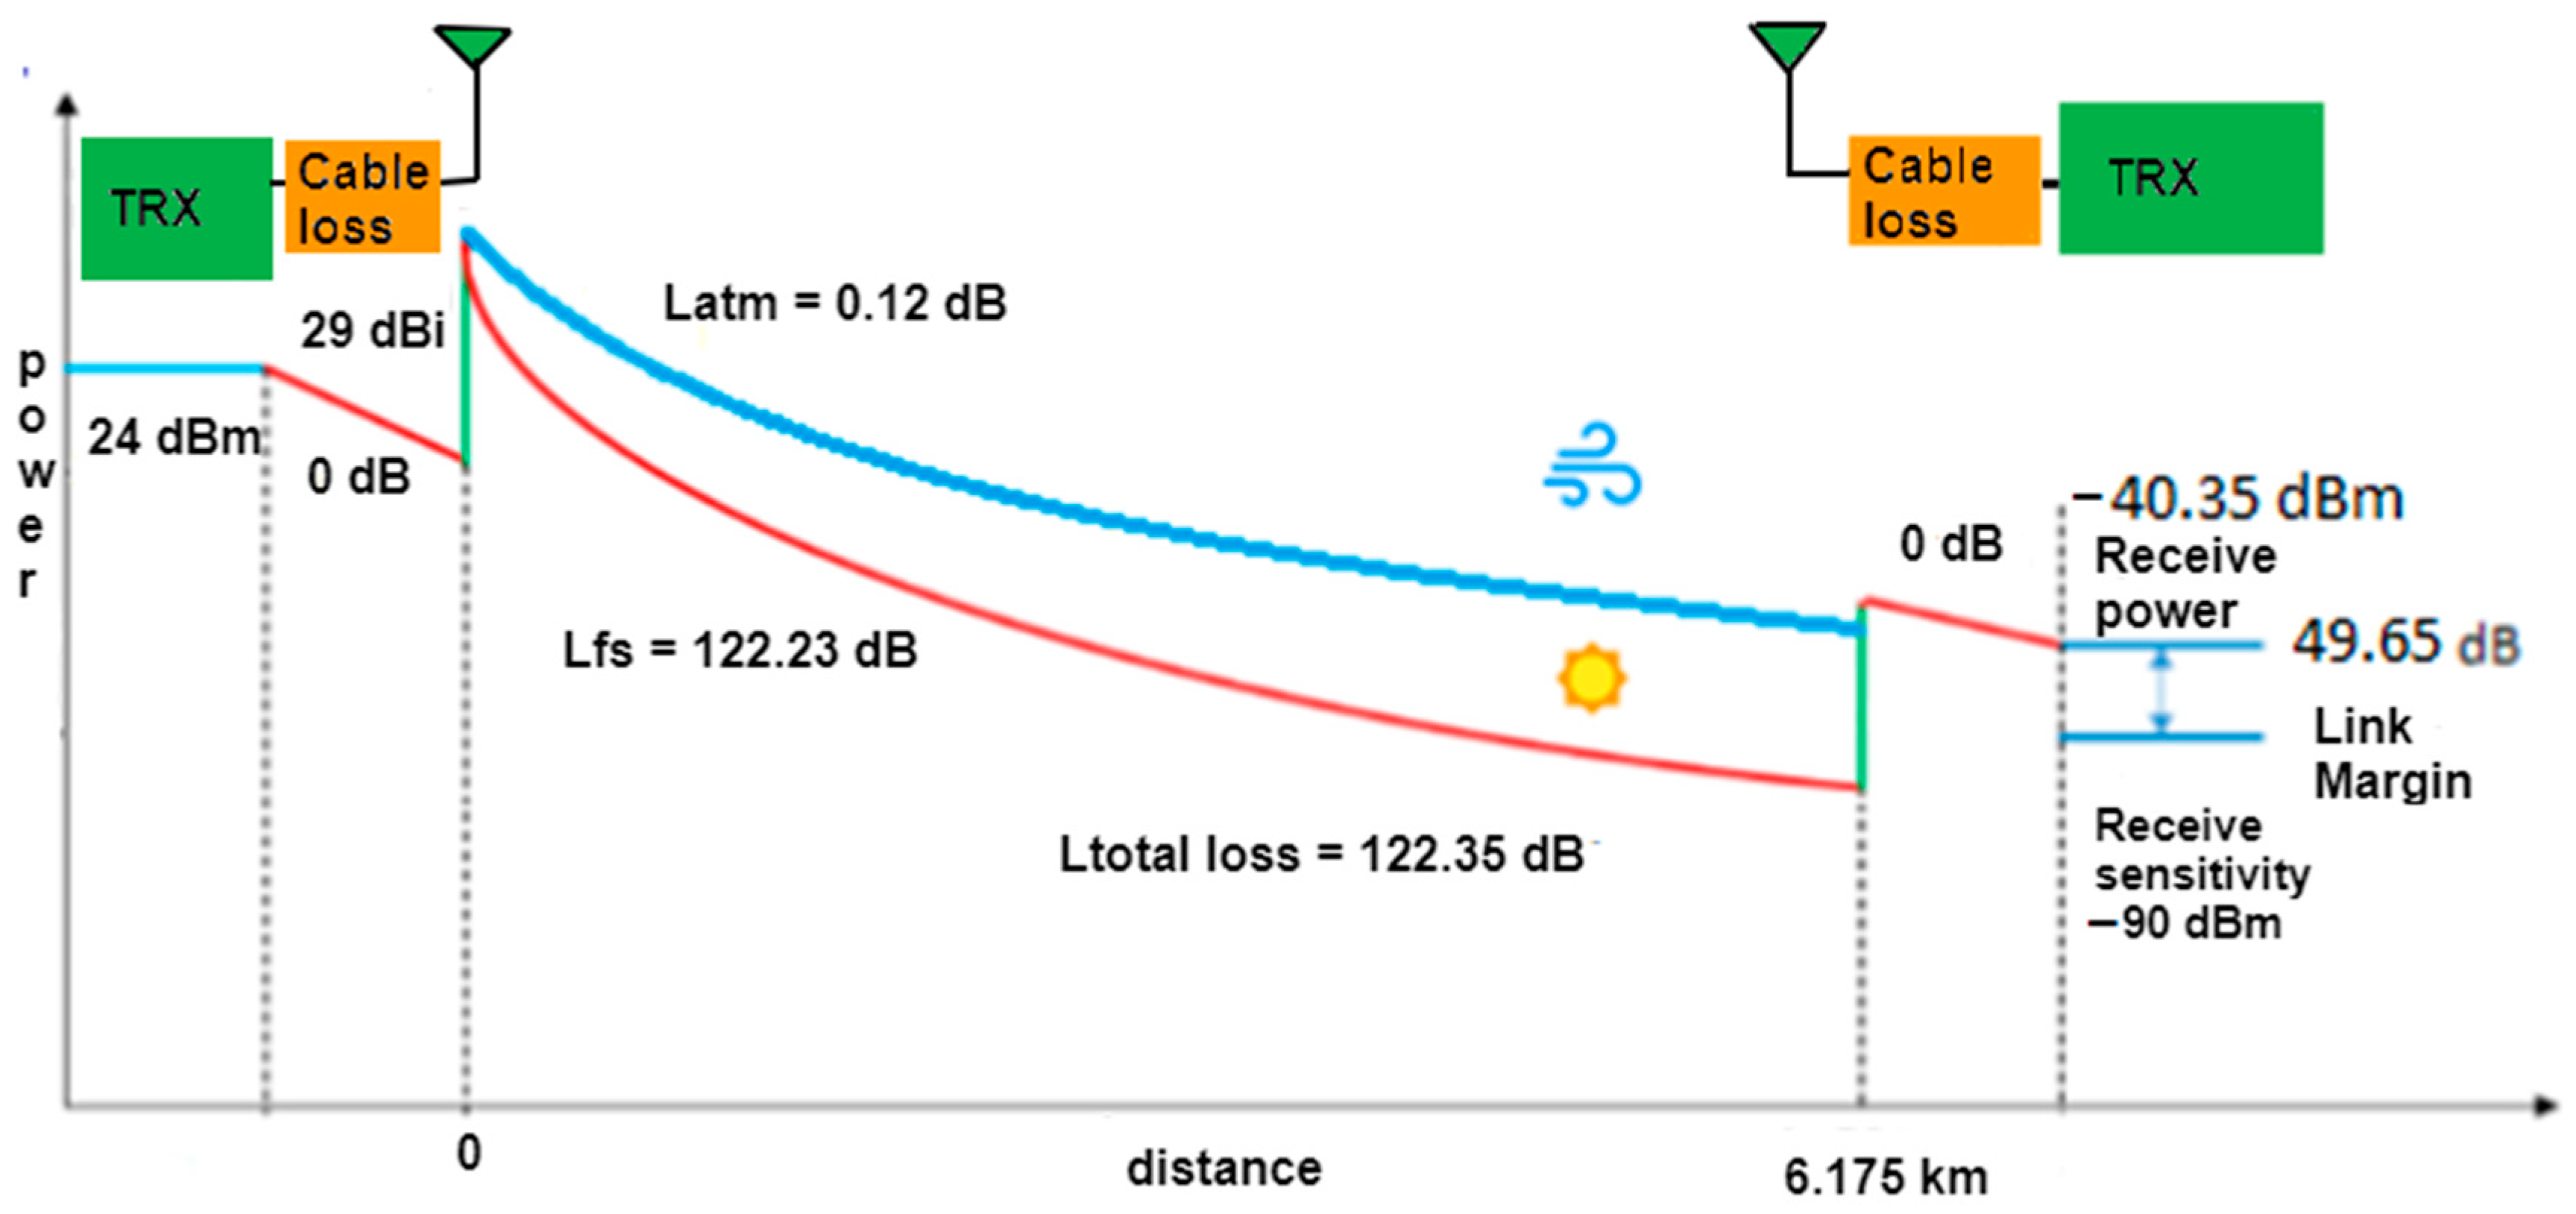
The proposed link budget script has been developed to calculate the received signal power by a transmitter and is used to determine the performance of wireless connection between two points. Additionally, with this tool we can also determine the difference between the minimum expected power (which is received) and the receiver’s sensitivity, known as link margin for each station. Certain constraints, such as transmission power, free space loss, antenna gain, and cable loss at the transmitter, are taken into account for the design of any transmission system. Therefore, link budgeting is often used to determine the sustainability of the design in order to overcome these constraints and for the system to meet the required specifications. In order to achieve the ability to communicate effectively between the transmitter and the receiver, the signal strength of the receiver must be greater than or equal to the receiver sensitivity.
In this project, the theoretical calculations that are used from the proposed tool are described in Equations (1), (2), and (5).
For example, in the first scenario, the Tx power is 24 dBm, the Tx cable loss is 0 dB, the Gt antenna gain is 29 dBi, the Gr antenna gain is 29 dBi, and the total path loss is 122.35 dB. At a distance of 6.175 km, the receiver signal power is calculated, 40.35 dBm, and the link margin is 49.65 dB, as shown in
Figure 4.
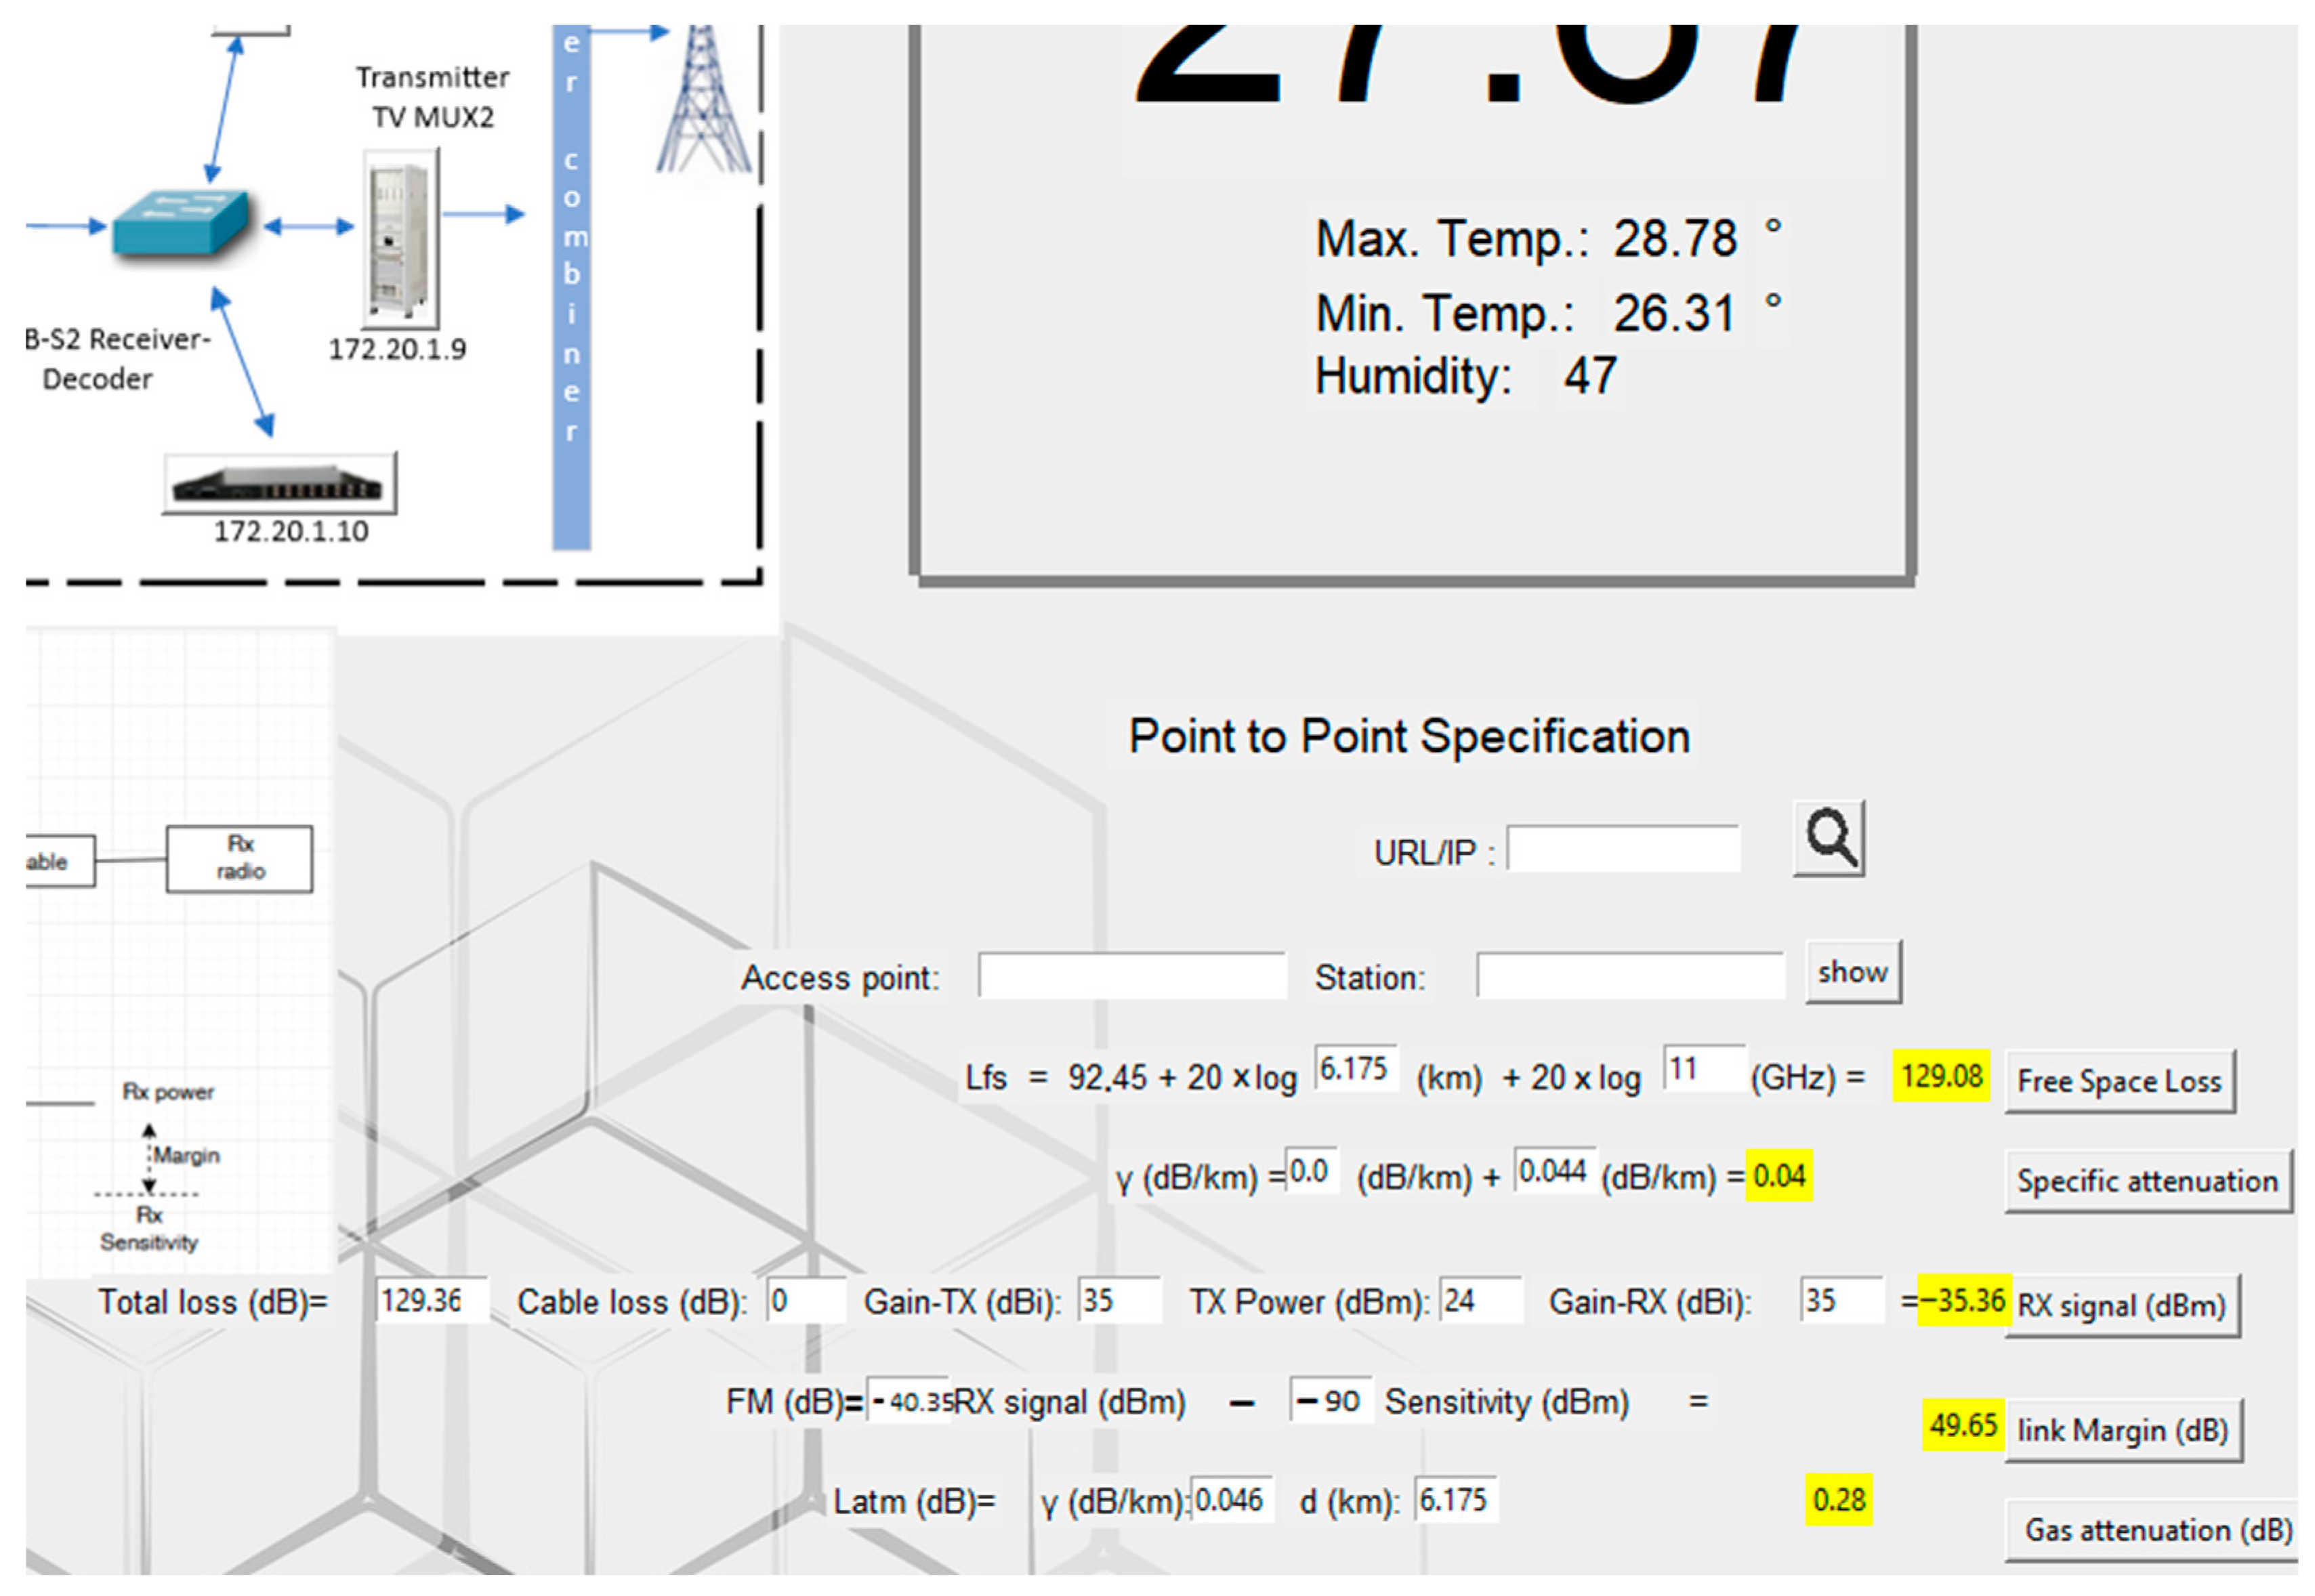
In the second scenario, the Tx power is 24 dBm, the Tx cable loss is 0 dB, the Gt antenna gain is 29 dBi, the Gr antenna gain is 29 dBi, and the total path loss is 129.36 dB. At a distance of 6.175 km, the receiver signal power is calculated as −47.36 dBm and the link margin as 42.64 dB, as shown in
Figure 5.
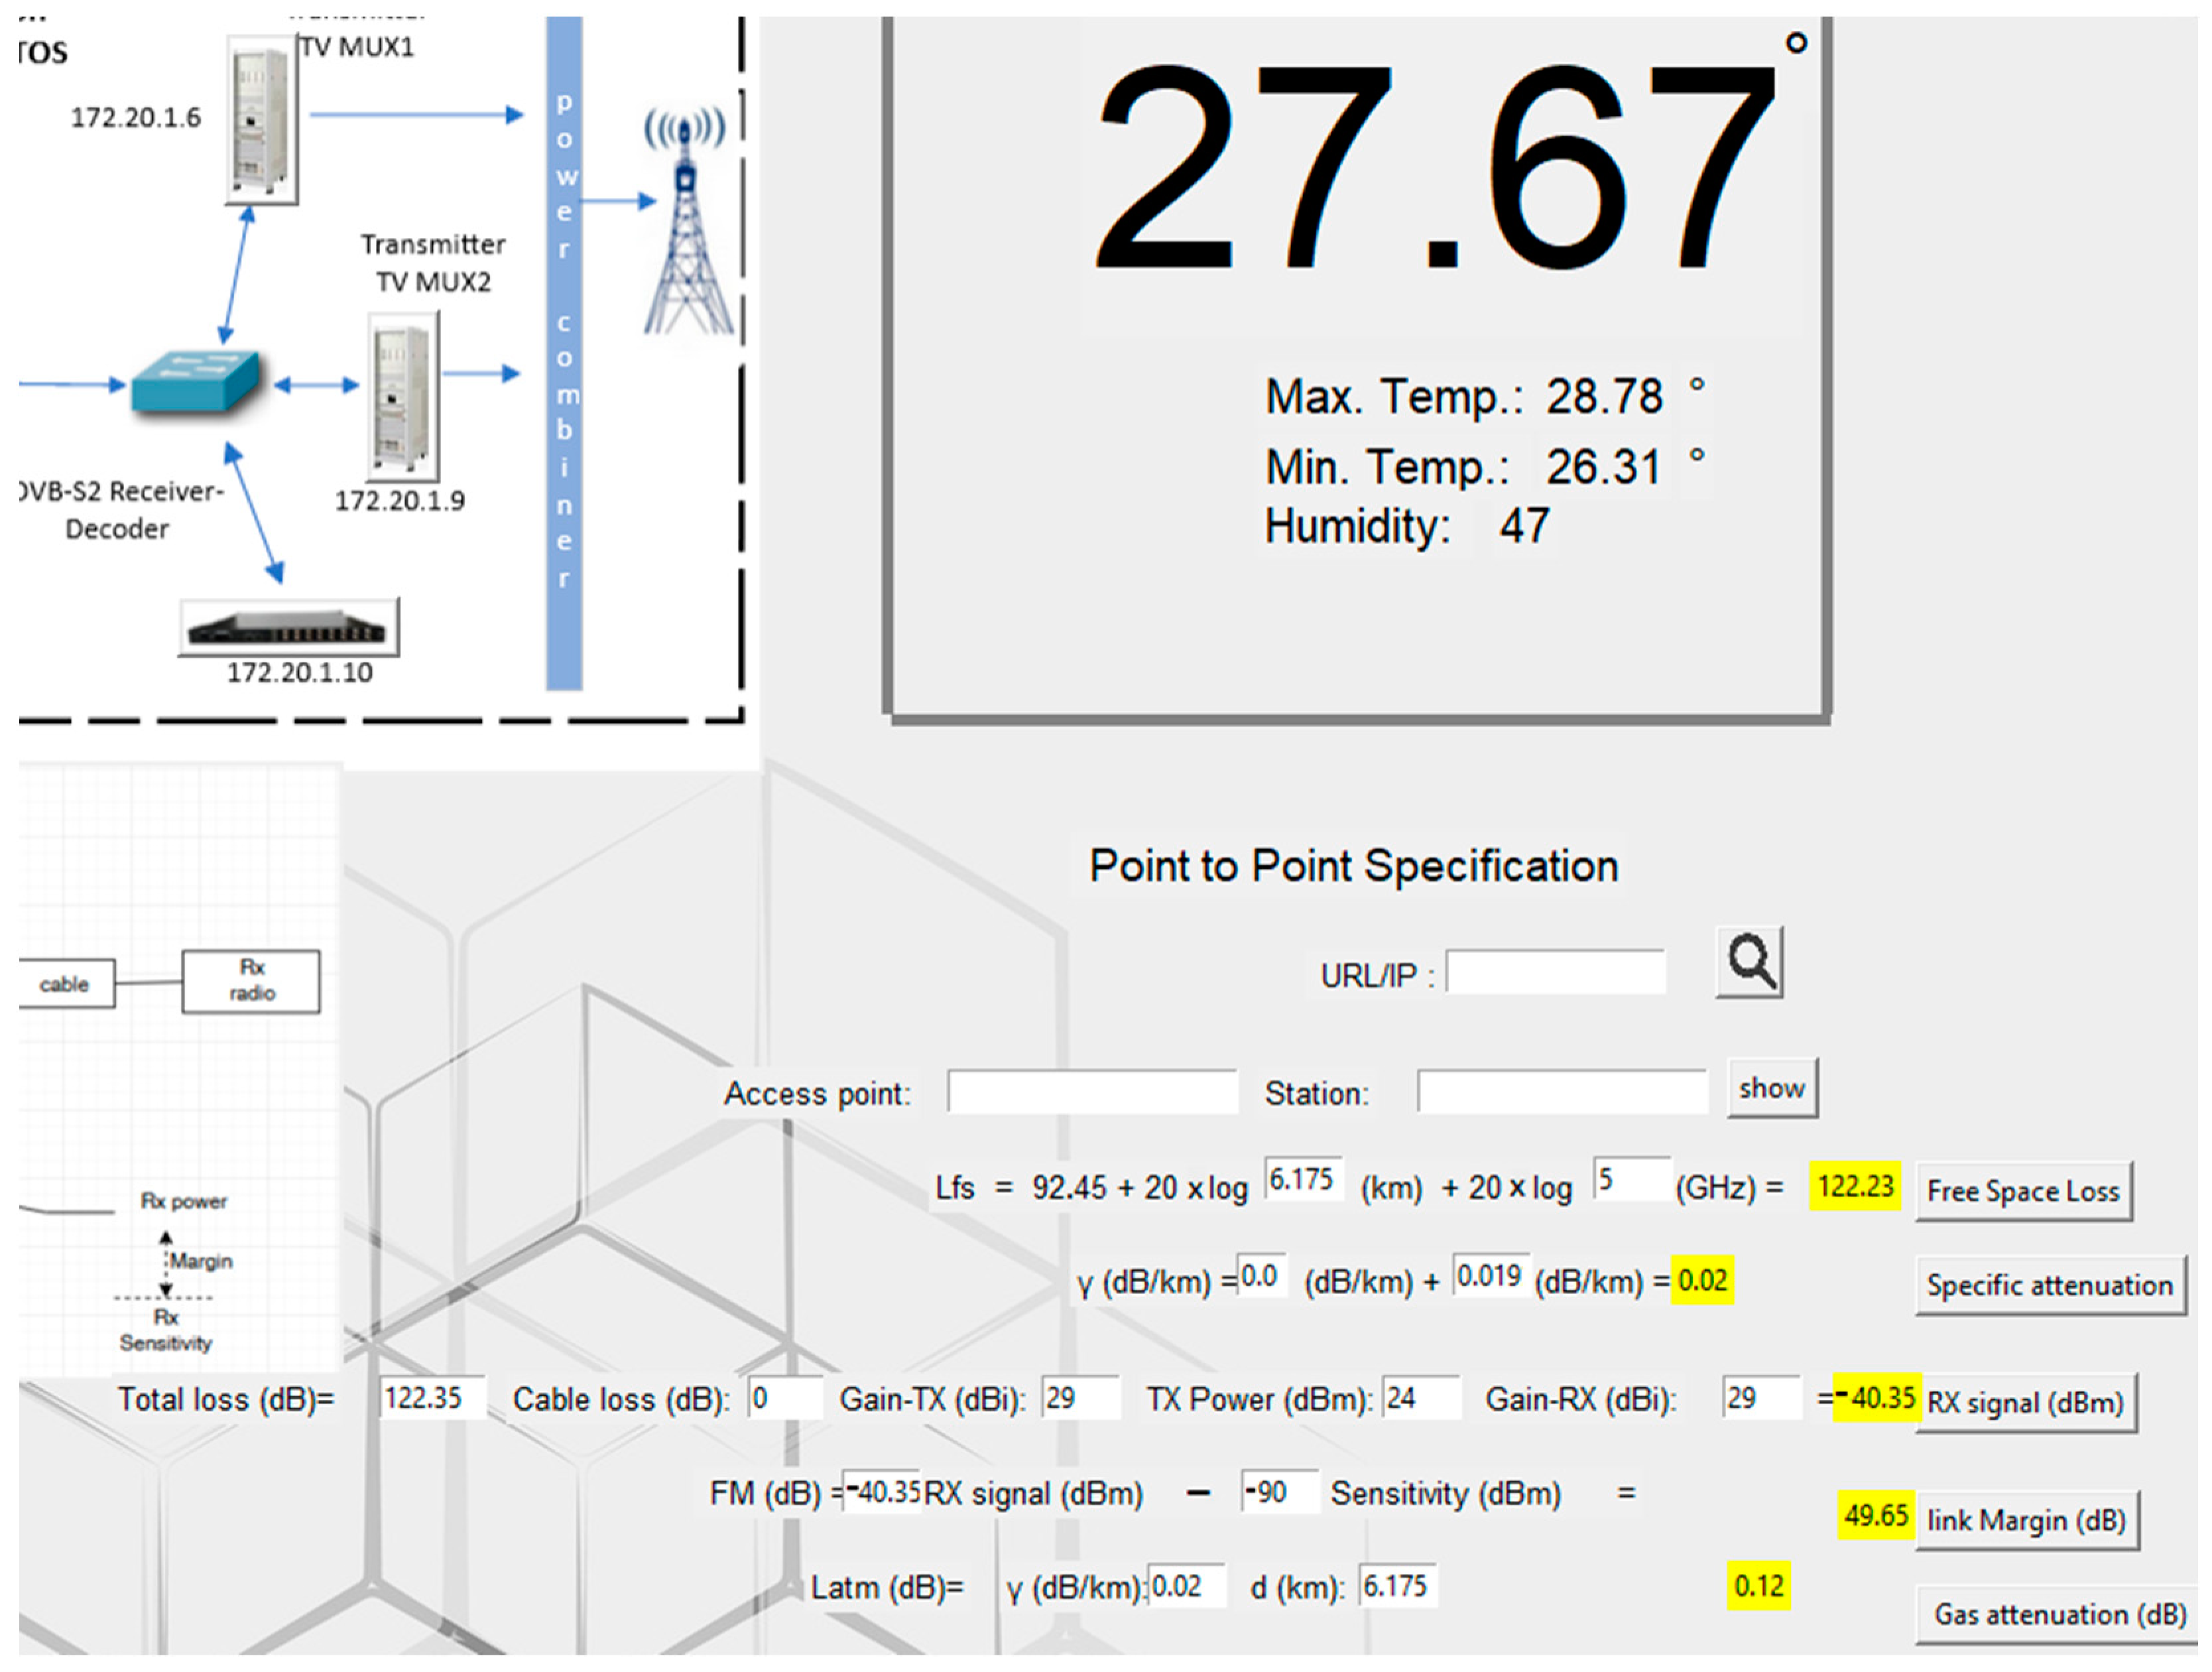
The mathematical formula for each field has been defined and is always shown in the interface, so that the user can input the necessary data for the completion of the formulas, and, by clicking on “Calculate”, they can generate the results. These results are highlighted by the yellow background, as shown in
Figure 6 and
Figure 7.
5.3. Comparison Results between Different Simulation Tools
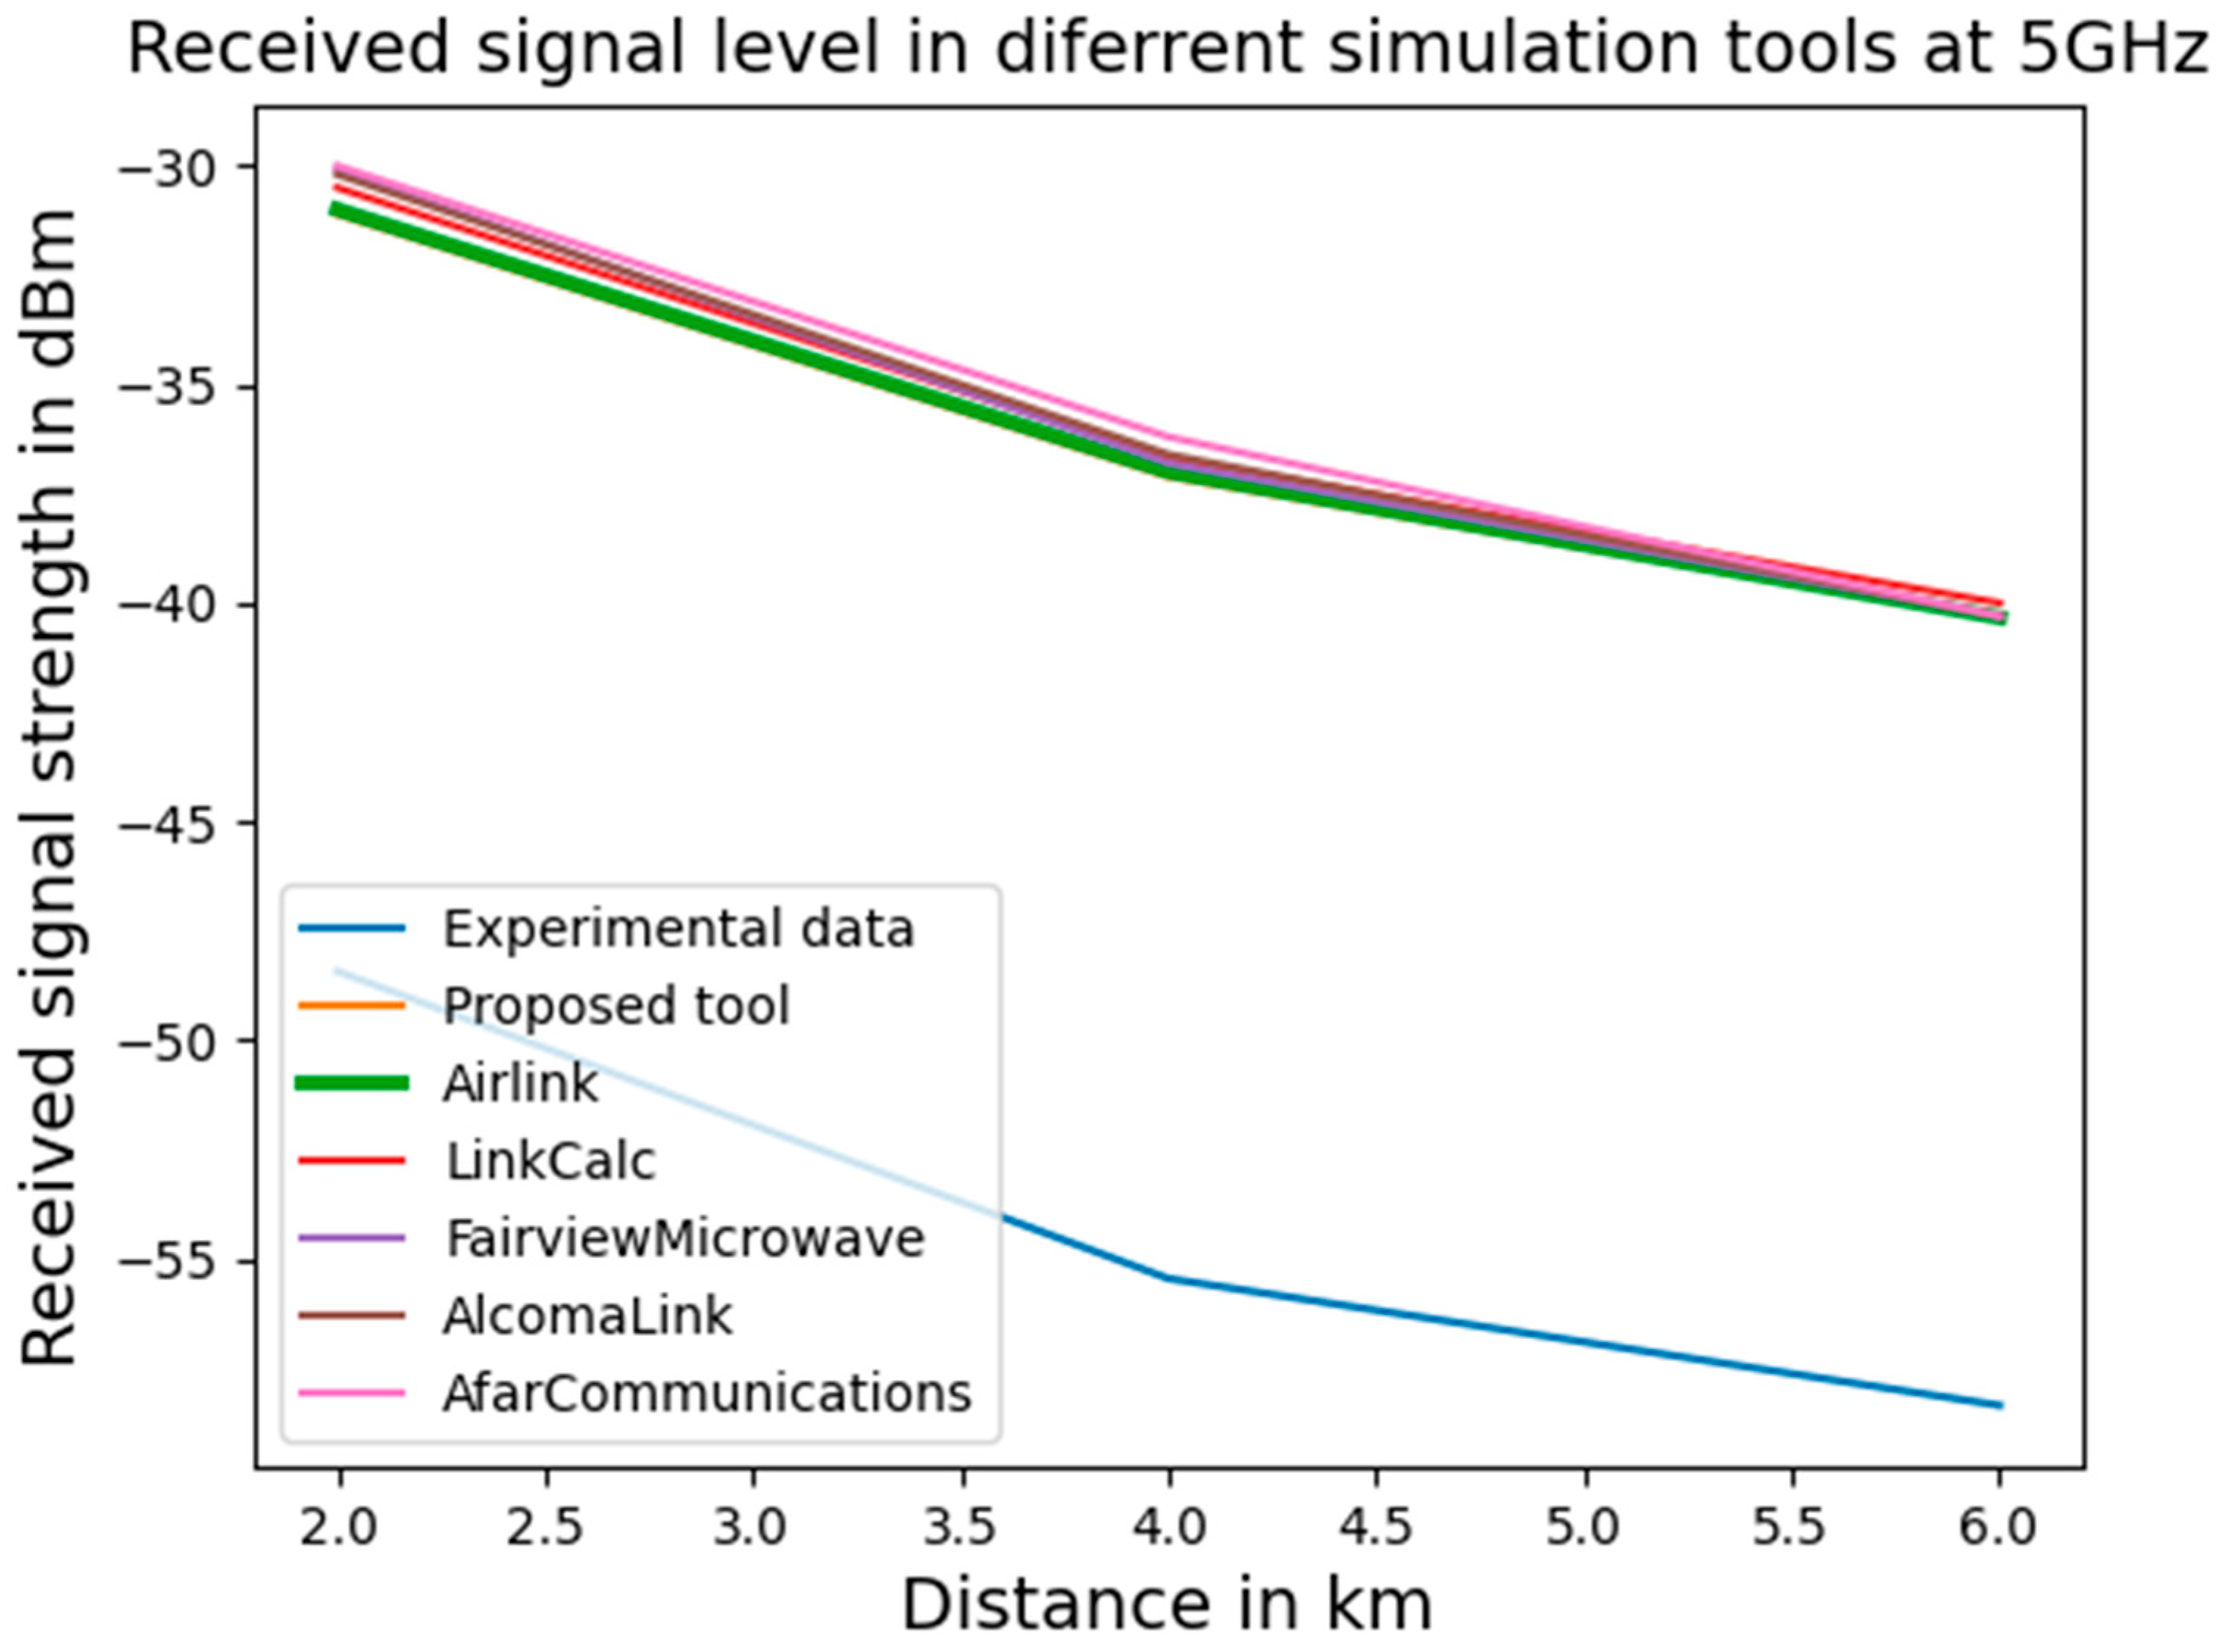
In the next phase, the link budget is calculated using the proposed tool and the same parameters are also inputted in the Airlink, LinkCalc, AfarCommunications, AlcomaLink, and Fairview microwave simulations.
Figure 8 and
Figure 9 show the variation in the received signal level at the maximum distance. As rule, as distance increases, the strength of the signal received weakens. The parameters of the five simulation tools have little difference, so the proposed scenario is verified by all five simulation tools. For demonstration reasons only we have also submitted in the same diagram the real-experimental curve of the assembly mentioned earlier, though in real life there are certain legal constraints, mainly because in practice the transmitted power is adjusted to around 6 dBm to be in compliance with the ETSI standard [
16] (the E.I.R.P value limit is set below 1 W in Europe for frequencies at 5 and 11 GHz). As shown in
Figure 8 and
Figure 9, all seven curves have the same inclination and degradation degree, but in different levels of received signal strength.
6. Conclusions
The results provided by the use of our simulation design tool are collected and demonstrated in comparison with the outcome results provided by the use of five professional tools. They appear in significant convergence for the same received signal level, indicating the validity, sustainability, and suitability of this tool, proving it to be ready for use in real implementations.
The results of the theoretical calculations shown in
Figure 8 and
Figure 9 show two important areas of verification. As a rule, when the distance increases, the received signal level decreases. Also, the path loss is observed to increase as the frequency increases, as is verified by propagation theory.
In addition to the uses of performing necessary calculations that have already been described, the tool can also offer the user the ability to easily scan the IP addresses of devices in the internal network, enabling complete administrative control of a local network with predetermined static IP addresses. It is also worth mentioning that industrial tools with similar purposes that are currently available often require extensive training or significant financial investment. In the future, this Python GUI script could be enhanced by including system noise calculations and other similar features to determine various signal losses. Furthermore, this scenario could be built upon a web framework such as Django, Flask, or Falcon. To further enhance the practicality and flexibility of the proposed tool, researchers could incorporate a wider range of signal processing applications and develop in parallel an interactive virtual lab that could provide a hands-on learning experience.
Author Contributions
Conceptualization, K.Z., A.S. and G.D.; Formal Analysis, K.Z., A.S. and G.D.; Methodology, K.Z., A.S. and G.D.; Writing—Original Draft Preparation, K.Z. and A.S.; Writing—Review and Editing, K.Z., A.S. and G.D.; Visualization, K.Z., A.S. and G.D.; Supervision, K.Z., A.S. and G.D.; Project Administration, G.D.; Funding Acquisition, G.D. All authors have read and agreed to the published version of the manuscript.
Funding
This research received no external funding.
Data Availability Statement
No new data were created or analyzed in this study. Data sharing is not applicable to this article.
Conflicts of Interest
The authors declare no conflicts of interest nor personal or financial relationships impacting this work.
References
- Zhao, Z.; Wan, G.; Huang, X. Design of Dual-Band Frequency Selective Surface with Large Band Ratio for 5G Communication. In Proceedings of the 2020 IEEE 3rd International Conference on Electronics Technology (ICET), Chengdu, China, 8–12 May 2020; pp. 756–759. [Google Scholar] [CrossRef]
- Nedyalkov, I. Studying the Traffic Flow between a Modeled and a Real IP Network. In Proceedings of the 2019: 10th National Conference with International Participation (ELECTRONICA), Sofia, Bulgaria, 16–17 May 2019; pp. 1–4. [Google Scholar]
- Magana, A.J.; Jong, T.D. Modeling and simulation practices in engineering education. Comput. Appl. Eng. Educ. 2018, 26, 731–738. [Google Scholar] [CrossRef]
- Kosulnikov, S.; Cuesta, F.S.; Wang, X.; Tretyakov, S.A. Simple Link-Budget Estimation Formulas for Channels Including Anomalous Reflectors. IEEE Trans. Antennas Propag. 2023, 71, 5276–5288. [Google Scholar] [CrossRef]
- Ferreira, E.; Sebastião, P.; Cercas, F.; Sá Costa, C.; Correia, A. An Optimized Planning Tool for Microwave Terrestrial and Satellite Link Design. Future Internet 2023, 15, 58. [Google Scholar] [CrossRef]
- Sobetwa, M.; Sokoya, O. Measurement Analysis of Indoor Parameters for an Indoor Wireless Propagation. In Proceedings of the 2019 International Conference on Wireless Technologies, Embedded and Intelligent Systems (WITS), Fez, Morocco, 3–4 April 2019; pp. 1–6. [Google Scholar]
- Ya, N.; Johari, J.; Zolkapli, M.; Yusof, A.L.; Sarnin, S.S.; Naim, N.F. Link budget calculator system for satellite communication. In Proceedings of the 2017 International Conference on Electrical, Electronics and System Engineering (ICEESE), Kanazawa, Japan, 9–10 November 2017; pp. 115–119. [Google Scholar]
- Jane, M.; Aisyah, W. A development of mobile application satellite link budget calculator—SATELEC. In Proceedings of the E3S Web of Conferences, Bandung, Indonesia, 18 January 2024; pp. 1–8. [Google Scholar] [CrossRef]
- Wang, H.; Zhang, Y.; Sun, H. Link Budget Estimation and Implementation on Power Private Wireless Data Network. In Proceedings of the IOP Conference Series: Materials Science and Engineering, Guangzhou, China, 6 April 2020; Volume 790, p. 012014. [Google Scholar] [CrossRef]
- Kumari, R.; Fancy, C. Analyzing the PyGameGUI modules available in python. In Proceedings of the 2017 International Conference on IoT and Application (ICIOT), Nagapattinam, India, 19–20 May 2017; pp. 1–6. [Google Scholar]
- Singh, J.; Taluja, C.; Choudhary, V.; Chand, K.; Guha, P. Design and Development of Graphical User Interfaces for Detection of Forest Fires at early stages using Open-Source Technologies. In Proceedings of the 2021 6th International Conference on Signal Processing, Computing and Control (ISPCC), Solan, India, 7–9 October 2021; pp. 218–222. [Google Scholar]
- Hilt, A. Availability and Fade Margin Calculations for 5G Microwave and Millimeter-Wave Anyhaul Links. Appl. Sci. 2019, 9, 5240. [Google Scholar] [CrossRef]
- Mohanta, K.; Al-Rubaye, S. Towards 6G Satellite–Terrestrial Networks: Analysis of Air Mobility Operations. Electronics 2024, 13, 2855. [Google Scholar] [CrossRef]
- Ubiquiti Networks. Power Beam ac High-Performance airMAX® Bridge Data Sheet. 2016. Available online: https://dl.ubnt.com/datasheets/PowerBeam_ac/PowerBeam5ac_DS.pdf (accessed on 6 June 2016).
- Ubiquiti Networks. Airfiber x Antenna 11 GHz, 35 dBi. 2016. Available online: https://dl.ubnt.com/datasheets/airfiber/airFiber_AF-11G35_DS.pdf (accessed on 1 March 2016).
- ETSI EN 301 893 V2.2.0 (2023-11)—5 GHz WAS/RLAN. Harmonised Standard for Access to Radio Spectrum. Available online: https://www.etsi.org/deliver/etsi_en/301800_301899/301893/02.02.00_20/en_301893v020200ev.pdf (accessed on 1 November 2023).
| Disclaimer/Publisher’s Note: The statements, opinions and data contained in all publications are solely those of the individual author(s) and contributor(s) and not of MDPI and/or the editor(s). MDPI and/or the editor(s) disclaim responsibility for any injury to people or property resulting from any ideas, methods, instructions or products referred to in the content. |
© 2024 by the authors. Licensee MDPI, Basel, Switzerland. This article is an open access article distributed under the terms and conditions of the Creative Commons Attribution (CC BY) license (https://creativecommons.org/licenses/by/4.0/).


