Article

Resource-Conserving Protection against Energy Draining (RCPED) Routing Protocol for Wireless Sensor Networks

1
Chongqing Key Lab of Mobile Communications Technology, Chongqing University of Posts and Telecommunications, Chongqing 400065, China
2
School of Mathematics, Computer Science and Engineering, University of London, London EC1V 0HB, UK
*
Author to whom correspondence should be addressed.
Network 2022, 2(1), 83-105; https://doi.org/10.3390/network2010007
Submission received: 29 December 2021 / Revised: 29 January 2022 / Accepted: 31 January 2022 / Published: 11 February 2022

Abstract

:
This paper proposes a routing protocol for wireless sensor networks to deal with energy-depleting vampire attacks. This resource-conserving protection against energy-draining (RCPED) protocol is compatible with existing routing protocols to detect abnormal signs of vampire attacks and identify potential attackers. It responds to attacks by selecting routes with the maximum priority, where priority is an indicator of energy efficiency and estimation of security level calculated utilizing an analytic hierarchy process (AHP). RCPED has no dependence on cryptography, which consumes less energy and hardware resources than previous approaches. Simulation results show the benefits of RCPED in terms of energy efficiency and security awareness.

1. Introduction

Wireless sensor networks (WSNs) made up of wirelessly interconnected sensor nodes are a subset of ad hoc networks that are self-configuring networks without fixed infrastructure [1,2,3]. Sensor nodes can have multiple essential functions, including sensing, data relaying, and data exchanging with external networks [4,5,6]. WSNs were initially motivated by military applications, such as enemy movement detection, and further employed by many civil applications. Since military-related WSN applications are naturally under threat by hostile actions aimed at paralyzing their functionality, security threats targeting WSNs have been well studied [7,8,9]. Most previous studies have concluded that many attacks share the goal of stopping the network from functioning instantly, either adequately or within a short time period.
The origin of these attacks may not be identified promptly, but the disruptions caused can draw attention to underway attacks. As a result, the network operator will be alerted and take measures to defend against the effect of these attacks [10,11,12]. From the attacker’s point of view, this kind of attack mode may have limited effectiveness, as they are targeting military-related networks for which its users have probably taken security measures before deployment.
Conducting stealthy attacks without being noticed for a long time is a better strategy, and there are types of attacks that do not disrupt the network’s availability immediately but seek to undermine the network gradually over a relatively long period of time. An example is vampire attacks [13] aimed at depleting the network energy resources (usually batteries in nodes) stealthily. Vampire attacks are especially harmful to WSN applications working in extreme environments (such as environmental surveillance or enemy detection) since their nodes are hard to reach (implying that battery replacement is difficult or even impossible).
Vampire attacks can exploit the fact that control messages in existing routing protocols designed for WSNs do not usually require authentication. As aforementioned in the previous paragraph, it is stiff (sometimes not possible) to perform energy storage refilling for sensor nodes in specific WSN applications. Vampire attacks can cause those sensors to stop functioning sooner than normal, which can cause disruptions for the network. Thus, network operators must detect abnormal signs of vampire attacks and identify potential attackers.
Vampire attacks can carry out the following:
  • Route loop attack (carousel attack): In this attack mode, the adversary intentionally creates routing loops and repeatedly makes data packets travel over the same loop.
  • Stretch attack: In this attack mode, the adversaries try to stretch the length of regular routes as much as possible and make data pass through as many unnecessary nodes as possible. Consequently, the average route length may increase noticeably, and so does the number of nodes initially not supposed to be involved in data transmission.
Vampire attacks are inclined to secretly damage the network by small increments rather than generating vast data to paralyze the network promptly. Since data transmissions will be accomplished at the end of the day (but with much higher costs in resources), it is difficult for network operators to detect and prevent vampire attacks. To the best of our knowledge, there have been very few studies on defense against vampire attacks. On the other hand, existing solutions rely on cryptographic operations, which require considerable computational power and energy consumption from sensor nodes with limited resources.
Later in this paper, we investigate how to protect routing protocols from vampire attacks in a more energy-efficient manner (this paper also serves as part of the first author’s Ph.D. thesis [14]). The proposed work provides energy-efficient routing protection by collaborating with existing routing protocols. The protection is independent of cryptography, consuming less energy and hardware resources. This advantage is significant to sensors in WSNs as they are usually in possession of very limited energy storage and computational capability. The rest of this paper is organized as follows: In Section 3, Section 4 and Section 5, the detection of vampire attacks is described in detail. Section 5 discusses how to mitigate harm from vampire attacks. Performance evaluation of the proposed solution in terms of simulation results is presented in Section 6.

2. Related Works

As sensors adopted in WSNs have limited computation and energy resources, they are naturally vulnerable to resource depletion attacks, such as denial of service (DoS) attacks and forced authentication attacks [15]. DoS attacks threatening WSNs and the corresponding countermeasures have been well studied [16,17,18]. A downgraded version of distributed DoS attacks includes a reduction in quality (RoQ) attacks while trying to bring down the quality of service (QoS) of the network rather than completely denying service [19]. Even though several attempts have been made to protect against RoQ attacks [20,21,22], most of them can only be applied at the transport layer and not in the routing layer.
As a subcategory under the umbrella of resource depletion attacks, power-draining attacks have been widely discussed in previous studies [23,24,25,26]. In power-draining attacks, energy storage (usually battery) is naturally considered the primary target. Unlike DoS attacks that disable the immediate availability of the network, power-draining attacks intend to deplete the network’s power over a long time perspective. Several simple attempts following this attack pattern have already been evaluated [27,28,29]. An instance of the power-draining attacks, vampire attacks, target routing protocols that are adopted in WSNs [13]. Vampire attacks are not protocol-specific; in other words, even the protocols that are designed to be secure cannot be immune from them. Instead, routing protocols could be exploited. In worse cases, harmful but protocol-compliant messages can be generated by adversaries. Consequently, it is difficult to trace back the origin of these attacks and prevent them.
Very few countermeasures have been proposed to prevent vampire attacks. In [13], an upgraded version of clean-slate secure sensor network routing protocol (PLGP) [27], known as PLGPa, is presented. PLGPa relies heavily on cryptographic methods and may incur extra costs in computation and transmission. Considering the limited computing power and battery capacity of wireless sensors, solutions with better energy efficiency and less hardware overhead are worth investigating.
A summary of these aforementioned existing works are listed in Table 1.

3. General Concept and Passive Detection

The general idea of our proposed resource-conserving protection against energy draining (RCPED) protocol to prevent vampire attacks is illustrated in Figure 1. It is composed of a passive detection phase (for more details, see Section 3.1 and Section 3.2) and active detection phase (further addressed in Section 4).
This solution is designed to be cost-effective (e.g., more energy-efficient). Therefore, it would not make sense to enable the active detection of malicious nodes at the very beginning. Instead, only passive detection with less cost of resources is operating first. The passive detection integrates with the existing routing process to continually monitor the network and sense abnormal signs without additional actions. Similar to other on-demand solutions, active detection would not be triggered until abnormal network behavior is recorded by passive detection. Once active detection is enabled, it tries to trace back to the nodes that are likely to participate in vampire attack attempts. The rest of the network nodes are notified afterward to stop suspicious nodes from participating in future data communications.
The approximate energy cost of transmitting a data packet in between any specific node and a stationary observation point, denoted by E ( M ) , has a functional relationship with the number of nodes (denoted by M) in the network [30]. Once the exact function showing the relationship between E ( M ) and M is determined, we can estimate the expected average transmission cost linked to a specific node density in a normal case. Please note that the term “normal case” here refers to the condition when no attacks are occurring in the network.
On condition that the estimations mentioned above are accomplished, the transmission cost of incoming packets at the observation point can be determined by continuously monitoring data communications in the network. If the average of these tracked costs is significantly higher than that of the estimations in the “normal case,” an attack is probably occurring. This process is called passive detection since it is performed without interfering with the normal operation of the network. Passive detection is an instance of anomaly detection [31] to detect sensors’ suspicious behavior. Consequently, there are two issues to be addressed: (1) how to define the “normal case”; and (2) how to define an abnormal deviation. Details are provided below.

3.1. Defining Normal Case and Significant Deviation

Regression analysis is a classical method in statistics [32,33]. It can be utilized to determine the exact functional relationship between E ( M ) and M. With the help of experimental results provided by [30], it can be predicted that the functional relationship between E ( M ) and M is non-linear exponential:
E ( M ) = a l e b l M · ϵ , ln ϵ N 0 , σ 2
where ϵ is a normal random variable with 0 mean and variance σ 2 ; and a l , b l and σ are constant parameters independent of M.
The well-known Friis transmission equation [34] shows that energy consumption over a distance between any pair of communicating nodes is proportional to the square of that distance. If one or more relay nodes are introduced in between, energy consumption could be effectively reduced. Generally, a larger M is equivalent to higher node density, meaning more candidate nodes are available for forming a route. In this case, routes (consisting of more nodes) with better energy efficiency are more likely to be found. However, adopting these extra nodes naturally causes additional energy, which partially counteracts the energy saved from introducing these relay nodes in communications. Moreover, this is why E ( M ) in Equation (1) reveals a shape of an exponential function instead of a linear one.
The exponential form of Equation (1) suggests that the relationship can be simplified by taking the logarithm. Let ln E ( M ) = E ( M ) , ln a l = a l , b l = b l , M = M , ln ϵ = ϵ ; hence, Equation (1) can be transformed to a simplified linear regression form.
E ( M ) = a l + b l M + ϵ
The next step is to determine the estimates of a l (or a l ) and b l (or b l ), represented by a l ^ (or a l ^ ) and b l ^ (or b l ^ ), respectively, with the aid of linear regression method and the past records of E ( M ) obtained from [30].
The simulation results of [13] conclude that in a very general sense, a vampire attacker at a random location in a network with randomly generated topology can cause a significant rise in network energy consumption. More precisely, the consumption increases by a factor of 1.48 ± 0.99 when a carousel (route loop) attack is ongoing, and the number can be 2.67 ± 2.49 in the case of a stretch attack. Note that there is a significant standard deviation here owing to the unpredictable adversarial path length that can be affected by the attacker’s location in relation to the source or destination node. Higher network energy consumption is probably linked to a higher possibility of vampire attacks in operation. The extra energy cost introduced by carousel attacks and stretch attacks may rise to a factor of 3.96 and 10.5, respectively, in a worst-case scenario.
In order to detect any abnormal increment (caused by vampire attacks) discussed in the previous paragraph, it is necessary to keep tracking all incoming packets and their expected transmission cost. Once any harmful sign shows up, the active detection phase is triggered. For more details, see Section 4 and Section 5.
All incoming data packets can carry information about their journey history in the network by recording a list of nodes passed through together with their location information (for nodes localization, see Section 3.2.2). These records are essential to calculate the expected energy cost of packet transmissions mentioned in the previous paragraph (for estimation details, see Section 3.2.1). Note that the transmission cost of the location information is a bit higher than that of the regular packet; later evaluation has to consider this factor. As defined in NMEA-0183V20 standards [35], enacted by National U.S. Marine Electronics Association, a typical GPS (Global Positioning System) positioning information is 88 bytes long. However, this paper can treat most of its constituent parts (such as velocity and magnetic declination) as redundant, and only the coordinate’s information is reserved.

3.2. Practical Issues in Passive Detection

As mentioned earlier in Section 3.1, the expected transmission costs of incoming packets need to be calculated in the passive detection phase. In addition, this determination process needs location information of nodes on the route those packets have passed through. Later in this section, details on how to solve these practical issues are given.

3.2.1. Estimation of Transmission Cost on a Specific Route

On any specific route i consisting of a total number of J i nodes, the expected total energy cost in transmission E ( i ) is determined by the following [30]:
E ( i ) = E ( i , 1 ) + E ( i , 2 ) + . . . + E ( i , J i 1 )
where E ( i , m ) is the estimated transmission cost from the m-th node on this route to its next hop (m is an integer and satisfies 1 m J i 1 ). Energy cost depends on a successful packet transmission, which may need a number of retries. To be more specific, the transmission cost is written as follows:
E ( i , m ) = K ( i , m ) P ( i , m ) + P c + P r t
where K ( i , m ) is the predicted average number of retries needed for a successful packet delivery from node m to its next hop node m + 1 ; P ( i , m ) is the minimum required radio transmission power level at node m to transmit a data packet to the next hop successfully; P c is the processing power at node m (consumed by circuits on this node at the stage of preparation of radio transmission, such as coding and modulation); P r is the receiving power at next hop m + 1 (used for data receiving process, such as demodulation and decoding); and t is the transmission time needed to transmit a packet ( t = p a c k e t s i z e d a t a r a t e ).
The energy model adopted in this paper mainly refers to previous studies given in [36] that focuses on the energy efficiency issue of WSN. Therefore, P ( i , m ) can be defined by the following formula:
P ( i , m ) = β N 0 [ d ( i , m ) ] γ ln [ 1 P o u t ( i , m ) ]
where β is the signal to noise ratio (SNR) threshold, N 0 is the variance of white Gaussian noise (AWGN) since the noise components in this paper are modeled as AWGN), d ( i , m ) is the distance between node m and its next hop, γ is the path-loss exponent and P o u t ( i , m ) is the probability that the packet has not been delivered (in other words, outage probability) from node m to node m + 1 on any attempt.
Some of the nodes are assumed to have energy harvesting capability. The harvested energy from the surrounding environment is considered as free and can partially offset E ( i , m ) as follows:
E ( i , m ) = K ( i , m ) [ P ( i , m ) + P c + P r α ( i , m ) R ] t
where R is the maximum output power of the photo-voltaic power generator, and α ( i , m ) = 0 if node m is not capable for energy harvesting or α ( i , m ) is a random number defined over [ 0 , 1 ] if this node has energy harvesting capability. As mentioned earlier in Section 1, for those applications under consideration, solar cells are more practical for sensor nodes considering their acceptable size (by contrast, wind driven generator is too bulky) or energy source accessibility (by comparison, motion power is almost not available since nodes are deployed in severe environment where human or animal activities are relatively rare).
For these nodes, α ( i , m ) = R / R where R is the active power level of the photo-voltaic power generator. R is assumed to follow a β distribution defined by the following probability density function [37]:
F ( R ) = Γ ( p s h + q s h ) Γ ( p s h ) Γ ( q s h ) R R p s h 1 1 R R q s h 1
where p s h and q s h are the shape parameters of β distribution, and Γ is the Gamma function. β distributions suit the past record of sunlight data using the algorithm that minimizes the K–S statistic [38], and its shape parameters p s h and q s h depend on the specific geographic regions where these data are recorded. This assumption is also based on the past records of sunlight data and statistical correlation analysis of solar radiance together with consumer load.
According to [39], for the sake of successfully transmitting a packet from node m to its next-hop node m + 1 , the average number of retries K ( i , m ) can be predicted by the following.
K ( i , m ) = 1 1 P o u t ( i , m )
Previous research [36] suggests that P o u t ( i , m ) can be expressed as a function in P ( i , m ) .

3.2.2. Node Localisation

GPS is a most popular means to determine the location of nodes. In order to minimize overhead, most localization systems only utilize one or multiple anchor nodes equipped with GPS chips, rather than mounting GPS chips on every node [40]. These anchor nodes periodically broadcast their current position to other sensor nodes and help them to estimate their locations.
For monitoring applications that intend to operate as long as possible, battery life is the major restriction since nodes in the network are usually unreachable after being deployed. Therefore an unnecessarily high updating frequency, such as one sample per second, is pointless as monitoring lasts weeks or even months. A push-to-fix mode has been proposed for long-term operating applications [41]. It puts the GPS to sleep most of the time, and location is only updated at relatively long time intervals (such as every two hours or even more). This mode can be helpful to GPS embedded nodes. In this paper, nodes have a very low frequency in position change; therefore, a longer update time interval, such as one sample per day, is more than enough. Since each location updating process can last for up to 30 s, the energy cost of a GPS embedded node could be limited to as low as 31.08 Joule per day [41]. If normal 18650-size cylindrical lithium-ion battery cells [42] (3.3v, 1.6-Ah) are adopted, the GPS embedded nodes can operate for more than one and a half years, at a meager cost since this type of battery is mature and cheap.
As illustrated in Figure 2, the trilateration approach [43] based on the received signal strength is the most suitable for node localization in WSNs thanks to its implementation simplicity and low hardware requirement. The fundamental idea is as follows: the locations of anchor nodes are broadcasted periodically and the nodes that need to be located can exploit this information to estimate the distance from anchor nodes by measuring the received signal strength (RSS). Suppose the coordinates of anchor nodes 1, 2 and 3 are ( x 1 , y 1 ) , ( x 2 , y 2 ) and ( x 3 , y 3 ) , the coordinates of the node location to be determined is ( x 0 , y 0 ) , and the distances between three anchor nodes to this node are d 1 , d 2 , d 3 . ( x 1 , y 1 ) , ( x 2 , y 2 ) and ( x 3 , y 3 ) and are set as centres. Three circles are drawn with radius d 1 , d 2 and d 3 , respectively. These three circles are supposed to intersect at ( x 0 , y 0 ) , which can be determined by solving the equation set as follows.
( x 1 x 0 ) 2 + ( y 1 y 0 ) 2 = d 1 2 ( x 2 x 0 ) 2 + ( y 2 y 0 ) 2 = d 2 2 ( x 3 x 0 ) 2 + ( y 3 y 0 ) 2 = d 3 2
Similarly to any localization method, the trilateration approach cannot be 100% accurate. Its accuracy may suffer from distance estimations errors. To mitigate the effect of these errors, a very straightforward solution is to extend the trilateration method to the multilateration technique, which is to determine the intersection of circles centered at more than three reference positions (anchor nodes). Other efforts have been made as well, such as the authors in [44] who proposed three cluster methods to deal with the problem of no intersection point. Moreover, least-squares (LS) optimization [45] can be used to minimize the gap between actual distances and estimated distances.

4. Active Detection

This section expounds on the details of active detection. Passive detection is helpful in detecting network-level misbehavior, but note that the ultimate purpose is to mitigate the negative effect brought by attackers. Active detection investigates suspicions bt selective testing to identify with confidence which nodes might be compromised. Active detection requires more analysis and calculations (in other words, more resource consuming) than passive detection; hence, similar to any on-demand solution, it remains inactive most of the time unless a suspicious sign is detected by passive detection.

4.1. Detection of Suspicious Routes

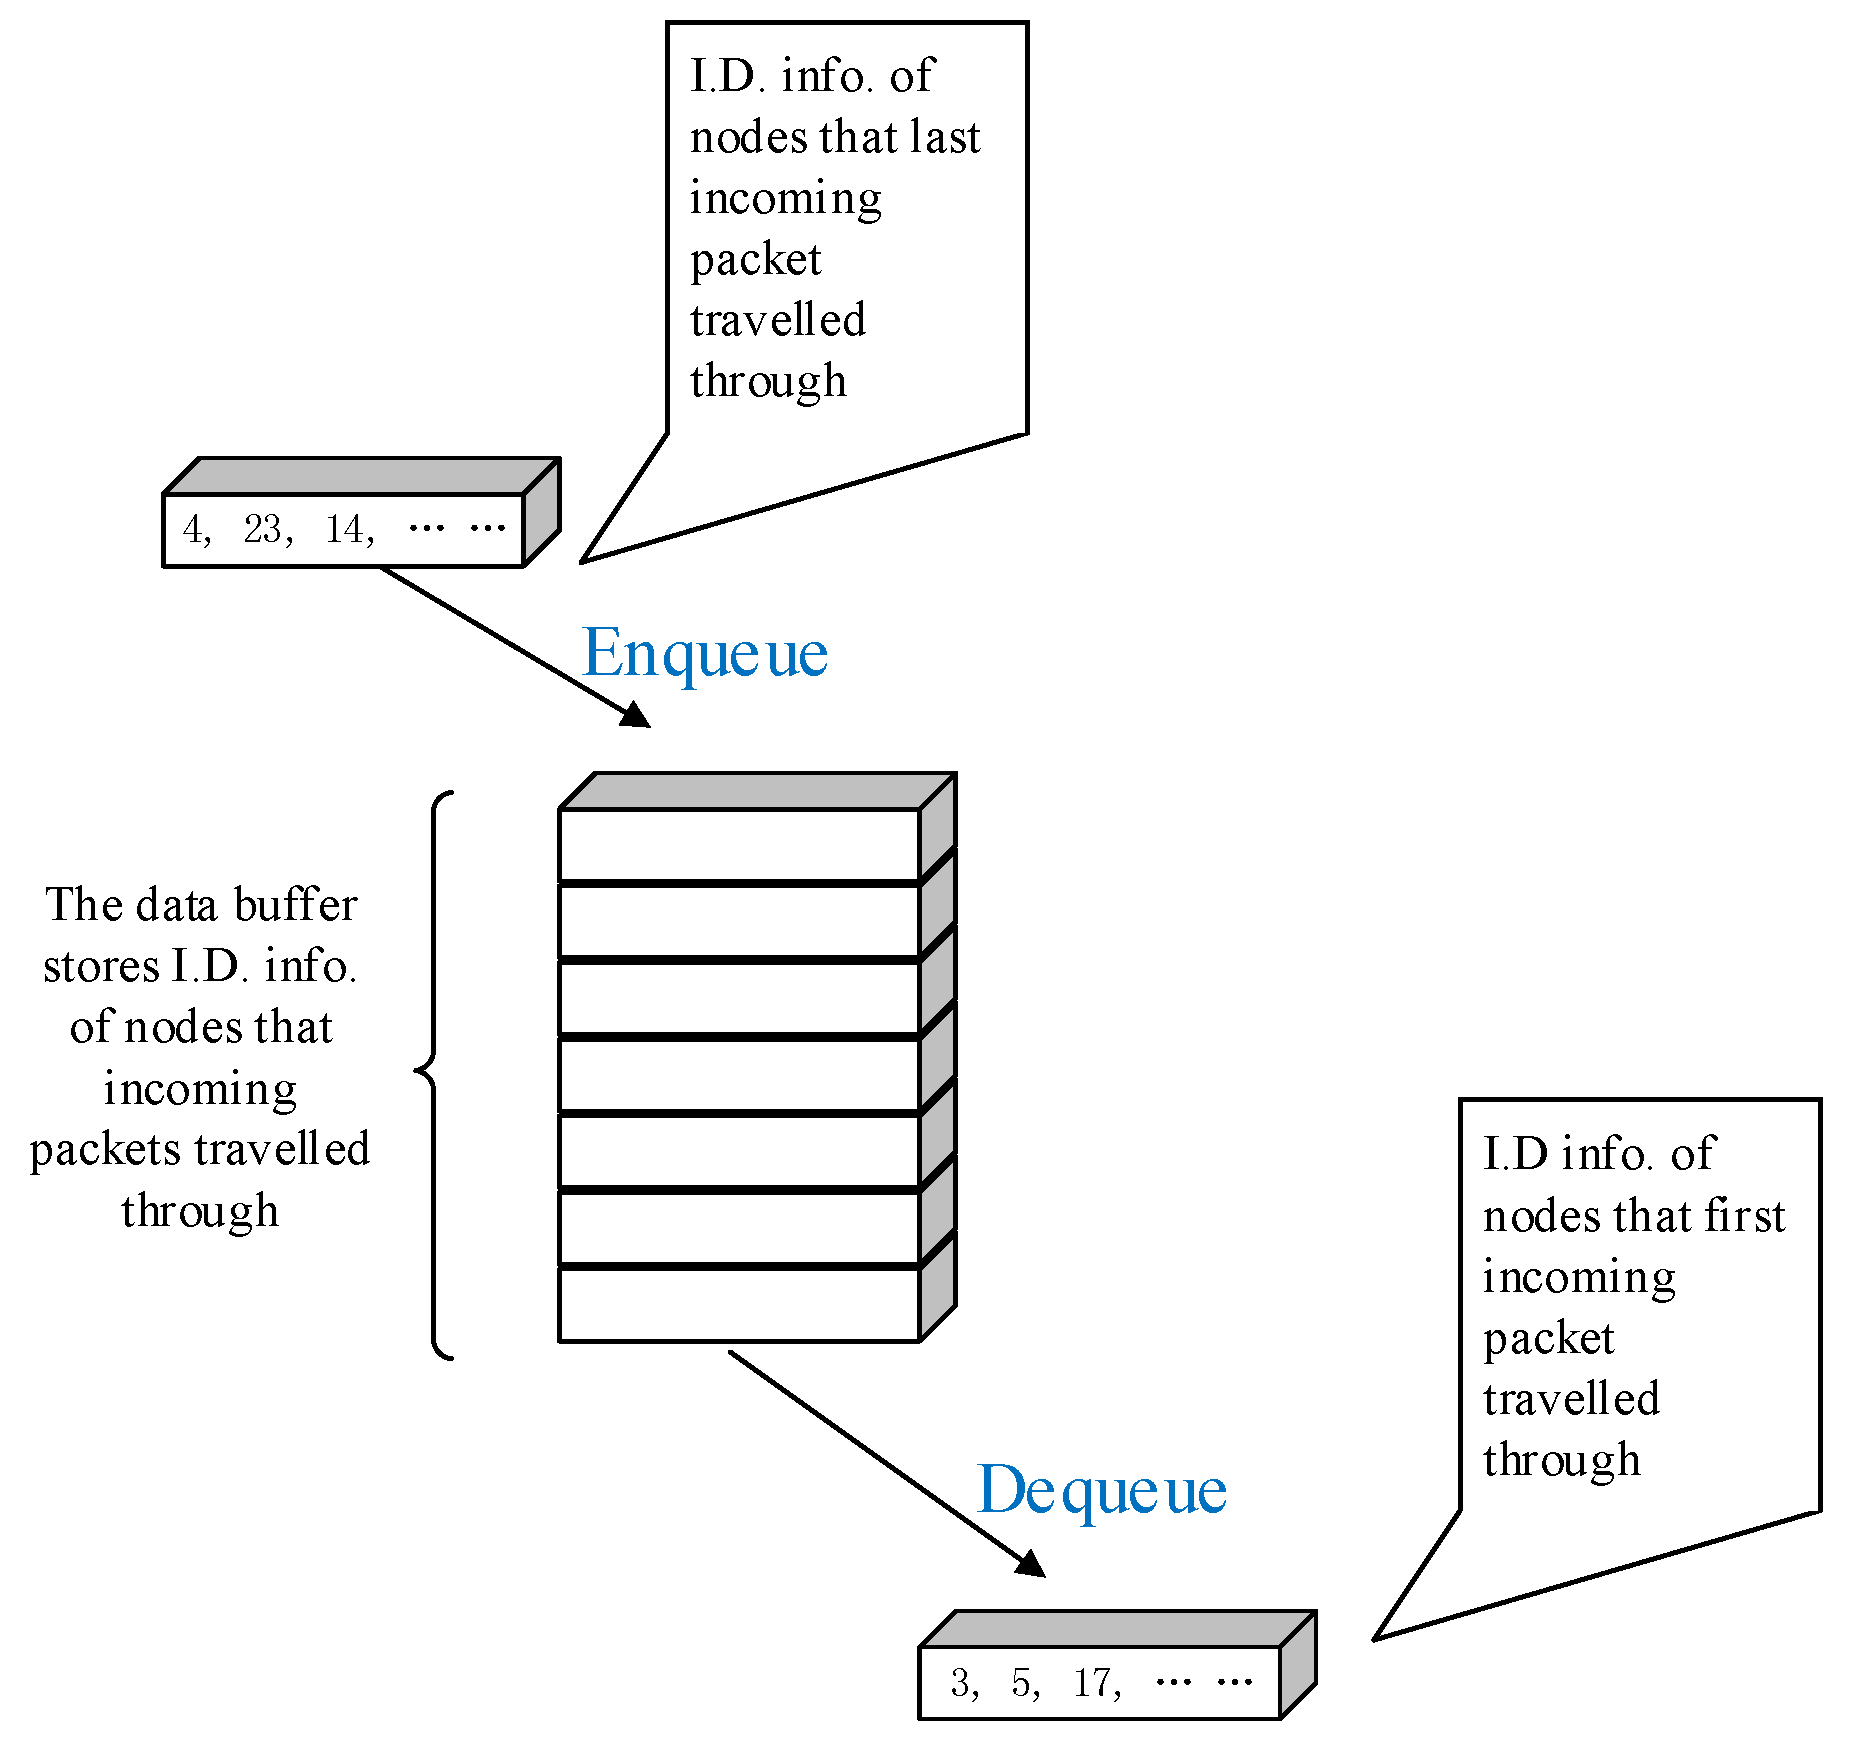
Once active detection is triggered in the network, route records (nodes identities are involved, such as nodes number) of future incoming data packets are stored in a buffer at observation points. This information is recorded in a fixed-sized data buffer operating in FIFO (first-in-first-out) manner, as shown in Figure 3. Information associated with the first packet will be the first to be removed once the buffer is full.
Ideally, an observation point intends to acquire transmission records from every node in the network at least once, which means all possible routes have been tested. We can keep as many records as possible if the data buffer is large enough, and records from every node can be obtained at the end of the day. However, in practice, the storage available for data buffer is limited. Under the assumption that sufficient records are likely to be acquired, the data buffer’s size is preferably as small as possible.
In order to determine the minimum necessary buffer size, the following event is defined: Every node in the network has transmitted data to an observation point at least once. Suppose after k t transmissions are exercised (meaning k t transmission records are stored in the buffer), this event is satisfied at the probability of P e ; thus, the probability of its complementary event (transmission from a specific node has never been recorded) is no more than ( 1 P e ) :
M 1 M k t 1 P e
where M is the number of nodes in the network, and M 1 M is the probability that the transmission record of any specific node has not been acquired (under the assumption that the probability of any node in the network communicating with observation point is identical); hence, k t has to satisfy the following.
k t log ( 1 P e ) log M 1 M
Therefore, the minimum necessary size of the buffer is log 0.01 log M 1 M , where   refers to ceiling function. Take an example, assume P e = 0.99 , nodes number is M = 50 and the minimum necessary data buffer size is supposed to be log 0.01 log 50 1 50 = 228.
Inspired by the route rebuilding concept proposed by author of [46], suppose all information of suspicious routes found in buffer is denoted by B 1 , B 2 , . . . , B N b , where N b refers to the total number of detected suspicious routes. Therefore, a comprehensive vector B can be constructed as follows:
B = [ B 1 , B 2 , . . . , B N b ]
any specific row in B is further defined as B V = { V m : 1 m | B V | } ( | | refers to the number of elements in this set), where V m represents each node on route B V and V is an integer that satisfies 1 V N b .
It is worth noting that records in the data buffer are not static. As data transmissions are occurring, the data buffer constantly updates itself. Thus, B , extracted from the data buffer, is a “live” vector and renews itself actively as time goes by.

4.2. Detection of Route Loop Attackers (Carousel Attackers)

If there is no existing route loop, a specific packet is supposed to travel through every node on the route only once. A route loop has probably been formulated if a node repeatedly appears in a single route B V . Those nodes are labeled as problematic nodes and need further investigation (for more details, see Section 5.1).
Note that this type of label is not constant. As mentioned in Section 4.1, B is updating itself constantly; thus, the label on a node may vary from time to time.

4.3. Detection of Route Stretch Attackers

If a node does not repeatedly appear in a single line in B but more than once in multiple B V instead, it is highly likely that this node has been part of a stretched route. It is then labeled as a suspicious node and investigated further (for more details, see Section 5.1).
As already been mentioned in Section 4.2, these labels are not static since B is updating itself all the time.

5. Protection Against Vampire Attacks in Routing

As demonstrated in Figure 1 of Section 3, security related data acquired from Section 4 are supposed to be fed back to route discovery so as to reduce the damage caused by malicious nodes.

5.1. Monitoring Information Aggregation Utilizing Bayesian Network

Based on information collected from the detection mentioned above, it is possible and necessary to calculate “faith” about a suspicious node’s trustworthiness. Since the suspicious nodes might be part of a carousel attack or stretch attack, or even both (with more than one suspicious behavior), here we introduce a Bayesian learning network to aggregate and further analyze gathered information. A Bayesian network is a probabilistic graphical model representing a set of random variables and their conditional dependencies (represented by conditional probabilities), exhibited by a directed acyclic graph (DAG).
Our Bayesian network contributes to modeling a set of nodes in terms of their status (comprised or not) and behaviors. It can be utilized to predict the most likely status of a node based on past observation records of its behaviors.
In order to calculate this prediction, one method is the maximum likelihood approach. It is the learning process of the Bayesian network from data collected. These data can be used to estimate a Bayesian network’s parameters that can denote the status of the nodes. Note that the datasets do not have to be complete, as we usually obtain incomplete ones from real networks. This approach is based on the likelihood principle, which favors the predictions (or estimates) with maximal likelihood. In other words, it prefers predictions maximizing the probability of observing the collected datasets [47].
Naturally, alternatives are available to this learning process, such as the Bayesian approach or constraint-based approach. They are capable but either require more input or have additional constraints [47].
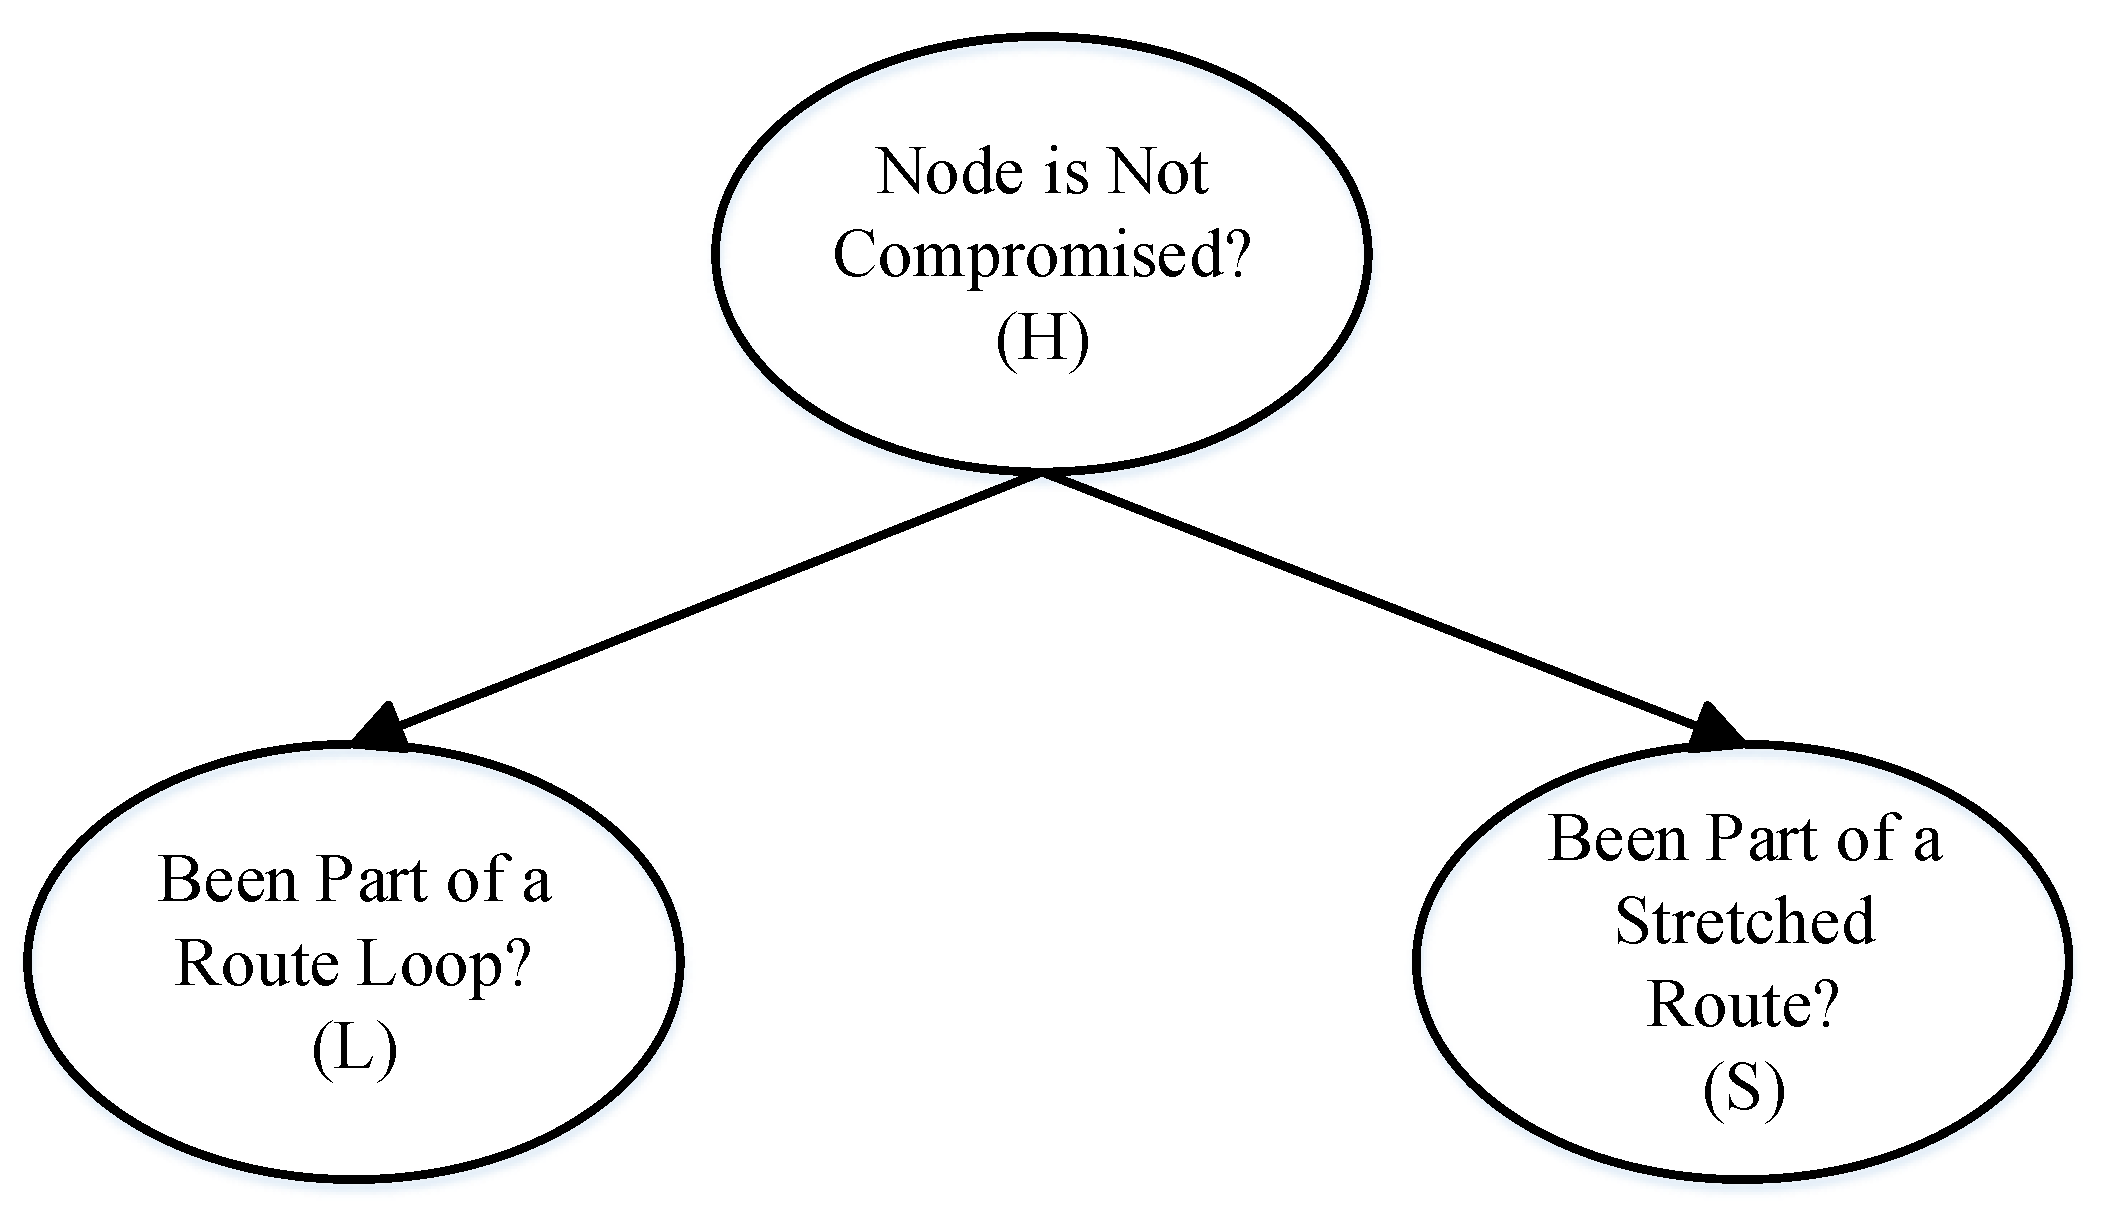
The practical Bayesian network employed in this paper is illustrated in Figure 4. It is aimed to examine a node’s “health” status (compromised or not), denoted by variable H. Two symptoms are considered here: one is “node is part of a route loop” (denoted by variable L), and another is “route is part of a stretched route” (denoted by variable S). These variables are binary, represented by T (true) or F (false) for those pre-defined variables H, L and S.
Figure 4 only shows a visualized structure, the details on learning for information aggregation is given as follows: Table 2 shows an example of incomplete datasets D that have three different recorded data cases: observation 1 , observation 2 and observation 3 . A data case refers to a record of a set of symptoms exhibited by a node, in other words, a record with a certain combination of instantiation (h, l and s), where symptom parameters ( h , l , s ) = ( T , T , T ) denote that this node has not been compromised and are used to participate in a route loop formulation and a stretched route before, respectively. Furthermore, ( h , l , s ) = ( F , F , F ) denote that this node has been compromised and not used to participate in any route loop as well as stretched route before, respectively. The symbol “?” here denotes the undetermined values of variables.
The goal is to calculate the expected empirical distribution of nodes status H based on the incomplete dataset. Table 3 demonstrates assumptions of some initial estimates based on common sense; for instance, a compromised node is more likely to have participated in the formulation of a route loop or stretched route in the previous routing discovery process.
The expected empirical distribution of an incomplete dataset D is defined as follows:
F D α t = def 1 N d s observation i , c i = α t F c i | observation i
where α t is an event consists of certain combination of instantiations ( h , l , s ) , N d s is the size of data set and c i are variables with undetermined values of case observation i .
For instance, the probability of an instantiation ( h , l , s ) = ( T , F , T ) (means this node is not compromised, has not been part of route loop and has participated in formulating a stretched route in previous routing discovery) is given by the following.
F D h = T , l = F , s = T = F h = T | observation 1 3
This process is repeatable; given sufficient retries, the probability of all the other instantiations h , l , s can be eventually obtained.
Then, the expectation–maximization estimate of a node that has not been compromised can be written by the following:
F D h = T = l , s F h = T , l , s
where l and s refer to all possible values of l and s, respectively. Other parameters, such as F D l | h and F D s | h , are determined by the following.
F D l | h = F D h , l F D h
F D s | h = F D h , s F D h
All the outcomes derived from (13), (16) and (17) based on incomplete datasets D constitute D estimates that are set to replace the initial estimates illustrated in Table 3.
As has been mentioned in Section 4.2, B is an “live” vector and updating itself all the time. Hence, we can keep watching the nodes symptoms from B and acquiring new incomplete datasets periodically: D 1 , D 2 D m (m is a positive integer). If we keep accessing new data from B , then we are always able to obtain estimates with higher likelihood [47].

5.2. Security Information Distribution

As previously mentioned, security information, calculated from Section 5.1 (used to determine which nodes are likely to be compromised, together with the probabilities of being compromised) has to be distributed to the nodes in the network for the sake of safer route discovery. For better energy efficiency, security-related information is passed to certain “cluster heads” in the first place and then broadcast to surrounding nodes [48], rather than directly flooding them through the entire network. Nodes in the network can then take advantage of this information to select the routes without malicious nodes. In our case, the anchor nodes, which have already been utilized for nodes localization (for more details, see Section 3.2), preferably become “cluster heads” that can be employed to distribute security-related information, since they are as follows:
  • Less vulnerable than other normal nodes in the network, since they do not directly participate in data transmissions (in other words, output only);
  • More economical (in terms of both energy and cost) since they have already been deployed in the network, and adding some non-heavy duty task to them is preferable to deploy additional nodes for information distribution.

5.3. Route Discovery Based on AHP

Once security information has been distributed around the network, the step that comes next is to exploit this information to discover the optimal routes with the help of the analytic hierarchy process (AHP) [49]. AHP is one of the many choices of multi-criteria decision analysis (MCDA) methods, which are initially developed to help make optimal decisions (in this paper, this decision is about picking the best route) while taking multiple concerns (for example, energy efficiency and security) into consideration. There are many candidates other than AHP, but none of them, even AHP itself, are perfect and cannot be applied to every problem.
The “utility function” (see more details in [50]) of each route, defined in this paper, is hard to construct since vampire attackers still deliver the packets eventually. Hence, in a sense, the energy consumed by attackers cannot be treated as “entirely” wasted. Furthermore, as earlier mentioned in Section 3.1, the extra energy consumed by vampire attacks is associated with a series of random parameters, its volume varies a lot and the exact number is difficult to determine, making it even more difficult for us to construct the utility function. The authors of [49] suggest that AHP is particularly helpful when a decision maker is having problems in constructing a utility function.
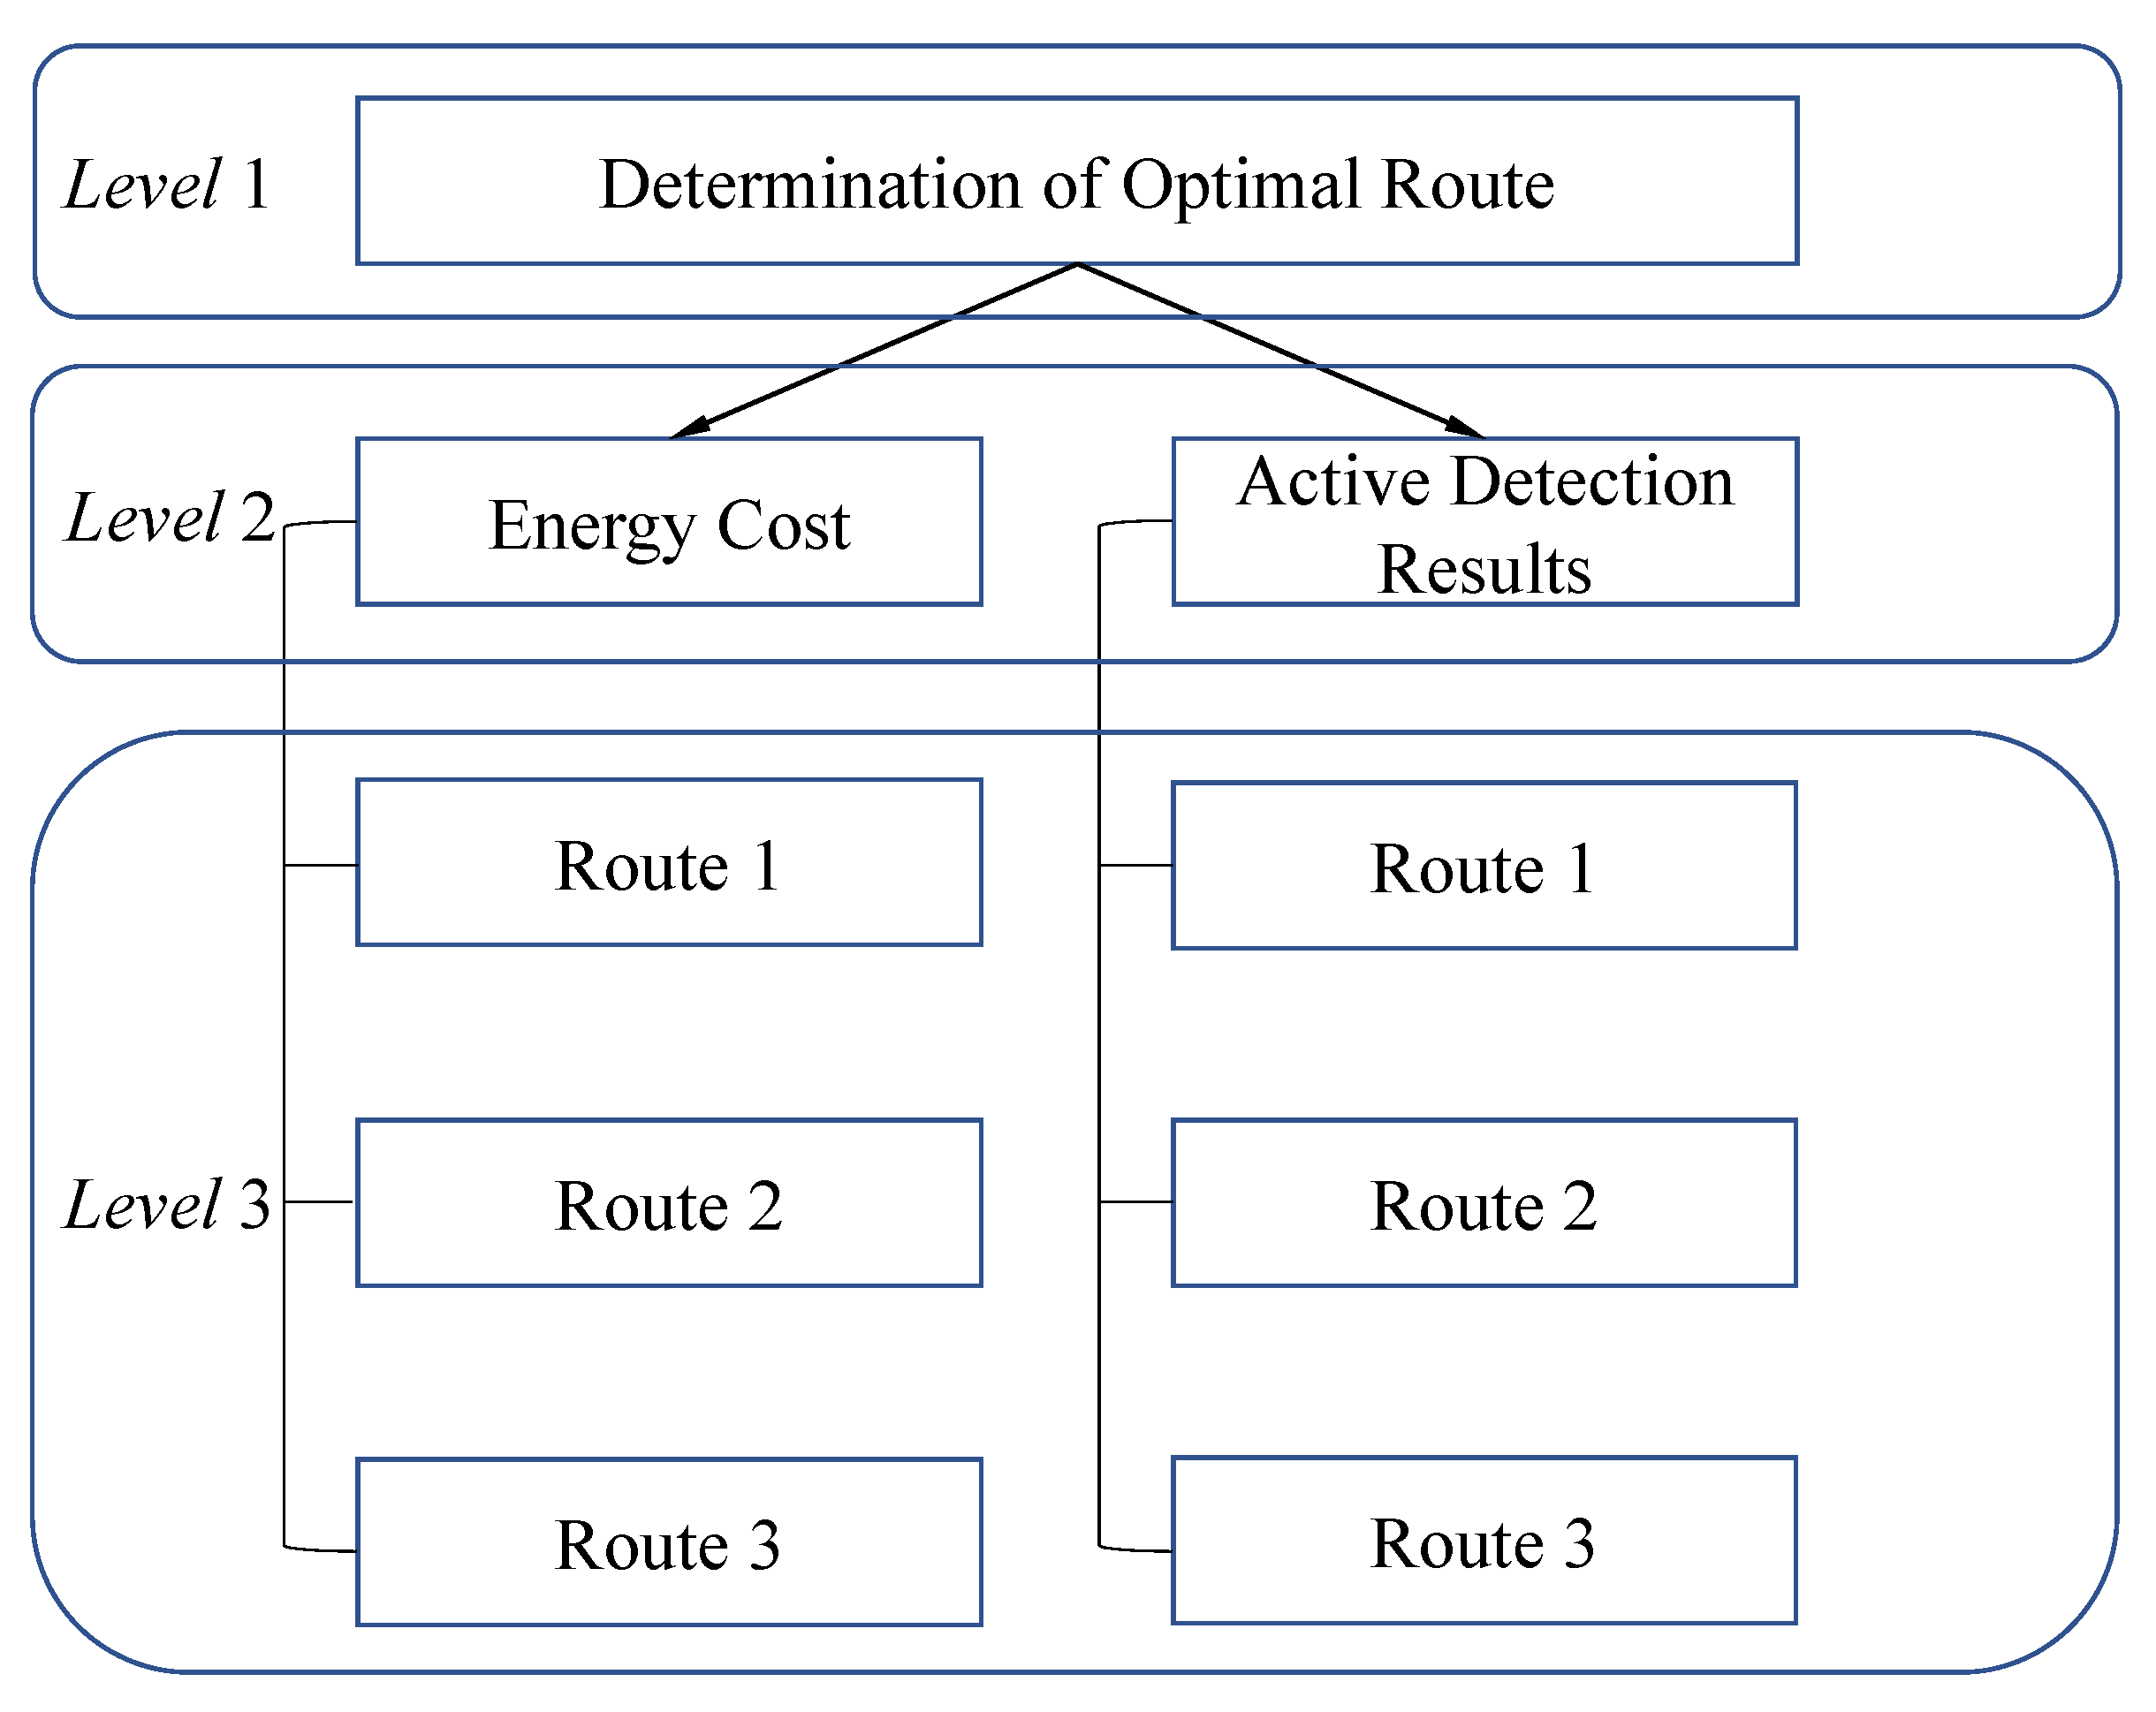
As shown in Figure 5, we can then set a goal of figuring out the optimal route based on multiple criteria. The top-level in the figure is the goal of the decision, the second level of the hierarchy addresses the criteria under consideration, the lowest level shows the available choices (in this paper, they are all the possible routes). Afterward, the scores (or so-called priorities) of different possible routes can be determined based on pairwise comparisons between different criteria preset by a decision maker.

5.4. Details of AHP

In AHP, pairwise comparisons are made between different criteria. Hence, the setup of ratio scales is necessary. The judgement is a relative value or a quotient w 1 / w 2 of two quantities w 1 and w 2 (in this paper, w 1 and w 2 refers to security concern and energy efficiency concern, respectively). In other words, these relative values (or ratio scales) represent the priority (importance) of each criterion.
The most straightforward linear priority setup proposed by authors of [51] is shown in Table 4. In a general sense, a human being cannot simultaneously compare more than 7 (±2) subjects [52]. For example, a common man or woman cannot assign importance to more than 7 ( ± 2 ) items properly, and this is the limit of human ability when processing information. To avoid confusion, we chose 7 + 2 = 9 degrees in this paper.
Table 5 also provides other choices of priority setup. All these alternatives are constructed based on psychophysics theory. The validity of each one in the decision-making process is commonly evaluated in practical experiments. Therefore, the question of which scale has the best performance may spark many debates. Nevertheless, precious experiments results reveal that all of them overcome the essential linear one [53,54,55].
Let us take a simple example: Consider two routes evaluated based on two criteria, namely, the energy efficiency and safety level. Note that security concern is twice as important as the energy efficiency. Assume Route 2 is set at 2.5 times as safe as Route 1, but has a transmission cost that is doubled than that of Route 1. Moreover, we can compare two routes on the following ratio scale.
Route 2 Route 1 = 2 · 100 % 40 % + 50 % 100 % = 5.5
Therefore, it can be concluded that Route 2 is 5.5 times as good as Route 1.
A different way of putting it is by using an interval scale as employed below.
Route 2 Route 1 = 2 · ( 100 % 40 % ) + ( 50 % 100 % ) = 0.7
It comes to the same conclusion that Route 2 is the better one.
Verbal comparisons must be converted to numerical ones in the derivation of priorities of each route; for more details, see Section 5.5.

5.5. Priority Calculation in Optimal Route Determination

Assume, on any specific i-th route that involves a total number of J i nodes, that the expected total priority P y ( i ) of this route can be determined by the following:
P y ( i ) = P y ( i , 1 ) + P y ( i , 2 ) + . . . + P y ( i , J i 1 ) )
where P y ( i , m ) refers to the priority from the m-th node on this route to its next hop ( 1 m J i 1 ).
A “standard next-hop” is defined in advance to offer fair judgment to different routes: the next-hop node is 100% not compromised; the distance to the next-hop node is the maximum radio range of the node; and the energy cost after a packet is successfully delivered to its next-hop node is represented by E s t .
Resembling the example previously given in Section 5.4, the “relative” priority on each hop compared to that of a pre-defined ’standard next hop’ is calculated as follows:
P y ( i , m ) = P e y ( i , m ) + I s · P s y ( i , m )
where P e y ( i , m ) is the priority (importance) of energy efficiency and is inversely proportional to the normalised expected transmission cost with respect to E s t . For details on how to estimate transmission costs, see Section 3.2.1.
Analogously, P s y ( i , m ) refers to the priority (importance) of security concerns, it is proportional to the possibility that the next hop node is not compromised (for more details, see Equation (15) in Section 5.1). I s refers to the corresponding scale of security concern priority, meaning that security concern is set to I s times as important as the energy efficiency concern. The exact number of I s can be selected among various available options in Table 5.

5.6. Optimal Route Determination

The optimal route is supposed to be with the maximum P y interpreted as the safest route while limiting energy consumption as much as possible.
Actual route discovery can be performed by means of existing routing protocols such as AODV, with minimal possible changes in control messages such as RREQs and RREPs.
To be more specific, the field “hop count” is set to be replaced with the corresponding “priority volume count.” In RREQs, the “priority volume count” refers to the total priority volume of the route from the originating node to the node that is dealing with this route request. In RREPs, “priority volume count” is the priority volume of the route from originating node to destination node. Note that there is another minor modification: AODV picks the route with minimum hops, while the optimal route here is the one with maximum priority volume.

6. Simulation Results

6.1. Theoretical Definition of Performance

As addressed in [13], when routing a packet in any multihop network, energy resources are consumed not only on the source node but also on every node the packet moves through. Every node along any message path is affected when vampire attacks take effect. Therefore, the performance is evaluated in terms of average end to end transmission cost, which is defined by the following:
E a v g = E t o t a l N u m t r
where E t o t a l is the total energy cost of all the transmissions in the simulation of this scenario, and N u m t r is the number of the transmissions exercised. Note that this metric does not only represent energy efficiency performance but also is an indicator of safety and latency performance; reasons are later provided in Section 6.6.2 and Section 6.6.3. As an effort that is trying to imitate the realistic scenario, in every simulation scenario, a large number of data packet transmissions are carried out, and each transmission originates from a randomly picked source node to another randomly picked destination node.
Later in this section, the performances of the RCPED routing protocol together with its selected competitors are analyzed. The first competing protocol for comparison is PLGPa, which is keen on mitigating the negative effect of vampire attacks employing a cryptographic approach. The other one for comparison is AODV-EHA, an energy-efficient routing protocol considering energy harvesting [30].

6.2. Theoretical Computational Complexities

As addressed in [13], assuming that 8-bit processors are adopted, the cryptographic computation required for PLGPa can bring up a factor of 30 performance penalty, compared to the ones (such as RCPED) without encryptions. The performance penalty appears in the form of extra energy consumed by cryptographic computations.

6.3. Overview of PLGPa

PLGP is a clean-slate secure sensor network routing protocol proposed by Parno et al. [27]. It consists of two stages: topology discovery and packet forwarding. In the first stage, all nodes are organized in a tree, which can be further utilized for addressing and routing. In the second stage, once transmission is initiated, each node chooses the node with maximum “logical distance” (calculated by the tree mentioned above in the first stage) from the source node as the next hop, and this process is intended to guarantee that the next hop is most near to the destination node (in other words, this stage tries to shorten the logical distance to the destination node as much as possible). PLGPa [13], a modified version of PLGP, can provide an additional feature called “no-backtracking.” PLGPa can resist vampire attacks with the price of additional energy consumption in encryption.

6.4. Overview of AODV-EHA

In route discoveries of AODV-EHA [30], the expectations of data transmission cost (in terms of energy) are computed for all routes while considering energy harvesting technology. The route with the least energy cost approximation is chosen for data transmission. In any specific route, let E m represent the estimation of energy cost after a data packet travels from the m-th node to its next hop is successfully delivered, and then total energy cost of the entire route, represented by E r o u t e , is as follows.
E r o u t e = m E m
AODV-EHA is an improved version of the AODV protocol involving the aforementioned energy cost estimation. This means that AODV-EHA chooses the most energy-efficient route with the minimum E r o u t e .

6.5. Simulation Setup

The experimental evaluations are performed on MATLAB environment using the Monte-Carlo method. The overall cost, in which safety performance, average route length and energy efficiency performance are involved, is set as the criteria.
The simulated area has a dimension of 500 m × 500 m, while the radio range of each node inside is set as 250 m. By taking the nominated WSN applications in this paper into consideration, IEEE 802.15.4 is adopted for the physical and data link layer, as it is initially designed for applications with low data rate but very long battery life [56]. In addition, CSMA/CA (Carrier Sense Multiple Access with Collision Avoidance) is adopted as a Media Access Control (MAC) protocol, as defined by 802.15.4 standards. Based on specifications addressed in [56], the traffic type is set as CBR (constant bit rate) at a data rate of 20 Kbps, and the length of each packet is set as 127 Bytes. Since the prediction of transmission cost is partly dependent on previous research [36], the same values of those parameters required for the prediction process are retained as previously adopted in [36]. For more details, see Table 6.
In every simulation, regular nodes are assumed to be mixed up with a certain fraction of malicious nodes. These compromised nodes are randomly placed in the simulation area, and they have certain preset behaviors that may further impact the route discovery process.
The destination node is set as stationary, which suits the scenario in surveillance applications (such as enemy detection or environment monitoring). The engineer stays at a fixed site where the WSN is deployed and gathers data from the nodes. Nodes number varies from 60 to 200.

6.6. Experimental Results

Figure 6 shows how routes are discovered differently by PLGPa, AODV-EHA and RCPED, receptively, in a particular network consisting of 30 nodes. Normal nodes are marked with dark circles, while red stars represent compromised nodes. PLGPa intends to find the shortest route, as encryption is utilized to tackle malicious behavior of any compromised node, and it does not have to bypass compromised nodes intentionally. AODV-EHA looks for the most energy-efficient route while assuming all nodes are honest, and the selected route may likely contain some malicious nodes. As previously mentioned in this paper, RCPED is designed initially to bypass nodes that are not “clean” while trying to minimize the energy cost by selecting the relatively energy-efficient routes simultaneously.

6.6.1. Energy Efficiency Performance

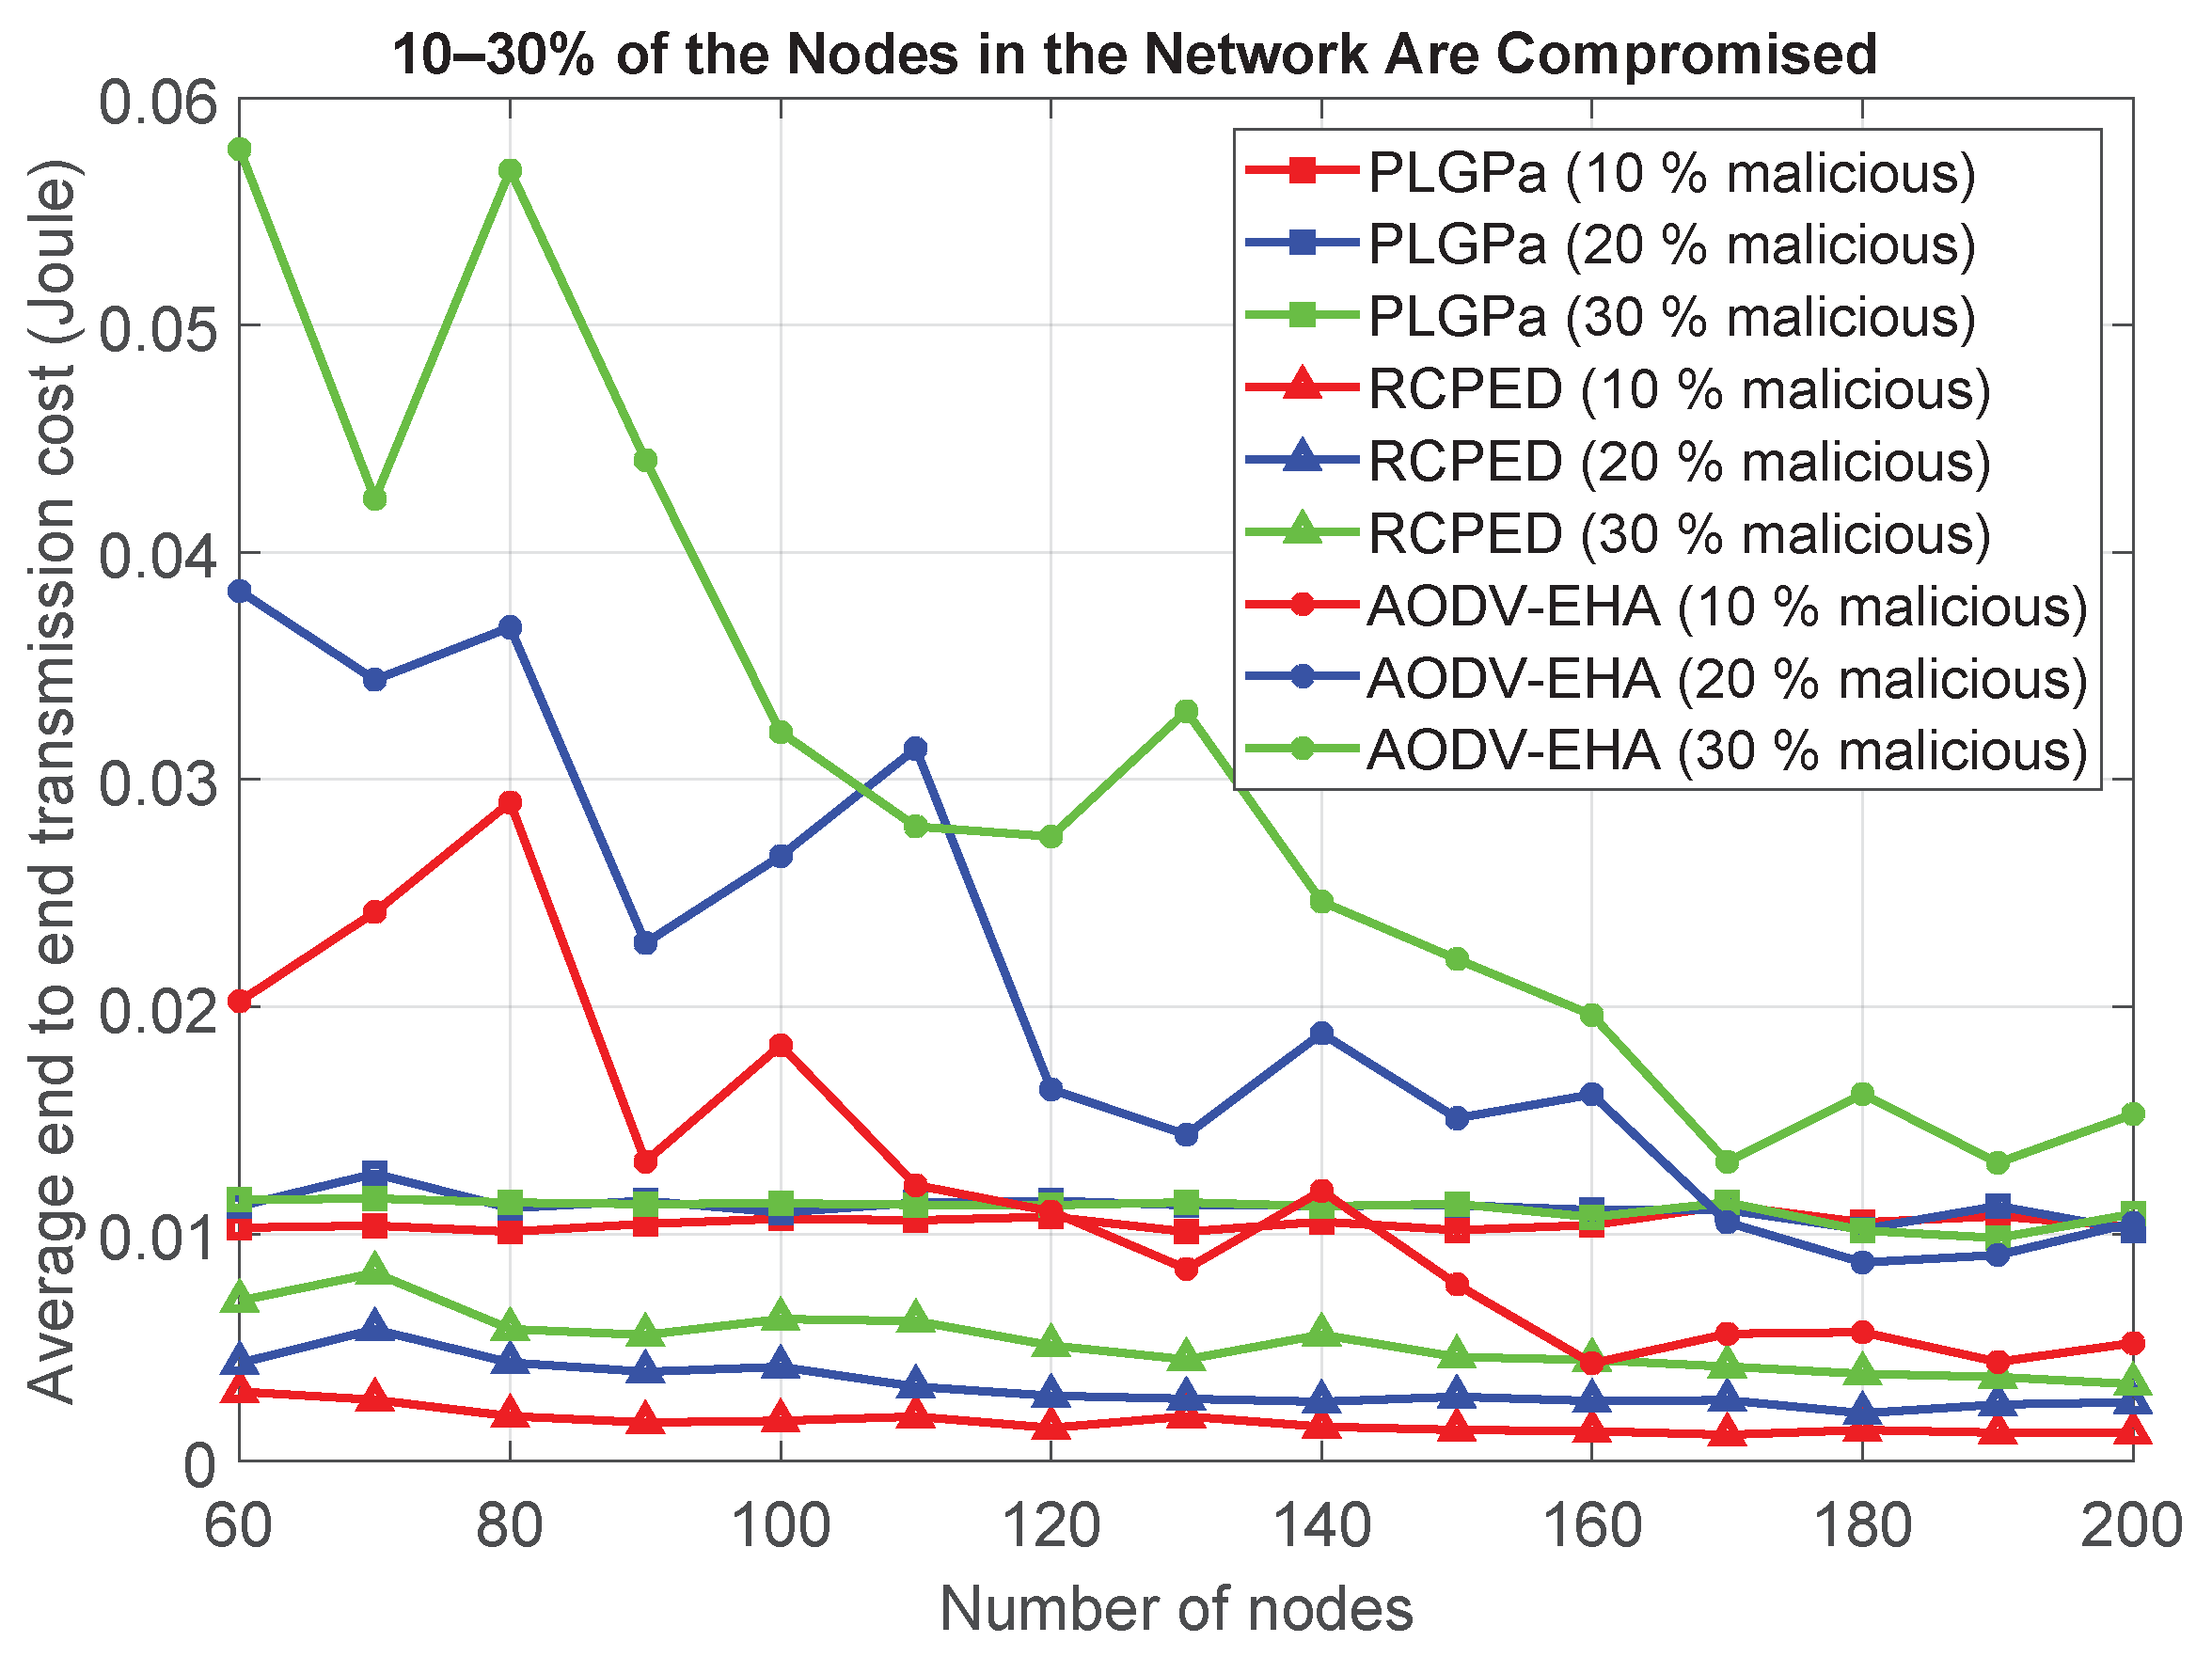
Figure 7 show the average energy cost of each transmission (from an arbitrary node to the observation point) at different malicious ratios ranging from 10–30%.
Remark 1.
The number of compromised nodes in the network is closely related to the attacker’s subjective intention of paralyzing the network, and in some sense, it is unpredictable. The authors in [57] figured out that, for an unspecific (unknown) type of attack against WSNs, if no more than 20% of the nodes are malicious, the attack can be detected and confined, which is due to the fact that the great majority of nodes are still behaving properly and it is not complicated to distinguish misbehaving ones. In some other research studying the security of WSNs, the numbers of malicious nodes in their simulations are usually assumed to be 1–30% of the total number of sensor nodes in the network [58,59,60].
At a malicious ratio of 10%, it can be observed that both lines of RCPED and PLGPa fluctuate per number of nodes in the network. Notably, RCPED consistently has less average transmission cost than PLGPa because RCPED requires no additional hardware (means no extra energy consumption) to ensure security. Compared to PLGPa, the energy cost reduced by RCPED can hit values up to 87.93%. The average transmission cost of AODV-EHA tends to drop as the number of nodes goes up, even if it indeed fluctuates dramatically. The cost seems to be less than that of PLGPa when nodes number in the network exceeds a certain value (130 or higher), this is due to the increment of nodes density that offers more choices of nodes, and a route with better energy efficiency is more likely to be found. Even though compromised nodes are occasionally included on the route (this is the cause of violent fluctuation in the green line), the damage can still be offset to some extent. Therefore, when the choices of nodes are more than enough (exceeding 130), the compensation can be sufficient to make AODV-EHA provide better performance than that of PLGPa.
When malicious ratio rises to 20%, even though RCPED has the least average transmission cost, its relative advantage over PLGPa begins to weaken, and this is because as the malicious ratio rises, it becomes more difficult for RCPED to remove compromised nodes in route discovery. The aforementioned saved energy brought by the independence of additional hardware could be partially counteracted to some extent. The tendency of AODV-EHA keeps still at a malicious ratio at 10%, but the transmission cost appears to be less than PLGPa only after node number exceeds 170, which is more than a node number of 130 at a malicious ratio of 10%. It attributes to the fact that a larger malicious ratio makes it more likely for AODV-EHA to encounter compromised nodes in route discovery. Hence, the aforementioned energy compensation brought by the increment in choices of nodes is partially offset.
As the malicious ratio reaches up to 30%, energy cost reduced by RCPED compared to PLGPa continues to decrease and sometimes can be as low as 28.34%. AODV-EHA retains the same line tendency similarly to what was previously shown at malicious ratios at 10% and 20%, but its performance never surmount PLGPa in the provided nodes number ranged from 60 to 200. The reason is that as the malicious ratio continues to drop, it becomes increasingly difficult for protocols that are without cryptographic encryption (for example, RCPED and AODV-EHA) to eliminate the damage reflected as extra energy cost (caused by malicious nodes). By contrast, the performances of PLGPa are relatively stable regardless of the malicious ratio since it is equipped with cryptography.
Based on all the above results gathered from overall energy cost performance evaluations, it can be concluded that RCPED has advantages in terms of overall energy cost in transmissions under different malicious ratios. However, the relative advantage over PLGPa tends to decrease as the malicious ratio of the network climbs.

6.6.2. Security Performance

Since all the damage that comes with vampire attacks is reflected in increased energy consumption, “security performance” is then naturally converted to part of energy efficiency performance under a specific malicious ratio in overall performance evaluation. Thus, the overall cost is a comprehensive “energy overhead.” Both estimated energy costs after successfully delivering a data packet and the extra energy consumption caused by vampire attacks in this transmission along the route discovered by a specific routing protocol are inclusive. That is to say that higher energy consumption is linked to longer average route length in data transmission. The overall cost, in other words, the so-called comprehensive “energy overhead”, as aforementioned, can be regarded as an indicator of security level as well. That is to say that higher energy overhead is linked with less security level, and lower energy overhead means higher security level. Consequently, earlier in Section 6.6.1, it has already presented an overall performance evaluation that involves both energy efficiency and safety performance.

6.6.3. Average Route Length

If vampire attacks take effect, routes are more likely to be unnecessarily longer than usual and cause more energy consumption. Therefore the evaluation of “average route length” can be, quite sensibly, converted to part of average energy cost evaluation given a specific malicious ratio. In other words, higher energy consumption is associated with a longer average route length in data transmissions. As a result, the previously mentioned overall energy cost (comprehensive “energy overhead”) can be treated as an indicator of average route length. Hence, the front part of Section 6.6.1 has already provided an overall performance evaluation where both energy efficiency and average route length are involved.

6.6.4. Effect of Buffer Size

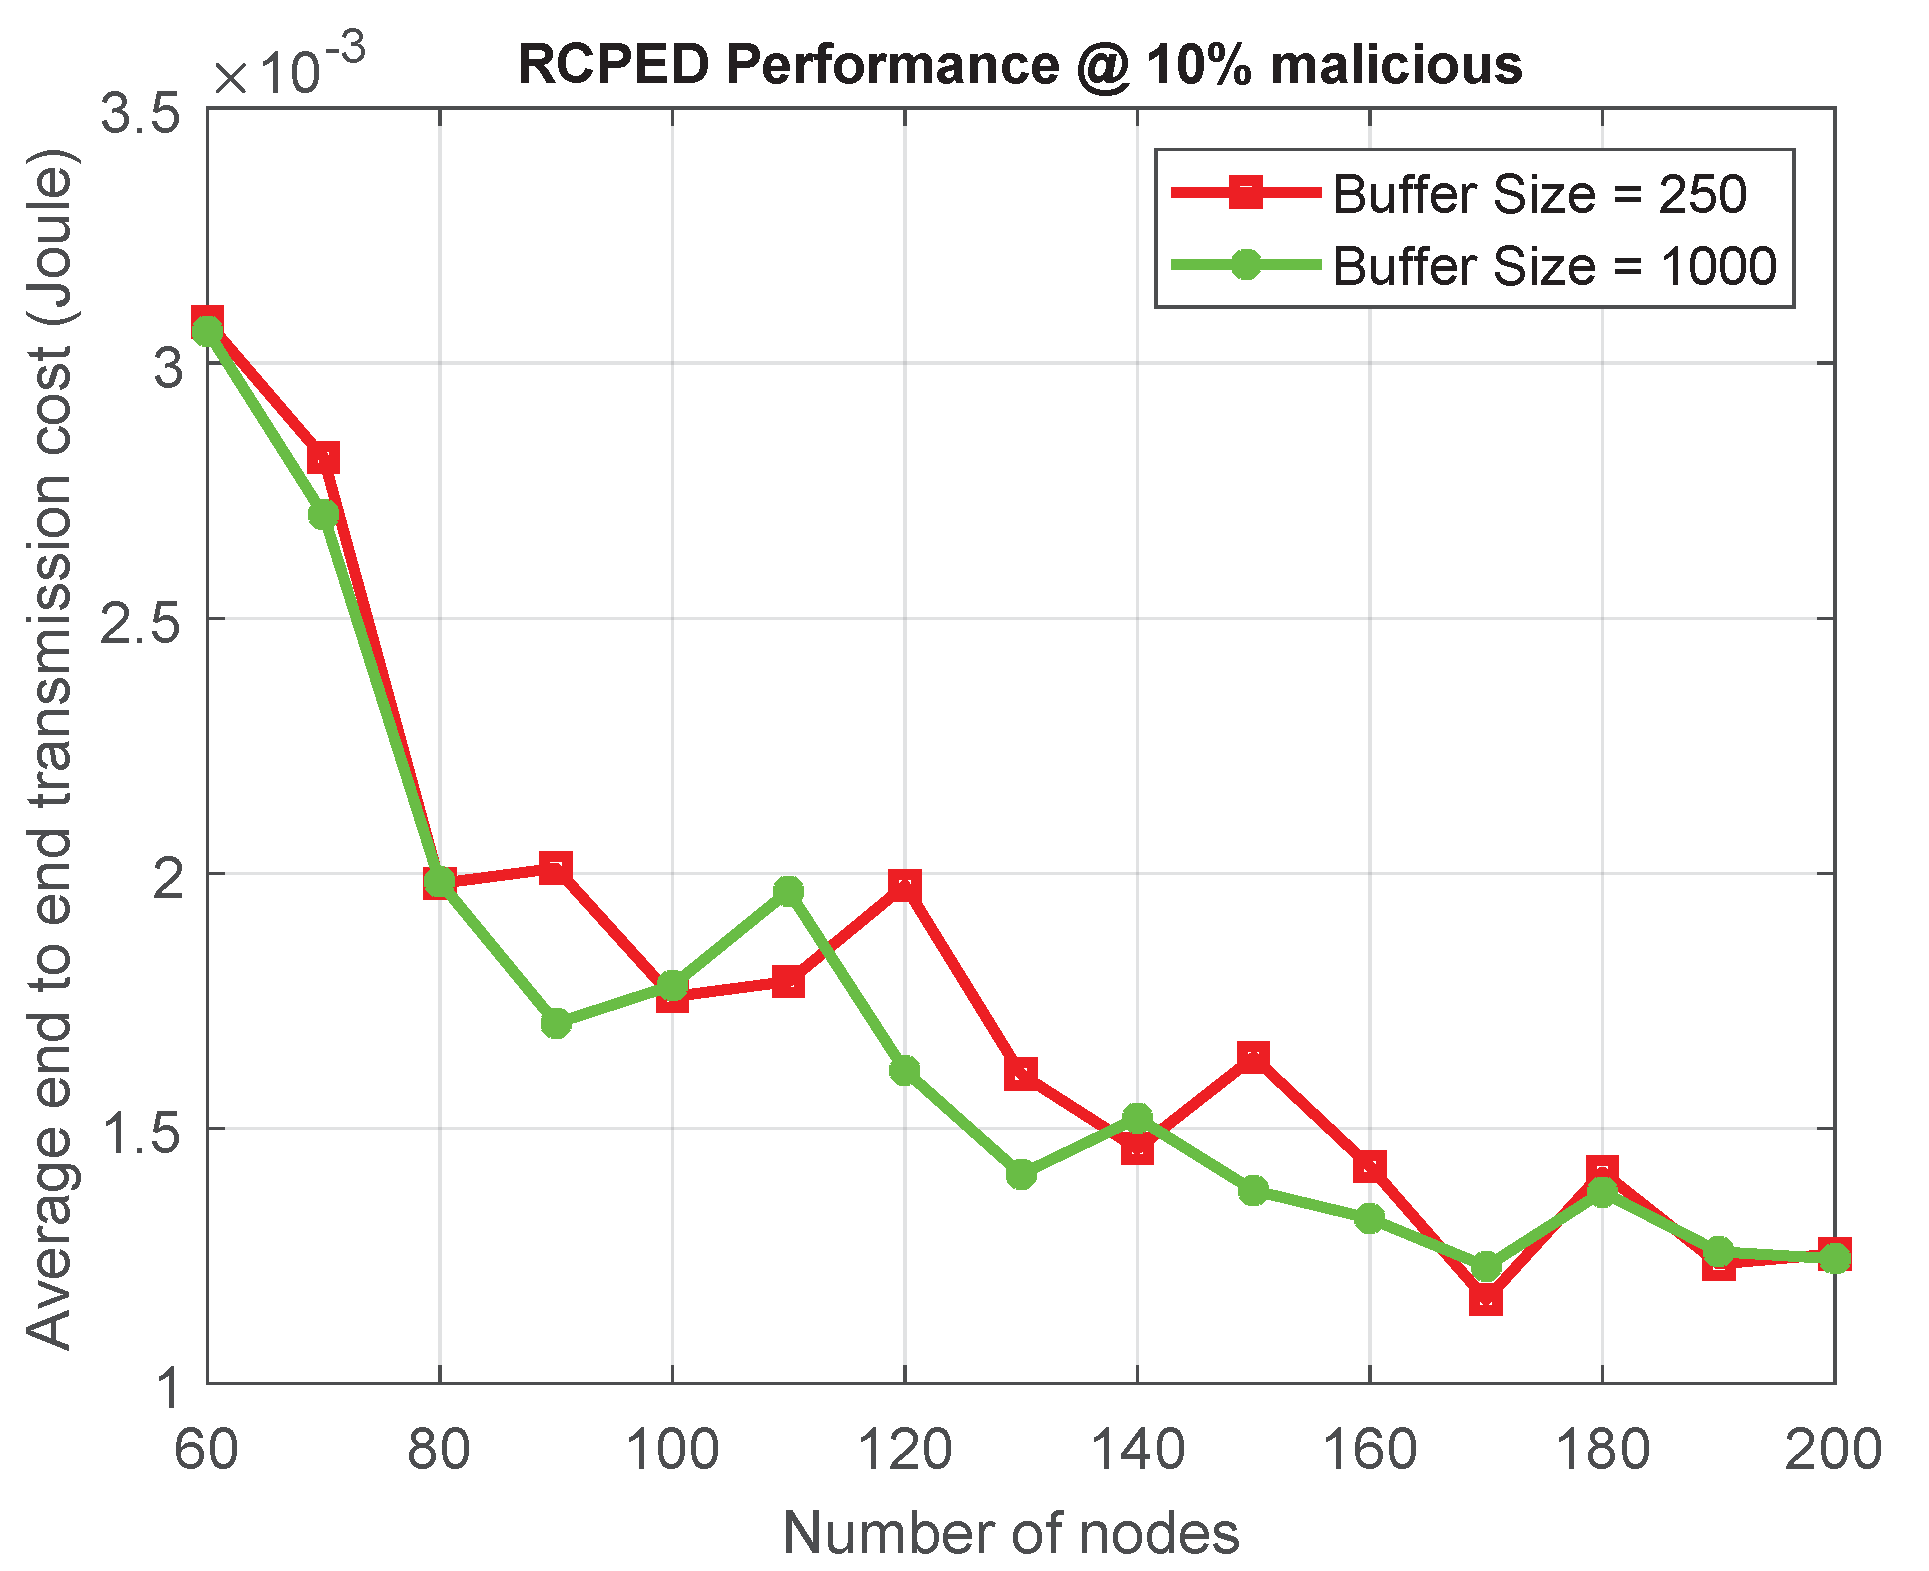
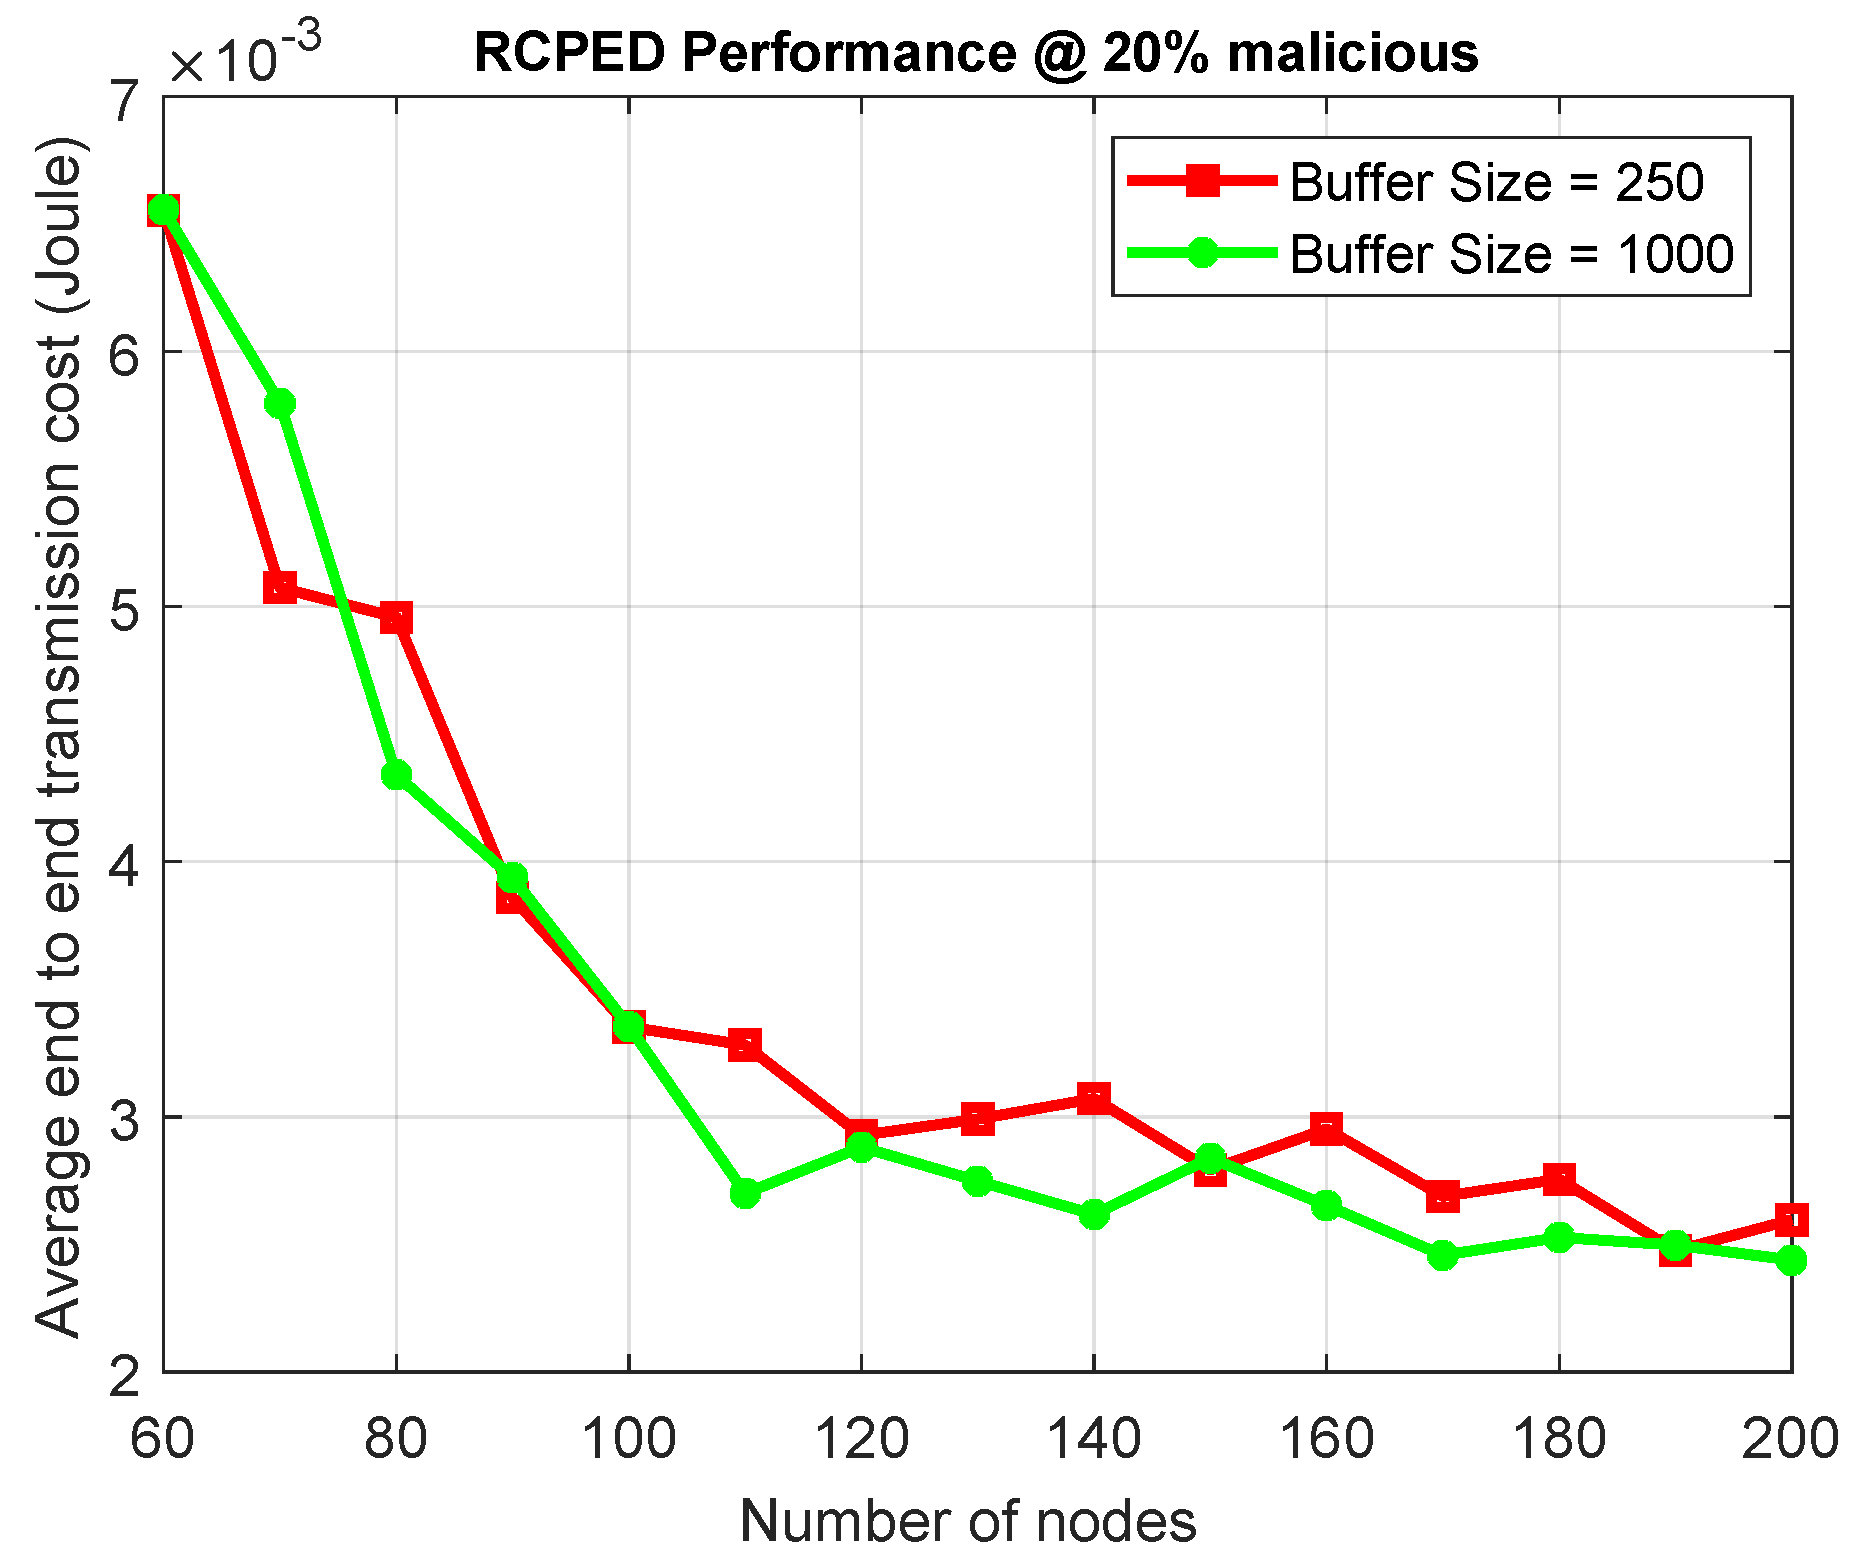
Figure 8, Figure 9 and Figure 10 present the performance of RCPED with different data buffer size at a number of malicious ratio.
Figure 8 shows the result of a malicious ratio at 10%. It can be seen that the utilization of a larger buffer does not possess a very distinct advantage. The lines of performance that indicate the transmission cost wind around each other in many cases. On the other hand, as the nodes number in the network arises, the transmission costs of RCPED with different buffer sizes reveal descending tendencies. However, minor fluctuations remain.
Figure 9 illustrates the result when the malicious ratio rises to 20%, the advantage possessed by the adoption of larger buffer size becomes a bit clearer. A larger buffer size means less energy consumed for data transmission in most cases. Transmission costs with different buffer sizes still tend to decrease, but fluctuations appear less violent.
As demonstrated in Figure 10, when the malicious ratio reaches 30%, the adoption of a larger buffer size shows a clear advantage. However, minor fluctuations in transmission cost lines of different buffer sizes show no signs of going away. The fluctuations in Figure 8, Figure 9 and Figure 10 is probably due to that in the simulation setup, and there are many parameters (such as nodes locations) that are completely random as efforts trying to imitate the realistic scenario. Nonetheless, the overall tendency in each scenario is quite clear, despite these fluctuations.
In conclusion, RCPED is generally in possession of superior performance given a larger buffer size, but this advantage is not entirely clear if the malicious ratio is low. This advantage becomes increasingly distinct as the malicious ratio of the network arises.

7. Conclusions and Future-Work

In this paper, our attention is focused on vampire attacks, an instance of resource depletion attack, intentionally targeting energy efficiency of routing protocols designed for WSNs. Consequently, the RCPED protocol was proposed to provide energy-efficient routing protection by collaborating existing routing protocols. RCPED keeps detecting abnormal signs of attackers and offers routing protection against vampire attacks. It is accomplished by selecting routes that have maximum priority, namely, the ones with the highest overall energy efficiency and security performance. Since this protection is offered without the help of cryptography, it consumes much less energy and computation resources and can deliver better comprehensive performance over existing solutions such as PLGPa. Simulation results have illustrated that the RCPED protocol consumes the least overall energy cost compared to its competitors.
However, it is also noted from the simulation results that, as the malicious ratio rises, the relative performance advantage held by RCPED tends to shrink, and this advantage is expected to vanish after the malicious ratio reaches a certain level. Therefore, future work will concern possible optimizations on RCPED or introduce novel techniques to collaborate with RCPED to deliver an acceptable performance under the conditions of relatively higher malicious ratios.

Author Contributions

Conceptualization, P.G. and T.M.C.; methodology, P.G. and P.X.; software, P.G. and P.X.; validation, P.G., T.M.C. and P.X.; formal analysis, P.G., T.M.C. and P.X.; resources, T.M.C.; writing—original draft preparation, P.G. and T.M.C.; writing—review and editing, P.G., T.M.C. and P.X.; visualization, P.G. and P.X.; supervision, T.M.C.; project administration, T.M.C. All authors have read and agreed to the published version of the manuscript.

Funding

This work was supported in part by the Chongqing Natural Science Foundation Project under Grant cstc2019jcyj-msxmX0032.

Conflicts of Interest

The authors declare no conflict of interest.

References

  1. Tanenbaum, A. Computer Networks, 4th ed.; Prentice Hall Professional Technical Reference; Pearson: London, UK, 2002. [Google Scholar]
  2. Awoyemi, B.S.; Alfa, A.S.; Maharaj, B.T. Network Restoration in Wireless Sensor Networks for Next-Generation Applications. IEEE Sens. J. 2019, 19, 8352–8363. [Google Scholar] [CrossRef]
  3. Dias, G.M.; Margi, C.B.; de Oliveira, F.C.; Bellalta, B. Cloud-Empowered, Self-Managing Wireless Sensor Networks: Interconnecting Management Operations at the Application Layer. IEEE Consum. Electron. Mag. 2019, 8, 55–60. [Google Scholar] [CrossRef]
  4. Yang, S.H. Wireless Sensor Networks: Principles, Design and Applications; Springer: London, UK, 2014. [Google Scholar]
  5. Liu, J.; Huang, K.; Yao, X. Common-Innovation Subspace Pursuit for Distributed Compressed Sensing in Wireless Sensor Networks. IEEE Sens. J. 2019, 19, 1091–1103. [Google Scholar] [CrossRef]
  6. Mabrouki, J.; Azrour, M.; Dhiba, D.; Farhaoui, Y.; Hajjaji, S.E. IoT-based data logger for weather monitoring using arduino-based wireless sensor networks with remote graphical application and alerts. Big Data Min. Anal. 2021, 4, 25–32. [Google Scholar] [CrossRef]
  7. Zhou, L.; Haas, Z. Securing ad hoc networks. Netw. IEEE 1999, 13, 24–30. [Google Scholar] [CrossRef] [Green Version]
  8. O’Mahony, G.D.; Curran, J.T.; Harris, P.J.; Murphy, C.C. Interference and Intrusion in Wireless Sensor Networks. IEEE Aerosp. Electron. Syst. Mag. 2020, 35, 4–16. [Google Scholar] [CrossRef]
  9. Xie, H.; Yan, Z.; Yao, Z.; Atiquzzaman, M. Data Collection for Security Measurement in Wireless Sensor Networks: A Survey. IEEE Internet Things J. 2019, 6, 2205–2224. [Google Scholar] [CrossRef] [Green Version]
  10. Butun, I.; Österberg, P.; Song, H. Security of the Internet of Things: Vulnerabilities, Attacks, and Countermeasures. IEEE Commun. Surv. Tutor. 2020, 22, 616–644. [Google Scholar] [CrossRef] [Green Version]
  11. Yao, S.; Li, Z.; Guan, J.; Liu, Y. Stochastic Cost Minimization Mechanism Based on Identifier Network for IoT Security. IEEE Internet Things J. 2020, 7, 3923–3934. [Google Scholar] [CrossRef]
  12. Abdalzaher, M.S.; Muta, O. A Game-Theoretic Approach for Enhancing Security and Data Trustworthiness in IoT Applications. IEEE Internet Things J. 2020, 7, 11250–11261. [Google Scholar] [CrossRef]
  13. Vasserman, E.; Hopper, N. Vampire Attacks: Draining Life from Wireless Ad Hoc Sensor Networks. IEEE Trans. Mob. Comput. 2013, 12, 318–332. [Google Scholar] [CrossRef] [Green Version]
  14. Gong, P. Energy Efficient and Secure Wireless Communications for Wireless Sensor Networks. Ph.D. Thesis, City, University of London, London, UK, 2017. [Google Scholar]
  15. Hei, X.; Du, X.; Wu, J.; Hu, F. Defending Resource Depletion Attacks on Implantable Medical Devices. In Proceedings of the 2010 IEEE Global Telecommunications Conference GLOBECOM 2010, Miami, FL, USA, 6–10 December 2010; pp. 1–5. [Google Scholar] [CrossRef]
  16. Malasri, K.; Wang, L. Securing wireless implantable devices for healthcare: Ideas and challenges. Commun. Mag. IEEE 2009, 47, 74–80. [Google Scholar] [CrossRef]
  17. Raymond, D.R.; Midkiff, S. Denial-of-Service in Wireless Sensor Networks: Attacks and Defenses. Pervasive Comput. IEEE 2008, 7, 74–81. [Google Scholar] [CrossRef]
  18. Deng, J.; Han, R.; Mishra, S. Defending Against Path-based DoS Attacks in Wireless Sensor Networks. In 3rd ACM Workshop on Security of Ad Hoc and Sensor Networks; SASN ’05; ACM: New York, NY, USA, 2005; pp. 89–96. [Google Scholar] [CrossRef]
  19. Chen, Y.; Hwang, K. Spectral Analysis of TCP Flows for Defense Against Reduction-of-Quality Attacks. In Proceedings of the 2007 IEEE International Conference on Communications, Glasgow, UK, 24–28 June 2007; pp. 1203–1210. [Google Scholar] [CrossRef] [Green Version]
  20. Guirguis, M.; Bestavros, A.; Matta, I.; Zhang, Y. Reduction of quality (RoQ) attacks on Internet end-systems. In Proceedings of the IEEE 24th Annual Joint Conference of the IEEE Computer and Communications Societies, Miami, FL, USA, 13–17 March 2005; Volume 2, pp. 1362–1372. [Google Scholar] [CrossRef] [Green Version]
  21. Sun, H.; Lui, J.; Yau, D. Defending against low-rate TCP attacks: Dynamic detection and protection. In Proceedings of the 12th IEEE International Conference on Network Protocols, Berlin, Germany, 8 October 2004; pp. 196–205. [Google Scholar] [CrossRef] [Green Version]
  22. Yang, G.; Gerla, M.; Sanadidi, M. Defense against low-rate TCP-targeted denial-of-service attacks. In Proceedings of the Ninth International Symposium on Computers And Communications (IEEE Cat. No. 04TH8769), Alexandria, Egypt, 28 June–1 July 2004; Volume 1, pp. 345–350. [Google Scholar] [CrossRef] [Green Version]
  23. Raymond, D.; Marchany, R.; Brownfield, M.; Midkiff, S. Effects of Denial of Sleep Attacks on Wireless Sensor Network MAC Protocols. IEEE Trans. Veh. Technol. 2006, 58, 367–380. [Google Scholar] [CrossRef] [Green Version]
  24. Li, X.; Jia, Z.; Zhang, P.; Zhang, R.; Wang, H. Trust-based on-demand multipath routing in mobile ad hoc networks. Inf. Secur. IET 2010, 4, 212–232. [Google Scholar] [CrossRef] [Green Version]
  25. Tang, J.; Cheng, Y.; Zhuang, W. Real-Time Misbehavior Detection in IEEE 802.11-Based Wireless Networks: An Analytical Approach. IEEE Trans. Mob. Comput. 2014, 13, 146–158. [Google Scholar] [CrossRef] [Green Version]
  26. Mpitziopoulos, A.; Gavalas, D.; Konstantopoulos, C.; Pantziou, G. A survey on jamming attacks and countermeasures in WSNs. Commun. Surv. Tutor. IEEE 2009, 11, 42–56. [Google Scholar] [CrossRef]
  27. Parno, B.; Luk, M.; Gaustad, E.; Perrig, A. Secure Sensor Network Routing: A Clean-slate Approach. In Proceedings of the 2006 ACM CoNEXT Conference, Lisboa, Portugal, 4–7 December 2006; CoNEXT ’06. ACM: New York, NY, USA, 2006; pp. 11:1–11:13. [Google Scholar] [CrossRef]
  28. Stajano, F.; Anderson, R.J. The Resurrecting Duckling: Security Issues for Ad-hoc Wireless Networks. In Proceedings of the 7th International Workshop on Security Protocols, Cambridge, UK, 3–5 April 2000; Springer: London, UK, 2000; pp. 172–194. [Google Scholar]
  29. Cao, X.; Shila, D.; Cheng, Y.; Yang, Z.; Zhou, Y.; Chen, J. Ghost-in-ZigBee: Energy Depletion Attack on ZigBee based Wireless Networks. Internet Things J. IEEE 2016, 3, 816–829. [Google Scholar] [CrossRef]
  30. Gong, P.; Xu, Q.; Chen, T. Energy Harvesting Aware routing protocol for wireless sensor networks. In Proceedings of the 2014 9th International Symposium on Communication Systems, Networks & Digital Sign (CSNDSP), Manchester, UK, 23–25 July 2014; pp. 171–176. [Google Scholar] [CrossRef] [Green Version]
  31. Chandola, V.; Banerjee, A.; Kumar, V. Anomaly Detection: A Survey. ACM Comput. Surv. 2009, 41. [Google Scholar] [CrossRef]
  32. DeGroot, M.; Schervish, M. Probability and Statistics; Addison-Wesley series in statistics; Addison-Wesley: Boston, MA, USA, 2002. [Google Scholar]
  33. Chatterjee, S.; Hadi, A. Regression Analysis by Example; Wiley Series in Probability and Statistics; Wiley: Hoboken, NJ, USA, 2006. [Google Scholar]
  34. Pozar, D. Microwave Engineering; Wiley: Hoboken, NJ, USA, 2004. [Google Scholar]
  35. NMEA-0183V20; Publications and Standards from the National Marine Electronics Association (NMEA)/NMEA 0183. NMEA: Severna Park, MD, USA, 2008.
  36. Sadek, A.K.; Yu, W.; Liu, K.J.R. On the energy efficiency of cooperative communications in wireless sensor networks. ACM Trans. Sen. Netw. 2010, 6, 5:1–5:21. [Google Scholar] [CrossRef]
  37. Karaki, S.; Chedid, R.; Ramadan, R. Probabilistic performance assessment of autonomous solar-wind energy conversion systems. Energy Convers. IEEE Trans. 1999, 14, 766–772. [Google Scholar] [CrossRef]
  38. Collins, R.D.; Crowther, K.G. Systems-based modeling of generation variability under alternate geographic configurations of photovoltaic (PV) installations in Virginia. Energy Policy 2011, 39, 6262–6270. [Google Scholar] [CrossRef]
  39. Kleinschmidt, J.; Borelli, W.; Pellenz, M. An Analytical Model for Energy Efficiency of Error Control Schemes in Sensor Networks. In Proceedings of the 2007 IEEE International Conference on Communications, Glasgow, UK, 24–28 June 2007; pp. 3895–3900. [Google Scholar]
  40. Kim, K.; Lee, W.; Choi, C. DSML: Dual Signal Metrics for Localization in Wireless Sensor Networks. In Proceedings of the 2008 IEEE Wireless Communications and Networking Conference, Las Vegas, NV, USA, 31 March–3 April 2008; pp. 2355–2360. [Google Scholar] [CrossRef]
  41. Raskovic, D.; Giessel, D. Battery-Aware Embedded GPS Receiver Node. In Proceedings of the 2007 Fourth Annual International Conference on Mobile and Ubiquitous Systems: Networking & Services (MobiQuitous), Philadelphia, PA, USA, 6–10 August 2007; pp. 1–6. [Google Scholar] [CrossRef]
  42. Huang, W.; Abu Qahouq, J.A. An Online Battery Impedance Measurement Method Using DC-DC Power Converter Control. IEEE Trans. Ind. Electron. 2014, 61, 5987–5995. [Google Scholar] [CrossRef]
  43. Jiang, J.A.; Zheng, X.Y.; Chen, Y.F.; Wang, C.H.; Chen, P.T.; Chuang, C.L.; Chen, C.P. A Distributed RSS-Based Localization Using a Dynamic Circle Expanding Mechanism. Sens. J. IEEE 2013, 13, 3754–3766. [Google Scholar] [CrossRef]
  44. Karagiannis, M.; Chatzigiannakis, I.; Rolim, J. Multilateration: Methods for Clustering Intersection Points for Wireless Sensor Networks Localization with Distance Estimation Error. Int. J. Innov. Manag. Technol. 2012, arXiv:1203.3704. [Google Scholar]
  45. Niculescu, D.; Nath, B. Ad hoc positioning system (APS). In Proceedings of the GLOBECOM’01, IEEE Global Telecommunications Conference (Cat. No.01CH37270), San Antonio, TX, USA, 25–29 November 2001; Volume 5, pp. 2926–2931. [Google Scholar] [CrossRef]
  46. Chen, R.; Snow, M.; Park, J.M.; Refaei, M.; Eltoweissy, M. NIS02-3: Defense against Routing Disruption Attacks in Mobile Ad Hoc Networks. In Proceedings of the Global Telecommunications Conference, GLOBECOM ’06, San Francisco, CA, USA, 27 November–1 December 2006; pp. 1–5. [Google Scholar] [CrossRef]
  47. Darwiche, P.A. Modeling and Reasoning with Bayesian Networks, 1st ed.; Cambridge University Press: New York, NY, USA, 2009. [Google Scholar]
  48. Yi, P.; Zhu, T.; Zhang, Q.; Wu, Y.; Li, J. Green firewall: An energy-efficient intrusion prevention mechanism in wireless sensor network. In Proceedings of the 2012 IEEE Global Communications Conference (GLOBECOM), Anaheim, CA, USA, 3–7 December 2012; pp. 3037–3042. [Google Scholar] [CrossRef]
  49. Ishizaka, A.; Nemery, P. Multi-Criteria Decision Analysis: Methods and Software; John Wiley & Sons: Chichester, UK, 2013. [Google Scholar]
  50. Gong, P.; Chen, T.; Xu, Q. ETARP: An Energy Efficient Trust-Aware Routing Protocol for Wireless Sensor Networks. J. Sens. 2015, 2015, 469793. [Google Scholar] [CrossRef]
  51. Saaty, T.L. A scaling method for priorities in hierarchical structures. J. Math. Psychol. 1977, 15, 234–281. [Google Scholar] [CrossRef]
  52. Miller, G.A. The Magical Number Seven, Plus or Minus Two: Some Limits on Our Capacity for Processing Information. Psychol. Rev. 1956, 63, 81–97. [Google Scholar] [CrossRef] [Green Version]
  53. Salo, A.A.; Hämäläinen, R.P. On the measurement of preferences in the analytic hierarchy process. J. Multi-Criteria Decis. Anal. 1997, 6, 309–319. [Google Scholar] [CrossRef]
  54. Poyhonen, M.A.; Hamalainen, R.P.; Salo, A.A. An Experiment on the Numerical Modelling of Verbal Ratio Statements. J. Multi-Criteria Decis. Anal. 1997, 6, 1–10. [Google Scholar] [CrossRef]
  55. Lootsma, F.A. Scale sensitivity in the multiplicative AHP and SMART. J. Multi-Criteria Decis. Anal. 1993, 2, 87–110. [Google Scholar] [CrossRef]
  56. IEEE. P802.15.4m/D4, Oct 2013—IEEE Draft Standard for Local and Metropolitan Area Networks—Part 15.4: Low Rate Wireless Personal Area Networks (LR-WPANs)—Amendment 6: TV White Space Between 54 MHz and 862MHz Physical Layer; IEEE: Piscataway, NJ, USA, 2013; pp. 1–152. [Google Scholar]
  57. Bankovic, Z.; Fraga, D.; Moya, J.M.; Vallejo, J.C. Detecting Unknown Attacks in Wireless Sensor Networks That Contain Mobile Nodes. Sensors 2012, 12, 10834–10850. [Google Scholar] [CrossRef] [PubMed] [Green Version]
  58. Li, X.; Zhou, F.; Du, J. LDTS: A Lightweight and Dependable Trust System for Clustered Wireless Sensor Networks. IEEE Trans. Inf. Forensics Secur. 2013, 8, 924–935. [Google Scholar] [CrossRef]
  59. Ganesh, S.; Amutha, R. Efficient and secure routing protocol for wireless sensor networks through SNR based dynamic clustering mechanisms. J. Commun. Netw. 2013, 15, 422–429. [Google Scholar] [CrossRef] [Green Version]
  60. Jiang, J.; Han, G.; Wang, F.; Shu, L.; Guizani, M. An Efficient Distributed Trust Model for Wireless Sensor Networks. IEEE Trans. Parallel Distrib. Syst. 2015, 26, 1228–1237. [Google Scholar] [CrossRef]
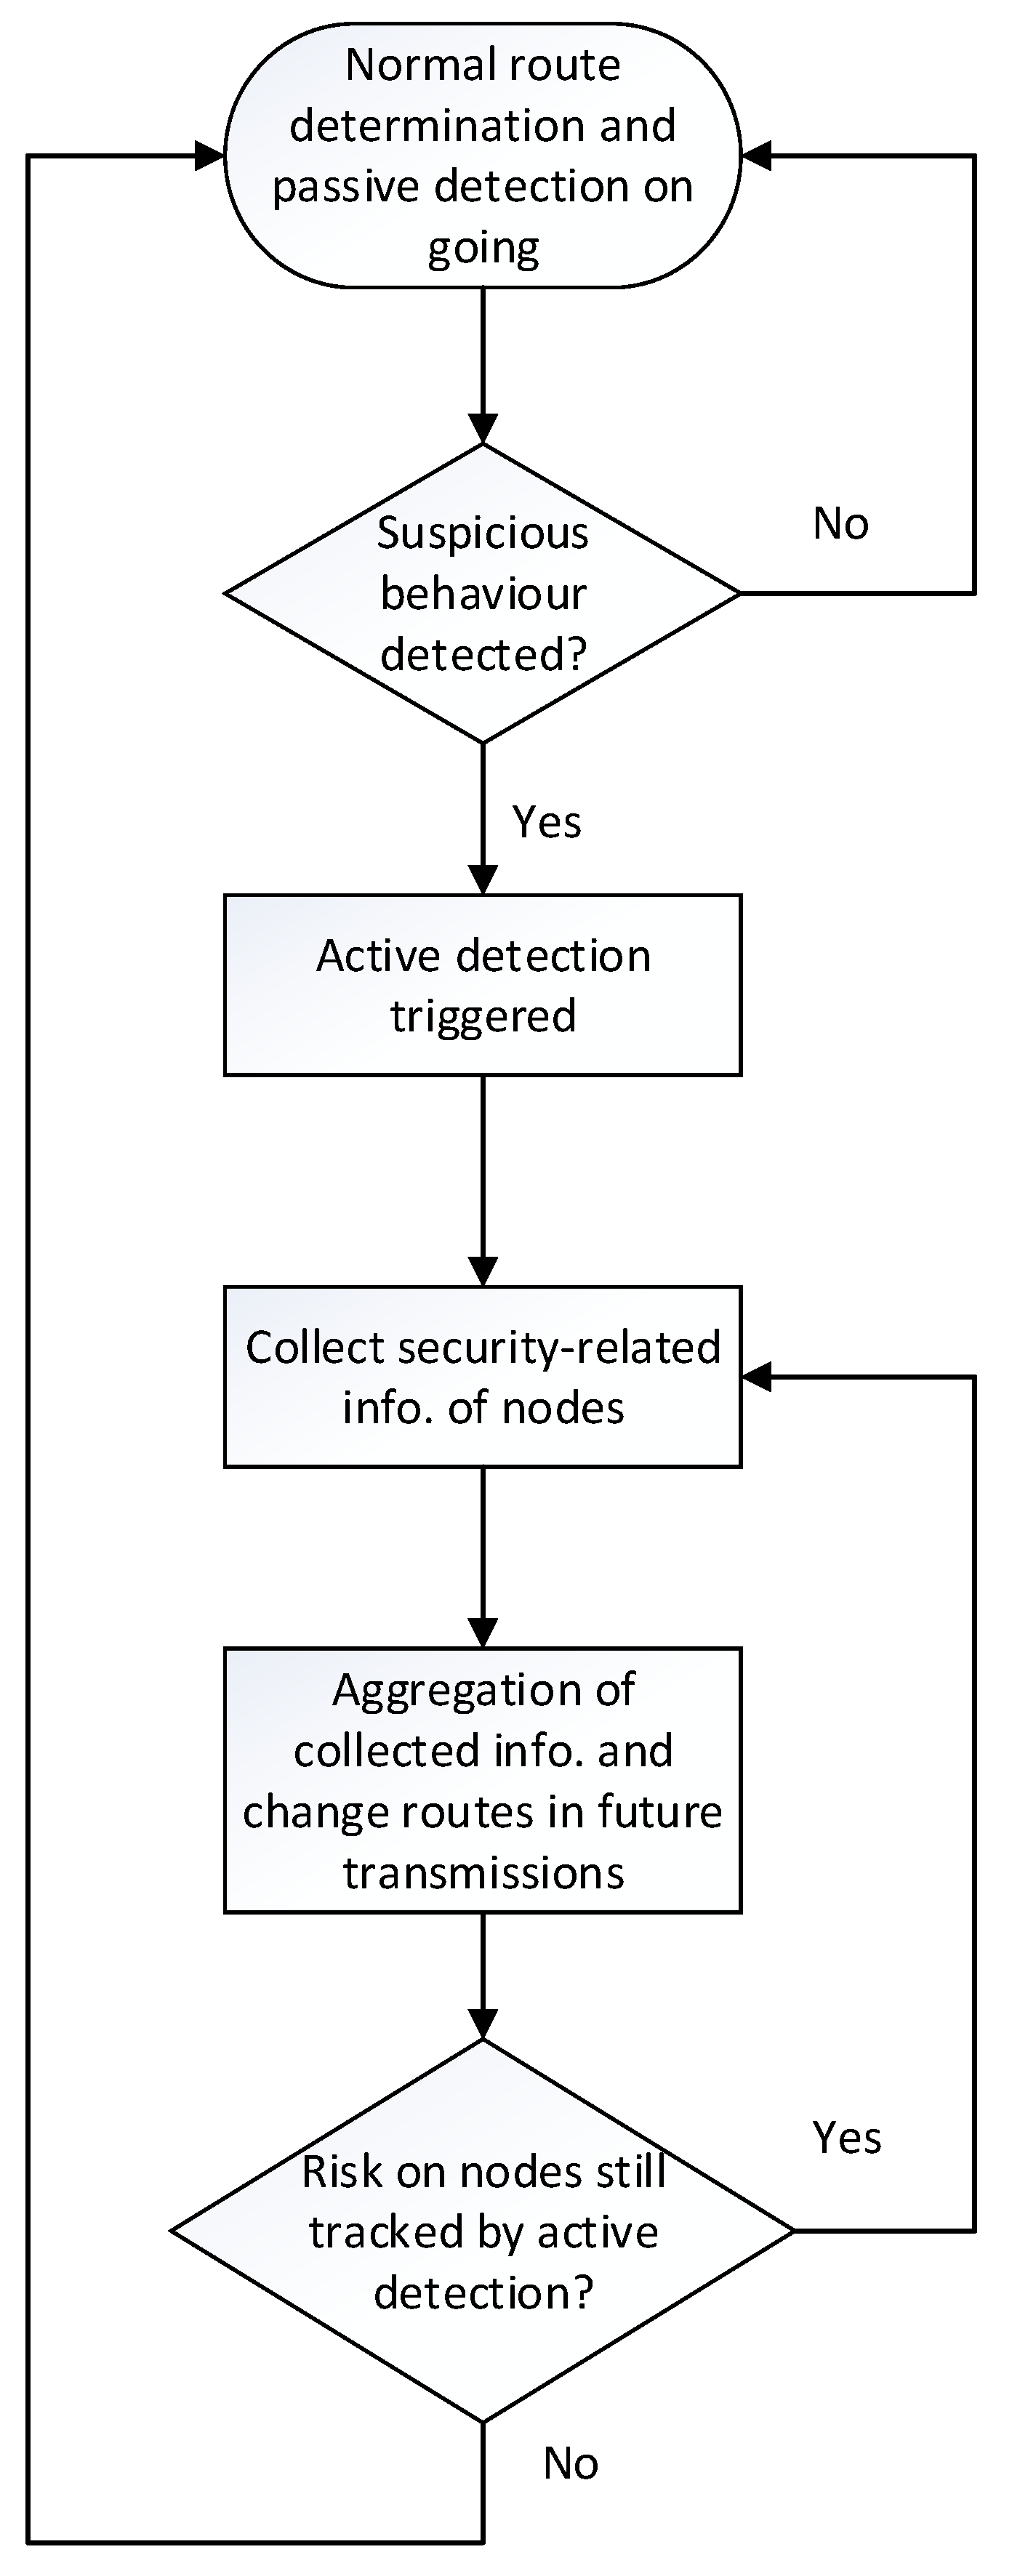
Figure 1. General concept of detection and protection against vampire attacks.
Network 02 00007 g001
Figure 2. Process of trilateration.
Network 02 00007 g002
Figure 3. Format of data buffer.
Network 02 00007 g003
Figure 4. Bayesian network for information aggregation.
Network 02 00007 g004
Figure 5. Problem structure setup by AHP.
Network 02 00007 g005
Figure 6. Route determination example.
Network 02 00007 g006
Figure 7. Average end to end overall transmission cost (Joule).
Network 02 00007 g007
Figure 8. RCPED performance with different buffer size.
Network 02 00007 g008
Figure 9. RCPED performance with different buffer size.
Network 02 00007 g009
Figure 10. RCPED performance with different buffer size.
Network 02 00007 g010
Table 1. Summary of Related Works.
PapersMain TopicComments
[15]Resource depletion attacksIntroduction to resource depletion attacks, such as denial of service (DoS) attacks and forced authentication attacks.
[16,17,18]DoS attacks threatening WSNsGeneral studies on DoS attacks.
[19]Reduction in quality (RoQ) attacksGeneral studies on RoQ attacks, a downgraded version of distributed DoS attacks.
[20,21,22]Countermeasures against RoQ attacksCan offer protection against RoQ attacks. However, most of them can only be applied on transport layer and not in the routing layer.
[23,24,25,26,27,28,29]Power-draining attacksGeneral discussions on power-draining attacks. This is a subcategory of resource depletion attacks.
[13]Vampire attacksGeneral discussions on vampire attacks. This is an instance of power-draining attacks.
[13,27]Countermeasures against vampire attacksBoth are clean-slate secure sensor network routing protocol that can offer protection against vampire attacks. However, they rely heavily on cryptographic methods and may incur extra energy costs.
Table 2. Incomplete datasets D .
D HLS
observation 1 ?FT
observation 2 ?TF
observation 3 ?TT
Table 3. Initial estimates.
HF(h)HL F ( l | h ) HS F ( s | h )
T0.8TT0.1TT0.1
F0.2TF0.9TF0.9
FT0.8FT0.9
FF0.2FF0.1
Table 4. Degree of priority (importance).
Degree of ImportanceDefinition
1Equal Importance
2Weak
3Moderate Importance
4Moderate Plus
5Strong Importance
6Strong Plus
7Very Strong or demonstrated Importance
8Very Very Strong
9Extreme Importance
Table 5. Different scales of priority setup.
Scale TypesEqual ImportanceWeakModerate ImportanceModerate PlusStrong ImportanceStrong PlusVery Strong ImportanceVery Very StrongExtreme Importance
Linear123456789
Power149162536496481
Geometric1248163264128256
Logarithmic11.5822.322.582.8133.173.32
Square Root11.411.7322.232.452.652.833
Asymptotical00.120.240.360.460.550.630.700.76
Inverse Linear11.131.291.51.82.2534.59
Balanced11.221.51.862.33345.679
Table 6. Simulation parameters.
ParametersDescriptions
Simulation Area500 m × 500 m
Node Radio Range250 m
Traffic TypeCBR
Packet Size127 bytes
Data Rate20 kbps
SNR Threshold β 10 dB
Processing Power Level P c 10 4 W
Receiving Power Level P r 5 × 10 5 W
Outage Requirement P o u t * ( i , m ) 0.01 %
Variance of AWGN 10 9 W/Hz
Path-loss Exponent2.33
Maximum Output Power of Solar Cell on Sensor Nodes 3.75 × 10 3 W
Publisher’s Note: MDPI stays neutral with regard to jurisdictional claims in published maps and institutional affiliations.