Article

Analysis and Simulation of Dynamic Heat Transfer and Thermal Distribution in Burns with Multilayer Models Using Finite Volumes

by
Adriana Sofia Rodríguez-Pérez
1,
Héctor Eduardo Gilardi-Velázquez
2 and
Stephanie Esmeralda Velázquez-Pérez
1,3,*
1
Facultad de Ciencias, Universidad Autónoma de San Luis Potosí, Av. Parque Chapultepec 1570, Privadas del Pedregal, San Luis Potosí 78295, San Luis Potosí, Mexico
2
Facultad de Ingeniería, Universidad Panamericana, Álvaro del Portillo 49, Zapopan 45010, Jalisco, Mexico
3
Departamento Físico-Matemáticas, Universidad Autónoma de San Luis Potosí, Niño Artillero s/n., Zona Universitaria Poniente, San Luis Potosí 78290, San Luis Potosí, Mexico
*
Author to whom correspondence should be addressed.
Dynamics 2025, 5(4), 41; https://doi.org/10.3390/dynamics5040041
Submission received: 19 August 2025 / Revised: 16 September 2025 / Accepted: 22 September 2025 / Published: 1 October 2025

Abstract

Burns represent a significant medical challenge, and the development of theoretical models has the potential to contribute to the advancement of new diagnostic tools. This study aimed to perform numerical simulations of the Pennes bioheat transfer equation, incorporating heat generation terms due to the body’s immunological response to thermal injury, as well as changes in skin thermal parameters and blood perfusion for each burn type. We propose the incorporation of specific parameters and boundary conditions related to multilayer perfusion into the Pennes bioheat model. Using the proposed layered skin model, we evaluate temperature differences to establish correlations for determining burn depth. In this investigation, 1D and 3D algorithms based on the finite volume method were applied to capture transient and spatial thermal variations, with the resulting temperature distributions demonstrating the ability of the proposed models to describe the expected thermal variations in healthy and burned tissue. This work demonstrates the potential of the finite volume method to approximate the solution of the Pennes biothermal equation. Overall, this study provides a computational framework for analyzing heat transfer in burn injuries and highlights the relevance of mathematical simulations as a tool for future research on infrared thermography in medicine.

1. Introduction

Burns can result from thermal trauma, exposure to ultraviolet or ionizing radiation, electricity, chemical agents, or friction, constituting a significant global public health problem [1,2]. According to the World Health Organization (WHO), approximately 180,000 deaths due to burns are recorded annually, with non-fatal burns being one of the leading causes of morbidity, often resulting in prolonged hospitalization, disfigurement, and disability [3]. A rapid and accurate diagnosis of burn severity is crucial for determining appropriate treatment, preventing complications, avoiding unnecessary procedures such as grafts or amputations, and reducing aesthetic issues and morbidity [4]. To determine the degree of a burn, both its extent and depth are considered, and they can be classified into four categories: superficial epidermal burns (first-degree), superficial dermal burns (second-degree), deep dermal burns (second-degree), and full-thickness burns (third-degree) [5]. Traditionally, burn severity is assessed through visual and tactile inspection. While superficial and full-thickness burns are easily identifiable, intermediate-depth burns pose a significant challenge, with assessment accuracy ranging from 50 to 70%, even for experienced professionals, due to various factors that are not detectable by these methods, such as changes in microcirculation and dynamic changes in the wound [4,6]. Therefore, new techniques for burn diagnosis have been developed, one of the most promising being infrared thermography [6,7,8,9,10,11], which has demonstrated an accuracy of up to 90% [5] since it was first reported by Mason et al. in 1981 [12]. However, further research is needed on the thermal patterns expected for different burn types. To improve this technique and expand its study, mathematical modeling of temperature distribution in living tissues offers a valuable tool [13]. The Pennes bioheat equation is one of the most widely used models to describe heat transfer in biological tissues [14]. It is based on the classical heat equation but incorporates the effects of blood perfusion and metabolic heat generation [15]. The literature reports numerous applications of Pennes’ equation, including modeling the thermomedical response of biological tissues to high-temperature exposure [16], analyzing heat transfer at tissue boundaries [17], investigating time-dependent exposure [18], defining boundary conditions for medical treatments involving skin exposure to external heat sources [19], and for heat exchange between biological tissue and blood flow by accounting for non-uniform temperature distribution [20]. Although several alternative and improved models have emerged to determine the heat transfer rate, such as [21], which evaluate the heat transfer rate using several quadratic regression models applied to engineering, i.e., the Chen and Holmes model (1980) and the Weinbaum-Jiji model (1984) [22,23], the Pennes bioheat model remains widely used due to its accuracy and simplicity in numerical coding [20,24,25].
The study of heat propagation in biological tissue, considering multilayer blood perfusion, remains an open challenge in the literature. In this context, we propose the incorporation of specific parameters and boundary conditions related to multilayer perfusion into the Pennes bioheat model, aiming to improve its capacity to describe the complex thermal behavior of burned and healthy tissues. This study focuses on a detailed investigation of temperature distribution across skin layers affected by different burn types. The Pennes bioheat equation was adapted by assigning distinct thermal parameters to each skin layer and burn type in addition to incorporating metabolic heat generation (Q) and blood perfusion rate (W). The finite volume method was employed to solve the models, and solutions were compared against each other to assess the consistency. Furthermore, the expected temperature patterns were validated against established data based on thermal distributions reported in the literature (articles [6,10]) through infrared thermography, which allowed the simulations to be contextualized and supported. The remainder of this paper is organized as follows: in this section, the theoretical background and framework are presented. Section 2 describes the methodology used for the numerical solution, detailing the assumptions and proposals of the models. Section 3 presents the obtained results along with their interpretation. Finally, Section 4 provides our conclusions.

2. Mathematical Model and Analysis of Thermal Behavior in Biological Tissues

Temperature distribution within the human body is a topic of medical importance as abnormal thermal gradients can provide information about certain conditions [26]. Diverse theoretical and experimental approaches have been developed to advance the understanding of heat transfer in biological tissues.

2.1. Burn Classification

The skin is a vital organ that performs various functions, including acting as a protective barrier against external agents and providing sensory perception. One of its key roles is regulating body temperature [1], achieved through mechanisms such as vasodilation, vasoconstriction, sweating, and thermal conduction or insulation [27,28]. When a burn injury such as a burn occurs, these thermoregulatory mechanisms react or are altered to varying degrees depending on the burn severity [29]. Additionally, thermal trauma modifies the thermal properties of the affected skin [30]. To assess the extent of damage, burns are classified into four categories based on their depth and the layers of skin affected [2,31,32]; this is shown in [1] (Figure CI-2. in reference): I. Superficial burns: These affect only the epidermis and are characterized by erythema, moderate pain, redness, and swelling of the skin [31]. A common example is sunburns. In this case, the inflammatory response leads to an increase in blood perfusion [32,33]. Additionally, there is an increase in thermal conductivity and heat capacity in areas with fluid accumulation, while in the epidermis, these properties decrease due to dehydration. The immune response also generates extra metabolic heat [15]. II. Superficial second-degree burns: These burns damage the epidermis and the upper part of the dermis, presenting with serous fluid blisters and intense pain due to the preservation of nerve endings [2,31]. Thermal conductivity tends to decrease near the surface due to dehydration and structural damage, while in deeper areas, it slightly increases along with heat capacity. Blood perfusion increases mildly as part of the inflammatory process [30]. III. Deep second-degree burns: These burns damage the entire dermis and epidermis, affecting vascular and nerve structures, causing a reduction in blood perfusion and altering heat transport through the blood circulation [22]. Immune and inflammatory responses are weakened due to cellular damage. Similarly, the thermal conductivity and heat capacity in the affected layers decrease significantly due to dehydration [34,35]. IV. Third-degree burns: These burns damage all layers of the skin, including subcutaneous and muscle tissue. They result in tissue necrosis and complete loss of vascular structures, leading to nearly null perfusion and metabolic heat generation. Thermal conductivity is also reduced due to the denaturation of structural proteins [22,31].
In this context, mathematical models, such as the one based on the Pennes bioheat equation, serve as valuable tools for simulating temperature distribution across skin layers and on the surface for different burn types, reflecting the damage to the thermoregulatory system and the alterations in temperature distribution characteristic of each type of injury, allowing for their identification through non-invasive methods such as the use of infrared thermography.

2.2. The Pennes Bioheat Transfer Equation

In 1948, Harry H. Pennes introduced a model to study the temperature distribution in the human forearm [14]. This model was later generalized for application to other tissues and physiological conditions [24]. The Pennes bioheat equation is derived from the classical heat diffusion equation, which is based on Fourier’s law, which establishes a linear relationship between heat flux ( q ) and the temperature gradient:
q ( x , t ) = κ T ( x , t ) ,
where T ( x , t ) is the temperature at a point x, and κ is the thermal conductivity [36]. However, it differs by including terms that represent metabolic heat generation and the convective effects of blood perfusion, which influence heat transfer in living tissues and have been studied for over a century since Claude Bernard’s early experiments in 1876 [37]. To model this biothermal processes, Pennes proposed the following equation:
ρ c T t = κ · ( T ) + W b C b ( T a T ) + Q ,
where ρ represents the density [kg/m3], c is the specific heat capacity [J/(kg °C)], and κ denotes the thermal conductivity of the tissue [J/(s · m °C)]; W b is the blood perfusion rate, i.e., the mass flow rate of blood per unit volume of tissue [kg/s · m3]; C b is the specific heat of blood; Q is the metabolic heat generation per unit volume [J/(s · m3)]; T a represents the arterial blood temperature [°C]; T is the local tissue temperature. The term W b C b ( T a T ) represents the heat generated due to blood perfusion. It is important to note that the constant W b was experimentally determined by Pennes for a human forearm (the adjusted W b until the theoretical temperature distribution matched the experimental observations) [15,25,37,38,39,40].
The Pennes bioheat equation relies on several assumptions that may limit its applicability in certain contexts. These include the assumption of uniform blood flow, the neglect of convective heat transfer between large vessels (such as arteries and veins), and the use of a constant perfusion coefficient [24]. For this reason, variants of the Pennes model have been developed, such as the Weinbaum-Jiji model (1984), which considers the thermal effect of blood vessels in an anisotropic manner [22], and the Chen and Holmes model (1980), which introduces a dual porosity model to differentiate between tissue and blood vessels [23]. Despite its limitations, it remains the most widely used equation due to its simplicity and its ability to provide reasonable results in many areas, such as hyperthermia, cryotherapy, blood circulation simulations, thermal regulation, and practical applications [24,37], as is the case in this work for burn evaluation and thermal image interpretation.
Since the Pennes bioheat equation is a partial differential equation (PDE), various analytical and numerical methods can be used to solve it [24]. In this work, the finite volume method (FVM) was chosen for its numerical solution as it is used to solve partial differential equations [41]. The development of the method is described in detail in the Materials and Methods section. Compared to the finite element method and the finite difference method [42], the FVM offers particular advantages for problems governed by conservation laws, such as fluid dynamics and heat transfer, as it ensures local conservation within the discretized control volumes [43,44,45,46].

2.3. Numerical Solution of Bioheat Transfer Equation

The Pennes bioheat equation, Equation (2), in both steady-state and transient forms is solved numerically using the finite volume method (FVM). This method discretizes the physical domain into a grid, assigning a control volume to each point. The differential equation is integrated over each control volume, converting the partial derivatives into algebraic expressions that represent heat fluxes across the boundaries [43], thereby obtaining the temperature distribution within the tissue. Three model configurations based on the Pennes bioheat equation were implemented:
  • A one-dimensional (1D) bilayer model;
  • A one-dimensional (1D) multilayer model;
  • A three-dimensional (3D) model.
The first one-dimensional model consists of a domain with two layers, as shown in Figure 1a. Layer 1 corresponds to the burn-affected region and extends from z = 0 to z = H ( x , y ) , where heat transfer is governed by Equation (3). Layer 2 represents healthy tissue, extending from z = H ( x , y ) to z = H N , and its behavior is described by Equation (4). Each layer is assigned specific thermal properties, and both equations are subject to the boundary conditions given by Equations (5)–(8).
ρ 1 C 1 ( T 1 ) t = κ 1 · ( T ) for 0 z < H ( x , y ) ,
ρ 2 C 2 ( T 2 ) t = κ 2 · ( T 2 ) + W 2 b C 2 b ( T a T 2 ) + Q m for H ( x , y ) z < H N ,
where ρ , C, κ , W b , C b , T a , and Q m are characteristic parameters of the tissue in each layer.
  • The boundary conditions for the two regions are
    κ 1 ( T 1 ) x = h ( T 1 T ) + q 0 * at x = 0 ,
    κ 1 ( T 1 ) x = κ 2 ( T 2 ) x at x = H ,
    T 1 = T 2 at x = H ,
    ( T 2 ) x = 0 at x = H N ,
    where Equation (5) represents convective heat flux between the skin surface and the environment. The term q 0 * corresponds to an external heat source, while a zero heat flux condition is applied at the remaining boundaries, as specified in Equation (8). Equation (6) defines the equality of flows at the interface between the burned tissue and the healthy tissue in order to comply with the conservation of energy at the border between both layers since physically there should not be an accumulation or loss of energy at the interface; likewise, Equation (7) defines that the temperature at the point of the border between tissues is unique and continuous. The initial condition corresponds to the steady-state solution associated with the problem, T ( t = 0 ) = T ( s t e a d y s t a t e ) .
The second model presents a more complex representation and considers the different layers of the skin: epidermis, dermis, subdermis, and a central zone (Figure 1b). Heat transfer within these layers is governed by the following Equations (9)–(12):
ρ e C e ( T e ) t = κ e · ( T e ) for epidermis layer ,
ρ d C d ( T d ) t = κ d · ( T d ) + W d C b ( T a T d ) + Q m d for dermis layer ,
ρ s C s ( T s ) t = κ s · ( T s ) + W s C b ( T a T s ) + Q m s for subdermis layer ,
T c o r e = T a = constant for x = core ,
where ρ e , ρ d , and ρ s represent the densities of the epidermis, dermis, and subdermis layers, respectively; C e , C d , and C s are the specific heat capacities of these layers; and κ e , κ d , and κ s are the corresponding thermal conductivities. C b is the specific heat of blood; Q m d and Q m s are the metabolic heat generation rates in the dermis and subdermis, respectively. T a denotes the arterial blood temperature, while T e , T s , T d , and T c o r e represent the temperatures of the epidermis, dermis, subdermis, and core layers, respectively.
The terms W d C b ( T a T d ) and W s C b ( T a T s ) represent the convective heat exchange due to blood perfusion in the dermis and subdermis, respectively, where W d and W s are the blood perfusion coefficients in the dermis and subdermis. These values were initially established by Pennes through experiments on the human forearm [14] and have been refined in subsequent studies [34].
In this case, the thermal properties of each layer were adjusted according to the type of burn and the specific body region studied, as damaged tissues exhibit significant differences in their thermal and structural characteristics due to alterations in thermoregulatory mechanisms [30].
The boundary conditions for the four regions are given by Equations (13)–(16): Equation (13) represents the convective heat exchange with the environment; Equations (14) and (15) define the continuity of both heat flux and temperature across the skin layers; and finally, Equation (16) defines the constant core temperature:
κ ( T ) x = h ( T s T ) + q 0 * at x = 0 ,
κ w ( T w ) x = κ e ( T e ) x at x = interface ,
T w = T e at x = interface ,
T c o r e = T a x = core domain ,
where h is the convective heat transfer coefficient of air, T is the ambient temperature, and q 0 * represents an external heat source. k w and T w denote the thermal conductivity and temperature on the western layer of an interface. Similarly, k e and T e correspond to the thermal conductivity and temperature on the eastern layer of the interface.
Once the governing equations and boundary conditions are defined for both, the bilayer and multilayer models, the FVM [47] is applied to obtain numerical solutions. The process begins by integrating the steady-state form of the Pennes bioheat equation (Equation (17)) over a control volume, resulting in (Equation (18)).
0 = κ · T + W C b ( T a T ) + Q ,
0 = V P κ · T d V + V P W C b ( T a T ) + Q d V ,
The time-advance solution was implemented using the explicit Euler scheme for the one-dimensional two-layer model, as described by Equation (19). The steady-state solution of the Pennes bioheat equation was used as the initial condition for the transient model, i.e., T ( t = 0 ) = T s t e a d y s t a t e , with the same boundary conditions as previously defined. The time integration was performed using the enthalpy at each node, defined as E j = ρ C T j , where ρ is the density, C the specific heat capacity, and T j the temperature at node j. Similarly, q w , j n and q e , j n denote the heat fluxes through the western and eastern faces of node j at time step n. Additionally, S j n represents the heat source at node j and time step n, defined by Q m + W b C b ( T j n T a ) . Finally, the temperature at each node at time step n + 1 is computed using Equation (20). Furthermore, the stability condition given by Equation (21) was applied.
E j n + 1 = E j n + Δ t 1 Δ x j q w , j n + q e , j n + S j n ,
T j n + 1 = E j n + 1 ρ C ,
Δ t ρ C ( Δ x ) 2 2 κ .
For the three-dimensional simulation, the bilayer model comprising burned and healthy tissue was employed. The burn geometry was modeled as a cosine cap, defined by Equation (22), where H c is the characteristic burn depth, with a value of 0.00125 m, and R c is the surface radius of the burn, equal to 0.025 m. The burn shape, illustrated in Figure 2, is a smooth, axially symmetric curve. As shown in the figure, the burn is deepest at the center and gradually decreases in depth toward the edges.
H = H c 1 + cos π ( x 2 + y 2 ) 2 R c 2 ,
Cylindrical coordinates (r, z, θ ) were adopted, and owing to axial symmetry, the solution depends only on the radial coordinate r and depth z, with no variation in the angular coordinate θ . The domain was discretized into control volumes shaped as cylindrical rings in the (r, z) plane. A structured mesh was constructed along the radial and axial directions to implement the finite volume method.
V i j = 2 π r Δ r Δ z
The temporal evolution of the system is governed by the conservation equation, Equation (24), where Δ t is the time step, and V i j denotes the control volume associated with each cell. This volume is defined in Equation (23) as a cylindrical ring with radial thickness Δ r , axial thickness Δ z , and radius r j . The terms q d , q u , q l , and q r represent the heat fluxes in the axial downward, axial upward, radial left, and radial right directions, respectively. These are computed from the temperature differences between adjacent nodes using Fourier’s law. The term S i j accounts for the additional heat input or loss within control volume V i j due to blood perfusion and metabolic heat generation. It is given by the expression Q m + W b C b ( T i j n T a ) .
( ρ C T ) i j n + 1 = ( ρ C T ) i j n + Δ t Δ V i j ( q w + q e + q u + q d ) i j n + Δ t S i j n .

3. Results

3.1. Effects of Perfusion on Skin Temperature

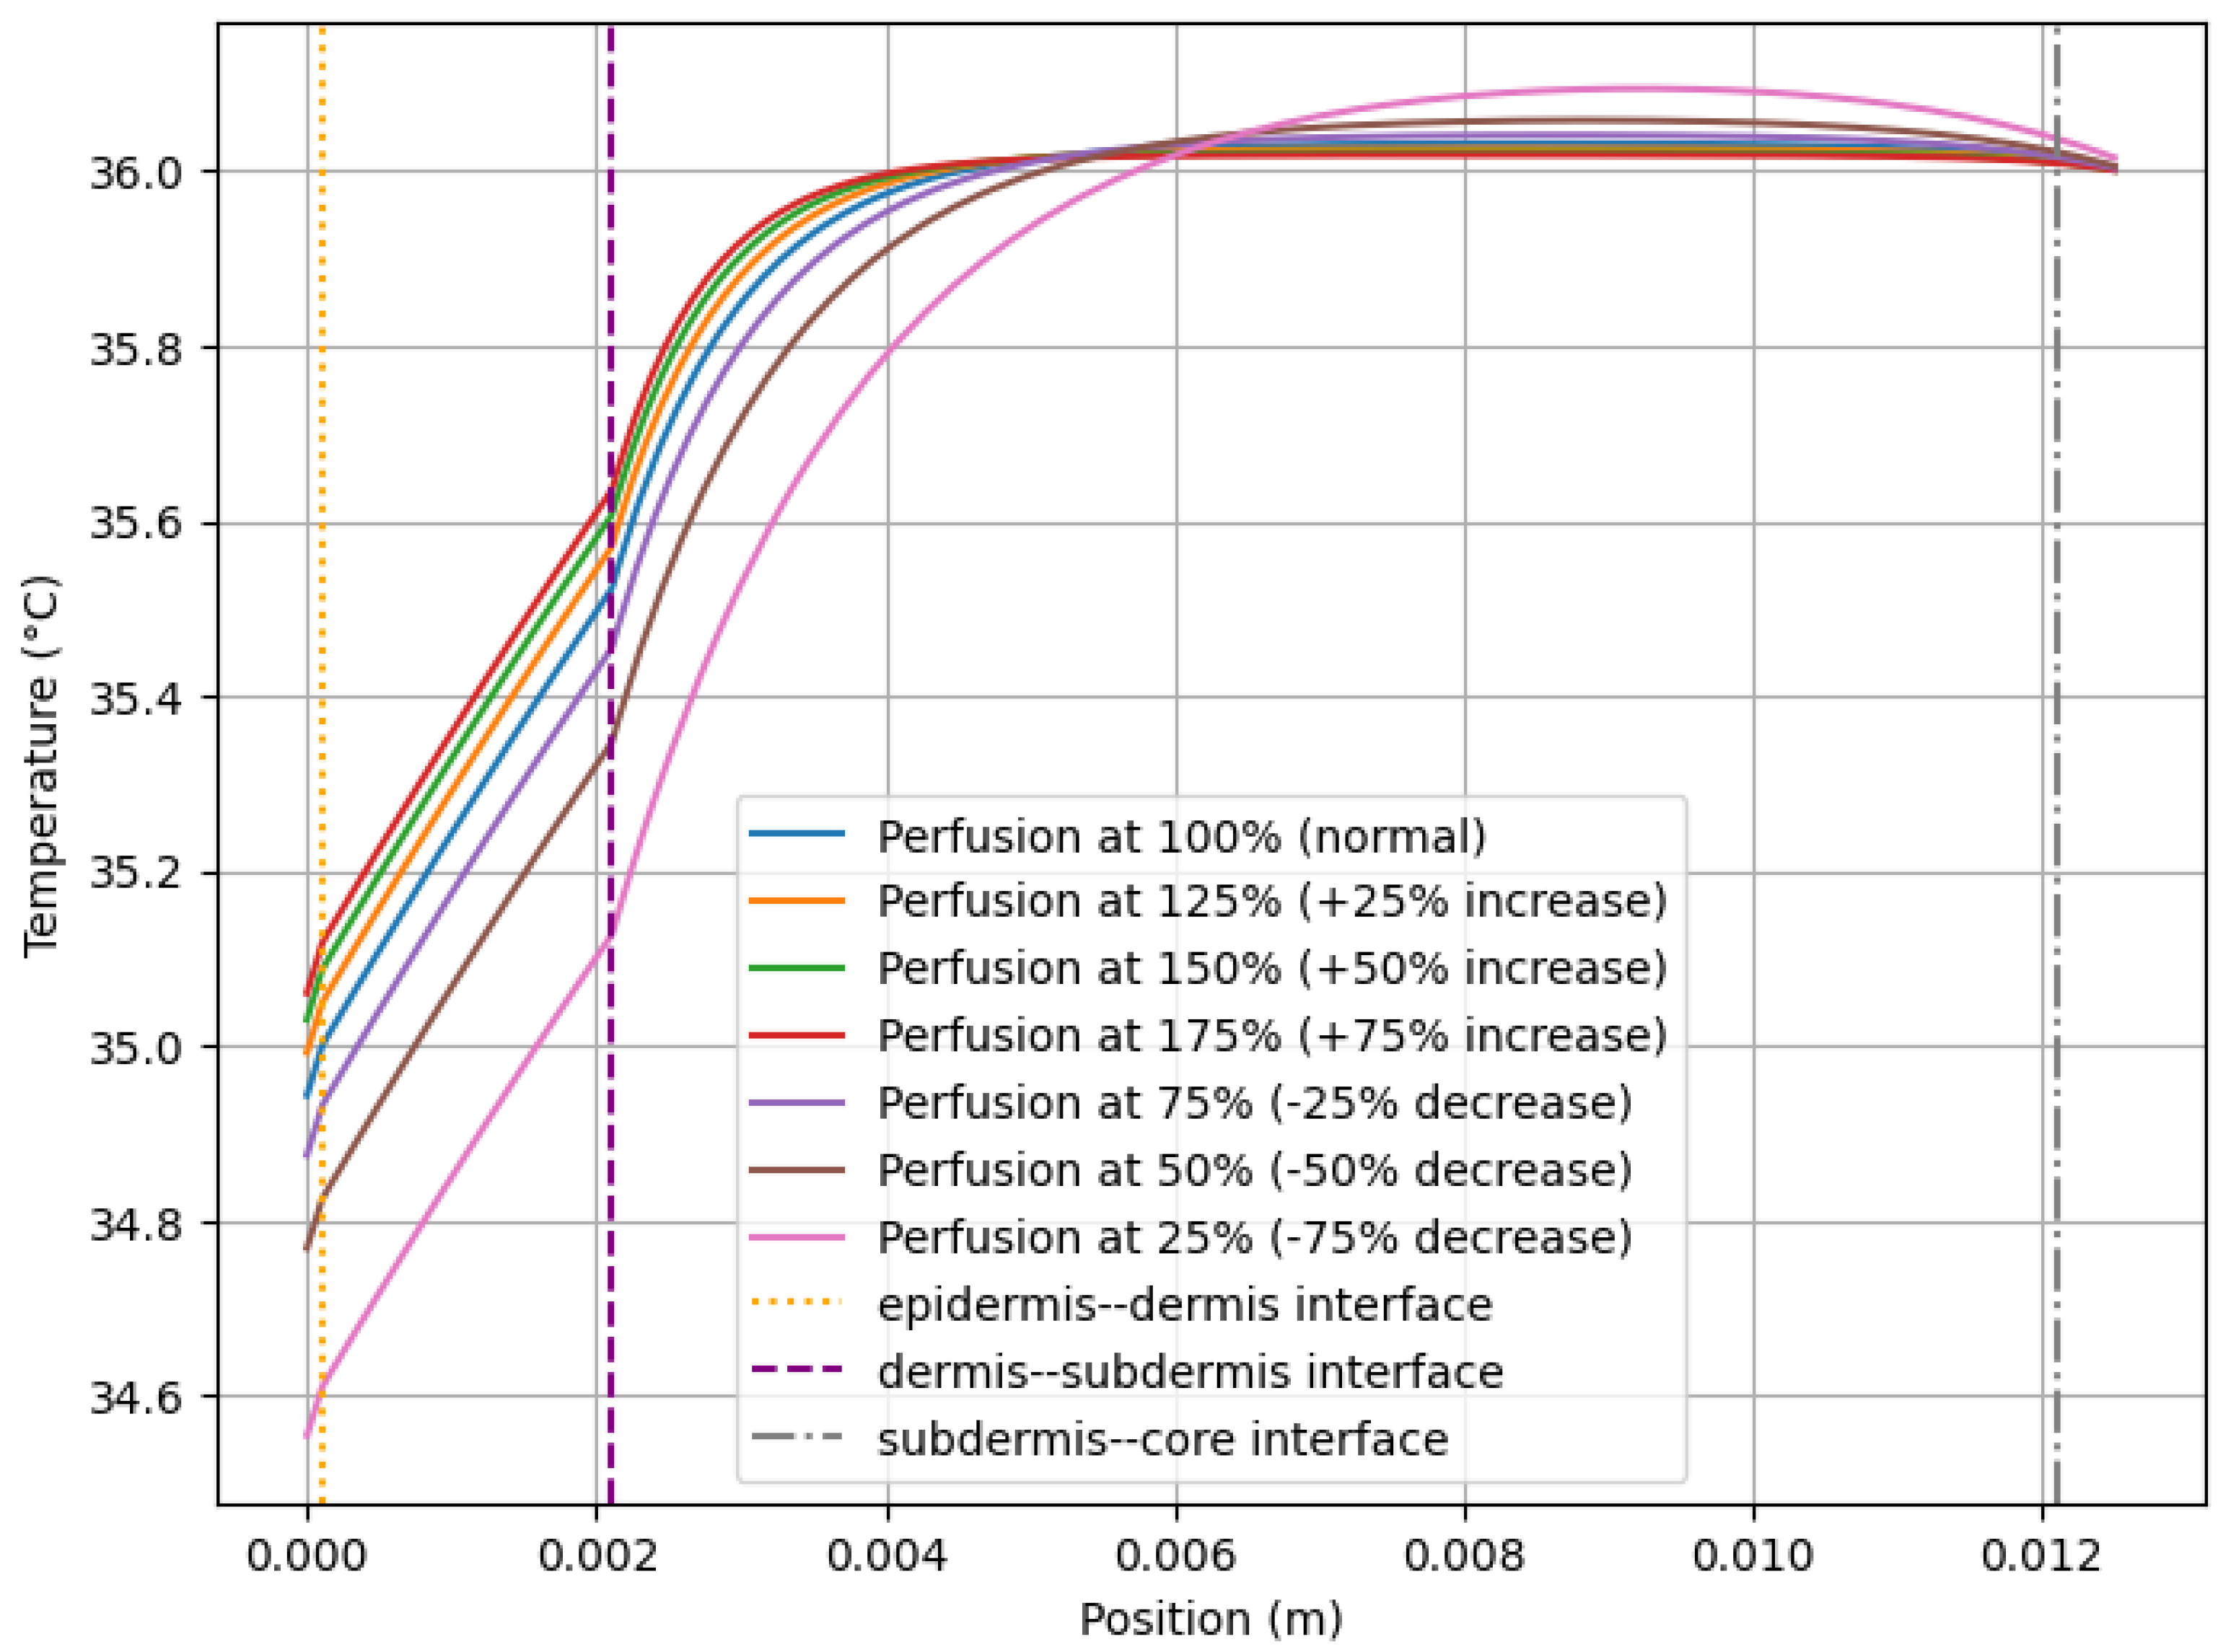
Blood perfusion is crucial for regulating tissue temperature through heat transfer via blood flow, especially in situations of thermal stress or inflammation, which justifies its inclusion in thermal models. Numerical simulations in the 1D multilayer model were conducted to analyze the effects of different blood perfusion rates on temperature distribution in healthy skin, with the parameters defined in Table 1. Average thermal values of healthy skin for the multilayer model were used (metabolic heat is not considered in this section) [8,9] based on an average perfusion rate, and its value was progressively reduced in the dermis and subdermis in increments of 25% until reaching 25% of its average value. Similarly, it gradually increased until reaching 175% of its average value. See the graph in Figure 3.
The simulations reveal that increased perfusion leads to elevated temperatures in superficial skin layers. At greater depths, however, temperatures converge toward arterial temperature, reflecting biological consistency with the proper functioning of the body’s internal systems under healthy conditions. These results align with physiological expectations as regions with higher perfusion tend to exhibit higher surface temperatures.
Validation was performed by comparing simulation outcomes with the facial thermographic images presented in [10] (see Figure 1 in the reference). The face region is particularly relevant for this analysis due to its unique vascular architecture and pronounced regional variations in blood perfusion. Thermographic observations revealed localized areas of higher temperature in regions with dense vascularization, such as the cheeks and forehead. In contrast, lower temperatures were observed in areas like the nose, which are associated with a marked reduction in perfusion. These thermal patterns are consistent with the trends observed in the simulations.
These results suggest that the inclusion of perfusion as a variable in thermal models improves their accuracy and applicability in medical contexts, highlighting the importance of considering perfusion variations in diagnostic applications, particularly when interpreting thermographic data for burn assessments.
In summary, the analysis demonstrates that blood perfusion significantly influences skin temperature, with potential implications for both modeling and clinical diagnostics. The consistency between simulations and thermographic observations provides a solid foundation for future research on thermal phenomena related to perfusion in healthy and injured tissues.

3.2. Numerical Solution in a 1D with and Without Immune Response (Steady-State)

One-dimensional numerical solutions for a bilayer system, with and without immune response, were compared to evaluate its impact on temperature distribution (see Figure 4). In the model that includes immune response, an additional term Q was incorporated into the Pennes bioheat equation to represent the heat generated by metabolic activity associated with local inflammation, a characteristic of first-degree burns and some superficial second-degree burns.
The thermal properties of the tissue layers—listed in Table 2 and taken from [48,49]—are identical in both models, except that metabolic heat generation is set to zero in the model without immune response.
The simulation results are presented in Figure 4: the red line represents the solution without immune response, while the blue line corresponds to the solution that includes immune response.
Although both exhibit similar trends, the solution with immune response shows a noticeable increase in temperature due to the metabolic heat generated by inflammation. The average temperature difference between the two solutions is 0.5540 °C.
These findings highlight the significant contribution of the immune response to the tissue’s thermal profile in accordance with the physiological behavior of inflamed tissue. This behavior is particularly relevant in thermographic diagnostics, where an anomalous increase in surface temperature may indicate areas of inflammation or tissue damage.
Figure 5 shows the steady-state one-dimensional numerical solution for a multilayer tissue model comprising the epidermis, dermis, subdermis, and inner tissue. The simulation was performed three conditions: no immune response, mild immune response, and severe immune response. Each condition considers a 10% increase in blood perfusion and a progressive rise in metabolic heat generation. The parameters used in these simulations, based on references [8,9], are presented in Table 1, Table 3 and Table 4.
In Figure 5, the blue curve represents the temperature distribution without an immune response, where only thermal conduction through the layers is considered. Introducing the immune response (orange and green curves) results in an overall temperature increase, with a more pronounced elevation in the case of a severe immune response. This behavior arises from the increased blood perfusion and metabolic heat generated by inflammation, intensifying heat transfer in the affected regions.
The bilayer model provides a simplified representation of thermal behavior, focusing on the influence of the immune response in a limited region of the tissue. In contrast, the multilayer model allows for a more detailed observation of how the immune response affects different regions of the tissue. In the multilayer model, the differences between mild and severe immune responses are more evident due to the gradual increase in perfusion and metabolic heat. Therefore, the multilayer model is better suited for analyzing thermal complexity in the context of deep or extensive tissue injuries, while the bilayer model is more practical for describing localized and less-complex scenarios.

3.3. Temperature Distribution in Multilayer Models for Different Types of Burns and Comparison with Thermographic Images

A numerical simulation was conducted to analyze the temperature distribution across the different layers of the skin for various types of burns. This analysis is based on the findings reported in [6], which establish the relationship between tissue temperature and the degree of burn severity. Figure 6 shows that first- and second-degree burns (yellow and green lines) exhibit higher surface temperatures than healthy tissue (blue line). In contrast, deep second-degree burns (red line) display lower temperatures in the outer layers and higher temperatures in the inner layers due to reduced blood perfusion in the more severely damaged superficial layers. Third-degree burns (purple line) show significantly lower surface temperatures, which is consistent with the extensive tissue damage and reduced blood perfusion caused by necrosis (tissue death). The results presented in Figure 6 were validated by comparing the simulated surface temperature for each burn type with the thermographic images reported in [6] (see Figure 2), where similar temperature patterns were observed depending on the burn severity. The simulation was initialized using the characteristic thermal parameters of healthy tissue in the studied region. These parameters were then adjusted for each burn type, as detailed in Table 5, to reflect changes in thermal properties such as thermal conductivity, blood perfusion, and heat capacity. The thermal properties of the skin change significantly depending on the type of burn due to associated physiological effects. In first-degree burns, thermal conductivity, blood perfusion, and heat capacity increase because of inflammation, increased blood flow, and water accumulation in the tissue. In superficial second-degree burns, these increases are smaller but reflect edema and increased blood flow with partial vascular damage. Conversely, in deep second-degree burns, these parameters decrease due to significant damage to the deep dermis, which impairs both heat conduction and transport. Finally, in third-degree burns, there is a drastic reduction in all thermal properties due to the complete destruction of tissue, cessation of blood flow, and water loss.
In superficial burns, such as first-degree burns and superficial second-degree burns, a significant increase in temperature was observed in the upper layers of the skin (epidermis and dermis). This phenomenon is attributed to the increased blood perfusion and metabolic heat generated by the local inflammatory response. This behavior is physiologically consistent, as inflammation in these types of burns contributes to the heating of the outer layers of the tissue. This effect is clearly visible in the thermographic images in Figures 2A), 2A1) shown in from [6], where the affected areas show higher surface temperatures. Table 6 presents the surface temperature ranges reported in the previously cited thermographic studies, compared to the values obtained from simulations performed for different degrees of burns and associated physiological responses.
In contrast, in severe burns, such as deep second-degree burns and third-degree burns, a marked decrease in temperature was detected in the upper layers (epidermis and dermis). This cooling effect results from vascular damage that significantly reduces blood perfusion in the affected regions, thereby decreasing both the supply of metabolic heat and the thermal transfer to these areas. This is evident in the thermographic images in Figures 2B1), 2C1) shown in [6], where the most severely burned regions exhibit surface temperatures between 23.2 °C and 26 °C (see Table 6).
In summary, the results reveal a direct correlation between burn severity and temperature variations across the different layers of the skin. This underscores the importance of integrating burn-specific thermal properties into numerical models. The comparison with thermographic images supports the validity of the simulated results and highlights the model’s utility in diagnosing and characterizing burns; these comparisons are summarized in Table 6.

3.4. Numerical Transient Solution in a 1D Bilayer for a First-Degree Burn

This section presents the transient evolution of temperature in a bilayer tissue system subjected to a first-degree burn, considering metabolic heat generation. Figure 7 shows the temperature distribution in the one-dimensional domain of the bilayer at different times. Initially, the temperature exhibits a steep gradient due to the thermal differential between the surface and the inner tissue layers. Over time, a generalized increase in temperature is observed throughout the domain, attributed to the metabolic heat generation associated with the tissue’s response to injury.
At intermediate times ( t = 100 s), the temperature begins to distribute more uniformly, reducing differences between the superficial and deeper regions. Finally, at longer times ( t = 1000 , t = 10 , 000 s), a homogeneous temperature profile is achieved, where temporal variations become negligible.
These results reflect the expected behavior in inflamed tissues, where heat generated by cellular metabolism contributes to thermal elevation and the homogenization of the temperature profile over time. This analysis is highly relevant for thermographic diagnostics as it allows the identification of thermal patterns related to the metabolic response in tissues affected by first-degree burns, where an inflammatory response increases perfusion and produces metabolic heat.

3.5. Numerical Solution in Three Dimensions for a First-Degree Burn

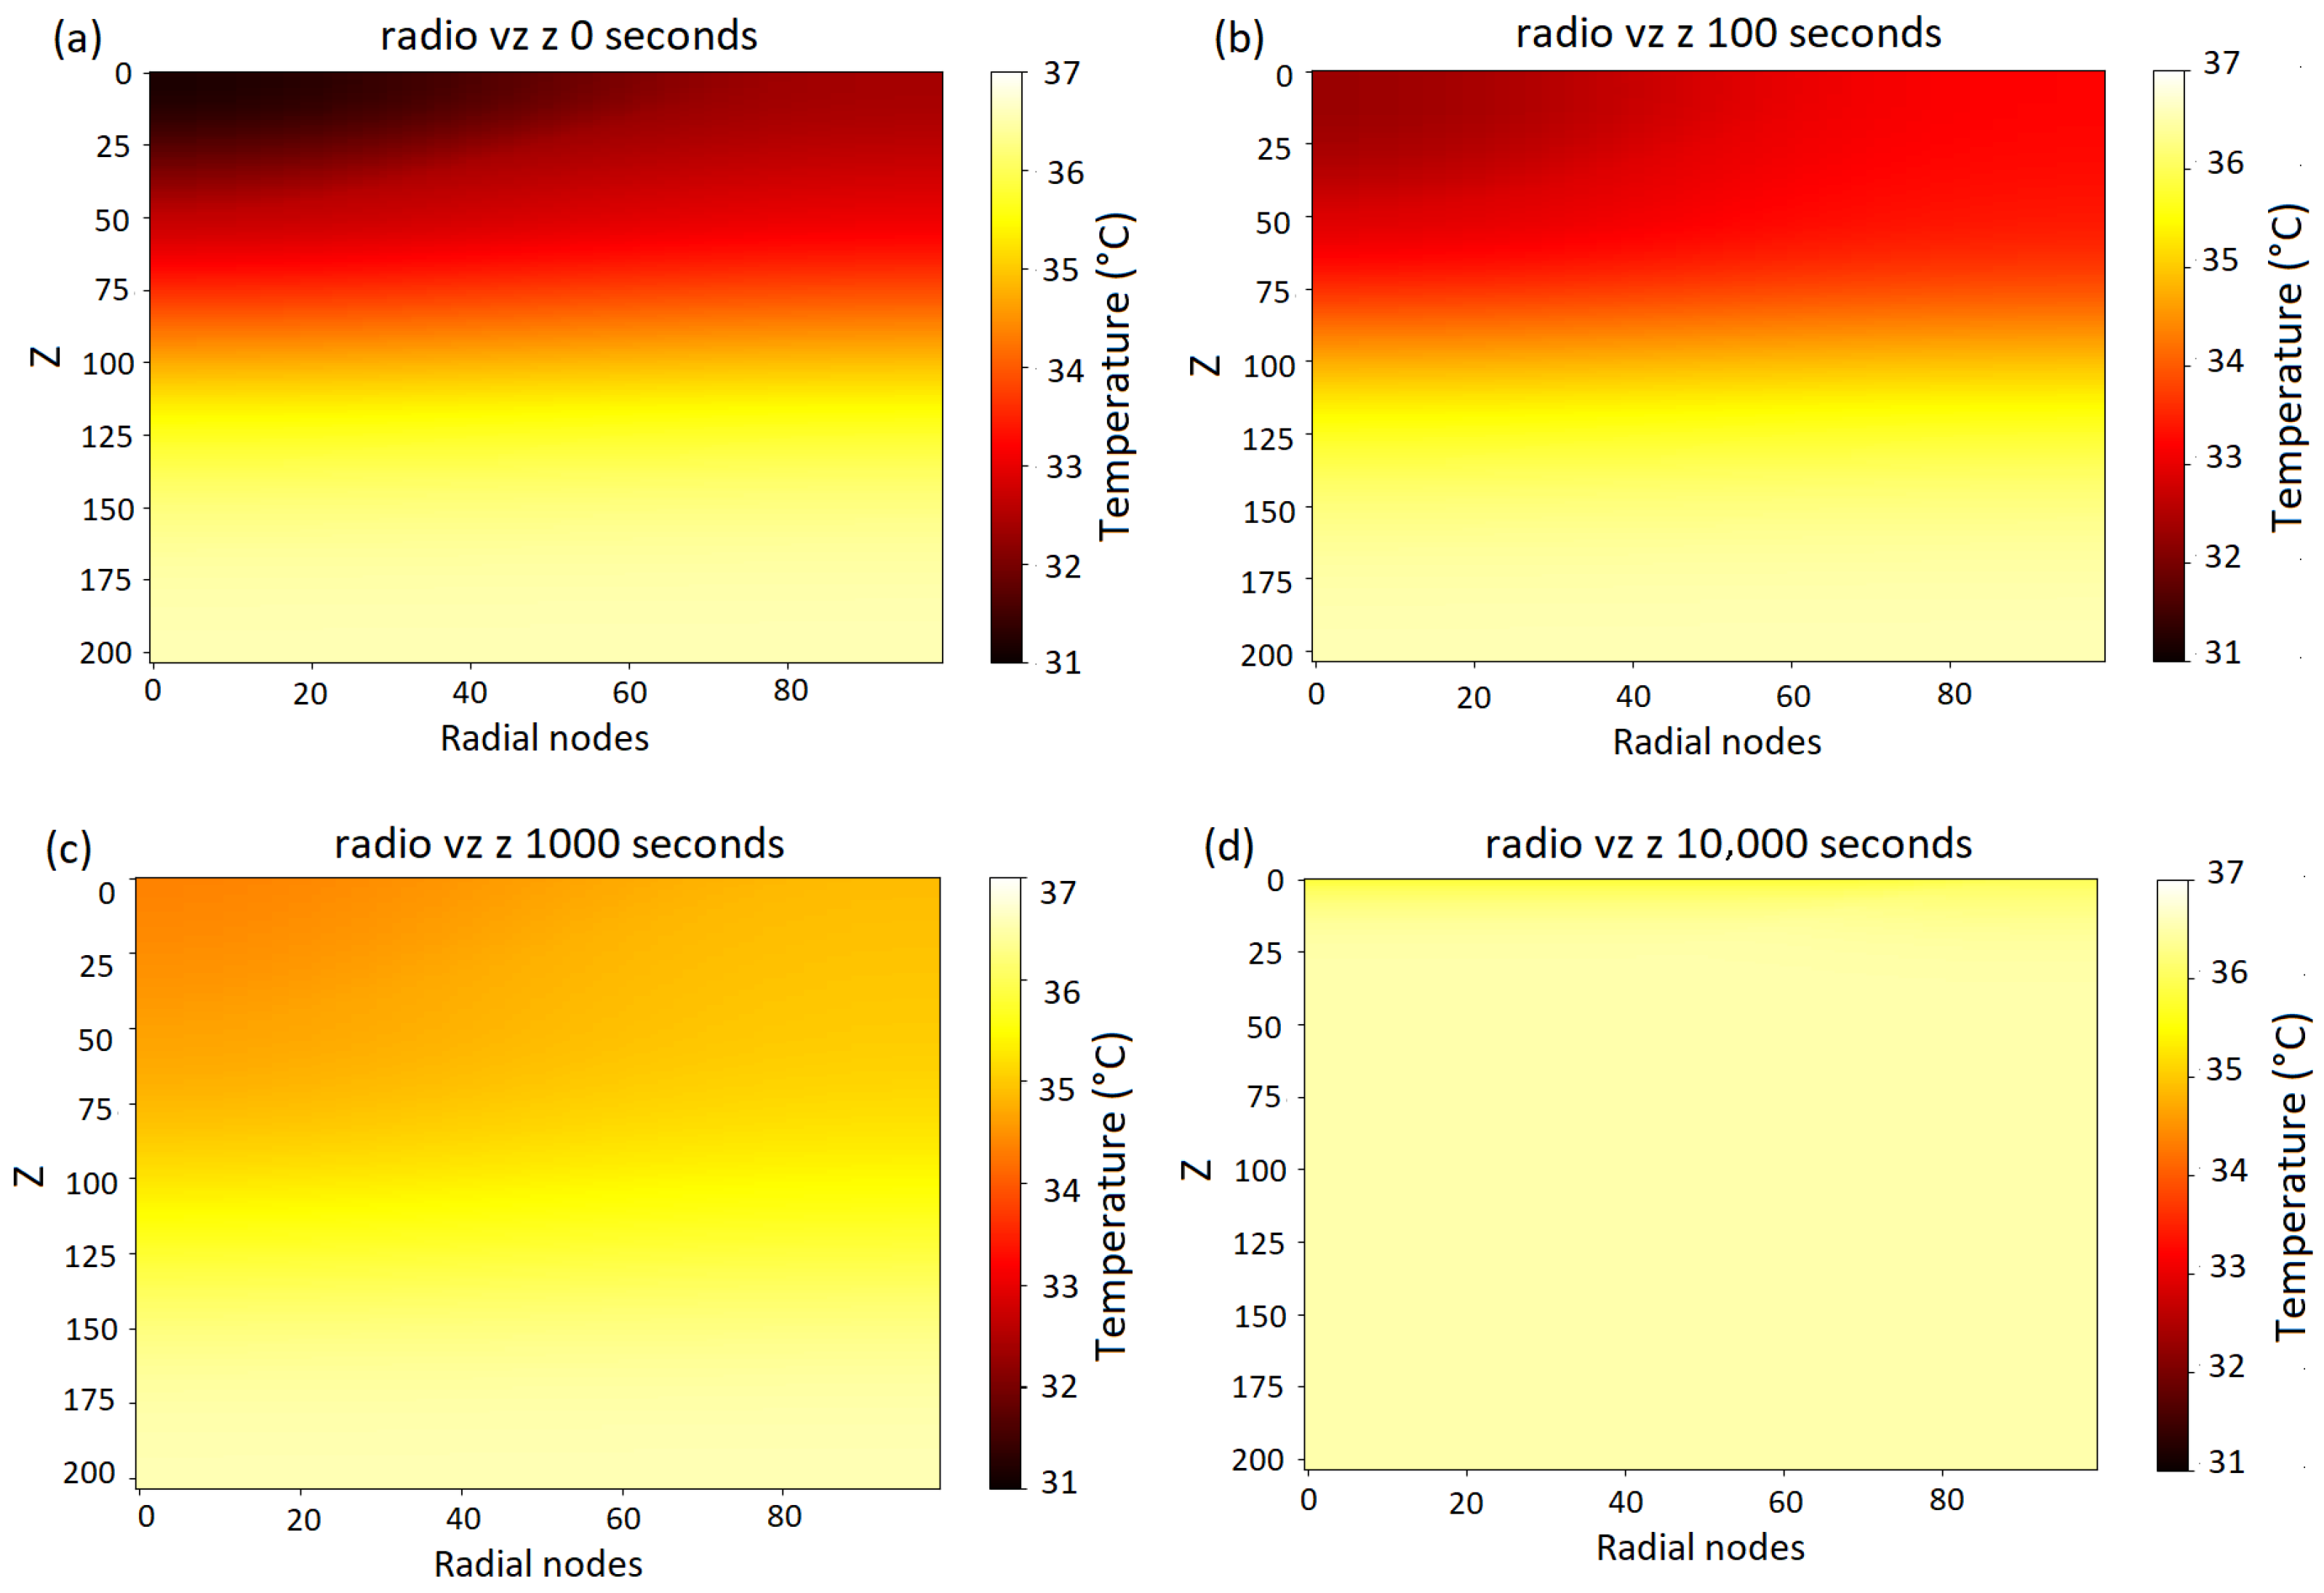
The numerical solution for a first-degree or a superficial second-degree burn was obtained using a three-dimensional model, as described in the Methodology section. The simulation began with the steady-state solution as the initial condition, providing a realistic starting point that reflected the equilibrium temperature distribution prior to the introduction of thermal disturbances. This steady-state condition served as a reference, while the temporal evolution highlighted the changes induced by the body’s immune response to the injury. The heat maps presented in Figure 8 illustrate the evolution of the temperature distribution along the radial direction (horizontal axis) and the azimuthal direction (vertical axis). The darker shades correspond to lower temperature regions, while the yellowish colors up to white indicate higher-temperature areas. The specific characteristics of each of the heat maps are presented in detail below:
1.
Initial Distribution: Temperature at t = 0 s: In Figure 8a, the initial temperature distribution shows the presence of a colder region associated with the initial absence of metabolic heat and normal blood perfusion. Inside the uninjured tissue, the temperature values remain within the expected physiological range, approximately between 36.5 °C and 35 °C, on the skin surface; however, the temperature oscillates between 31 °C and 32.5 °C, as observed in the blue curve in Figure 9.
2.
Progressive Temperature Increase: Temperature at t = 100 s: In Figure 8b, a general gradual rise in temperature is observed due to blood perfusion and the metabolic heat generated due to the immunological response, obtaining a surface temperature between 33 °C and 34 °C (red curve in Figure 9).
3.
Progressive Temperature Increase: Temperature at t = 1000 s: In Figure 8c, the temperature gradually homogenized throughout the bilayer. This process reduced the thermal gradient between the more superficial and deeper layers, raising the temperature. At this time step, a surface temperature between 34 °C and 35 °C is observed, represented by the green curve in Figure 9. Likewise, the internal temperature of the tissue oscillates between 34.2 °C and 37 °C, with the inner tissues having the highest temperature.
4.
Thermal Homogenization in Advanced Stages: Temperature at t = 10 , 000 s: Figure 8d shows a homogeneous temperature distribution within the tissue, along with an overall increase in temperature compared to previous time steps. Likewise, the surface temperature (represented by the pink curve in Figure 9) is close to 36 °C.
These observations are consistent with the expected physiological responses in burn-affected tissues. Moreover, the results provide a solid foundation for comparative analysis with thermographic data reported in the literature, see Table 6.
Table 6. Surface temperature ranges reported in thermographic studies compared with the values obtained in the simulations for different burn degrees and physiological responses.
ReferenceAffectionReported Temperature BehaviorSimulation Results
Figure 2A1 from [6]First and second-degree superficial burnsA surface temperature range between 30 °C and 36.1 °CValues were obtained from 35.4 °C for first-degree burns (yellow curve, Figure 6), 35.2 °C for superficial second-degree burns (green curve, Figure 6). Additionally, in Figure 9, an increase in surface temperature is observed from 31.0 to 32.4 °C up to 35.8 to 36.0 °C.
Figure 2B1,C1 from the reference [6]Deep second-degree burnSurface temperature reported between
25.3 °C and 32.8 °C
A value for the surface temperature of 32.1 °C shown in Figure 6 by the red curve.
Figure 2B1,C1 from the reference [6]Third-degree burnSurface temperature range of 18 °C–24 °CA surface temperature of 23.6 was obtained °C (purple curve, Figure 6).
Table 2 in [50]Inflammation/infection in the woundAn increase in temperature of 1.5 °C–2.3 °C was reported in cases of inflammation and of +4.5 °C in cases of infectionFigure 3, Figure 4 and Figure 5 show the temperature variations resulting from changes in blood perfusion and metabolic heat generation, which are associated with inflammation and infection processes. Figure 7 and Figure 8 show the increase in temperature of the burn over time.
Figure 1 in [10]Healthy tissueThe thermographic image of a face is shown, where temperature differences can be observed due to variations in physiology and perfusionFigure 3 shows the different temperature distributions resulting from the variability of blood perfusion.

4. Conclusions

This study demonstrates the effectiveness of the numerical solution in modeling the temperature distribution in burn-affected tissues, providing a valuable tool for estimating the degree of injury based on the resulting thermal patterns. The results reflect the impact of thermoregulatory alterations and changes in the thermal properties of burned skin. The importance of including the immune response in the models has been emphasized as metabolic heat generation due to inflammation significantly affects the surface thermal distribution of the damaged tissue. The accuracy of the finite volume method is validated since numerically the temperature range matches the thermograms reported in [6,11], with results showing high correlation between the two solutions. The analysis of the thermal response for different burn types—considering both one-dimensional and three-dimensional distributions—highlights the relevance of factors such as burn severity, tissue thickness, and anatomical location in determining characteristic thermal patterns. Assuming a cosine cap burn shape with axial symmetry in cylindrical coordinates, in the bilayer model, and considering characteristics associated with first-degree or superficial second-degree burns, a 3D analysis allows calculating the temperature distribution in the radial and azimuthal directions. It has been found that for burns of this type, there is a temperature increase over time, reflecting inflammation and heating phenomena in this type of injury, which can aggravate them. This allows surface temperature to be graphed and the results to be compared and validated with thermograms reported in the literature. This provides a useful tool for simulating the thermal patterns of burned tissue and thus estimating the damage to the affected tissue. These findings have potential to help in thermographic burn diagnosis as they allow the identification of specific thermal patterns associated with the depth and severity of tissue damage. In conclusion, the numerical models used in this work provide a powerful tool for the thermal analysis of burned tissues, opening new possibilities to improve diagnoses and treatments through the use of thermographic imaging and other monitoring methods. The ability to accurately simulate the thermal response and the effects of damage to the thermoregulatory system also offers significant advantages in the customization of treatments, helping to reduce uncertainty in clinical evaluations. Future research should focus on the integration of temperature gradients associated with thermoregulatory processes while explicitly accounting for individual physiological factors such as stress levels, body fat distribution, and blood pressure, among others. Furthermore, given the limitations of the finite volume method for irregular geometries, the consideration of non-uniform burn patterns is essential to enhance the accuracy and applicability of predictive models, allowing for a more comprehensive and personalized assessment of thermal injury dynamics.

Author Contributions

Conceptualization, S.E.V.-P.; methodology, S.E.V.-P. and H.E.G.-V.; software, A.S.R.-P. and S.E.V.-P.; validation, A.S.R.-P. and S.E.V.-P.; formal analysis, A.S.R.-P. and S.E.V.-P.; investigation, S.E.V.-P. and H.E.G.-V.; resources, S.E.V.-P. and H.E.G.-V.; data curation, A.S.R.-P.; writing—original draft preparation, A.S.R.-P.; writing—review and editing, S.E.V.-P. and H.E.G.-V.; visualization, H.E.G.-V.; supervision, S.E.V.-P.; project administration, H.E.G.-V.; funding acquisition, H.E.G.-V. All authors have read and agreed to the published version of the manuscript.

Funding

This research received no external funding.

Data Availability Statement

The original contributions presented in this study are included in the article. Further inquiries can be directed to the corresponding author.

Conflicts of Interest

The authors declare no conflicts of interest.

References

  1. Moore, K.L.; Dalley, A.F.; Agur, A.M.R. Anatomía con Orientación Clínica, 7th ed.; Wolters Kluwer: Barcelona, España, 2013. [Google Scholar]
  2. Żwierełło, W.; Piorun, K.; Skórka-Majewicz, M.; Maruszewska, A.; Antoniewski, J.; Gutowska, I. Burns: Classification, pathophysiology, and treatment: A review. Int. J. Mol. Sci. 2023, 24, 3749. [Google Scholar] [CrossRef]
  3. Smolle, C.; Cambiaso-Daniel, J.; Forbes, A.A.; Wurzer, P.; Hundeshagen, G.; Branski, L.K.; Huss, F.; Kamolz, L.P. Recent trends in burn epidemiology worldwide: A systematic review. Burns 2017, 43, 249–257. [Google Scholar] [CrossRef]
  4. Heimbach, D.; Engrav, L.; Grube, B.; Marvin, J. Burn depth: A review. World J. Surg. 1992, 16, 10–15. [Google Scholar] [CrossRef]
  5. Atiyeh, B.S.; Gunn, S.W.; Hayek, S.N. State of the art in burn treatment. World J. Surg. 2005, 29, 131–148. [Google Scholar] [CrossRef]
  6. Martínez-Jiménez, M.A.; Ramirez-GarciaLuna, J.L.; Kolosovas-Machuca, E.S.; Drager, J.; González, F.J. Development and validation of an algorithm to predict the treatment modality of burn wounds using thermographic scans: Prospective cohort study. PLoS ONE 2018, 13, e0206477. [Google Scholar] [CrossRef] [PubMed]
  7. Carrière, M.E.; de Haas, L.E.; Pijpe, A.; Meij-de Vries, A.; Gardien, K.L.; van Zuijlen, P.P.; Jaspers, M.E. Validity of thermography for measuring burn wound healing potential. Wound Repair Regen. 2020, 28, 347–354. [Google Scholar] [CrossRef] [PubMed]
  8. Dang, J.; Lin, M.; Tan, C.; Pham, C.H.; Huang, S.; Hulsebos, I.F.; Yenikomshian, H.; Gillenwater, J. Use of infrared thermography for assessment of burn depth and healing potential: A systematic review. J. Burn. Care Res. 2021, 42, 1120–1127. [Google Scholar] [CrossRef]
  9. Simmons, J.D.; Kahn, S.A.; Vickers, A.L.; Crockett, E.S.; Whitehead, J.D.; Krecker, A.K.; Lee, Y.L.; Miller, A.N.; Patterson, S.B.; Richards, W.O.; et al. Early assessment of burn depth with far infrared time-lapse thermography. J. Am. Coll. Surg. 2018, 226, 687–693. [Google Scholar] [CrossRef]
  10. Salazar-López, E.; Domínguez, E.; Ramos, V.J.; De la Fuente, J.; Meins, A.; Iborra, O.; Gálvez, G.; Rodríguez-Artacho, M.; Gómez-Milán, E. The mental and subjective skin: Emotion, empathy, feelings and thermography. Conscious. Cogn. 2015, 34, 149–162. [Google Scholar] [CrossRef] [PubMed]
  11. Avilés-García, Á.; López-Casanova, P.; Segura-Jordá, G.; Verdú-Soriano, J.; Berenguer-Pérez, M. Termografía infrarroja como método de diagnóstico en quemaduras: Una revisión exploratoria de la literatura. Gerokomos 2024, 35, 62–66. Available online: https://www.researchgate.net/publication/378766590_Termografia_infrarroja_como_metodo_de_diagnostico_en_quemaduras_una_revision_exploratoria_de_la_literatura#fullTextFileContent (accessed on 1 July 2024).
  12. Mason, B.; Graff, A.; Pegg, S. Colour thermography in the diagnosis of the depth of burn injury. Burns 1981, 7, 197–202. [Google Scholar] [CrossRef]
  13. Ng, E.; Tan, H.; Ooi, E. Boundary element method with bioheat equation for skin burn injury. Burns 2009, 35, 987–997. [Google Scholar] [CrossRef]
  14. Pennes, H.H. Analysis of tissue and arterial blood temperatures in the resting human forearm. J. Appl. Physiol. 1948, 1, 93–122. [Google Scholar] [CrossRef]
  15. Velázquez-Pérez, S.E. Solución analíTica de la Respuesta téRmica de Piel Quemada Expuesta a Una Energía de Radiación. Master’s Thesis, Universidad Autónoma de San Luis Potosí, Facultad de Ingeniería, Instituto de Metalurgia, San Luis Potosí, Mexico, 2011. [Google Scholar]
  16. Wang, Y.; Lu, X.; Zheng, W.; Wang, Z. Bio-thermal response and thermal damage in biological tissues with non-equilibrium effect and temperature-dependent properties induced by pulse-laser irradiation. J. Therm. Biol. 2023, 113, 103541. [Google Scholar] [CrossRef]
  17. Gupta, P.K.; Singh, J.; Rai, K. Numerical simulation for heat transfer in tissues during thermal therapy. J. Therm. Biol. 2010, 35, 295–301. [Google Scholar] [CrossRef]
  18. Durkee, J., Jr.; Antich, P.; Lee, C. Exact solutions to the multiregion time-dependent bioheat equation. II: Numerical evaluation of the solutions. Phys. Med. Biol. 1990, 35, 869. [Google Scholar] [CrossRef]
  19. Marin, M.; Hobiny, A.; Abbas, I. Finite element analysis of nonlinear bioheat model in skin tissue due to external thermal sources. Mathematics 2021, 9, 1459. [Google Scholar] [CrossRef]
  20. Trefilov, A.M.I.; Oane, M.; Duta, L. The Key Role of Thermal Relaxation Time on the Improved Generalized Bioheat Equation: Analytical Versus Simulated Numerical Approach. Materials 2025, 18, 3524. [Google Scholar] [CrossRef] [PubMed]
  21. Ali, L.; Apsari, R.; Abbas, A.; Tak, P. Entropy generation on the dynamics of volume fraction of nano-particles and coriolis force impacts on mixed convective nanofluid flow with significant magnetic effect. Numer. Heat Transf. Part A Appl. 2024, 1–16. [Google Scholar] [CrossRef]
  22. Weinbaum, S.; Jiji, L.; Lemons, D. Theory and experiment for the effect of vascular microstructure on surface tissue heat transfer—Part I: Anatomical foundation and model conceptualization. J. Biomech. Eng. 1984, 106, 321–330. [Google Scholar] [CrossRef]
  23. Khaled, A.R.; Vafai, K. The role of porous media in modeling flow and heat transfer in biological tissues. Int. J. Heat Mass Transf. 2003, 46, 4989–5003. [Google Scholar] [CrossRef]
  24. Becker, S.M.; Kuznetsov, A.V. Heat Transfer and Fluid Flow in Biological Processes; Academic Press: Cambridge, MA, USA, 2014. [Google Scholar] [CrossRef]
  25. Singh, M. Modified Pennes bioheat equation with heterogeneous blood perfusion: A newer perspective. Int. J. Heat Mass Transf. 2024, 218, 124698. [Google Scholar] [CrossRef]
  26. Ferrás, L.L.; Ford, N.J.; Morgado, M.L.; Nóbrega, J.M.; Rebelo, M.S. Fractional Pennes’ bioheat equation: Theoretical and numerical studies. Fract. Calc. Appl. Anal. 2015, 18, 1080–1106. [Google Scholar] [CrossRef]
  27. Romeo, L.M.; Pastor, M.Á. Simulación del Comportamiento Térmico del Ser Humano. 2004. Available online: https://www.researchgate.net/publication/228838164_Simulacion_del_comportamiento_termico_del_ser_humano (accessed on 1 July 2024).
  28. Kolarsick, P.A.; Kolarsick, M.A.; Goodwin, C. Anatomy and physiology of the skin. J. Dermatol. Nurses Assoc. 2011, 3, 203–213. [Google Scholar] [CrossRef]
  29. Fu, M.; Weng, W.; Yuan, H. Numerical simulation of the effects of blood perfusion, water diffusion, and vaporization on the skin temperature and burn injuries. Numer. Heat Transf. Part A Appl. 2014, 65, 1187–1203. [Google Scholar] [CrossRef]
  30. Jiang, S.; Ma, N.; Li, H.; Zhang, X. Effects of thermal properties and geometrical dimensions on skin burn injuries. Burns 2002, 28, 713–717. [Google Scholar] [CrossRef]
  31. Lee, K.C.; Joory, K.; Moiemen, N.S. History of burns: The past, present and the future. Burn. Trauma 2014, 2, 2321–3868. [Google Scholar] [CrossRef] [PubMed]
  32. Papini, R. Management of burn injuries of various depths. BMJ 2004, 329, 158–160. [Google Scholar] [CrossRef]
  33. Acha, B.; Serrano, C.; Fondón, I.; Gómez-Cía, T. Burn depth analysis using multidimensional scaling applied to psychophysical experiment data. IEEE Trans. Med. Imaging 2013, 32, 1111–1120. [Google Scholar] [CrossRef] [PubMed]
  34. Lipkin, M.; Hardy, J.D. Measurement of some thermal properties of human tissues. J. Appl. Physiol. 1954, 7, 212–217. [Google Scholar] [CrossRef] [PubMed]
  35. Madhvapathy, S.R.; Arafa, H.M.; Patel, M.; Winograd, J.; Kong, J.; Zhu, J.; Xu, S.; Rogers, J.A. Advanced thermal sensing techniques for characterizing the physical properties of skin. Appl. Phys. Rev. 2022, 9, 041307. [Google Scholar] [CrossRef]
  36. Ezzat, M.A.; AlSowayan, N.S.; Al-Muhiameed, Z.I.; Ezzat, S.M. Fractional modelling of Pennes’ bioheat transfer equation. Heat Mass Transf. 2014, 50, 907–914. [Google Scholar] [CrossRef]
  37. Charny, C.K. Mathematical models of bioheat transfer. Adv. Heat Transf. 1992, 22, 19–155. [Google Scholar] [CrossRef]
  38. Yue, K.; Zhang, X.; Yu, F. An analytic solution of one-dimensional steady-state Pennes’ bioheat transfer equation in cylindrical coordinates. J. Therm. Sci. 2004, 13, 255–258. [Google Scholar] [CrossRef]
  39. Zhao, J.J.; Zhang, J.; Kang, N.; Yang, F. A two level finite difference scheme for one dimensional Pennes’ bioheat equation. Appl. Math. Comput. 2005, 171, 320–331. [Google Scholar] [CrossRef]
  40. Romero-Méndez, R.; Jiménez-Lozano, J.N.; Sen, M.; González, F.J. Analytical solution of the Pennes equation for burn-depth determination from infrared thermographs. Math. Med. Biol. A J. IMA 2010, 27, 21–38. [Google Scholar] [CrossRef]
  41. Eymard, R.; Gallouët, T.; Herbin, R. Finite volume methods. Handb. Numer. Anal. 2000, 7, 713–1018. [Google Scholar] [CrossRef]
  42. Diller, K.R.; Hayes, L. A finite element model of burn injury in blood-perfused skin. J. Biomech Eng. 1983, 105, 300–307. [Google Scholar] [CrossRef]
  43. Moukalled, F.; Mangani, L.; Darwish, M. The finite volume method. In The Finite Volume Method in Computational Fluid Dynamics: An Advanced Introduction with OpenFOAM® and Matlab; Springer International Publishing: Gewerbestrasse, Cham, Switzerland, 2016; pp. 103–135. [Google Scholar] [CrossRef]
  44. Saptaningtyas, F.; Setyarsi, A. Finite Volume Method with Explicit Scheme Technique for Solving Heat Equation. J. Phys. Conf. Ser. 2018, 1097, 012089. [Google Scholar] [CrossRef]
  45. Dokos, S. Modelling Organs, Tissues, Cells and Devices: Using Matlab and Comsol Multiphysics; Springer: Berlin/Heidelberg, Germany, 2017. [Google Scholar] [CrossRef]
  46. Diller, K.R. Modeling thermal skin burns on a personal computer. J. Burn. Care Rehabil. 1998, 19, 420–429. [Google Scholar] [CrossRef]
  47. Versteeg, H.K.; Malalasekera, W. An Introduction to Computational Fluid Dynamics: The Finite Volume Method, 2nd ed.; Pearson: London, UK, 2007. [Google Scholar]
  48. Liu, J.; Chen, X.; Xu, L.X. New thermal wave aspects on burn evaluation of skin subjected to instantaneous heating. IEEE Trans. Biomed. Eng. 1999, 46, 420–428. [Google Scholar] [CrossRef] [PubMed]
  49. Rabin, Y.; Stahovich, T.F. Cryoheater as a means of cryosurgery control. Phys. Med. Biol. 2003, 48, 619. [Google Scholar] [CrossRef] [PubMed]
  50. Fridberg, M.; Bafor, A.; Iobst, C.A.; Laugesen, B.; Jepsen, J.F.; Rahbek, O.; Kold, S. The role of thermography in assessment of wounds. A scoping review. Injury 2024, 55, 111833. [Google Scholar] [CrossRef] [PubMed]
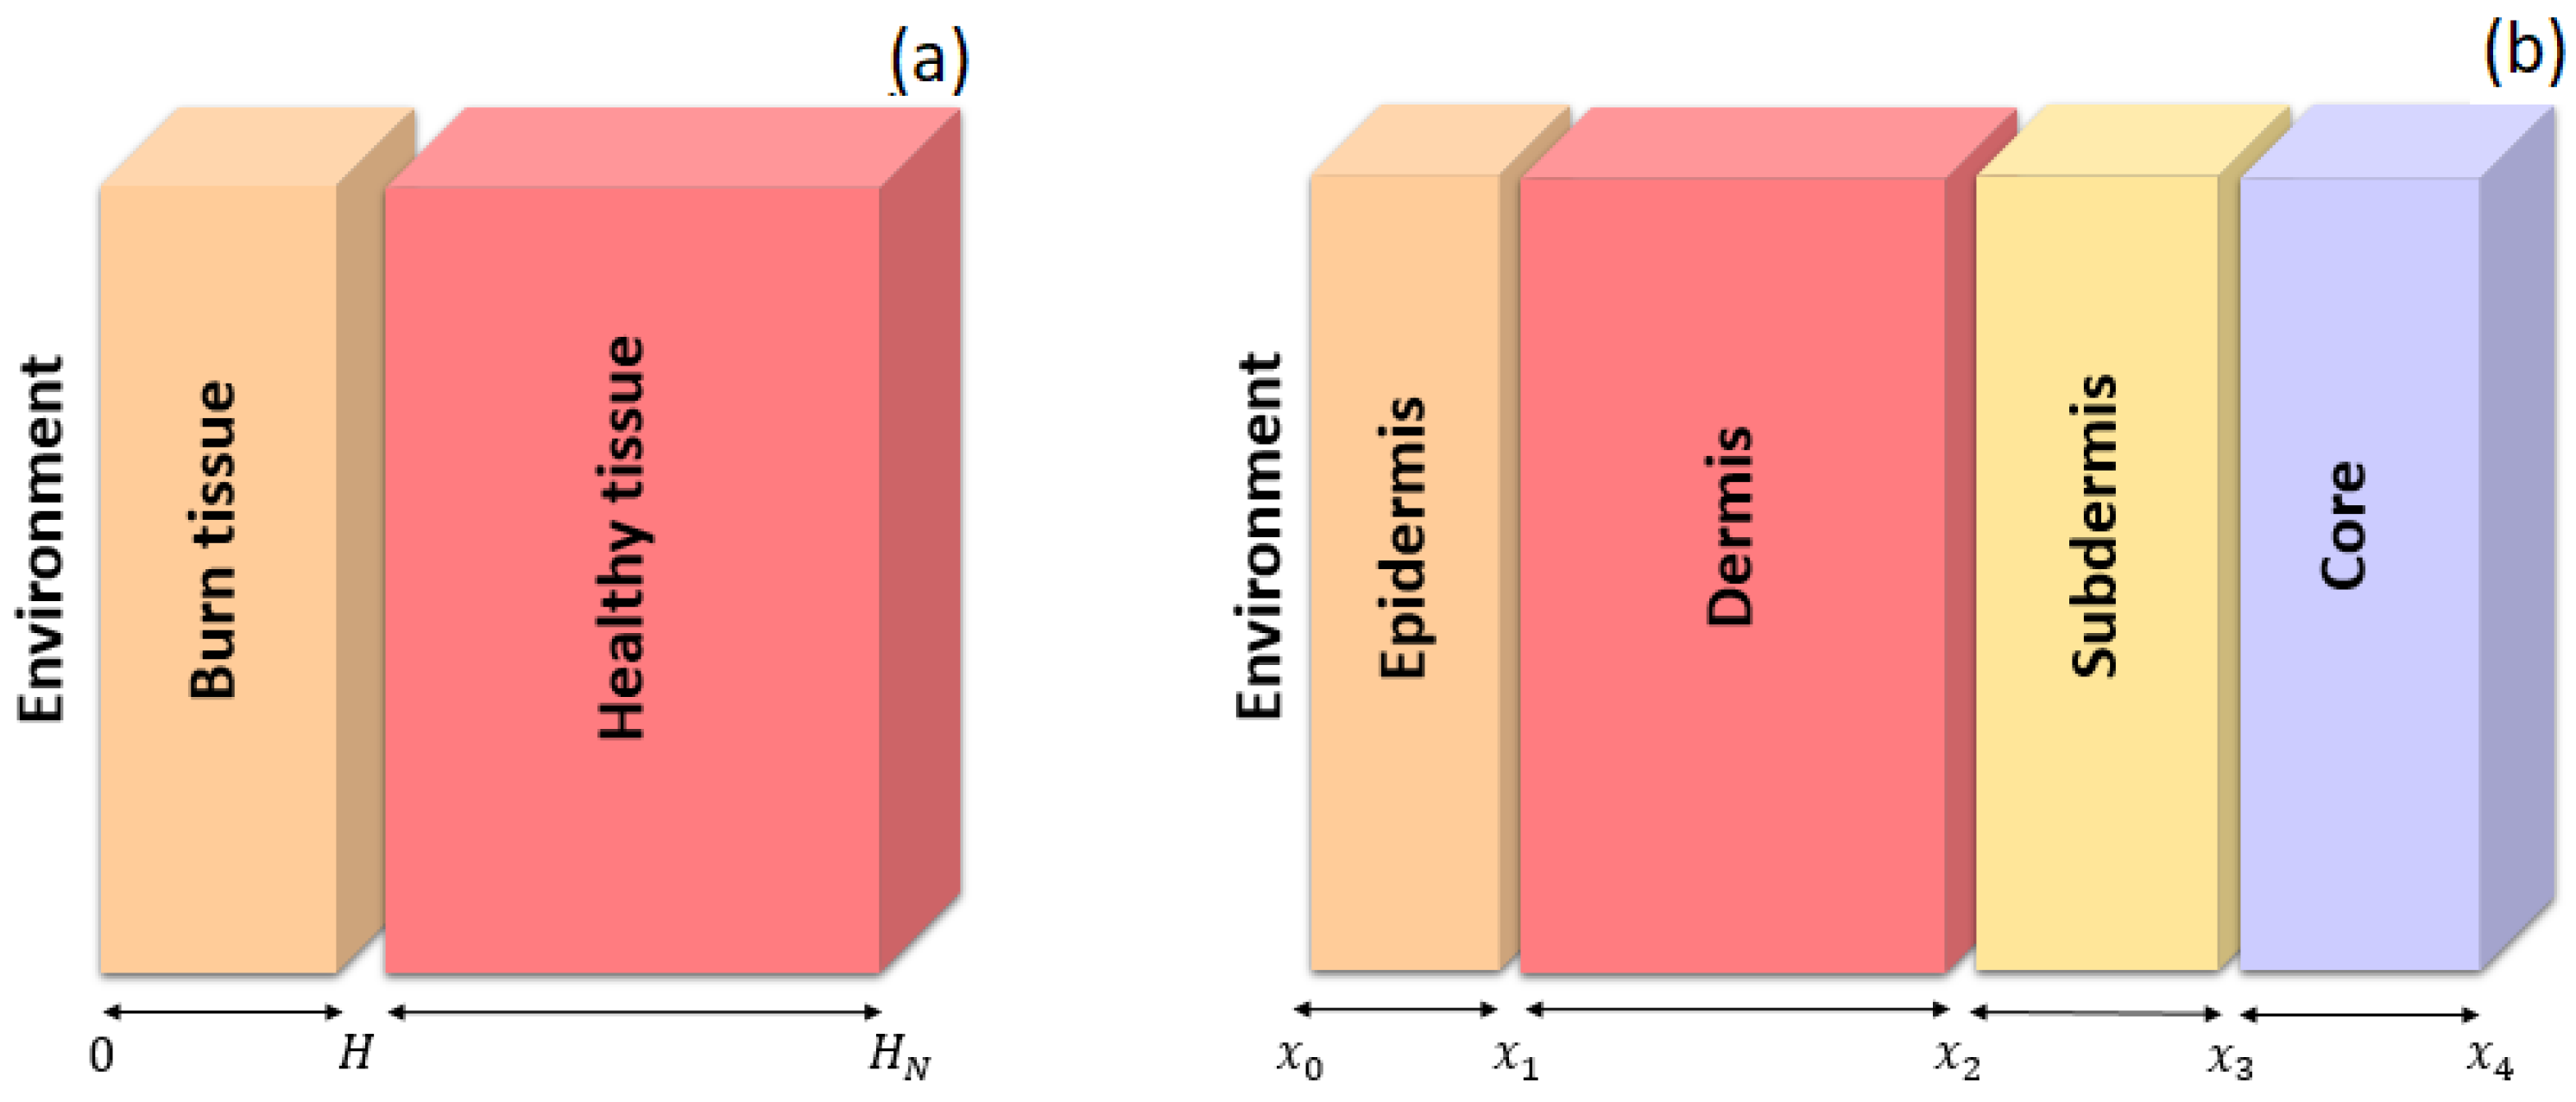
Figure 1. (a) Schematic of the bilayer domain for burned and healthy tissue; (b) schematic of the multilayer skin domain (epidermis, deep and superficial dermis, subdermis, and inner tissue/core).
Dynamics 05 00041 g001
Figure 2. Three-dimensional representation of the burn geometry considered in the model given by the Equation (22).
Dynamics 05 00041 g002
Figure 3. One-dimensional thermal distribution across different layers of skin under varying perfusion rates with the parameters defined in Table 1; the dotted vertical lines represent the boundaries between the layers defined by Equations (9)–(12).
Dynamics 05 00041 g003
Figure 4. Numerical solution for the steady-state condition in a bilayer of burned and healthy tissue, showing the immune response (blue line) and no immune response (red line), for the parameters defined in Table 2.
Dynamics 05 00041 g004
Figure 5. Steady-state one-dimensional numerical solution for a multilayer tissue model under varying immune response conditions, with the parameters defined in Table 1 without immune response, mild immune response in Table 3, and for severe immune response in Table 4. The dotted vertical lines represent the boundaries between the layers defined by Equations (9)–(12).
Dynamics 05 00041 g005
Figure 6. Temperature distribution for different burn types in the arm–hand region, including five scenarios: healthy tissue, first-degree burns, superficial second-degree burns, deep second-degree burns, and third-degree burns, with the parameters defined in Table 1 for immune response, mild immune response in Table 3, and for severe immune response in Table 4. The dotted vertical lines represent the boundaries between the layers defined by Equations (9)–(12).
Dynamics 05 00041 g006
Figure 7. Temperature distributions across the bilayer for a first-degree burn at different times (t = 0, t = 10, t = 100, t = 1000, and t = 10,000 s) due to heat generation from the immune response for the parameters defined in Table 2.
Dynamics 05 00041 g007
Figure 8. Three-dimensional numerical solution heat maps of depth vs. radius for a first-degree burn in the bilayer model with immune response at different times: (a) t = 0, (b) t = 100, (c) t = 1000, and (d) t = 10,000 s. The parameters for the bilayer are defined in Table 2.
Dynamics 05 00041 g008
Figure 9. Surface temperature graph along the radius for the same times t = 0, 100, 1000, and 10,000 s. The parameters for the bilayer are defined in Table 2.
Dynamics 05 00041 g009
Table 1. Parameters for healthy tissue.
ParameterEpidermisDermisSubdermis
Layer thicknesses (m)0.00010.0020.004
Thermal conductivity ( κ ) (W/m·K)0.30.40.19
Blood perfusion (W) (kg/m3s)00.001250.0025
Specific heat (C) (J/kg·K)359033002500
Density ( ρ ) (kg/m3)100010001000
Metabolic heat (Q) (W/m3)0200200
Table 2. Characteristics of the bilayer for burned and healthy tissue.
ParameterLayer 1 (Burned Region)Layer 2 (Healthy Region)
Blood perfusion (W)0.5 kg/m3s0.5 kg/m3s
Specific heat (C)4200 J/kg·K4200 J/kg·K
Thermal conductivity ( κ )0.1 W/m·K0.2 W/m·K
Density ( ρ )1000 kg/m31000 kg/m3
Metabolic heat (Q)200 W/m3200 W/m3
Table 3. Parameters for skin with mild immune response, mild blood perfusion, and severe blood perfusion on a multilayer model.
ParameterEpidermisDermisSubdermis
Layer thicknesses (m)0.00010.0020.004
Thermal conductivity ( κ ) (W/m·K)0.30.40.19
Blood perfusion (W) (kg/m3s)00.0013750.00275
Specific heat (C) (J/kg·K)359033002500
Density ( ρ ) (kg/m3)100010001000
Metabolic heat (Q) (W/m3)0200500
Table 4. Parameters for skin with severe immune response.
ParameterEpidermisDermisSubdermis
Layer thicknesses (m)0.00010.0020.004
Thermal conductivity ( κ ) (W/m·K)0.30.40.19
Blood perfusion (W) (kg/m3s)00.00151250.003025
Specific heat (C) (J/kg·K)359033002500
Density ( ρ ) (kg/m3)100010001000
Metabolic heat (Q) (W/m3)0200600
Table 5. Thermal property modifications for different burn degrees. The table shows the variations in thermal conductivity ( κ ), blood perfusion (W), heat capacity (C), and metabolic heat (Q) for first-degree, superficial second-degree, deep second-degree, and third-degree burns, reflecting the physiological changes in the tissue because of each burn type.
Type of Burn( κ ) (% Change)(W) (% Change)(C) (% Change)(Q) (% Change)
First-degree+10% to +20%+50% to 100%+10%+ 30% to 60%
Second-degree (superficial)0%+30% to 70%+10% to +20%+10% to 30%
Second-degree (deep)−10% to −50%−30% to −90%−40% to −80%−70%
Third-degree−50% to −80%−100% (0% flow)−80% to −100%−100% (null metabolic heat)
Disclaimer/Publisher’s Note: The statements, opinions and data contained in all publications are solely those of the individual author(s) and contributor(s) and not of MDPI and/or the editor(s). MDPI and/or the editor(s) disclaim responsibility for any injury to people or property resulting from any ideas, methods, instructions or products referred to in the content.