Abstract
Chemical synaptic coupling is crucial in the nervous system. This paper establishes a chemical synaptic Chay neuronal coupling system using the Heaviside function and analyzes the equilibrium point’s type and stability based on the Jacobian matrix. Matcont simulation found that the Hopf bifurcation point transformed into a Bogdanov–Takens bifurcation point under the influence of chemical coupling strength, and a series of saddle-node bifurcation points are generated. The discharge time history of the system and the evolution of single-parameter bifurcation behavior were numerically simulated through a language and Matlab. The parameter matching results indicated that the chemical synaptic reversible potentials and synaptic thresholds were −15 mV and −35 mV, respectively. The bifurcation behavior and its changes under multi-parameter conditions were studied by using various numerical methods such as time series diagrams, bifurcation diagrams, and two-parameter diagrams. The similarity function identified key factors affecting synchrony in a chemical synaptic coupling system. Results indicate that synchrony primarily depends on chemical coupling strength, with other factors providing positive feedback to enhance it. The simulation of the spatiotemporal dynamics in a chemically synaptic coupled network of 2000 ring neurons revealed that altering the maximum conductance at local positions within the network can induce the generation of traveling waves. Strong coupling strengths ensure that the induced traveling waves propagate at greater velocities and can excite and awaken a larger number of neurons in a shorter time frame. The nonlinear properties of chemical synaptic neuronal system offer essential tools and foundations for studying neurobiology and brain dynamics.
1. Introduction
The nervous system contains many individual nerve cells, also known as neurons [1,2,3], and countless neurons in the nervous system are connected by synapses to form a neural network [3]; the neural system unifies and regulates the neural network coupled with neuron synapses so that the neurons can transmit information and work together [4,5]. Various species exhibit a wide range of physiological activities, which express in the nervous system as neuronal discharge activity and neural network clustering [6,7,8,9]. These synaptically linked brain networks are consistently regulated by the nervous system [10,11]. Investigating the firing activity of individual neurons is crucial for precisely assessing and comprehending the process of electrical activity in the nervous system [12,13]. Neurons are theorized as dynamic entities that can be mathematically represented using differential equations. Examining differential equations helps in quantitatively comprehending the diverse discharge characteristics intrinsic to neuronal electrical processes [3].
In 1952, Hodgkin and Huxley pioneered the use of a mathematical model to depict neurons, deriving their findings from experiments on similar circuits and large axons in gun squids. They identified two primary metal ion types, potassium and sodium ion channels, in the neuronal membrane and created the Hodgkin–Huxley (HH) model [4]. Nonetheless, the HH neuron model’s formulation is too intricate to derive its numerical solution via computation, necessitating simplification to align more closely with actual nerve cells. Fitzhugh [14], in 1961, enhanced and streamlined the state variables, leading to a decrease in the complexity of neuron models by replacing the initial variables with these improved ones, and in 1962, Nagumo et al. proposed an equivalent circuit for the model put forward by Fitzhugh. Therefore, the renowned Fitzhugh–Nagumo (FHN) neuron model was formed [14]. Subsequently, Chay introduced a novel state variable for calcium channels, derived from calcium-related potassium channels, and developed a fresh model: the Chay neuron model [15,16]. Furthermore, Morris and Lecar formulated the Morris–Lecar (ML) model, drawing on the electrical behavior of neurons in Arctic geese’s muscle fibers [17], whereas Hindmarsh and Rose created the Hindmarsh–Rose (HR) neuron model as a more basic version [5]. The above mathematical models of neurons are often used to study the nonlinear characteristics of neurons.
Chemical synapses are one of the most prevalent means of information transmission in the nervous system [7]. Chemical synapses generate nonlinear and time-varying postsynaptic currents through neurotransmitter release. Their dynamics involve multi-scale processes such as presynaptic membrane potential, neurotransmitter release probability, and receptor kinetics. Mathematical modeling can quantitatively describe these interactions and translate biological mechanisms into computable variables [18,19,20]. Recently, scientists have made notable progress in analyzing the active interplay among neurons linked via chemosynaptic pathways. Shi [21] investigated the synchronization of cluster discharges in two neurons coupled via a chemical synapse, as well as the electrophysiological properties of these cluster discharges in the coupled neurons. Gong et al. [22] studied the synchronization of firing caused by chemical synaptic connections in a scale-free network of Hodgkin–Huxley neurons with chemical time delay. It was discovered that the synchronization leap caused by chemical coupling was time-dependent and varied greatly across different time delay durations. Trenholm S. et al. [9] investigated the peak synchronization of nerve cell firing in the context of different spatiotemporal patterns of electrical and chemical synaptic activity, which triggered synchronized dendritic spikes in a subregion of the coupled dendritic tree under the combined influence of electrical and chemical synapses. The ensuing nonlinear integrals caused fine synchronization in the cell’s spiking output, with the level of synchronization inversely proportional to the rate of spiking. Kundu S.G.D. [8] explored how electrical and chemical synapses in a layered neuronal network synchronize, revealing that electrical synapses diminish the network’s dynamic firing rhythm, while chemical synapses, via interlayer connections, enhance the network’s firing rhythm. Li [13] used logistic Euler inverse mapping and series transformations to model basic chemical synapses and designed a series of synaptic circuits, providing readers with an in-depth understanding of neuromorphic electronic systems [23,24,25,26,27,28]. According to the physiological characteristics of chemical synapses, it is necessary to establish a mathematical model that can portray the operational mechanism of chemical synapses [29,30,31,32,33,34,35,36]. Therefore, in this paper, we introduced the Heaviside function to establish a nonlinear model that conforms to the physiological characteristics and then incorporated this model into the Chay neuron model and established the Chay neuron coupled system, whose coupling mode is chemical synapse coupling [37]. Based on this, the firing rhythm and a series of nonlinear properties of the coupled neuron system were studied in detail [38,39,40].
The structure of this paper is as follows: The second part establishes the chemical synapse model based on the Heaviside function, introducing the chemical synapse model into the Chay neuron model to establish the chemical coupling model of Chay neuron, and single-parameter matching is used to obtain the values of chemical synapse-related parameters. In the third part, the types and stability of the equilibrium points of the system are theoretically solved and analyzed, and the bifurcation characteristics of the system under two-parameter variation are analyzed. In the fourth part, the similarity function is constructed, and the bifurcation diagrams (single-parameter and two-parameter) and the synchronization similarity function diagrams (2-dimensional and 3-dimensional) are plotted to investigate the main factors affecting the synchronization of the chemical coupling system. Moreover, we studied the spatiotemporal dynamic transfer process of the ring under chemical coupling. In the fourth part, we offer conclusions of the research conducted.
2. Materials and Methods
2.1. Modeling of Chemical Synapses
Synapses are sites of functional contact between neurons; neurons are connected through synapses, and information transfer is carried out through synapses. Therefore, information transfer between neuronal models requires the establishment of a suitable synapse model. The most common mechanisms of synaptic information transfer are electrical and chemical synapses. Electrical synapses are mainly reflected in the interrelationship between neurons, specifically the size of the coupling strength, so their expression is generally linear, and their information transfer is bidirectional, while chemical coupling refers to a unidirectional relationship between the neurons, and the information transfer is generally with a time delay. The mechanism of chemical synapses is that when certain conditions are reached, an interaction between neurons occurs. Chemical synapses can be categorized as either excitatory or inhibitory and are generally determined by the reversible potentials of chemical synapses. In order to facilitate the study of the mechanism of chemical synapses, a mathematical model of chemical synapses is constructed through the Heaviside function, as follows:
where denotes the strength of chemical synaptic coupling, and denotes the degree of association, perception, and dependence between neurons. denotes the synaptic reversible potential, which determines the nature of chemical synaptic coupling. denotes the Heaviside function.
2.1.1. Modeling by Heaviside Function
The process by which a signal abruptly transitions from one state to another is described by the Heaviside function, which is also referred to as its unit step function, step function, or switching function. Assuming that two neurons are coupled by chemical synapses, it is necessary to find exactly one state in which the former neuron acts on the latter neuron, so the Heaviside function is used here to describe the chemical synaptic operation mechanism, and its expression is shown below:
where denotes the relationship between the membrane potential and the synaptic threshold. In neuronal chemical coupling, when the membrane potential of a presynaptic neuron is greater than the synaptic threshold, the preneuron transmits information to the postneuron. Therefore, the independent variable for the Heaviside function is defined as
In scenario , the front neuron influences the back neuron for information transfer, whereas in scenario , there is no inter-neuron information exchange.
Although the Heaviside function reflects the chemical synaptic operation mechanism, it is defective in practical quantitative studies. Because the step function is a discontinuous function, using it as a medium to study the kinetic properties of coupled systems brings computational difficulties and results in errors.
2.1.2. Introducing Sigmoid Function Smooth Modeling
To address the aforementioned issue, this paper presents a smoothing function derived from the Sigmoid function [41,42], aimed at refining the Heaviside function with incremental characteristics and defining the Sigmoid function in this manner:
where is a parameter, and is an independent variable. The Sigmoid function of the chemical synapse is derived from the ratio constant , so the Sigmoid function of the chemical synapse is
where i = 1, 2 denotes the number of neurons, and σ denotes the ratio constant for the onset of chemical synaptic excitation or inhibition. denotes the synaptic threshold, and denotes the time lag during chemical synaptic transmission.
2.1.3. Fitting
Equation (5) shows that the ratio constant of the onset of excitation or inhibition can determine the degree of fit to the Heaviside function. The next step is to explore which value of gives the best fit of the Sigmoid function to the Heaviside function.
Based on the characteristics of Equation (5), and for the purpose of numerical simulation, distinct values = 1, 3, 5, 10, 20, 30 are selected when , as illustrated in Figure 1, is represented as a graph depicting the adaptation curves to the Heaviside function under varying values, where the black solid line represents the plot of the chemical synaptic model concerning the variable and the parameter , built by the Heaviside function, which is observed as a step function lacking smoothness; the model is further processed with smoothing corrections. The Heaviside function was smoothed using the Sigmoid function to obtain a modified model of a continuous and smooth chemical synapse, as shown in Figure 1b. The solid red line represents the chemical synaptic model’s curve at , revealing a significant deviation from the Heaviside function’s curve pre-adjustment. Altering the parameter revealed a steady rise in , enhancing the Sigmoid function’s suitability to the Heaviside function. Additionally, the discrepancy between the adjusted curve and its pre-adjustment counterpart diminishes progressively, and when , they nearly align, yielding an outstanding fitting outcome.
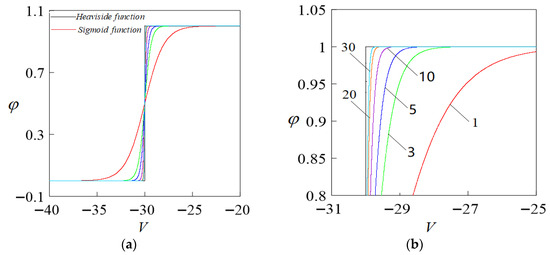
Figure 1.
Degree of fit to the Heaviside function when taking different values (a). Degree of fit graph. (b) Localized enlarged view on (a).
In summary, when , the smoothing effect is significant, providing a basis for determining the value of parameter in the following sections.
2.2. Modeling of Chemical Coupling of Chay Neurons
The Chay model is a more accurate representation of the intricate firing rhythm of the neuron since it is based on excitable cells of potassium ion channels connected to calcium ions. The Chay chemical coupling system, which is made up of two neurons connected by chemical synapses, is produced by introducing the previously described chemical synapse model into the Chay model. Since a neuron is used to symbolize a system in this study, the coupling system is made up of two subsystems, as can be seen in its formulation below:
where subscript denotes the number of coupled neurons; here, denotes the chemical synapse model. and C are the membrane potential, voltage-dependent probability of potassium channel opening, and intracellular membrane calcium ion concentration. is the external stimulus current. , and denote the maximal conductances of the potassium channel, the mixed sodium–calcium channel, the calcium channel, and the leaky ion channel, respectively. , and are the reversal potential of ion channels and the calcium ion reversal potentials, respectively, denotes the ratiometric constant of intracellular membrane calcium ion efflux. denotes the proportionality constant.
and in the equation are the steady-state values of the activation and inactivation probabilities of the mixed Na-ion-Ca ion channel, respectively, and is the steady-state value of the potassium ion channel opening probability . The specific expressions are
where is the relaxation time of the gating potential potassium ion channel and follows the following equation:
Here, is the parameter related to the time constant of the potassium ion channel. The values of each parameter in the Chay model are shown in Table 1 below.

Table 1.
Parameter values of Chay model.
2.3. Chemical Synapse Parameter Matching
Important parameters in chemical synapses mainly include ratio constant , synaptic threshold , and synaptic reversible potential . The value range of these parameters is unknown. In order to obtain an accurate value range, parameter matching is performed for these three important parameters.
The interspike interval (ISI) represents the time difference between two instances when a neuron reaches its action potential, specifically before and after changes in its membrane potential. The bifurcation diagram of the interspike interval serves as an important tool for investigating the firing regularity of neurons. To investigate the influence of the chemical synaptic parameter on the firing of the coupled system, a two-parameter bifurcation diagram controlled by the parameters and (representing the reversal potential of the mixed sodium–calcium ion channel) was obtained through numerical simulation. Such bifurcation diagrams typically exhibit the transitions of the system’s dynamic behaviors under different parameter combinations.
Based on the values of the parameters in Table 1, through numerical simulation, the peak-to-peak bifurcation in Figure 2a of a single parameter in the interval is first obtained. As gradually decreases, the neuronal coupling system undergoes a transition from regular change to chaotic state, the discharge cycle goes through period 1 → period 2 → period 4 → period 8 → period 16 → chaos → period 3, the system enters chaotic discharge through doubling bifurcation plus period, and after the chaotic paroxysmal phenomenon appears, the reduced period stabilizes at period 3 discharge. As the parameters change within a certain range, the neuron system undergoes a series of nonlinear phenomena. Here, the value range of parameter only represents the mathematical parameter range in the Chay model and does not have actual biological significance.
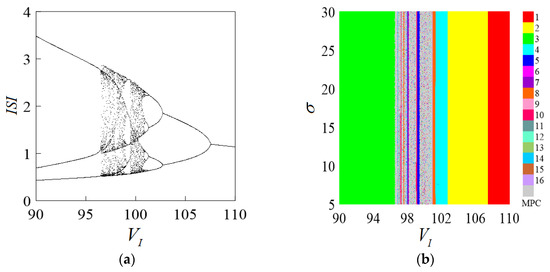
Figure 2.
Parametric ISI bifurcation diagram. (a) Bifurcation diagram of . (b) The two-parameter bifurcation diagram of .
2.3.1. Determination of
The ratio constant σ is an important parameter in chemical synapses, and its value is the judgment of the fitting effect of the chemical synapse model. As the value of σ gradually increases within a certain range, the fitting effect will be better. Will σ affect the dynamic behavior of the coupled system?
Numerical calculations show that the two-parameter interspike interval (ISI) bifurcation diagram for σ and is as shown in Figure 2b. It can be found that the parameter affecting the firing of the neuronal coupled system is only , which is further confirmed by comparing with Figure 2a. The variation process of the parameter is consistent with the single-parameter bifurcation, indicating that the parameter σ has no effect on the Chay neuronal system. According to the conclusion fitted by the Sigmoid function smoothing model, the value of σ is determined to be 10, and the parameter σ will not be further discussed.
2.3.2. Determination of
The parameter is the synaptic threshold, which is another important parameter in the chemical synapse.
Hypothesis: When the membrane potential of the presynaptic neuron exceeds the threshold , the presynaptic neuron begins to act on the postsynaptic neuron. Therefore, according to the change interval of the membrane potential, the corresponding change interval of the synaptic threshold is deduced.
An external current is applied to the neuron system to excite I to make the neuron generate action potential. The discharge process of the membrane potential of the Chay neuron system evolving with time is obtained by numerical simulation. As shown in Figure 3, the system membrane potential fluctuates between to generate action potential. When , the neuron is in a resting state. Since the membrane potential varies between [−45, −20], the value of the synaptic threshold correspondingly varies between the intervals (−45, −20]. The two-parameter bifurcation is shown in Figure 3b. It can be clearly seen that when the value of changes between the intervals (−45, −20), the changes in the values of other parameters will not cause changes in the discharge rhythm, which further confirms that the synaptic threshold is . The value range is (−45, −20).
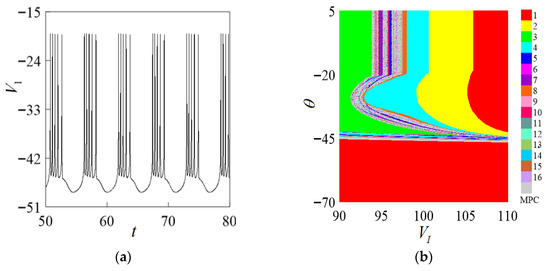
Figure 3.
Determination diagram of parameter . (a) Discharge time course diagram of the system. (b) The two-parameter bifurcation diagram of .
In the range of the synaptic threshold (−45, −20)’s discrete values −40, −35, −30, and −25, the bifurcation diagram of the synaptic reversible potential with respect to the interspike interval (ISI) is obtained as shown in Figure 4 shown. As the synaptic value gradually increases, the shape of the bifurcation diagram of the synaptic reversible potential changes. When = −35, the dynamic behavior of the periodic bifurcation diagram is richer, as shown in Figure 4b. The touch reversible potential is in the [−60, 60] region. As the value of the control parameter increases, the entire system completes the transformation from periodic cluster discharge→chaotic cluster discharge→chaotic peak discharge→periodic peak discharge. Therefore, when = −35, the discharge activity of the system changes more obviously, and the nonlinear dynamic phenomena are the most abundant.

Figure 4.
Bifurcation diagram on synaptic reversible potentials in (a) = −40, (b) = −35, (c) = −30, (d) = −25.
2.3.3. Determination of
Similarly, for the reversible synaptic potential , it depends on the type of anterior synaptic neuron and receptor, and the type of chemical coupling is excited or inhibited, which depends on the value of the reversible synaptic potential.
It is hypothesized that when , the chemical synaptic coupling is excitatory, and vice versa, inhibitory, where is the resting potential of a single neuron. As can be seen from Figure 3a, the neuron is in a resting state at V = −45, so the chemical synaptic coupling is excitatory when .
This paper studies the synaptic coupling of excitatory chemistry, so when is −20, −15, −10, and −5, we study the bifurcation of the system with respect to the synaptic threshold. Through numerical simulation, we obtain the bifurcation diagram of the synaptic threshold as shown in Figure 5. The shape of the bifurcation diagram of the synaptic threshold changed obviously with the increase in the value. As shown in Figure 5a, the range of changes is concentrated, and change activities are limited. As shown in Figure 5b, the synaptic threshold has abundant firing activity between the intervals [−45, −20]. As shown in Figure 6a,c, when = −43, the system is in a state of periodic 5-cluster discharge, the value continues to increase, the shape of the bifurcation diagram basically does not change, and the change in no longer affects the bifurcation of the synaptic value. Therefore, when the synaptic reversible potential is −15, the system discharge rhythm is the most abundant.

Figure 5.
Bifurcation change process about under discrete (a) = −20, (b) = −15, (c) = −10, (d) = −5.

Figure 6.
Validated phase and course diagrams on the ratio constant. (a) Time course diagram for = −43. (b) Time course diagram for = −30. (c) Phase diagram for = −43. (d) Phase diagram for = −30.
The following two conclusions are obtained by matching the above parameters: First, the ratio constant σ is only used to fit the chemical synaptic model with the Heaviside function but has no effect on the Chay neuronal coupling system. Second, the chemical synaptic reversible potential and synaptic threshold will have an impact on the properties of the neuronal system, and the parameters can be obtained as shown in Table 2.

Table 2.
Values of chemical synaptic parameters taken.
Based on the parameter matching results in Table 2, the numerical simulation shows the two-parameter ISI bifurcation of the synaptic reversible potential and the threshold value in Figure 7. It can be seen that along the black solid line arrow direction from the upper right corner to the lower left corner, the system transitions from period 1 to period 8 through period-doubling bifurcation, subsequently entering chaotic discharge; then, the system undergoes a very long chaotic burst phenomenon and then returns to the periodic discharge through reverse signal bifurcation near the lower left corner. The discharge process shows rich dynamic characteristics. The reason for this phenomenon can be attributed to the strong nonlinearity of chemical synapses.
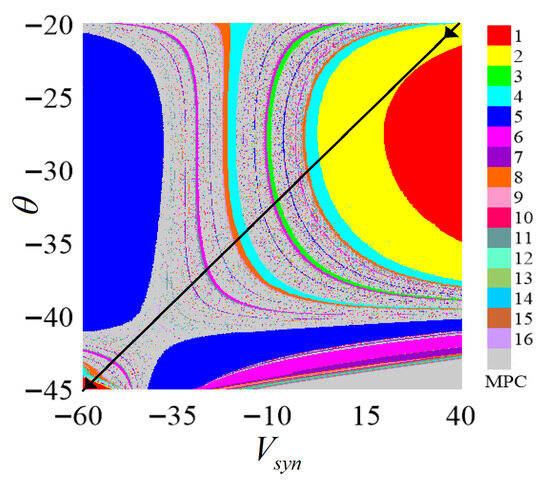
Figure 7.
Two-parameter bifurcation of the chemical synaptic parameter .
3. Stability Analysis and Bifurcation Analysis of Chemically Coupled Systems
3.1. Stability Analysis of Chemically Coupled Systems
For the coupled system (7), the system equilibrium point is the solution satisfying Equation (12).
The system equilibrium point denoted as , such that
The Jacobian matrix of the coupled system is
Here, represents the partial derivative value. The parameters from Table 1 and Table 2 are introduced into the system, as shown in Equation (12), for numerical calculations, yielding the equilibrium points of the chemically coupled Chay neuron system.
The specific expression for the Jacobian matrix at the equilibrium point is
To obtain the eigenvalues of the Jacobian matrix, we can solve the following characteristic polynomial:
It is possible to calculate that . According to stability theory [43,44,45,46,47], the equilibrium point is known to be an unstable saddle point. To study the bifurcation of the equilibrium point in the chemically coupled system, we obtained a bifurcation diagram of the equilibrium point on a two-dimensional plane using numerical calculation with the Matcont toolkit [48], as shown in Figure 8.
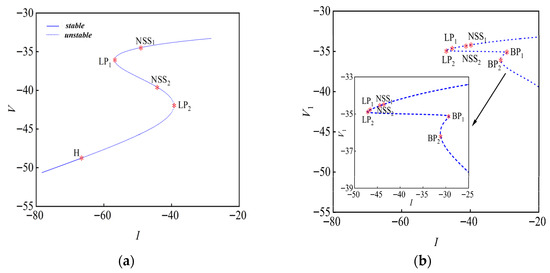
Figure 8.
Bifurcation diagrams of equilibrium points concerning (I,V): (a) Dsyn = 0; (b) Dsyn = 1.
The distribution of the system’s equilibrium point is investigated, with the current serving as the bifurcation parameter. Figure 8 depicts the variation in the membrane potential at the system’s equilibrium point as this parameter changes. Specifically, when the strength of chemical coupling, Dsyn = 0, yielding the bifurcation map on the (I,V) plane as shown in Figure 8a. The bifurcation point data calculated based on the parameters in Table 1 and Table 2 are shown in Table 3; for the bifurcation point LP1, only one eigenroot exists, which is zero, while all other eigenroots are non-zero. Therefore, the bifurcation point LP1 is classified as a saddle-node bifurcation point, indicating that saddle-node bifurcation occurs at this point in the system. At the bifurcation point LP2, one of the characteristic roots is zero. Therefore, the bifurcation point LP2 is classified as a saddle-node bifurcation point. At the bifurcation point H, one pair of conjugate eigenvalues has a zero real part, and all eigenvalues are non-positive. Consequently, point H is classified as a Hopf bifurcation point. The first Lyapunov coefficient at point H is equal to 0.0961, which is greater than 0, and H is a subcritical Hopf bifurcation point.

Table 3.
Table of equilibrium point values when Dsyn = 0.
As shown in Table 4, the chemical coupling strength is Dsyn = 1; Figure 8b displays the equilibrium point bifurcation with the current as the bifurcation parameter. An eigenvalue of 0 exists for the equilibrium points LP1 and LP2. Therefore, saddle-node bifurcation occurs with an unstable (saddle point) equilibrium point. For BP1 and BP2, there are two characteristic roots equal to 0, so they are Bogdanov–Takens bifurcation points [49,50,51]. The bifurcation curves are dashed throughout, indicating that all equilibrium points are unstable.

Table 4.
Table of equilibrium point values when Dsyn=1.
By analyzing the equilibrium point bifurcations at different strengths of chemical coupling, it is possible to determine the type of bifurcation and its stability at equilibrium points where chemical coupling influences the equilibrium, and when Dsyn = 1, the Hopf bifurcation transforms into Bogdanov–Takens bifurcation.
3.2. Effect of Chemical Synaptic Parameters on Baseline Parameters
The reference parameters in the Chay neuron model represent the reversible potential of the ion channel. Figure 9a demonstrates the ISI of the single-parameter loop. From the bifurcation diagram, it can be seen that the system discharge is in the periodic plus period, and the whole process undergoes the process of doubling bifurcation → plus periodic bifurcation → inverse doubling bifurcation switching, and with the chaotic array phenomenon, it expands to two parameter changes. Figure 9b demonstrates . In the parameter plane, for the two-parameter bifurcation diagram when , , there is a short-term period between . During the mixing period, the system in the discharge state is chaotic, and then the inverse multiplication bifurcates back to period 1. Observing the entire area, when changes, the system discharge period changes greatly. Small changes can lead to large changes in the system discharge. However, if you observe the vertical axis alone, when , the change in causes a slight change in the discharge state of the system. When , it no longer affects the discharge of the system. It is shown in the figure that the shape of the vertical periodic window does not change. Thus, when the two parameters change at the same time, the change in the reference parameters plays a decisive role in the system, and the chemical synaptic parameters have only a small impact on the discharge status of the system. It can be seen in Figure 9c that when , with the change in synaptic reversible potential, the discharge period of the system directly enters a high-period chaotic region after completing the inverse doubling bifurcation, and there is no process of increasing the period. The process is single, and when the synaptic reversible potential is large, the system tends to be stable, and no bifurcation occurs again.
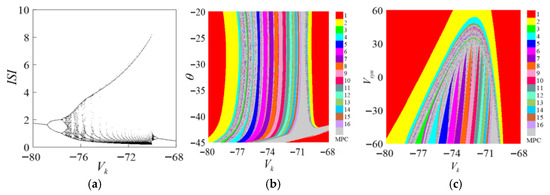
Figure 9.
ISI bifurcation process on parameter . (a) Bifurcation diagram for . (b) Bifurcation diagram for . (c) Bifurcation diagram for .
It is concluded that the reversible potential of ion channels plays a decisive role in the system’s response to parameter changes, while the influence of chemical synapses is minor and auxiliary. The two-parameter bifurcation diagram clearly shows the system’s behavior as parameters change continuously, aiding in understanding neuronal dynamics. It is worth noting that in real neurons, the reversal potential is determined by ionic concentration gradients and membrane permeability, which are relatively stable, leading to a discrepancy between neurophysiological theory and dynamical system modeling. This distinction helps maintain the theoretical value of the research while avoiding physiological misinterpretations, in line with the “theoretical model not equivalent to biological replication” paradigm in computational neuroscience [52,53,54].
4. Analysis of Spatiotemporal Dynamics in Chemically Interconnected Neural Networks
4.1. Synchronous Dynamic Analysis of a Two-Neuron System
The change in the coupling parameters of a nervous system will cause the transition of the system’s synchronization state. Here, we study the effect of chemical synapses on the synchronous transformation of the nervous system. Substituting Equation (6) into Equation (7) gives the following expression:
where subscripts denote the two neurons, respectively, and denotes the chemical coupling strength, defining the synchronization statistic as follows:
The above statistic quantifies the degree of difference or similarity between two objects into a specific value, whose value is between 0 and 1. Here, 0 indicates perfect identity, 1 represents maximal dissimilarity, and intermediate values correspond to graded differences [50]. The description of the synchronization status is shown in Table 5.

Table 5.
Description of the synchronization state.
Coupling strength affects the synchronization of the coupled system; Figure 10 shows the process by which two spike neurons achieve synchronization from asynchronous states as the coupling strength increases.
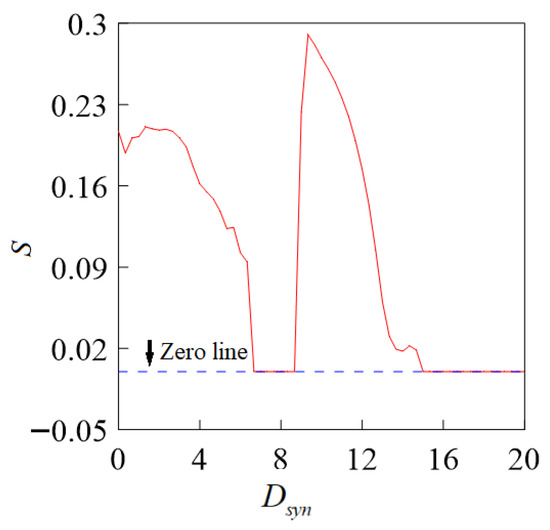
Figure 10.
Similarity function curves for the chemical coupling strength Dsyn.
When the chemical coupling strength = 6.8, the S = 0 system reaches a complete synchronization state, and then an asynchronous state appears after a short period of synchronization. When = 14.9, it returns to full synchronization again, indicating that the strong nonlinearity of chemical synaptic coupling leads to the discontinuity of the system’s synchronization state.
According to the physiological characteristics of chemical synapses, the transmission from presynaptic nerve endings to postsynaptic neurons needs to undergo the process of transmitter release, diffusion, and action on postsynaptic membranes, which requires a certain period of time. Therefore, chemical synaptic transmission has a certain time delay. We explore the influence of time lag on the synchronization of the coupled system and take the change in system synchronization when the time lag value is = 0.01, 0.02, 0.03, 0.05, as shown in Figure 11. In conjunction with Figure 10 and Figure 11a, it is evident that the time lag affects the system synchronicity by shortening the non-synchronous region and increasing the synchronous region. As shown in Figure 11b–d, appropriately increasing the time lag value can promote synchronization so that the coexistence of synchronization and asynchronization, which is only under the influence of chemical synaptic nonlinearity, disappears; that is, the system reaches a fully synchronized state. When the hysteresis value increases to a certain value, synchronization is no longer affected.

Figure 11.
Relationship between statistic and chemical coupling strength at different time lags. (a) = 0.01; (b) = 0.02; (c) = 0.03; (d) = 0.05.
We explore the synchronous changes in the coupling system under different chemical coupling strengths. When = 6.0, 7.0, 8.0, and 9.0, different chemical synaptic coupling strengths will affect the synchronous interval, as shown in Figure 12. When = 9.0, most of the system is in a synchronous state, and the high chemical coupling strength promotes synchronization.

Figure 12.
Statistic S versus time lag for different chemical coupling strengths. (a) = 6.0; (b) = 7.0; (c) = 8.0; (d) = 9.0.
It can be concluded that the synchronization of the coupling system is affected by the chemical coupling strength and the time lag. The chemical coupling strength has the most significant influence on the synchronization and shows a strong nonlinear property, while the time lag shows linear properties and shows a positive feedback effect.
When two parameters change simultaneously, the synchronicity of the system will also be affected by the control parameters and show a certain pattern, as shown in Figure 13. Among them, the red area indicates that the coupled system is in a state of complete synchronization; that is, the firing rhythms of the two neurons are completely synchronized, and at this time, S = 0. As the value of S gradually increases, the coupled system gradually tends to be asynchronous, showing other colors. Figure 13a contains a two-parameter synchronization diagram when parameters and change simultaneously. When = 6.0, the black continuous curve in the diagram represents the contour line. The S value on the same contour line is equal in the triangle area in the lower right corner. When , the coupled system is completely out of synchronization. Most of the area in the upper left corner is . The coupled system changes from being completely out of sync to approximately synchronized. When the parameters are and , the area appears red, indicating that the system is fully synchronized at this time. Regarding the status, the diagram presents the system from being completely unsynchronized →approximately synchronized →completely synchronized—a series of synchronized transition information.
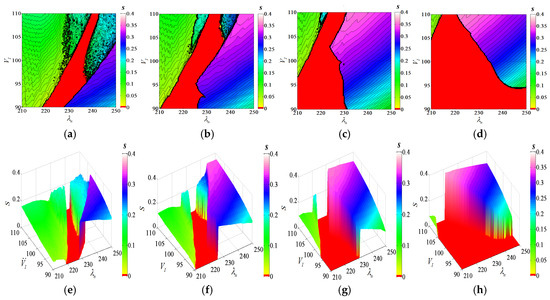
Figure 13.
Synchronized changes in dual parameters under different coupling strengths. (a) ; (b) ; (c) ; (d) ; (e) ; (f) (g) ; (h) .
Figure 13b–d shows the synchronous transition process diagram when the chemical coupling strength is 7.0, 8.0, and 9.0. The increase in the chemical coupling strength makes the completely asynchronous region gradually decrease. When the coupling strength is 9.0, the coupling system exhibits two states in the entire parameter region: approximately synchronous and fully synchronous. This shows that the increase in chemical coupling strength can promote the synchronization process of the system.
It is concluded that the synchronization of neuronal chemical coupling systems is affected by coupling strength and its reference parameters, and the coupling strength is the main factor affecting the synchronization of neuronal coupling systems. When the coupling strength of the system is in a state of incomplete synchronization, such as = 6.0, changing the value of and , the system can achieve complete synchronization under a certain parameter-matching mechanism, but the synchronization range is small. When = 7.0, 8.0, the synchronization of the system is higher than that of 6.0, and the synchronization area of the coupled system is also increased; when = 9.0, the coupled system itself reaches approximate synchronization, and the action of and makes a large area of the system directly enter full synchronization. Therefore, it is easier for the multi-factor control coupling system to enter into a complete synchronization state than it is for the single-factor control system. Figure 13e–h presents a three-dimensional spatial synchronization map corresponding to Figure 13a–d, and the dynamic changes in synchronous transfer can be clearly seen.
4.2. Spatiotemporal Dynamics Analysis of Neural Ring Networks
To reveal the effect of chemical synapses on the spatiotemporal dynamics of Chay neural networks, we built a ring neural network model, as shown in Equation (25).
where k represents the number of adjacent neurons on the left and right coupled by a neuron. Here ; this indicates that one neuron is coupled on each side. N represents the number of neurons. i, j = 1, 2, 3, …, 2000; I = −15; = 0.1. The values of the remaining parameters are shown in Table 1.
The maximum conductance values of the leaky ion channel of the neurons at i = 980–1020 was changed, and the values of the remaining neurons were included in Table 1. By altering the conductivity values of neurons in positions 980–1020 out of 2000, making them significantly different from the conductivity of neurons at other positions, we substantially increased the conductivity in this local region. This change directly impacted the membrane potential of the local neurons, causing them to generate action potential and creating a significant dynamic difference between this region and the rest of the neurons. The key change lies in the fact that the increase in local conductivity altered the behavior of the voltage-gated ion channels, thereby influencing the firing patterns of the neurons.
When the values of i = 980–1020 in the network are moderately increased, as shown in Figure 14b,c, , traveling waves [55,56,57,58,59,60,61,62] are induced, and more neurons are awakened, one after another. At this time, the neuron potential in 980–1020 was in a highly excited state. The increase in local conductivity caused the neurons in this region to generate action potential, which subsequently triggered global wave propagation within the ring network. In other words, the electrical activity gradually spread to other neurons, ultimately covering the entire network. When the maximum conductance value of the leaky ion channel is increased to a certain extent, neurons can be awakened, but the diffusion speed from the center to the boundary is not improved. The reason for this is that traveling wave transmission depends on the strength of coupling between neurons.
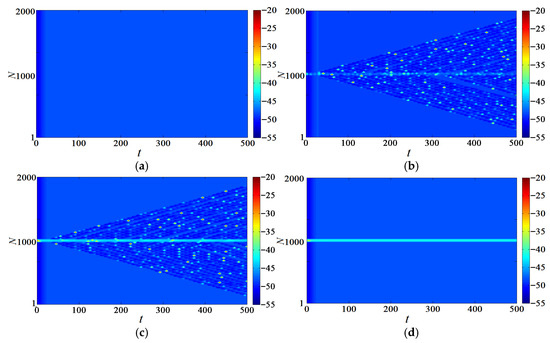
Figure 14.
Network traveling wave with different conductance values. (a) ; (b) ; (c) ; (d) .
Changing the maximum conductance value of the leaky ion channel of the neurons located at 980–1020 and ensuring that the conductance values at other positions remain unchanged, as shown in Table 1, can evoke the neural network discharge to generate traveling waves, as shown in Figure 15a, allowing us to explore the influence of the chemical coupling strength on the electrical activity of the neuron, change the electrical coupling strength to = 0.1, 0.3, 0.5, 0.7, and observe the influence of the chemical coupling strength on network discharge.
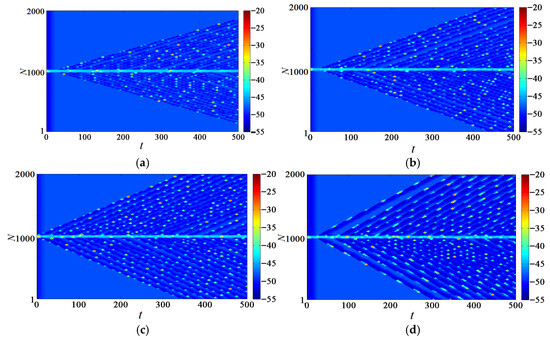
Figure 15.
Network traveling wave with different chemical coupling strengths. (a) = 0.1; (b) = 0.3; (c) = 0.5; (d) = 0.7.
As shown in Figure 15, greater coupling strength can ensure that the induced traveling wave propagates at a faster speed, and more neurons can be excited and awakened in a shorter time. Especially when the coupling strength = 0.7, all neurons are excited in only 300 time units.
5. Conclusions
In this paper, according to the physiological characteristics of chemical synapses, a Heaviside function was introduced to establish a preliminary chemical synapse model. The preliminary model was smoothed by Sigmoid function to obtain a nonlinear chemical synapse model. The synaptic model was introduced into a Chay neuron model to establish a chemically coupled Chay model. The dynamic characteristics of the chemical coupling system were investigated.
(1) According to the equilibrium point judgment theory, the types and stability of the system’s equilibrium points were determined. The simulation using matcont software showed that the chemical synaptic coupling strength affected the stability of the Hopf bifurcation point of the system, and the bifurcation point was transformed into saddle-node bifurcation and a BP bifurcation point.
(2) Important parameters of the chemical synapse model were determined by discrete control variables and parameter matching; the results are shown in Table 4. At the same time, the dynamic characteristics of the discharge rhythm and transition process of the Chay coupling model were studied. It was found that the chemical synapse model had a remarkable impact on the system, but it had little impact on the system when it was relative to the reversible potential change in the ion channel.
(3) It was found that the chemical coupling strength and the time lag value of the membrane potential information transmission of the two neurons all had an impact on synchronization. The chemical coupling strength had a strong impact on synchronization, while the other factors had positive feedback within a certain threshold. Changing the maximum conductance values () of leaky ion channels in several neurons of the ring network could induce traveling waves in the network. Adjusting the chemical coupling strength increased the diffusion speed of waves from the center to the boundary.
(4) This study has certain limitations. The model only considered the dynamic characteristics of two neurons and a ring topological structure, while the number and structure of neurons in actual nervous systems are more complex. Additionally, the coupling modes in real nervous systems usually not only involve chemical synapses but may also include the coexistence of chemical and electrical synapses. Therefore, the results of this study were derived under ideal conditions, and their applicability to real biological systems requires further experimental verification. Future research can extend the Chay model to electro-chemical coupling systems with complex topological networks and can provoke in-depth discussions on their dynamic characteristics.
Overall, this paper provides valuable insights into the dynamic behavior of the nervous system under chemical synaptic coupling and may offer a means and a foundation for research in neurobiology and brain dynamics, with practical application value.
Author Contributions
J.M. was responsible for modeling the neural systems, networks, and multi-parameter simulation algorithms, in addition to performing collaborative analysis. She wrote the first draft and responded to questions from experts. L.Q., H.D., T.L., and M.Z. were responsible for material preparation and analysis. All authors have read and agreed to the published version of the manuscript.
Funding
This work was supported by the Bintuan Science and Technology Program (2024DA004), Central Support for Local University Discipline Construction Project -Applied Statistics (Project No.: 415105003) and the Natural Science Program of the Tarim University Presidential (Grant numbers TDZKSS202335 and TDZKSS202344).
Data Availability Statement
The data that supports the findings of this study are openly available, and the relevant papers have been cited in this article.
Conflicts of Interest
The authors declare that they have no conflicts of interest.
References
- Rogawski, M.A.; Löscher, W. The neurobiology of antiepileptic drugs. Nat. Rev. Neurosci. 2004, 5, 553–564. [Google Scholar] [CrossRef]
- Millan, M.J. The neurobiology and control of anxious states. Prog. Neurobiol. 2003, 70, 83–244. [Google Scholar] [CrossRef]
- Depue, R.A.; Collins, P.F. Neurobiology of the structure of personality: Dopamine, facilitation of incentive motivation, and extraversion. Behav. Brain Sci. 1999, 22, 491–517, discussion 518–569. [Google Scholar] [CrossRef]
- Hodgkin, A.L.; Huxley, A.F. A quantitative description of membrane current and its application to conduction and excitation in nerve. J. Physiol. 1952, 2, 11–117. [Google Scholar] [CrossRef]
- Gong, Y.; Lin, X.; Wang, L.; Hao, Y. Chemical synaptic coupling-induced delay-dependent synchronization transitions in scale-free neuronal networks. Sci. China Chem. 2011, 54, 1498–1503. [Google Scholar] [CrossRef]
- Ye, Z.; Wu, Y.; Ding, Q.; Xie, Y.; Jia, Y. Finding synchronization state of higher-order motif networks by dynamic learning. Phys. Rev. Res. 2024, 6, 033071. [Google Scholar] [CrossRef]
- Wu, Y.; Huang, W.; Ding, Q.; Jia, Y.; Yang, L.; Fu, Z. Enhancing orderly signal propagation between layers of neuronal networks through spike timing-dependent plasticity. Phys. Lett. A 2024, 519, 129721. [Google Scholar] [CrossRef]
- Kundu, S.G.D. Chemical synaptic multiplexing enhances rhythmicity in neuronal networks. Nonlinear Dyn. 2019, 98, 1659–1668. [Google Scholar] [CrossRef]
- Trenholm, S.; Mclaughlin, A.J.; Schwab, D.J.; Turner, M.H.; Smith, R.G.; Rieke, F.; Awatramani, G.B. Nonlinear dendritic integration of electrical and chemical synaptic inputs drives fine-scale correlations. Nat. Neurosci. 2014, 17, 1759–1766. [Google Scholar] [CrossRef] [PubMed]
- Wu, K.; Wang, D.; Yu, C.; Machado, J.T. Synchronization of Chemical Synaptic Coupling of the Chay Neuron System under Time Delay. Appl. Sci. 2018, 8, 927. [Google Scholar] [CrossRef]
- Wu, Y.; Ding, Q.; Huang, W.; Li, T.; Yu, D.; Jia, Y. Dynamic learning of synchronization in coupled nonlinear systems. Nonlinear Dyn. 2024, 112, 21945–21967. [Google Scholar] [CrossRef]
- Li, W.; Li, L.; Song, J. A Basic Chemical Synaptic Euler Model and Its Triad Trigger Topology. Chin. J. Electron. 2017, 26, 244–249. [Google Scholar] [CrossRef]
- Strathern, L. Getting Graded: Teaching Principles of Chemical Synaptic Transmission Without Action Potentials. J. Undergrad. Neurosci. Educ. 2021, 19, R28–R30. [Google Scholar]
- Fitzhugh, R. Computation of Impulse Initiation and Saltatory Conduction in a Myelinated Nerve Fiber. Biophys. J. 1962, 2, 11–21. [Google Scholar] [CrossRef] [PubMed]
- Chay, T.R.; Fan, Y.S.; Lee, Y.S. Bursting, Spiking, Chaos, Fractals, and Universality in Biological Rhythms. Int. J. Bifurc. Chaos 1995, 5, 595–635. [Google Scholar] [CrossRef]
- Wang, H.; Lu, Q.; Wang, Q. Bursting and synchronization transition in the coupled modified ML neurons. Commun. Nonlinear Sci. Numer. Simul. 2008, 13, 1668–1675. [Google Scholar] [CrossRef]
- Hindmarsh, J.L.; Rose, R.M. A Model of Neuronal Bursting Using Three Coupled First Order Differential Equations. Proc. R. Soc. 1984, 221, 87–102. [Google Scholar]
- Ge, M.; Jia, Y.; Xu, Y.; Lu, L.; Wang, H.; Zhao, Y. Wave propagation and synchronization induced by chemical autapse in chain Hindmarsh–Rose neural network. Appl. Math. Comput. 2019, 352, 136–145. [Google Scholar] [CrossRef]
- Mishra, A.; Saha, S.; Ghosh, D.; Osipov, G.V.; Dana, S.K. Traveling Chimera Pattern in a Neuronal Network under Local Gap Junctional and Nonlocal Chemical Synaptic Interactions. Opera Medica Physiol. 2017, 3, 14–18. [Google Scholar]
- Popović, N. A geometric analysis of front propagation in a family of degenerate reaction-diffusion equations with cutoff. Z. Für Angew. Math. Und Phys. 2011, 62, 405–437. [Google Scholar] [CrossRef]
- Wang, H.-X.; Lu, Q.-S.; Shi, X. Phase synchronization and its transition in two coupled bursting neurons: Theoretical and numerical analysis. Chin. Phys. B 2010, 19, 060509. [Google Scholar]
- Gong, Y.; Huang, J. Bogdanov-Takens bifurcation in a Leslie-Gower predator-prey model with prey harvesting. Acta Math. Appl. Sin. Engl. Ser. 2014, 30, 239–244. [Google Scholar] [CrossRef]
- Chen, X.; Wang, N.; Wang, Y.; Wu, H.; Xu, Q. Memristor initial-offset boosting and its bifurcation mechanism in a memristive FitzHugh-Nagumo neuron model with hidden dynamics. Chaos Solitons Fractals 2023, 174, 113836. [Google Scholar] [CrossRef]
- Lambruschini, P.L.C. Neuronal oscillatory patterns in coupled lasers with optical feedback. Chaos Solitons Fractals 2024, 181, 114602. [Google Scholar] [CrossRef]
- Wu, J. Spectral structures and soliton dynamical behaviors of two shifted nonlocal NLS equations via a novel Riemann–Hilbert approach: A reverse-time NLS equation and a reverse-spacetime NLS equation. Chaos Solitons Fractals 2024, 181, 114640. [Google Scholar] [CrossRef]
- Rybalova, E.V.; Strelkova, G.I.; Anishchenko, V.S. Impact of sparse inter-layer coupling on the dynamics of a heterogeneous multilayer network of chaotic maps. Chaos Solitons Fractals 2020, 142, 110477. [Google Scholar] [CrossRef]
- Roper, S.D. Chemical and electrical synaptic interactions among taste bud cells. Curr. Opin. Physiol. 2021, 20, 118–125. [Google Scholar] [CrossRef]
- Man, Z.; Gao, C.; Dai, Y.; Meng, X. Dynamic rotation medical image encryption scheme based on improved Lorenz chaos. Nonlinear Dyn. 2024, 112, 13571–13597. [Google Scholar] [CrossRef]
- Panwar, A.; Biban, G.; Chugh, R.; Tassaddiq, A.; Alharbi, R. An efficient image encryption model based on 6D hyperchaotic system and symmetric matrix for color and gray images. Heliyon 2024, 10, e31618. [Google Scholar] [CrossRef]
- Lu, L.L.; Yi, M.; Liu, X.Q. Energy-efficient firing modes of chay neuron model in different bursting kinetics. Sci. China Technol. Sci. 2022, 65, 1661–1674. [Google Scholar] [CrossRef]
- Xu, Q.; Liu, T.; Feng, C.-T.; Bao, H.; Wu, H.-G.; Bao, B.-C. Continuous non-autonomous memristive Rulkov model with extreme multistability. Chin. Phys. B Engl. Version 2021, 30, 121–130. [Google Scholar] [CrossRef]
- Ma, M.; Xiong, K.; Li, Z.; He, S. Dynamical behavior of memristor-coupled heterogeneous discrete neural networks with synaptic crosstalk. Chin. Phys. B 2024, 33, 028706. [Google Scholar] [CrossRef]
- Wang, M.; Ding, J.; Li, J.; He, S.; Zhang, X.; Iu, H.H.C.; Li, Z. Anovel multistable chaotic system with 2m-scroll attractor its application. Eur. Phys. J. Plus 2024, 139, 64. [Google Scholar] [CrossRef]
- Chen, C.; Min, F.; Cai, J.; Bao, H. Memristor synapse-driven simplified Hopfield Neural Network: Hidden dynamics, attractor control, and circuit implementation. IEEE Trans. Circuits Syst. I Regul. Pap. 2024, 71, 2308–2319. [Google Scholar] [CrossRef]
- Yang, F.; Ma, J.; Wu, F. Review on memristor application in neural circuit and network. Chaos Solitons Fractals 2024, 187, 115361. [Google Scholar] [CrossRef]
- Bao, B.; Chen, L.; Bao, H.; Chen, M.; Xu, Q. Bifurcations to bursting oscillations in memristor-based FitzHugh-Nagumo circuit. Chaos Solitons Fractals 2024, 181, 114608. [Google Scholar] [CrossRef]
- Mendes, E.; Sivapuram, R.; Rodriguez, R.; Sampaio, M.; Picelli, R. Topology optimization for stability problems of submerged structures using the TOBS method. Comput. Struct. 2022, 259, 106685. [Google Scholar] [CrossRef]
- Yu, X.; Abu Bakar, A.; Li, K.; Wang, Q.; Sang, H. Dynamical analysis of a novel memristor-type chaotic map. Phys. Scr. 2024, 99, 075218. [Google Scholar] [CrossRef]
- Pournaki, A.; Merfort, L.; Ruiz, J.; Kouvaris, N.E.; Hövel, P.; Hizanidis, J. Synchronization Patterns in Modular Neuronal Networks: A Case Study of C. elegans. Front. Appl. Math. Stat. 2019, 5, 52. [Google Scholar] [CrossRef]
- Zhang, X.; Rong, J.; Chen, C.; TanG, Z.; He, X. Structural topological optimization with multiple displacement constraints based on Heaviside density and sensitivity filtering. J. Chang. Univ. Sci. Technol. 2012, 9, 57–62. [Google Scholar]
- Simo, G.R.; Louodop, P.; Ghosh, D.; Njougouo, T.; Tchitnga, R.; Cerdeira, H.A. Traveling chimera patterns in a two-dimensional neuronal network. Phys. Lett. A 2021, 409, 127519. [Google Scholar] [CrossRef]
- Das, S.; Das, P.; Das, P. Dynamics and control of multidrug-resistant bacterial infection in hospital with multiple delays. Commun. Nonlinear Sci. Numer. Simul. 2020, 89, 105279. [Google Scholar] [CrossRef]
- Das, P.; Upadhyay, R.K.; Das, P.; Ghosh, D. Exploring dynamical complexity in a time-delayed tumor-immune model. Chaos 2020, 30, 123118. [Google Scholar] [CrossRef]
- Rosenblum, M.G.; Pikovsky, A.S.; Kurths, J. Phase Synchronization of Chaotic Oscillators. Phys. Rev. Lett. 1996, 76, 1804. [Google Scholar] [CrossRef]
- Izhikevich, E.M. Neural Excitability, Spiking and Bursting. Int. J. Bifurc. Chaos Appl. Sci. Eng. 2000, 10, 1171–1266. [Google Scholar] [CrossRef]
- Kuznetsov, Y.A. Elements of Applied Bifurcation Theory; Springer: New York, NY, USA, 2004. [Google Scholar]
- Li, C.; Wang, X.; Du, J.; Li, Z. Electrical activity and synchronization of HR-tabu neuron network coupled by Chua Corsage Memristor. Nonlinear Dyn. 2023, 111, 21333–21350. [Google Scholar] [CrossRef]
- Dhooge, A.; Govaerts, W.; Kuznetsov, Y.A.; Sautois, B. Matcont: A Matlab package for dynamical systems with applications to neural activity. Program Documentation, 2006.
- Mohadeseh, S.S.; Fahimeh, N.; Sajad, J.; Rajagopal, K. Investigating different synaptic connections of the Chay neuron model. Phys. A Stat. Mech. Its Appl. 2022, 607, 128242. [Google Scholar]
- Izhikevich, E.M. Dynamical Systems in Neuroscience: The Geometry of Excitability and Bursting; MIT Press: Cambridge, MA, USA, 2007. [Google Scholar]
- Huang, J.; Liu, S.; Ruan, S.; Zhang, X. Bogdanov-Takens bifurcation of codimension 3 in a predator-prey model with constant-yield predator harvesting. Commun. Pure Appl. Anal. 2016, 15, 1041–1055. [Google Scholar]
- Yuan, C.; Wang, J. Hopf bifurcation analysis and control of three-dimensional Prescott neuron model. J. Vibroeng. 2016, 18, 4105–4115. [Google Scholar] [CrossRef]
- Devaney, A.J. Mathematical Foundations of Neuroscience; Springer: New York, NY, USA, 2010. [Google Scholar]
- Lixiang, W.; Dong, L. Stochastic Morris–Lecar model with time delay under magnetic field excitation. Chaos Solitons Fractals 2023, 173, 113715. [Google Scholar]
- Duan, L.; Lu, Q. Codimension-two bifurcation analysis on firing activities in Chay neuron model. Chaos Solitons Fractals 2005, 30, 1172–1179. [Google Scholar] [CrossRef]
- Kevin, N.T.F.; Adamou, D.K.; Ekobena, F.H.P. Modes of electrical activities and energy of Hindmarsh–Rose model coupled by memristive synapses. Eur. Phys. J. Plus 2023, 138, 267. [Google Scholar] [CrossRef]
- Wang, S.; Wei, Z. Synchronization of coupled memristive Hindmarsh-Rose maps under different coupling conditions. AEU-Int. J. Electron. Commun. 2023, 161, 154561. [Google Scholar] [CrossRef]
- Nazerian, A.; Hart, J.D.; Lodi, M.; Sorrentino, F. The efficiency of synchronization dynamics and the role of network syncreactivity. Nat. Commun. 2024, 15, 9003. [Google Scholar] [CrossRef] [PubMed]
- Ramasamy, M.; Rajagopal, K.; Ramakrishnan, B.; Karthikeyan, A. Effect of external excitation on synchronization behavior in a network of neuron models. Phys. A Stat. Mech. Its Appl. 2023, 625, 129032. [Google Scholar] [CrossRef]
- Braga, P.A.S.; Aguirre, L.A. Selecting the coupling variable to synchronize nonlinear oscillators. Nonlinear Dyn. 2024, 112, 15177–15191. [Google Scholar] [CrossRef]
- Chen, W.; Wang, S.; Lan, Y.; Liu, W.; Xiao, J. Explosive synchronization caused by optimizing synchrony of coupled phase oscillators on complex networks. Eur. Phys. J. B 2021, 94, 205. [Google Scholar] [CrossRef]
- Ansarinasab, S.; Parastesh, F.; Ghassemi, F.; Rajagopal, K.; Jafari, S.; Kurths, J. Optimized multi-variable coupling can improve synchronization in complex networks. Nonlinear Dyn. 2024, 112, 18491–18500. [Google Scholar] [CrossRef]
Disclaimer/Publisher’s Note: The statements, opinions and data contained in all publications are solely those of the individual author(s) and contributor(s) and not of MDPI and/or the editor(s). MDPI and/or the editor(s) disclaim responsibility for any injury to people or property resulting from any ideas, methods, instructions or products referred to in the content. |
© 2025 by the authors. Licensee MDPI, Basel, Switzerland. This article is an open access article distributed under the terms and conditions of the Creative Commons Attribution (CC BY) license (https://creativecommons.org/licenses/by/4.0/).