Article

An Energy-Based Complex Brain Network Model—Part 1: Local Electrophysiological Dynamics

Nonlinear Engineering and Control Lab, Department of Mechanical Engineering, Texas A&M University, College Station, TX 77843-3123, USA
*
Author to whom correspondence should be addressed.
Dynamics 2023, 3(1), 96-114; https://doi.org/10.3390/dynamics3010007
Submission received: 26 January 2023 / Revised: 13 February 2023 / Accepted: 14 February 2023 / Published: 20 February 2023
(This article belongs to the Special Issue Recent Advances in Dynamic Phenomena)

Abstract

:
The human brain is a complex network of connected neurons whose dynamics are difficult to describe. Brain dynamics are the global manifestation of individual neuron dynamics and the synaptic coupling between neurons. Membrane potential is a function of synaptic dynamics and electrophysiological coupling, with the parameters of postsynaptic potential, action potential, and ion pump dynamics. By modelling synaptic dynamics using physical laws and the time evolution of membrane potential using energy, neuron dynamics can be described. This local depiction can be scaled up to describe mesoscopic and macroscopic hierarchical complexity in the brain. Modelling results are favorably compared with physiological observation and physically acquired action potential profiles as reported in the literature.

1. Brain Network Dynamics

The brain is a dynamical complex network of neurons (nerve cells) whose individual constituent dynamics are driven by the membrane potential of neurons. The corresponding coupling is governed by underlying synaptic neural dynamics. Since there are approximately 86 billion neurons in the human brain and the strength of the connection between each neuron changes in time, it is challenging to unveil the dynamics of the brain network. To properly define brain network dynamics, neuron (membrane potential) dynamics and coupling dynamics (synaptic dynamics) must be established. In this study, constituent dynamics (the dynamics of neurons) are defined using energy, with the distribution of energy following a normal distribution [1,2]. Since neuron energy is capped and neural responses are governed by physical laws, neuron dynamics are bound and quantifiable, allowing brain network dynamics to be described by information entropy [3]. In this two-part paper, a brain network model is presented. The governing laws used to describe individual neuron dynamics (the time evolution of the membrane potential) and synaptic dynamics (the underlying cause of the time evolution of the membrane potential) are determined in Part 1 of the paper. Local and global depictions of brain network dynamics are presented in Part 2 of the paper. To ensure a proper description of true brain network dynamics, a brain network model was developed following physiological observations made with neurons. Previous work has been carried out in this field [4,5,6,7,8,9]. This study aims to build off from and address shortcomings in previous attempts towards characterizing the brain based on energy, as described in detail in the following sections.
A neuron is a system consisting of several primary components including a soma as the main cell body, dendrites that receive neural signals, and axons that transmit neural signals. A neuron may or may not feature dendrites or axons depending on the classification. In general, the axon of a presynaptic neuron can feature many axon terminals that connect to different postsynaptic neurons. A postsynaptic neuron can feature many dendrites that receive signals from multitudes of presynaptic neurons, while a synapse connects the axon terminal to dendrites. The membrane potential of a postsynaptic neuron varies according to the sodium- (Na+) and potassium- (K+) ion flux passing across the chemical-gated ion channels on the membrane of the dendrites. The moment the membrane potential rises and reaches a threshold value, the voltage-gated ion channels are open to allow in a huge influx of ions to induce a series of rapid rises and falls in the membrane potential called the action potential. The firing of the action potential of the presynaptic neuron initiates synaptic dynamics that couple with the dynamics between two connected neurons. When the action potential reaches the axon terminal of the presynaptic neuron, the voltage-gated calcium (Ca2+) channels of the axon terminal open and lead to the release of neurotransmitters to the synaptic cleft (the extracellular space between presynaptic and postsynaptic neurons). The released neurotransmitters can be destroyed by enzymes, drift away from the synaptic cleft, be taken up again by the presynaptic cell, and be received by the receptor of the dendrite of the postsynaptic cell. The received neurotransmitters trigger the opening of chemically gated ion channels, which causes an influx of ions to pass through the membrane of the dendrite, which subsequently drives the membrane potential, and when a threshold potential is reached, further triggers the firing of the action potential of the postsynaptic neuron, consequently triggering the synaptic dynamics of the next pair of connected neurons. The firing of the action potential can be seen as the transmission of signals between neuron connections. To maintain the ability to fire action potential, the sodium–potassium pump maintains the balance in terms of the ion concentration to establish an electrochemical gradient across the membrane which requires energy provided by adenosine triphosphate (ATP) in the cell. Consequently, the electrochemical gradient across the presynaptic and postsynaptic neuron membranes and the synaptic cleft environment as well as ATP determine the frequency and intensity of the firing of the action potential of each neuron.
As one of the fundamental mechanisms in brain neuroplasticity, synaptic plasticity describes the connection strength between neurons as it changes in time. Depending on the firing pattern of the action potential between the presynaptic and postsynaptic neurons, an excitatory or inhibitory action can be triggered. An excitatory action increases the connection strength, while an inhibitory action does the opposite. The Ca2+ concentration of the postsynaptic neuron increases in response to the activation of an excitatory action and decreases in response to the triggering of an inhibitory action. With a higher Ca2+ concentration, the number of receptors on the neuron increases (resulting in a greater coupling strength) enabling it to receive more neurotransmitters and vice versa. The availability of the neurotransmitter from the presynaptic neuron also affects the coupling strength between neurons.
To describe the various behaviors of a brain network, the mechanisms that dictate individual neuron dynamics and synaptic dynamics must be defined by physical laws. Neuron dynamics is driven by variations in the membrane potential, including the post membrane potential and action potential of the membrane. Variations in membrane potential are constrained by the energy required to induce ion flux and the energy provided by ATP needed to maintain the balance of membrane potentials. Neuron dynamics is therefore underlined by energy. Moreover, synaptic dynamics describes how the membrane potential of the postsynaptic neuron is varied by the action potential that is fired by the presynaptic neuron. Synaptic dynamics is also affected by the firing of the action potential of the presynaptic neuron, the flux of the neurotransmitter, and the number of available neurotransmitter receptors on the postsynaptic neuron. Once individual neuron dynamics and synaptic dynamics are defined using energy and bearing in mind that energy must follow a normal distribution [2], brain network dynamics can be described using information entropy [3].
Most brain network models are derived from the Hodgkin–Huxley (HH) model. However, the model describes the action potential of a neuron without considering membrane potential dynamics and synaptic dynamics. Coupling dynamics between connected neurons is also not addressed. The model assumes that all neurons fire action potentials continuously with a time-invariant coupling strength between them. The model maintains a static brain network with a constant time-invariant coupling relationship between each neuron pairs. As a result, neurons in the brain network fire action potentials repeatedly with a profile that is identical in terms of time duration and amplitude. This disagrees with observations made in physiology. Such neural behaviors introduce fluctuations to ion concentrations, inadvertently alter the electrochemical gradient of the ions across the membrane, and ultimately lead to erroneous action potential profiles. Experimental physiology affirms that synaptic dynamics, neuron plasticity, and action potential do not fire continuously. While the firing of the action potential of the presynaptic neuron results in strong neural connections, excessive postsynaptic neural firing blocks the signal transmitted from the presynaptic neurons. HH model-based brain network models are inadequate in resolving true brain network dynamics, where action potentials are fired intermittently, with neuron coupling varying accordingly to the firing frequency.
Membrane potentials are measured in voltage and are the marked features in neuron dynamics. However, the HH model describes action potentials in terms of electrical current, thus obscuring the signatory characteristics of neuron dynamics. Describing neuron dynamics using the current induced by ion flux is not straightforward. Neuron dynamics are the manifestation of changing in membrane potential in terms of voltage.
The literature indicates that focus is either given to establishing neuron dynamics or understanding synaptic dynamics. While investigating both helps when trying to better understand the brain, it remains inadequate if the brain is not treated as a network of neurons. Electrophysiological data or mathematical curve fitting are the predominant techniques applied to neuroscience and brain research. However, they lack the resolution required to resolve the true characteristics of individual neurons. Individual neuron dynamics are driven by fluctuations in the membrane potential induced by the ion fluxes established across the membrane. Any measurement made with electrode probes requires the current to flow through the probing device. In the case of the electrophysiology measurement of a neuron, the current is applied in the form of ion fluxes. Ion fluxes that trigger membrane potential fluctuations are disturbed every time the neuron is probed. The impact of the disturbance generated by probing devices on ion channel activity is significant. For example, single ion channel measurement made with a patch clamp pipette registers an error when measuring the voltage amplitude and altered the ion channel activity [10]. A tiny difference in input to a nonlinear system would lead the system to evolve towards a different outcome. Given the scale of neuron dynamics, the flowing of ions through a probing device is significant enough to cause the membrane potential to behave in a different way, not to mention that these electrophysiology measurements are usually done in-vitro, whereby neurons usually behave differently than they would in an undisturbed environment. Though they are significantly lower than in-vitro, neuron responses are also perturbed when performed in-vivo. It is challenging to establish individual neuron dynamics model based solely on electrophysiologically acquired data. While electrophysiology data do not portray the true dynamics of individual neurons, mathematical curve fitting introduces error and obscures the inherent nonlinearity of the neuron. It is therefore essential to establish the governing laws that underlie individual neuron dynamics (such as a variation in the membrane potential) if brain network dynamics are to be properly modeled.
To demonstrate the validity of the brain network model presented in the paper, the membrane potential profiles generated by the model are shown to be in close agreement with physiological observations made with neurons. Although electrophysiology measurements introduce disturbances to neuron dynamics, electrode probes do capture neuron responses with a valid temporal resolution. Physiological probing devices interact with ion fluxes and output the interaction as a time profile. Measured readings vary when there are physiological changes in the neuron being probed. It will be seen in the sections that follow, the time scale of the underlying neuron dynamics as described by the brain network model agrees well with physiological observations. While the magnitude of the reported value may be questionable, the time scale of the physiologically established membrane potential is resolved with accuracy. Physiological membrane potential data are used to demonstrate the validity of the membrane potential governing law presented in Section 2.
It is important to be aware that no two action potential profiles are identical because the conditions an ion channel is under prior to firing are never the same [11]. Depending on the type of neuron, certain neural responses are faster, while others are slower. In Section 3, comparisons are made with the physiological observations reported in [11] to show that the brain network model formulated in the paper portrays neuron dynamics with remarkable accuracy. The model incorporates a neural coupling law that governs synaptic dynamics. Valid assumptions are made in Section 2, where the brain network model is developed to make up for the fact that comprehensive physiological measurement data are generally lacking.

2. Brain Network Dynamics at Neuron (Local) Level

Brain networks are complex networks composed of coupled neural cells. The focus of the first part of this two-part paper is on neurons at the local level. Individual neuron dynamics are driven by variations in the membrane potential induced by the ion fluxes passing across the membrane. Ion flux is a function of the cumulative cross-sectional area of open ion channels and the electrochemical gradient. The cumulative cross-sectional area of a postsynaptic neuron is determined by the firing of the action potential of the presynaptic neuron. Fluctuations in the membrane potential can be considered as the superposition of the followings: the postsynaptic potential, the action potential, and the change in membrane potential introduced by ion pumps. The postsynaptic potential is the stage of the membrane potential before reaching the threshold at which the action potential is fired. The postsynaptic potential is a function of synaptic dynamics and the ligand-gated ion channels on the postsynaptic neuron. Thus, postsynaptic potential changes indicate the behavior of the postsynaptic neuron as a receiver receiving signals (neurotransmitters) from the presynaptic neurons. The action potential is the stage of the membrane potential when a threshold potential is reached, triggering the voltage-gated ion channels to allow a burst of a large amount of Na+ influx to induce depolarization and K+ outflux with a delay in time from the triggering moment to generate repolarization. At the moment an action potential is fired, postsynaptic neurons are triggered by the presynaptic neural signal to transmit information through the release of neurotransmitters. The amplified signal is subsequently transmitted to the next line of postsynaptic neurons down the signal chain where more neurotransmitters are released. The postsynaptic potential characterizes the analog portion of individual neuron dynamics (the time evolution of the membrane potential) and the action potential defines the digital portion of the dynamics. In preventing the state of neurons from stalling for a prolonged period of time, which is induced by an unbalanced ion concentration (due to significant ion flux through voltage-gated ion channels), ion pumps work to re-establish and maintain the ion concentration to ensure a proper electrochemical gradient in terms of the ions. To define brain network dynamics in terms of neural voltage changes, the mechanisms that underline the postsynaptic potential, action potential, and ion pump dynamics must be determined following the laws of physics.
The brain network model formulated in Equations (1)–(27) below incorporates the laws that dictate neuron dynamics. The laws resolve membrane potential dynamics by identifying the mechanisms behind the postsynaptic potential (Equation (10)), action potential (Equation (11)), and ion pump dynamics (Equation (12)). The relationship between the neurotransmitters released by the presynaptic neurons and the cumulative cross-sectional area of the ligand-gated ion channels on the postsynaptic neuron is defined by Equations (13)–(22). The firing of the action potential of the postsynaptic neuron is formulated in Equation (8). The relationship between the pumping cycle of the ion pump and the ion concentration of the postsynaptic neuron is given by Equations (12) and (23)–(27).
In the sections that follow, the computed neuron membrane potentials are shown to match the time scale of the action potential profile reported in [12]. It is noted that a depolarization of 1 ms in duration, a repolarization of 1 ms in duration, and a 1 ms delay from the moment the action potential is triggered are the prominent features seen in the action potential profile in [12].

2.1. Membrane Potential—Dynamics of Individual Neuron

Brain networks are complex networks of neurons and brain dynamics is the collective interaction between the neurons. Neuroscience and complex network dynamics must be considered when describing brain dynamics. In a network of neurons, each neuron can serve either as a presynaptic neuron, a postsynaptic neuron, or both.
Table 1 tabulates the notations used in deriving the brain network model. Assuming that the brain network consists of nn numbers of neurons, each neuron, n, has dn numbers of dendrites, in types of ions, jn types of neurotransmitters, and ln types of ligand-gated ion channels. These values quantify the biological components (e.g., numbers of dendrites, ion types, neurotransmitter types, and ion channel types) of the brain network model. To ensure the generality of the brain network model, this study assumes that all neurons are mutually connected. Each neuron, n, serves both as a presynaptic neuron, M, and a postsynaptic neuron, N. However, the dynamics of an individual neuron, n, are defined by the time evolution of its membrane potential that is induced by the ion flux flowing through the triggered ion channels and ion pumps on all the dendrites of the neuron. The time evolution of the membrane potential is the postsynaptic behavior of each neuron. Thus, the brain network model being developed in the present section is formulated from the postsynaptic perspective of each neuron, n, to address the response of neuron n’s membrane potential to the received signals transmitted from the presynaptic neurons. The N notation indicates that the equation is presented from the perspective of an individual neuron, n, as a postsynaptic neuron, N. The M notation indicates that the corresponding parameter is dependent upon the property of the presynaptic neuron, M. The d notation indicates that the corresponding parameter is a property of the dth dendrite of neuron N. The i notation indicates that the corresponding parameter is a property related to ion species, i, and the j notation shows a neurotransmitter species, j, -related property. The l notation indicates the property associated with a ligand-gated type l, while v and p indicate the association with voltage-gated ion channels and ion pumps, respectively. For each neuron N, (1) different ions can all contribute to the change in the membrane potential, (2) each ion, i, can only flow through one or a small number of types of ion channels and ion pumps, and (3) each type l ligand-gated ion channel is triggered by a specific neurotransmitter, j, while voltage-gated ion channels are triggered by reaching the threshold potential. Na+, K+, and Ca2+ ions and the glutamate of excitatory action neurotransmitter are considered with i = { N a + ,   K + ,   C a 2 + } and j = { g l u t o m a t e } . It is noted that the parameters of the brain network model are variables pertaining to the characteristics of the brain network under investigation. A detailed explanation of the relationship between ions, neurotransmitters, and ion channels is provided in the subsequent sections. Additionally, the influence of leak channels on the membrane potential is not considered in this study.
Individual neuron dynamics are driven by changes in membrane potential as a function of ion flux. Assume that, through the dth dendrite, a postsynaptic neuron, N, is receiving the triggering signals of a neurotransmitter, j, from presynaptic neurons, M. The neuron N allows in of ion flux to flow across the membrane to induce a variation in membrane potential. The membrane potential of neuron N at the next time instant is the sum of the membrane potential at the present moment, V m N ( t ) , with the change in voltage, Δ V m N ( t ) , as follows
V m N ( t + 1 ) = V m N ( t ) + V m N l ( t ) + V m N v ( t ) + V p N ( t )
The change in the membrane potential Δ V m N ( t ) is contributed by (1) the postsynaptic potential, V m N l ( t ) , that is driven by the ion flux through the ligand-gated ion channels, (2) the action potential, V m N v ( t ) , driven by the ion flux through the voltage-gated ion channels, and (3) the change in membrane potential induced by the ion pumps, V p N ( t ) . Note that V m N l ( t ) , V m N v ( t ) , and V p N ( t ) are time dependent. The dynamics of the postsynaptic potential, V m N l ( t ) , defined in Equation (10), the action potential, V m N v ( t ) , defined in Equation (11), and the ion pumps, V p N ( t ) , defined in Equation (12) follow the same physical principles even though the underlying mechanisms of each type of ion channel are different. The change in the membrane potential that is general to all the three types of ion channels can be defined as
Δ V m N _ G e n e r a l ( t ) = i ( μ N M i ¯ ( t ) α N i ( t ) J N i ( t ) Δ t l i e V N i )
where μ N M i ¯ , defined in Equation (3) and of [Joule/mol] in unit, is the electrochemical gradient of ion i between the synaptic cleft of neurons M and N, and the intercellular space of dendrite d of neuron N. α N i , defined in Equations (6)–(8) according to each type of ion channels, is the cumulative cross-sectional area of ion channels of ion i of neuron N in the unit of [m2]. J N i , defined in Equation (5), is the ion flux of ion i through the membrane of neuron N in the unit of [mol/m2∙s]. Therefore, the amount of ion passing through the membrane per second through the ion channels can be calculated by multiplying the cross-sectional areas of the ion channel and the ion flux. Note that the amount of ions pumped across the membrane per second through the ion pump is directly related to the number of ion pumps and the concentration of ions, which is equivalent to the multiplication of α N i with J N i . Δ t is the time duration of each calculation iteration in [s]. e V N i ( t ) , defined in Equation (9), is the electron volt of the ion i of neuron N in the unit of [Coulomb], which is a modification of electron volt e V specific to the neurons. It is seen that [ v o l t ] = [ j o u l e j o u l e ] = [ j o u l e m o l ] × [ m 2 ] × [ m o l m 2 s ] × [ s ] [ j o u l e ] , thus, the units of all the parameters in Equation (2) are consistent. The governing law of membrane potential dynamics defined in Equation (2) obeys physics. These parameters are essential to determine the membrane potential and its variation over time for a neuron.
Electrochemical gradient
μ N M i ¯ ( t ) = G N M i ( t ) + Z i F V m N ( t )
is the potential energy of ion species i per mole with
G N M i ( t ) = R T ( t ) × ln ( c N o u t ( t ) c N i n ( t ) ) i
with Z i being the valency of the species i and F being the capacitance of the membrane of the whole neuron N in [Faraday]. Note that R is the ideal gas constant in [Joule/K∙mole], T is temperature in Kelvin [K], c N o u t and c N i n are, the concentrations of ion i outside and inside the membrane of neuron N in [mol/m3], respectively. According to Equations (3) and (4), the electrochemical gradient is dominated by the change in the ion concentration across the membrane. Compared to other parameters that also contribute to the change in membrane potential dynamics, human body temperature fluctuates much more subtly both in amplitude and frequency in general. Therefore, membrane potential dynamics are primarily driven by the fluctuation of the ion concentration gradient across the membrane due to ion flux. Hence, ion flux must be described properly so that the membrane potential dynamics can be defined per their true nature.
Ion flux, one of the dominant mechanical phenomena responsible for neuronal voltage fluctuation, is driven by diffusion defined by Fick’s first law in [mol/m2 s].
J N i ( t ) = D i ( c N o u t ( t ) c N i n ( t ) ) i R T ( t ) μ N M i ¯ x
where D i is the diffusion constant of ion i in [m2/s]. The definition of the cumulative area of ion channels α N i ( t ) differs according to the number and cross-sectional area of each type of the ion channel that a neuron has. In the case of ligand-gated ion channels,
α N d i j ( t ) = n N d i j _ t r i g ( t ) A l i
is a function of the available cross-sectional area of the activated ligand-gated ion channels in [m2], ion species i of postsynaptic neuron N specific to the neurotransmitter j on dendrites d, with n N d i j _ t r i g being the number of triggered ligand-gated ion channels, type l of ion i of neuron N specific to neurotransmitter j on dendrites d, and A l i , with this being the area of the type l ligand-gated ion channel of ion i in [m2]. The sum of α N d i j from all the dendrites of a postsynaptic neuron, N,
α N i j ( t ) = d α N d i j ( t )
is the total cross-sectional area of the activated ligand-gated ion channels of neuron N. In the case of voltage-gated ion channels in the unit of [m2],
α N v i ( t ) = n N v i ( t ) A v i where   { n N v N a + ( t ) = 1.06 × 10 7   if   V m N ( t ) threshold   potential n N v K + ( t ) = 2.76 × 10 7   if   V m N ( t ) threshold   potential n N v C a 2 + ( t ) = 2.81 × 10 5   if   V m N ( t ) threshold   potential n N v i ( t ) = 0   if   V m N ( t ) < threshold   potential
is the availability of the voltage-gated ion channels of ion i of neuron N. nNvi is the number of triggered voltage-gated ion channels of ion i of neuron N, and Avi is the area of the voltage-gated ion channel of ion i in [m2].
The electron volt of neuron N
e V N i ( t ) = ( μ N M i ¯ ( t ) m o l ) × n A P N a + × 1 A m p A P
defines the energy required to translate one charge of ion species i across the membrane of neuron N, with mol being the mole number 6.022 × 10 23 , n A P _ N a + 2 × 10 6 , and A m p A P 0.1   V . The equivalent charge in coulombs due to ion influx can also be calculated. More specifically, the membrane potential is the measure of the potential energy of the cell membrane in voltage. Voltage is the measure of the energy that a charge requires for it to move between two points in space. The membrane potential of a neuron is the potential energy measured in voltage an ion requires to flow across the membrane. Furthermore, electron volt ( e V ) defines the kinetic energy required for one single ion or electron to flow across an electric potential of one volt in vacuum from rest. In an ideal vacuum environment, 1 eV equals to 1.602 × 10 19 joule. That is, in an ideal environment, each ion of one charge causes one volt of potential energy rise or drop, requiring 1 eV of energy. However, a biological cell is a complex system that is not an ideal environment. More than 1.602 × 10 19 joule is required for one charge of ion to flow across the neuron membrane and cause a fluctuation in electric potential of 1 volt. Therefore, this study defines the electron volt of neuron e V N i as shown in Equation (9). Because (1) physiological observations reveal that 2 to 100 million sodium ions are required to pass across the neuron membrane in the entire action potential firing process, (2) the amplitude of the membrane potential of an action potential firing, A m p A P , is approximately 0.1 V (−70 mV to 50 mV), (3) electrochemical gradient ( μ N M i ¯ ( t ) ) defines the potential energy of ion i per mole, and (4) through conservation of energy principles, one can obtain the kinetic energy required for one charge of ion species i to cause 1 V of membrane potential rise or drop by multiplying the following: (a) the potential energy of ion i, ( μ N M i ¯ ( t ) m o l ) , (b) the number of sodium ions across the membrane of a neuron throughout the entire action potential firing process, n A P _ N a + , and (c) the reciprocal of the amplitude of action potential in volt, ( 1 A m p A P ) . In this study, n A P _ N a + is assumed to be 2 million and A m p A P is assumed to be 0.1 V. As a result, the electron volt of a neuron e V N i is a function of the electrochemical gradient μ N M i ¯ ( t ) . Through the neuron-specific electronvolt e V N i , Equation (1) describes membrane potential dynamics.
Following the physical principle stated in Equation (2), the change in voltage through the ligand-gated ion channels of ion species i is defined as
V m N l ( t ) = d i ( μ N M i ¯ ( t ) α N d i j ( t ) J N i ( t ) Δ t e V N i ( t ) )
and the change in voltage through the voltage-gated ion channels of ion species i is defined as
V m N v ( t ) = i ( μ N M i ¯ ( t ) α N v i ( t ) J N i ( t ) Δ t e V N i ( t ) )
The change in voltage through the ion pumps of ion specie i is defined as
V p N ( t ) = i ( μ N M V i ¯ ( t ) n p N i ( t ) e V N i )
with n p N i ( t ) being the amount of ion species i pumped across the membrane by ion pump specific to the ion species, and μ N M V i ¯ ( t ) = μ N M i ¯ ( t ) is the electrochemical gradient of the ion species i across the membrane of neuron N in [J/mol]. A more detailed discussion of the dynamics of ligand-gated ion channels, voltage-gated ion channels, and ion pumps are provided in later passages. Since voltage is defined as energy per charge, the fluctuation in membrane potential is calculated by multiplying the potential energy (electrochemical gradient), μ N M i ¯ , with the number of ions that flow across the membrane in addition to the change in voltage caused by the ion pump, as shown in Equation (1).
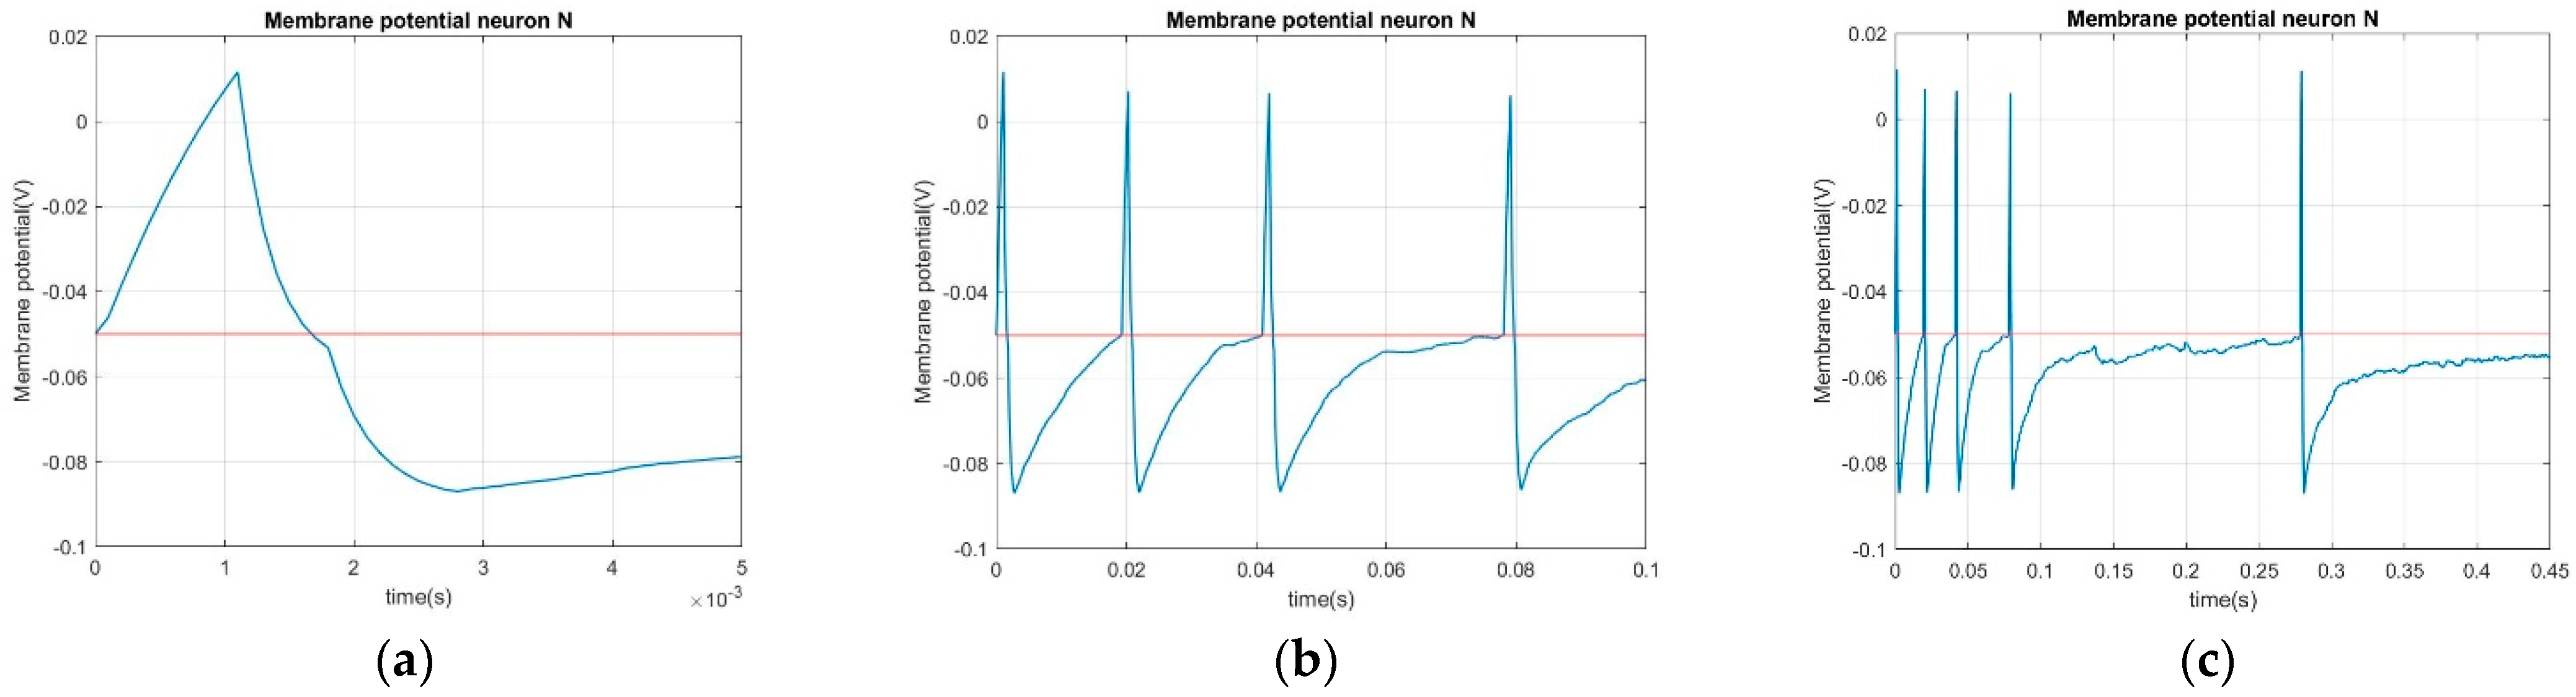
The brain network model describes individual neuron dynamics and inter-neuron coupling. Simulated results generated using the brain network model are shown to demonstrate the same biophysiological characteristic features observed that are fundamental to brain dynamics. To demonstrate the feasibility of the brain network model, the consistency of physical units in the model, the membrane potential dynamics involving ligand-gated channels (postsynaptic potential) and voltage-gated channels (action potential), and ion pump-driven membrane potential dynamics are investigated in the following subsections.

2.2. Dynamics of Ligand-Gated Ion Channels

Both the analog and digital portions of membrane potential dynamics are described in the same mathematical form, as shown in Equations (10) and (11). However, Equations (6) and (8) have different definition of the availability, α N i , of the ligand-gated and voltage-gated ion channels. Since the focus of this first part of the two-part paper is developing a network model that captures the essential characteristics of brain dynamics, this study considers AMPA receptors and NMDA receptors, the two commonly studied ligand-gated ion channel types that are significant in describing individual neuron dynamics and synaptic dynamics.
AMPA receptors (AMPARs) and NMDA receptors (NMDARs) have been extensively investigated in the literature. These two types of ligand-gated ion channels are considered for their significant implications in neural structure stability and synaptic plasticity (local alterations in coupling configurations steering a global brain dynamical response). Moreover, ion flux passing through AMPARs is composed mainly of Na+ and K+. NMDARs are permeable to Ca2+. This study assumes that AMPARs only allow Na+ and K+ flux and NMDARs only allow Ca2+ flux for simplicity in order to more prominently capture the Ca2+ concentration, which impacts the magnitude and direction of synaptic plasticity. The availability of ligand-gated ion channels, which underlines the analog dynamics of the membrane potential, is defined below.
Equations (13)–(22) describe the mechanisms of the ligand-gated ion channels’ AMPARs and NMDARs. Assuming that a postsynaptic neuron, N, is receiving a neurotransmitter from a presynaptic neuron, M, via dendrite number d:
φ N d N T l j ( t ) = φ N d N T l j ( t 1 ) + N T M N d l j ( t ) N T N d e z c j ( t ) N T M N d r l j ( t ) where   { φ N d N T l j ( t ) = high   concentration   if   A P M   fires φ N d N T l j ( t ) = low   concentration   if   A P M   not   fires   long   enough A P M :   the   action   potential   of   neuron   M
Equation (13) describes the physiological fluctuation in neurotransmitter concentration in the synaptic cleft where φ N d N T l j is the concentration of neurotransmitter j that activates the type l ligand-gated ion channel on dendrite d of neuron N in [mol/m3], N T M N d l j is the concentration of neurotransmitter j released by presynaptic neuron M that activates the type l ligand-gated ion channel on dendrite d of neuron N in [mol/m3], N T N d e z l j is the concentration of neurotransmitter j that activates the type l ligand-gated ion channel degraded by enzymes in the synaptic cleft connected to dendrite d of neuron N in [mol/m3], and N T M N d r l j is the concentration of neurotransmitter j that activates the type l ligand-gated ion channel that is taken up again by presynaptic neuron M in [mol/m3]. The concentration of neurotransmitter j, φ N d N T l j ( t ) , rises to a high level when the presynaptic neuron M fires the action potential (AP) and drops to a low level while the presynaptic neuron M does not fire the AP for a prolonged duration. The neurotransmitter concentration can be decreased by N T N d e z l j amount due to enzymatic degradation in the synaptic cleft and re-uptake by N T M N d r l j amount by presynaptic neuron M for reuse to conserve energy consumption. With the remaining concentration of neurotransmitters, φ N d N T l j ( t ) , the flux and number of neurotransmitters in the synaptic cleft can be calculated using
J N d N T l j ( t ) = D j φ N d N T l j x
where J N d N T l j is the neurotransmitter flux that triggers the type l ligand-gated ion channel on dendrite d of neuron N in [mol/m2 s], D j is the diffusion constant of neurotransmitter j in [m2/s]. The probability of each of the neurotransmitters that trigger the corresponding ligand-gated ion channels is generally unavailable. This study uses the cumulative cross-sectional area of the neurotransmitters of each
A N d N T l j _ t o t a l ( t ) = J N d N T l j ( t ) × A N d × Δ t × A N T l j
and the cumulative cross-sectional neurotransmitter binding site area of the available ligand-gated ion channels of each type
A N d N l j _ a v l ( t ) = A N T D × n N d N l j _ a v l ( t )
to establish a rough estimation of the probability of triggering each type l ligand-gated ion channel specific to neurotransmitter j, as follows
P N d N l j = A N d N T l j _ t o t a l ( t ) A N d × A N d N l j _ a v l ( t ) A N d
where A N d N T l j _ t o t a l is the sum of the cross-sectional area of all the neurotransmitter, j, that activates the type l ligand-gated ion channel on the surface of dendrite d of neuron N in [m2], A N d is the surface area of the dendrite d of neuron N in [m2], Δ t is the calculation time step in [s], A N T l j is the cross-sectional area of neurotransmitter j, which activates the type l ligand-gated ion channel in [m2], A N d N l j _ a v l is the cumulative cross-sectional neurotransmitter binding site area of the available type l ligand-gated ion channels specific to neurotransmitter j on dendrite d of neuron N in [m2], A N T D is the cross-sectional neurotransmitter binding site area in [m2] approximated using the N-terminal domain (NTD) area, and subscript n N d N l j _ a v l is the number of available type l ligand-gated ion channels specific to neurotransmitter j on dendrite d of neuron N. The number of triggered ligand-gated channels is thus
n N d N l j _ t r i g ( t ) = n N d N l j _ t r i g ( t 1 ) + n N d N l j _ a v l ( t ) × P N d N l j
where the total number of ligand-gated channels is
n N d N l j _ M A X ( t ) = n N d N l j _ a v l ( t ) + n N d N l j _ t r i g ( t )
Lastly, each triggered AMPAR and NMDAR are not available to receive further neurotransmitters, and each triggered AMPAR and NMDAR returns to the available state (permitting ion flux) in Δ t A M P A R i = 15 ms and Δ t N M D A R i = 225 ms from the moment of triggering, respectively.
As a result, the coupling relationship between the presynaptic neuron M and the postsynaptic neuron N is defined using the concentration of the released neurotransmitters from neuron M and the probability of triggering the ligand-gated ion channels of neuron N by the released neurotransmitters. It is noted that the ion concentration is proportional to the probability of ligand-gated ion channel activation, and the respective ion flux determines the level of influence a presynaptic neuron has upon a postsynaptic neuron.
Synaptic plasticity is a key phenomenon that changes the receiver behavior of a postsynaptic neuron in adjusting the degree of coupling of the connected presynaptic neurons. Mg2+ blockage to NMDARs is one of the key mechanisms of spike time-dependent plasticity (STDP), which is one of many forms of synaptic plasticity. Furthermore, Mg2+ is directly related to the Ca2+ concentration in postsynaptic neurons since NMDARs are more permeable to Ca2+. Mg2+ blockage is considered in this study through Coulomb’s law in Equation (20) to ensure realistic NMDAR behaviors. Additionally, since NMDARs are more permeable to Ca2+, Mg2+ blockage controls the Ca2+ concentration in postsynaptic neuron. This study assumes NMDARs to be permeable to Ca2+ only.
F M g 2 + = K q M g 2 + Q m N r 2
Q m N = C m V m N
F M g 2 + m M g 2 + = a M g 2 +
where F M g 2 + is the electrostatic force reacting on the Mg2+ that is close to the membrane of neuron N in [Newton], K is the Coulomb’s constant in [ N · m 2 C 2 ], q M g 2 + is the charge of Mg2+ in [C], Q m N is the charge of the membrane of neuron N in [C], C m is the capacity of the membrane of neuron N in [F], V m N is the membrane potential of neuron N in [V], m M g 2 + is the mass of Mg2+ in [kg], and a M g 2 + is the acceleration of Mg2+ in [ m s 2 ]. Trivial double integration can be utilized to approximate the location of the Mg2+ ions within the pores of the NMDARs to determine the level of blockage, if any.

2.3. Dynamics of Voltage-Gated Ion Channels

The postsynaptic potential, along with its underlying mechanism, which governs the analog portion of the membrane potential was elaborated on in the previous section. The mechanism that dictates the action potential and describes the digital portion of the membrane potential is of the same principle but with a different triggering condition. While ligand-gated ion channels are triggered by the neurotransmitters released by the presynaptic neurons, voltage-gated ion channels are triggered by the membrane potential of the postsynaptic neurons. When the membrane potential of a postsynaptic neuron rises from a resting potential and reaches the threshold potential, the voltage-gated ion channels on the same postsynaptic neuron are triggered to allow for ion influx. As the number of voltage-gated ion channels is usually many times larger than the number of ligand-gated ion channels on the neurons, membrane potentials usually display sharp spikes in times when voltage-gated ion channels are triggered. The voltage rise of an action potential depolarization is caused by a sudden large influx of Na+ for a short period of time, followed by a sudden large outflux of K+ that causes the voltage drop repolarization of the action potential. In other words, there exists a time delay in the triggering of the Na+ and K+ voltage-gated channels crucial for defining the action potential profile. This study uses the widely referenced action potential time profile found in Figure 22 in [12], to demonstrate the validity of the brain network model in terms of describing neuron dynamics. It is assumed that all voltage-gated Na+ channels are triggered at the threshold potential at −50 mV, and all voltage-gated K+ channels are triggered with a 1 ms delay after the threshold potential is reached. Triggered voltage-gated Na+ channels close when the repolarization of the action potential drops below the threshold potential. Triggered voltage-gated K+ channels follow the same procedure, with a 1 ms time delay to ensure K+ channels open after Na+, so as to be in agreement with the observed action potential profile in accurately resolving spike depolarization and repolarization.
The impact of voltage-gated Ca2+ channels on action potential dynamics is also considered in this study. Ca2+ plays the role of being a secondary message to trigger biological responses including various modes of synaptic plasticity [13]. While a detailed treatment on synaptic plasticity is outside the scope of this study, it is beneficial to consider the effect of voltage-gated Ca2+ channels on action potential dynamics to set the stage for future study. Moreover, although Ca2+ influx through voltage-gated Ca2+ channels does not contribute as significantly to the profile of the action potential as Na+ influx through voltage-gated Na+ channels, voltage-gated Ca2+ channels are key to understanding synaptic plasticity. Synaptic plasticity underlies neuron dynamics in that it induces changes in the number of ligand-gated ion channels and further alters the signal receiving behavior of the neuron. In other words, this can significantly influence the coupling strength between neurons. In this study, the triggering and termination procedures of voltage-gated Ca2+ channels are assumed to follow the same procedure of voltag-gated Na+ channels, i.e., they are triggered when the membrane potential is higher than the threshold potential and are terminated when the membrane potential is lower than the threshold potential. With the description and assumption of voltage-gated Na+, K+, and Ca2+ channels now defined, the action potential dynamics can now be described.

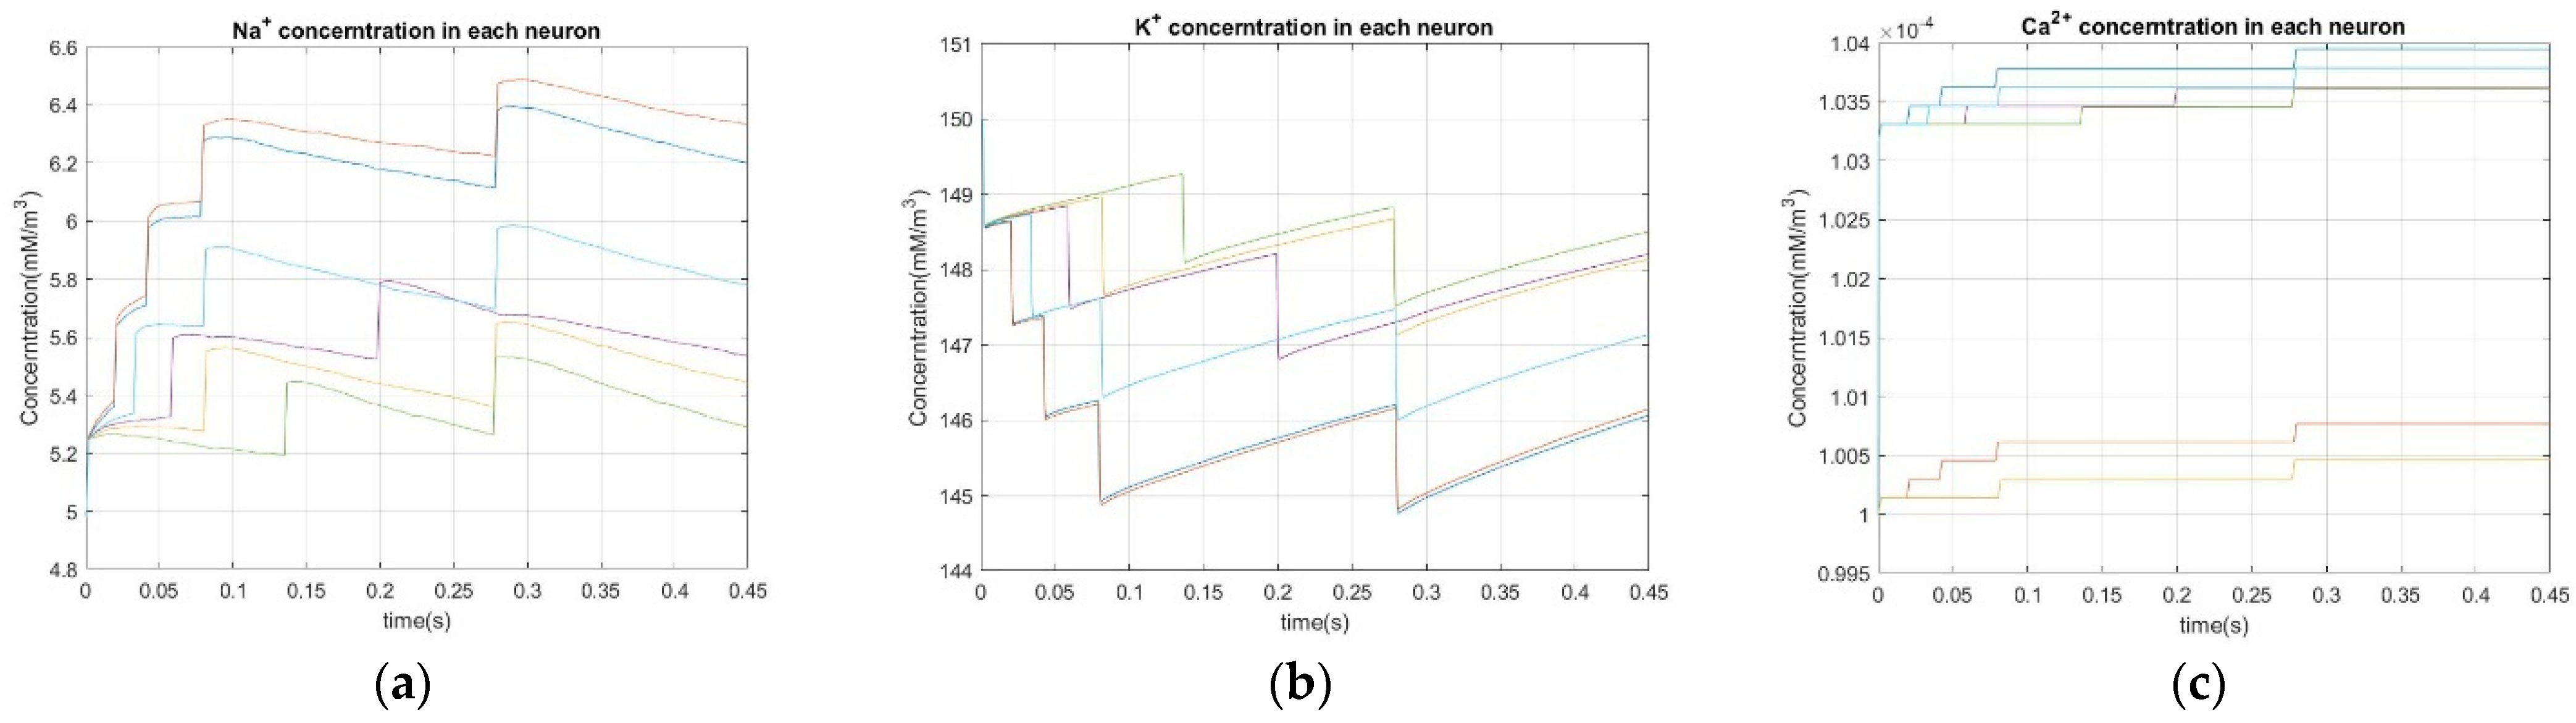
2.4. Dynamics of Ion Pumps

In maintaining the membrane potential so that it is able to trigger presynaptic neuron dynamics, the ion concentration must be restored to a resting state from a state of being perturbed by ligand-gated and voltage-gated ion channel ionic flux. Imbalanced ion concentrations lead to a reversal of the electrochemical gradient in the direction of the flux. Thus, modeling ion pumps is crucial to describe the membrane potential. Considering that physiological observations pertaining to ion pumps are not comprehensive enough to develop a general governing law of ion pumps, this study develops Equation (23) to describe ion pump dynamics by curve fitting the physical data published in [14,15]. The fundamental premise of the equation is that ion pump activity (ion flux) is higher when ion concentrations are further away from the resting potential condition and vice-versa. Equation (12), the governing law of ion pump dynamics, will need to be revised once more comprehensive physiological observations are available.
Refs. [14,15] provide a curve-fitted relationship between Na+ efflux and the Na+ concentration of an Na+-K+ pump using experimental data acquired from rats. A small number of Na+-K+ pumps equations are also found in [14]. These equations have been subsequently revised by others to incorporate parameters that are of no physical basis. These studies define the change in the membrane potential due to Na+-K+ pumps as a function of Na+ and K+ concentrations. As previously discussed, the electron volt, e V , of a neuron membrane is a time-dependent variable and a function of the electrochemical gradient, μ N M i ¯ ( t ) , which is a function of ion concentrations. Equations in [14] overlook fundamental factors that contribute to the change in membrane potential caused by Na+-K+ pumps. These Na+-K+ pump equations are inadequate in describing Na+-K+ pump dynamics.
Since ion pumps are crucial to membrane potential dynamics, the underlying mechanism must be properly described. Despite there being insufficient physiological data for one to develop a model that describes ion pumps dynamics, this study provides (1) a preliminary Na+-K+ pump mechanism using an estimated relationship between the pump cycle per unit time and the Na+ concentration of the postsynaptic neuron and (2) a rough estimation of Ca2+ pump dynamics.
Na+-K+ pumps dynamics for human beings and rats are functions of Na+ concentrations. This study assumes Na+-K+ pumps for humans and rats are similar. The normalized Na+-K+ pump Na+ efflux versus Na+ relationship conducted by Blom et al. in [15] can be denormalized and mapped to the corresponding Na+-K+ pump condition in humans. Since the α1 curve seen in Figure 5a in [15] is a Heaviside step function, the following smooth approximation of the same curve is used in the study:
n p N N a + = ( 1 1 + e a C N N a + i n 2 b C N N a + i n c ) × C P I p N a + K + × V o l m e m e × n p N N a + K +
where n p N N a + is the number of Na+ pumped out of neuron N according to the concentration of Na+ in neuron N, a = 0.003936 , b = 0.3919 , c = 4.227 , and C N N a + i n is the concentration of Na+ in neuron N, C P I p N a + K + is the number of cycles of Na+-K+ pumps per simulation iteration, V o l m e m e is the volume of the static electric force effective zone on the inside of the membrane of neuron N, with the ion effecting zone being in [m3], and n p N N a + K + = 8 × 10 4 ~ 3 × 10 7 is the number of Na+-K+ pumps neuron N has. Instead of defining the relationship between Na+ concentration and membrane potential in voltage, Equation (23) describes the relationship between the Na+ concentration of neuron N and the number of Na+ been pumped out of neuron N in a given time. The corresponding change in membrane potential in voltage can be obtained using
V p N ( t ) = i ( μ N M V i ¯ ( t ) n p N i ( t ) e V N i )
where μ N M V i ¯ ( t ) = μ N M i ¯ ( t ) . Additionally, the number of cycles of Na+-K+ pumps per minute, C P M p N a + K + , is approximately in the range between 8000 and 10,000 [16],
C P I p N a + K + = ( C P M p N a + K + × 3 60 ) × Δ t
with Δ t being the time step of each calculation iteration in [s]. Furthermore, since for every 2 K+ that are pumped into the membrane, 3 Na+ are pumped out through the same Na+-K+ pumps, with the 2- to −3 ratio between K+ and Na+ being defined as a constraint condition, as follows,
n p N K + = 2 3 × n p N N a +
where n p N K + is the number of K+ pumped out of neuron N.
Compared to Na+-K+ pumps, knowledge of Ca2+ pumps and their physiology is even more incomprehensive. Thus, this study uses the concentration difference of Ca2+ from the lowest commonly observed value to the current calculated value in neuron N to estimate the number of Ca2+ pumped out from neuron N in each simulation iteration, as shown in Equation (27).
n p N C a 2 + = ( e C N C a 2 + 0.009 10 28 ) × Δ t
where n p N C a 2 + = 0   i f   n p N C a 2 + < 0.009 is the number of Ca2+ pumped out of neuron N according to the concentration of Ca2+ in neuron N and C N C a 2 + i n is the concentration of Ca2+ in neuron N in [mol/m3]. Note that Equation (27) is a rough estimate of the mechanism of Ca2+ pumps. The underlying logic is that the rate of Ca2+ expulsion increases if the intracellular Ca2+ rises significantly above its normal, homeostasis level and vice versa. The mathematical form that describes Ca2+ pumps is similar to the one that describes Na+-K+ pumps. Equation (27) will be need to be revised as comprehensive physiological observations become available.
With the descriptions of Na+-K+ pump and Ca2+ pump in hand, the brain network model can describe membrane potential dynamics and estimate the refractory time after hyperpolarization, a process primarily driven by active ion transport through the ion pumps. Since the change in membrane potential caused by the ion pumps requires energy by consuming ATP, the relationship between the energy that ATP provides and neurons needs be established. The brain network model describes individual neuron dynamics using energy. As membrane potential is the ionic potential energy of the membrane, it is intuitive to use ATP consumption to describe ion pump dynamics.
In summary, synaptic dynamics have the following underlying mechanisms that dictate (1) the postsynaptic potential using Equation (10), (2) the action potential using Equation (11), and (3) ion pump dynamics using Equation (12). As the membrane potential is the potential energy of the membrane in voltage, neuron dynamics are described using energy by the corresponding governing laws. Since energy is normally distributed, information entropy is then applied to gauge the dynamic state of the brain network by considering the distribution of the coupling strengths of the neurons defined in voltage.

3. Result and Discussion

A six-neuron brain network model is studied in the present section to show that neuron dynamics indeed capture the various characteristic time scales seen in the membrane potential acquired from physiological experiments. Neuron dynamics describes the time evolution of the membrane potential of each neuron. Membrane potential profiles observed in reported physiological studies are used to compare with the results obtained from the six-neuron network model for agreements in prominent features. Proper ranges of Na+, K+, and Ca2+ concentrations are determined to show that ion pump dynamics as defined by the network model induce realistic membrane potentials.
To validate the model, a set of physiological neuron properties is selected. Only the prominent time scales featured in physical membrane potential data are considered when compared with the results generated by the network model. The reason for this is that the time evolution of the membrane potential is the manifestation of postsynaptic dynamics, action potential dynamics, and ion pump dynamics. However, considering that (1) the time progression of postsynaptic potential is random due to the dependency of the signal (neurotransmitters) received from the presynaptic neuron, (2) each action potential firing is roughly repeated at the same time scale due to the related ion channels having been triggered by the voltage of the membrane (i.e., voltage dependent ion channels), and (3) ion pump dynamics are dependent on ion concentrations that fluctuates in time, the action potential time profiles serve better as a reference of choice. The magnitude of the computed membrane potential is credible for the reason that the model was developed to obey physical laws.
Regarding the time scale of the membrane potential, this study uses the neural response on the faster end of the spectrum documented in [11] where the action potentials is observed to come with a duration of 2 ms. The action potential profile features a depolarization of 1 ms in duration and a repolarization of 1 ms in duration, including a 2 ms pump refractory time. Regarding the time scale of the postsynaptic potential, although the profile is dependent upon the signal transmitted by the presynaptic neuron, the postsynaptic potential of the postsynaptic neuron usually requires 10 to 20 ms to rise from the resting potential to the threshold potential provided that the presynaptic neuron fires the action potential and continuously releases neurotransmitters [17]. Note that the referenced membrane potential profile is not universal. Different types of neurons have their unique membrane potential characteristics.
In general, systems with faster system responses are usually of smaller mass and higher frequency in nature. Therefore, choices of neuron volume are those on the smaller end of the observed data [18]. Assuming that ion density is the same for all neurons, the smaller the volume of a neuron, the less ions are required to flow across the membrane to induce the same amount of changes in membrane potential. Moreover, for a neuron to have a faster response in terms of firing action potential, the number of ligand-gated ion channels must be on the higher end of the physical data. The more ligand-gated ion channels a neuron has, the higher ion flux is allowed to flow across the membrane per unit time. As a result, the postsynaptic potential would rise faster to reach the threshold potential to fire the action potential. Due to the very small number of neurons in the brain network considered in the simulation, a proper number of dendritic spines are considered to ensure that the threshold potential can be sufficiently attained within a reasonable amount of time. This is necessary so that the timescale of the ion flux across the ligand-gated channels inducing the postsynaptic potential is similar to observations made in electrophysiological measurements. A neuron can be connected to 10,000 presynaptic neurons to have enough amplitude increase in voltage to be observed. As each individual neuron receives signals from five presynaptic neurons, the number of inputs to each postsynaptic neuron in the simulated environment must be scaled up to allow enough ion fluxes across the membrane to induce a membrane potential rise to trigger action potential firing. Otherwise, it will take significantly longer time for each neuron to reach the threshold potential. Individual neurons in the six-neuron network, with each having five coupled presynaptic neurons, are connected to a large number of presynaptic neurons, as neurons usually are in reality. The scaling must align with real-life presynaptic–postsynaptic neuron connection scenarios. However, the range of the possible number of inputs a postsynaptic neuron can have from the presynaptic neurons is wide. A neuron can have as many as 1.5 × 10 4 dendritic spines [19], while in some cases a neuron can receive 1 × 10 5 inputs [20]. Since each dendritic spine serves as an input terminal to a postsynaptic neuron, it is reasonable to assume that certain neural structures are too small to be observed. As the exact number of dendritic spines of any neuron is unavailable, this study assumes that at each of the five postsynaptic sites there are 3 × 10 4 dendritic spines [21], with each having three colonies of 25 AMPARs and 6 NAMARs [22,23]. Consequently, the number of ligand-gated ion channels must be scaled up to allow sufficient ion flux to generate a proper postsynaptic potential response to trigger action potential firing.
All six neurons are assumed to have the same biophysical properties. The key parameters that are significant to generate characteristic neural dynamics are tabulated in Table 2. All six neurons serve as both presynaptic and postsynaptic neurons to each other. They do not transmit signals to or receive signals from themselves. The membrane potentials of all the six neurons are assumed to be at the threshold potential at t = 0 s. That is, all six neurons are under the same initial conditions.
The membrane potentials of neuron N plotted in Figure 1 indicate neuron dynamics. Figure 1c shows the membrane potential of the neuron over a 0.45 s time window. Figure 1a,b are zoom-ins on Figure 1c, with the former showing the profile of one action potential firing and four in the latter. Prominent features typical of a fast response action potential are seen in Figure 1. At t = 0 s, the membrane potential registers a threshold potential at −50 mV, with both voltage-gated Na+ and K+ channels been triggered. Voltage-gated Na+ channels are triggered as soon as the threshold potential is reached, while voltage-gated K+ channels have a 1 ms delay before being fully opened. Figure 1a shows that depolarization caused by Na+ influx through voltage-gated Na+ channels starts at t = 0 s and terminats at approximately t = 1 ms due to voltage-gated K+ channels being fully opened. The membrane potential then enters the repolarization phase. Note that at t > 1 ms, the decreasing membrane potential shows a change in slope due to the termination of the voltage-gated Na+ channels. Similarly, voltage-gated K+ channels are terminated at t = 2.8 ms, 1 ms after the membrane potential drops below the threshold value. The whole action potential firing lasts for 2.5 ms. The various time scales in the profile are in agreement with physiological observations. That is, the governing laws defined in Equations (1) and (10)–(12) properly describe the mechanism behind the voltage-gated ion channels. Moreover, the 20 ms duration seen in Figure 1b for the postsynaptic potential is also in agreement with published postsynaptic potential data. The governing law defined in Equation (12) also accurately describes the mechanism behind the ion pumps.
Figure 2 shows the time evolution of the ion concentration of all six neurons over the 0.45 s simulation time window. All the three ions oscillate in the range of concentration that is physically observed: 5~15 millimole for the Na+ concentration, 140~150 millimole for the K+ concentration, and 0.0001~0.0015 millimole for the Ca2+ concentration [26]. It is seen that the ion pumps defined in the brain network model are able to maintain ion concentrations in ranges that are commonly observed. Figure 2 also shows that the ion pumps are able to restore the membrane potential to the resting value after firing within a time span (approximately 5 ms) that is in agreement with [27]. It is noted that each of the rises and drops in the ion concentrations seen in Figure 2 are synchronized with the firing of the action potential. The steps seen in the ion concentration plot are caused by the sudden large Na+ and Ca2+ influx and K+ efflux across the voltage-gated ion channels when each action potential fires. The slope of each ion concentration indicates the corresponding ion flux through the ligand-gated ion channels. The ion concentrations are effectively maintained by the ion pumps at where zero slopes are indicated. It is seen that the time evolutions of the postsynaptic potential, action potential, and ion pumps are all properly resolved by their respective governing law of dynamics. Note that the observations made in the case of Na+ and K+ ion concentrations are not as significant as for the case of Ca2+ because the range of Ca2+ concentration fluctuation is smaller due to the Mg2+ blockage of NMDARs (the ligand-gated ion channels allow for Ca2+ flux) are only unblocked briefly after each action potential firing, as seen in Figure 3.
In summary, the results given in Figure 1 and Figure 2 show that the various time scales featured in the computed action potentials agree well with the published physical data. The computed postsynaptic potentials also fall in the time range reported in the literature. Ion pumps are able to maintain the concentrations of the three ions within a physically realistic range. With the feasibility of the neuron model demonstrated, individual neuron dynamics can now be defined using the governing laws of the brain network model.

4. Summary

The governing laws of the brain network model have been shown to capture neuron dynamics and synaptic dynamics by their fundamental characteristics. The laws of physics that govern individual neuron dynamics make explicit the mechanism that drives brain dynamics. The computed membrane potential profiles were seen to be more realistic than those of HH-based models and mathematically fitted models. However, many key parameters required by the brain network model are unavailable. Certain mechanisms that dictate individual neuron dynamics are yet to be fully established. As indicated by this study on formulating this brain network model, more specific biophysiological measurements are needed for neuroscience, physiology, and electrophysiology research and medical instrument design to be able to chart future paths. Novel physiological measuring devices and methodologies that address the insufficiencies indicated by the brain network model would help to enable a better understanding of the brain. The brain network model can be further refined to realize a greater capability and capacity. A refined brain network model would aid in the development of physiological methods for the reason that they are mutually complementary.
The governing laws formulated in this first part of this two-Part paper described individual neuron dynamics and synaptic dynamics at the local level of the brain network. In Part 2, the general framework for dynamical complex networks [28] was implemented to provide a global description of brain network dynamics. At the local level, individual neuron dynamics are described using energy. Considered that the coupling relationship between neurons defined by the governing laws is a complex function of several biophysiological measurements that are also time dependent, an explicit description of the dynamic coupling relationship between neurons was given. At the global level, brain network dynamics are described using information entropy.

Author Contributions

Conceptualization, C.-L.Y. and C.S.S.; methodology, C.-L.Y. and C.S.S.; software, C.-L.Y.; validation, C.-L.Y., N.S. and C.S.S.; formal analysis, C.-L.Y. and C.S.S.; writing—original draft preparation, C.-L.Y.; writing—review and editing, N.S. and C.S.S. All authors have read and agreed to the published version of the manuscript.

Funding

This research received no external funding.

Data Availability Statement

This study is not of data science field. No data are available to the public. The method and procedure to develop the model that generates data are provided in this article.

Conflicts of Interest

The authors declare no conflict of interest.

References

  1. Shettigar, N.; Yang, C.-L.; Tu, K.-C.; Suh, C.S. On The Biophysical Complexity of Brain Dynamics: An Outlook. Dynamics 2022, 2, 114–148. [Google Scholar] [CrossRef]
  2. Lyon, A. Why are Normal Distributions Normal? Brit. J. Philos. Sci. 2014, 65, 621–649. [Google Scholar] [CrossRef] [Green Version]
  3. Shannon, C.E.; Weaver, W. The Mathematical Theory of Communication; University of Illinois Press: Champaign, IL, USA, 1949. [Google Scholar]
  4. Takagi, K. Energy constraints on brain network formation. Sci. Rep. 2021, 11, 11745. [Google Scholar] [CrossRef] [PubMed]
  5. Jirsa, V.; Sheheitli, H. Entropy, free energy, symmetry and dynamics in the brain. J. Phys. Complex. 2022, 3, 015007. [Google Scholar] [CrossRef]
  6. Zhu, Z.; Wang, R.; Zhu, F. The energy coding of a structural neural network based on the Hodgkin–Huxley model. Front. Neurosci. 2018, 12, 122. [Google Scholar] [CrossRef] [PubMed] [Green Version]
  7. Tomasi, D.; Wang, G.J.; Volkow, N.D. Energetic cost of brain functional connectivity. Proc. Natl. Acad. Sci. USA 2013, 110, 13642–13647. [Google Scholar] [CrossRef] [Green Version]
  8. Friston, K. The free-energy principle: A unified brain theory? Nat. Rev. Neurosci. 2010, 11, 127–138. [Google Scholar] [CrossRef]
  9. Watanabe, T.; Hirose, S.; Wada, H.; Imai, Y.; Machida, T.; Shirouzu, I.; Konishi, S.; Miyashita, Y.; Masuda, N. Energy landscapes of resting-state brain networks. Front. Neuroinform. 2014, 8, 12. [Google Scholar] [CrossRef] [Green Version]
  10. Williams, S.R.; Wozny, C. Errors in the measurement of voltage-activated ion channels in cell-attached patch-clamp recordings. Nat. Commun. 2011, 2, 242. [Google Scholar] [CrossRef] [Green Version]
  11. Bean, B. The action potential in mammalian central neurons. Nat. Rev. Neurosci. 2007, 8, 451–465. [Google Scholar] [CrossRef]
  12. Hodgkin, A.L.; Huxley, A.F. A quantitative description of membrane current and its application to conduction and excitation in nerve. J. Physiol. 1952, 117, 500–544. [Google Scholar] [CrossRef] [PubMed]
  13. Bear, M.F.; Connors, B.W.; Paradisio, M.A. Neuroscience: Exploring the Brain, 3rd ed.; Lippincott, Williams & Wilkins: Philadelphia, PA, USA, 2007. [Google Scholar]
  14. Zahler, R.; Zhang, Z.T.; Manor, M.; Boron, W.F. Sodium kinetics of Na,K-ATPase alpha isoforms in intact transfected HeLa cells. J. Gen. Physiol. 1997, 110, 201–213. [Google Scholar] [CrossRef] [PubMed] [Green Version]
  15. Blom, H.; Bernhem, K.; Brismar, H. Sodium pump organization in dendritic spines. Neurophotonics 2016, 3, 041803. [Google Scholar] [CrossRef] [PubMed] [Green Version]
  16. Liang, M.; Tian, J.; Liu, L.; Pierre, S.; Liu, J.; Shapiro, J.; Xie, Z.J. Identification of a pool of non-pumping Na/K-ATPase. J. Biol. Chem. 2007, 282, 10585–10593. [Google Scholar] [CrossRef] [PubMed] [Green Version]
  17. Azouz, R.; Gray, C.M. Dynamic spike threshold reveals a mechanism for synaptic coincidence detection in cortical neurons In Vivo. Proc. Natl. Acad. Sci. USA 2000, 97, 8110–8115. [Google Scholar] [CrossRef] [Green Version]
  18. Swiegers, J.; Bhagwandin, A.; Sherwood, C.C.; Bertelsen, M.F.; Maseko, B.C.; Hemingway, J.; Rockland, K.S.; Molnár, Z.; Manger, P.R. The distribution, number, and certain neurochemical identities of infracortical white matter neurons in a lar gibbon (Hylobates lar) brain. J. Comp. Neurol. 2019, 527, 1633–1653. [Google Scholar] [CrossRef]
  19. Koch, C.; Zador, A. The Function of Dendritic Spines: Devices Subserving Biochemical Rather than Electrical Compartmentalization. J. Neurosci. 1993, 13, 413–422. [Google Scholar] [CrossRef] [Green Version]
  20. Alberts, B. Essential Cell Biology, 3rd ed.; Garland Science: New York, NY, USA, 2009; ISBN 978-0-8153-4129-1. [Google Scholar]
  21. Santuy, A.; Tomás-Roca, L.; Rodríguez, J.R.; González-Soriano, J.; Zhu, F.; Qiu, Z.; Grant, S.G.N.; DeFelipe, J.; Merchan-Perez, A. Estimation of the Number of Synapses in the Hippocampus and Brain-Wide by Volume Electron Microscopy and Genetic Labeling. Sci. Rep. 2020, 10, 14014. [Google Scholar] [CrossRef]
  22. Park, M. AMPA receptor trafficking for postsynaptic potentiation. Front. Cell. Neurosci. 2018, 12, 361. [Google Scholar] [CrossRef]
  23. Myme, C.I.; Sugino, K.; Turrigiano, G.G.; Nelson, S.B. The NMDA-to-AMPA ratio at synapses onto layer 2/3 pyramidal neurons is conserved across prefrontal and visual cortices. J. Neurophysiol. 2003, 90, 771–779. [Google Scholar] [CrossRef] [Green Version]
  24. García-Nafría, J.; Herguedas, B.; Watson, J.F.; Greger, I.H. The dynamic AMPA receptor extracellular region: A platform for synaptic protein interactions. J. Physiol. 2016, 594, 5449–5458. [Google Scholar] [CrossRef] [PubMed] [Green Version]
  25. Milo, R.; Jorgensen, P.; Moran, U.; Weber, G.; Springer, M. BioNumbers—The database of key numbers in molecular and cell biology. Nucl. Acids Res. 2010, 38 (Suppl. 1), D750–D753. Available online: https://bionumbers.hms.harvard.edu/bionumber.aspx?id=108451&ver=12&trm=108451&org= (accessed on 14 December 2022). [CrossRef] [PubMed] [Green Version]
  26. Tagluk, M.E.; Tekin, R. The influence of ion concentrations on the dynamic behavior of the Hodgkin-Huxley model-based cortical network. Cogn. Neurodyn. 2014, 8, 287–298. [Google Scholar] [CrossRef] [PubMed] [Green Version]
  27. Yeomans, J.S. The absolute refractory periods of self-stimulation neurons. Physiol. Behav. 1979, 22, 911–919. [Google Scholar] [CrossRef] [PubMed]
  28. Yang, C.-L.; Suh, C.S. A General Framework for Dynamic Complex Networks. J. Vib. Test. Syst. Dyn. 2021, 5, 87–111. [Google Scholar] [CrossRef]
Figure 1. Membrane potential of neuron N—individual neuron dynamics (ac).
Dynamics 03 00007 g001
Figure 2. Ion concentration in each neuron ((a) Na+ concentration in each neuron; (b) K+ concentration in each neuron; (c) Ca+ concentration in each neuron).
Dynamics 03 00007 g002
Figure 3. Change in the charge of Ca2+ across the membrane of each neuron.
Dynamics 03 00007 g003
Table 1. Notations used in brain model.
NotationIndicatingNotationIndicating
Neuronsnthe nth individual neuron, n = 1~ nnnnnn number of neurons in the brain network of interest
Dendritesdthe dth dendrite of a neuron, d = 1~dndneach neuron has dn number of dendrites
Ion i ion number i, i = 1~ininin of ions under consideration
Neurotransmitters j neurotransmitter number j,
j = 1~jn
jnjn of neurotransmitter under consideration
Type of ligand-gated channelsl Ligand-gated ion channels type number l, l = 1~lnlnln types of ligand-gated ion channels under consideration
Presynaptic neuronMpresynaptic neuron M, M = 1~nn
Postsynaptic neuronN postsynaptic neuron N, N = 1~nn
Voltage-gated ion channelsvproperties of voltage-gated ion channels
Ion pumpspproperties of ion pumps
Table 2. Parameters of individual neurons.
ParameterValue Used in Simulation
Time step of simulation iteration 1 × 10 4   s = 10,000 Hz
Fastest responding ion channel Δ t A M P A R i
Δ t A M P A R i 1.5 × 10 3   s
Characteristic system frequency of neuron 1 Δ t A M P A R i = 666.667   Hz
Neuron cell volume 524   μ m 3
Na+ concentration5–15 [mM] (millimole)
K+ concentration140–150 [mM]
Ca2+ concentration0.1 [mM]
Number of dendrites per neuron 6
Number of dendritic spins per neuron 3 × 10 4   p e r   d e n d r i t × 6   d e n d r i t s
Number of AMPARs per neuron 25   p e r   c l u s t e r × 3   c l u s t e r s
Number of NMDARs per neuron 6   p e r   c l u s t e r × 3   c l u s t e r s
AMPAR opening areaNTD area
NMDAR opening areaNTD area
NTD area [24] 3.2 × 10 16
Synaptic cleft area [25] 1.6 × 10 15
Disclaimer/Publisher’s Note: The statements, opinions and data contained in all publications are solely those of the individual author(s) and contributor(s) and not of MDPI and/or the editor(s). MDPI and/or the editor(s) disclaim responsibility for any injury to people or property resulting from any ideas, methods, instructions or products referred to in the content.

