Abstract
The present study is an analysis of the processes in the components of the LPG (propane/butane) reliquefaction plant under the conditions of co-mingling in tanks when transporting by sea. For the analysis, the monitoring data of an LPG cargo operation have been used. An energy analysis of the mixture-based reliquefaction plant has been performed. The characteristics of the mixture in the tanks, the operating conditions of the reliquefaction plant, and the performance of the system have been considered. The method of equivalence has been applied for thermodynamic analysis. The result of the substitution of actual processes with equivalent ones allows for the accomplishment of the parameters control of each working fluid within the mixture as a pure working fluid. It is shown that the low-boiling component determines the operating parameters of the entire reliquefaction plant. The method of equivalence and visualization of the processes within the LPG as a mixture using the thermodynamic diagrams of pure working fluids is recommended to shorten the path to set up the appropriate reliquefaction plant management strategy. The energy analysis performed using the method of equivalent cycles has been validated with the existing reliquefaction plant characteristics. The inaccuracies are in the limit of 4%.
1. Introduction
The maritime transport market of liquefied gases has become more significant in recent years, and the number of gas carriers has increased due to the growing demand for alternative fuel. The gas supply in a liquefied state is more profitable since the transportation of the consequent volumes of compressed gases requires higher material costs [1].
Liquefied petroleum gases (LPG) have significant energy potential. The transportation conditions of LPG may vary depending on the customer’s requirements and the thermophysical properties of the cargo. The most common cargoes are propane (C3H8) and butane (C4H10). Charterers or persons with commercial interests are increasingly requesting ship-owners to mix LPG before arrival in the territorial waters of the recipient country. In this case, the mixing of components according to the International Maritime Organization (IMO) requirements can be carried out during loading or unloading or in tanks on the ship itself during the transportation [2]. Most of the vessels with the mixing of components are generally refrigerated vessels [3].
The major difficulties arise during the transportation phase of mixing gases, when the risk of overfilling the tanks increases. Therefore, the tanks are not fully loaded beforehand. The mixing operation generates a large amount of flash gas known as boil-off gas (BOG) controlled by the vessel gas reliquefaction plant. The physicochemical heterogeneity of the cargo has appeared in all components of the reliquefaction plant. In this case, the mixing speed must be carefully controlled so that it is within the performance of the reliquefaction plant.
An important task is to ensure the high efficiency of the operating reliquefaction plant. Thus, it is necessary to control the parameters of the mixture in the tank dome and during compression and condensation. A significant increase in the effectiveness can be ensured in the design process by choosing the optimal operating mode for the reliquefaction plant as a whole.
Studies of the processes in gas reliquefaction systems have been published by scientific groups from different countries. Saputra and Supramono considered the reliquefaction plant of the LPG carrier with a capacity of 20 tons per day [4]. The vessel carries both LPGs (propane, butane) and cryogenic liquids (ethylene, ethane, and methane). A cascade refrigeration machine is used as a refrigeration system. An experimental study of the reliquefaction plant and its thermodynamic analysis by the exergy method has been performed. Nanowski [5] presented the results of the analysis of the butane reliquefaction plant to assess the possible loading rate. In this study, the comparisons of theoretical research based on the available documentation with the practical effect obtained in the port are given. The study also assessed the efficiency of the reliquefaction plant in accordance with the vessel’s instructions and determined whether this efficiency is the maximum possible in the given conditions. A method of choosing a scheme and a cycle of a reliquefaction plant for a refrigerated LPG carrier depending on the type of cargo transported and its operating parameters is given by Tong et al. [6]. The proposed system operates in a single-stage compression mode when transporting high-temperature liquefied gases and in a two-stage compression mode when transporting low-temperature liquefied gases. Chien and Shih [7] proposed a project to optimize the reliquefaction processes for ethylene transportation systems. The exergy losses in each component of the reliquefaction plant and the effectiveness of using the available energy were determined. The optimization resulted in an exergy efficiency increase, both in the reduction of the consumption of the refrigerant and the seawater in the system. A similar study with the same purpose and similar results was reported by Li et al. [8]. Berlinck et al. [9] presented a numerical simulation of the ethylene reliquefaction plant. A simulation model was developed using the basic concepts of thermodynamics, heat transfer, and the thermophysical properties of working fluids. Fine convergence was obtained between the assumed thermodynamic parameters at each state of the system and the operating data.
The results of the ethylene reliquefaction plant study based on the detailed experimental data were presented by Nanowski [10]. An analysis of the reliquefaction plant performance with a large number of possible refrigerants has been performed. The result is a thermodynamic model allowing for the fast evaluation and comparison of various refrigerants. Gómez et al. analyzed various methods of the reliquefaction of BOG on the LNG carriers board based on the economic criteria and energy effectiveness [11]. Different technologies were described, analyzed, and discussed. This made it possible to highlight the technological and operational characteristics, as well as the criteria for the selection of the reliquefaction plant. A comparison between different reliquefaction plants based on their performance and effectiveness as well as other technical data has been performed. Kwak et al. [12] analyzed the BOG reliquefaction plant that minimizes methane losses on small-scale LNG carriers. The unit uses the closed-cycle gas turbine with nitrogen as the working fluid. In the study, two cycles are considered, one of which operates without compression of the BOG cargo due to internal regeneration. The second cycle is implemented with preheating of the BOG cargo and subsequent compression in a compressor at temperatures close to the environment. Thermodynamic analysis provided a conceptual understanding of the key operating variables affecting the performance of the BOG reliquefaction process.
Al Ghafri et al. [13] presented the results of a critical analysis of empirical-based methods for estimating BOG flow rates for large-scale LNG storage tanks. The authors considered the importance of accomplishing experiments under real operating conditions in order to determine the amount of BOG formed and the corresponding change in pressure. As a model for the calculations, Al Ghafri et al. used new data from experiments on the evaporation of the methane ethane mixture. The authors implemented a nonequilibrium heat and mass transfer model accounting for the contribution from the heat transferred to a liquid from a superheated vapor. The model and experimental data showed three different stages in the formation of the BOG, which are referred to here as the self-pressurization stage, the transition stage, and the homogeneous stage. It was found that, at the stage of self-pressurization, the thickness of the thermally stratified layer adjacent to the liquid–vapor interface increases with time. Tan et al. [14] proposed a new BOG reliquefaction system for the LNG carriers. Two mixed refrigerant cascade cycles (or dual mixed refrigerant cycles, DMR) are used to provide the cooling capacity for the reliquefaction of BOG. The energy efficiency of the new system is estimated based on the exergy method of thermodynamic analysis for stationary modeling in Aspen HYSYS. All changes in the operating parameters that affect the performance of the system are proposed to account for the dynamic modeling of the system. Kochunni and Chowdhury proposed to improve the performance of LNG BOG reliquefaction units on gas carriers by integrating a two-stage transcritical CO2 refrigerating machine into LNG reliquefaction systems operating by the Brayton and Claude thermodynamic cycles [15]. Their performance is compared to reliquefaction systems operating in cascade cycles for compressing flammable refrigerant vapors such as ethylene or propylene. The authors proved that the new system increases both the energy economic criteria and the energy effectiveness, reducing the weight and size characteristics and securing reliable fire protection.
A review of the above-mentioned studies demonstrated that researchers focus on LNG transportation systems, considering them to be the most in demand. The lack of papers on the study of systems for the reliquefaction of petroleum gas, the processes of mixing gases in cargo tanks, and the existing real monitoring such systems creates good opportunities for scientific research. The information noted above confirms the relevance of the theoretical study of the mixing cargo processes in the tank on the basis of the available experimental data of real gas carriers with the involvement of scientific tools for the study of these processes. Taking this into account, the purpose of the present study is to analyze the processes in the components of the LPG (propane/butane) reliquefaction plant under the conditions of co-mingling in tanks of the LPG tanker “ANAFI” when transporting by sea. The results of the analysis will help create a straightforward calculation base for operators and provide additional control over the operation of the reliquefaction plant.
2. Description of the Proposed LPG Reliquefaction Plant on a Gas Carrier
The analysis was performed for the real vessel LPG reliquefaction plant of the “ANAFI” tanker [16]. According to the method of cargo transportation, the vessel belongs to the refrigerated type. This gas carrier has three cargo tanks for the transportation of liquefied gases. The tank construction is prismatic self-supporting Type “A” [17].
To keep the temperature and pressure of the cargo in the tank close to the calculated values, the LPG carrier is equipped with three identical units for the reliquefaction of cargo. The diagram of the reliquefaction plant is shown in Figure 1. The technological scheme of the reliquefaction unit includes a two-stage crosshead cargo compressor 2K160 from Burckhardt Compression [18], a cargo condenser, a linear receiver, a cargo economizer, a condensate accumulator, a suction separator, a system of shut-off and expansion valves, and auxiliary components of reliable plant operation and handling.
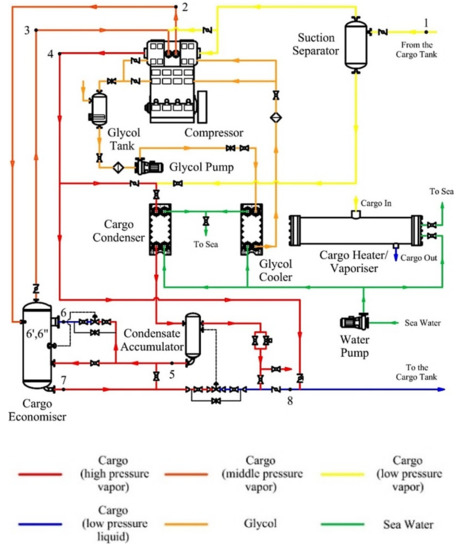
Figure 1.
Flow diagram of the reliquefaction plant.
The individual components are brought on board during loading. Tank No. 2 carries liquefied propane at a temperature of –40.1 °C, and tanks No. 1 and No. 3 carry liquefied butane at a temperature of −4.7 °C (Figure 2). Two units that operate on a two-stage mechanical compression cycle with incomplete intermediate cooling and coil in the cargo economizer are used to cool down propane. Butane is cooled by one unit, which operates on a two-stage mechanical compression cycle without subcooling or intercooling.
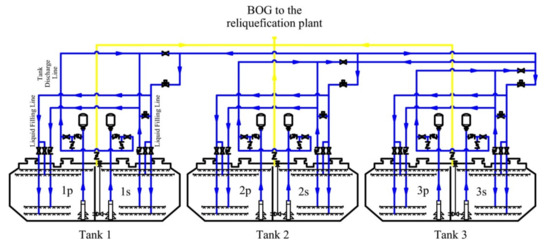
Figure 2.
Flow diagram of the operation of mixing propane and butane in the tanks.
According to the requirements of the charterer, it is very common to mix propane and butane on board in tanks during transit in sea transportation. In this case, in order to perform such an operation, the tank No. 1 is partially filled in advance during the loading (Figure 2). The mixing occurs in two stages. At the first stage, propane from the tank No. 2 is transferred to the tank No. 1 until this tank is 95% full. At the second stage, butane is transferred to the tank No. 2. The mixing operation continues until the parameters of the mixture are equalized in all three tanks, which are controlled by the temperature of the mixture. Propane is fed to the bottom of the tank, and butane is fed to the top, which is associated with the thermophysical properties of these gases [19].
3. Determination of the Parameters of the Mixing Process of Propane and Butane in the Tanks
All characteristics of the mixture in real operating conditions are determined using the monitoring data of cargo operations (screenshots on Figure 3 and Figure 4). Gas parameters before the mixing process are presented in Table 1. The cargo weight before mixing is presented in Table 2. It should be noted that, structurally, the tank capacity is divided by a vertical impermeable partition into two compartments (port side and starboard side), which are interconnected by holes in the dome (Figure 2).
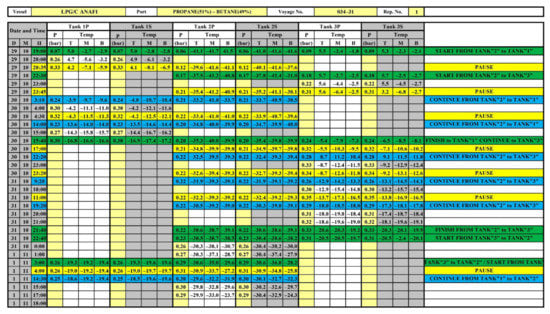
Figure 3.
Real-time monitoring records of cargo operations (cargo temperature).
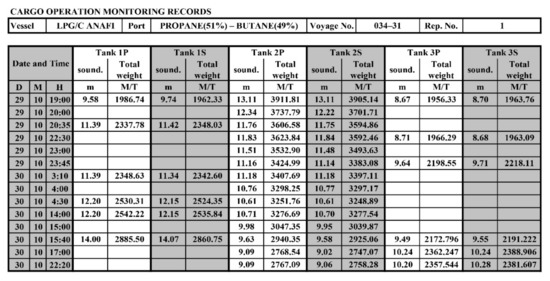
Figure 4.
Real-time monitoring records of cargo operations (cargo weight).

Table 1.
Gas parameters before the mixing process.
Table 2.
Weight of the cargo in the tanks before mixing.
In accordance with the mixture theory, the mass concentration and molar concentration of each component in the mixture, according to the results of the steady state mode in all tanks after the operation of mixing propane and butane, is determined as follows.
The mass concentration is determined by Equation (1):
where mi is the mass of each component,
is the total mass of the cargo after the operation of mixing.
The number of moles of each component and the total number of moles in the mixture are determined by Equations (2) and (3), respectively:
where ni is the molecular mass of each component.
The molar concentration of each component can be determined by Equation (4):
The temperature of the mixture in the tanks attained as a result of the mixing is determined from the heat balance of mixing and neglecting heat losses to the environment:
where cp,C3H8 = 2.254 kJ·kg−1·K−1 is the heat capacity of liquefied propane at TC3H8 = 232.9 K; cp,C4H10 = 2.229 kJ/kg−1·K−1 is the heat capacity of liquefied butane at TC4H10 = 268.3 K.
The mixture temperature is determined by Equation (6):
In accordance with Raoult’s law, the partial pressure of each mixture component can be defined by Equation (7):
where pi″ is the saturated vapor pressure of the component at the mixture temperature.
The mixture pressure is defined as the sum of the partial pressures of the individual components:
The composition of the mixture in the vapor phase over the liquid surface can be written as:
The calculation results for the parameters of the components and the mixture obtained corresponding to the mixing process are presented in Table 3.
Table 3.
Gas parameters after mixing.
At the same time, according to the monitoring of cargo operations, the liquid filling of tanks before mixing is 67.0% for the tank No. 1, 92.8% for the tank No. 2, and 81.8% for the tank No. 3. The maximum allowable condensing pressure under the given operating conditions in the reliquefaction plant is determined by the propane pressure at the given condensing temperature.
4. Calculation of the Cycle Characteristics for the Reliquefaction Plant Operating with the Mixture
Three reliquefaction units are included in the operation to control the pressure and temperature of the mixture. The units operate on the two-stage mechanical compression cycle with incomplete intercooling and parallel throttling (Figure 5).
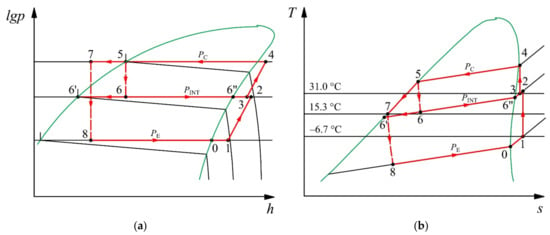
Figure 5.
Reliquefaction plant cycle operating with the propane and butane mixture in the lgp–h (a) and T–s (b) diagrams.
The calculation is performed under the following conditions. The working fluid is a mixture of propane and butane (51% and 49%, respectively). Such a mixture is non-azeotropic, i.e., it evaporates and condenses at a variable temperature. The temperature glide of the mixture is about 15 °C. The evaporating temperature is TMIX = TE = −24.3 °C. The vapor temperature of the mixture at the entrance to the cylinder of the low stage is equal to T1 = −6.7 °C. The subcooling of the liquid in the coil of the cargo economizer is defined as T7 = TINT + 3 °C. The source of condensing heat rejection in the reliquefaction plant is seawater. The REFPROP 10.0 software is used to calculate the mixture properties [20]. The theoretical volumetric displacement of the compressor in accordance with the vessel’s instructions is = 1273 m3·h−1 and = 476 m3·h−1 for the low stage and high stage, respectively. The isentropic and mechanical efficiency of the low-stage compressor are ηCSLS = 0.81 and ηMECHLS = 0.78, respectively. The isentropic and mechanical efficiency of the high-stage compressor are ηCSHS = 0.95 and ηMECHHS = 0.65, respectively. The values of the isentropic and mechanical efficiency are obtained experimentally.
The thermodynamic parameters at the states of the reliquefaction plant cycle are presented in Table 4.
Table 4.
Thermodynamic parameters for the states of the reliquefaction plant cycle at pINT = 4.50 bar.
The cooling capacity of the refrigerating machine is determined by Equation (10):
The mass flow rate of the refrigerant in the low stage and high stage can be found by Equations (11) and (12), respectively:
where x6 is the vapor quality in the state 6.
The mass flow rate of the refrigerant in the coil of the cargo economizer can be obtained with Equation (13):
The parameters of the vapor mixture at the suction to the high stage of the compressor are determined by the pressure and enthalpy:
where a is the ratio of the mass flow rates by stages:
The effective compressor power consumption in the low stage and high stage are determined by Equations (16) and (17), respectively:
The total compressor power consumption is determined by Equation (18):
The accrual coefficient of performance COP can be defined by Equation (19):
The design parameters of the reliquefaction plant thermodynamic cycle determined by Equations (10)–(19) are shown in Table 5.
Table 5.
Design parameters of the reliquefaction plant cycle at pINT = 4.50 bar.
5. Method of Equivalence in the Reliquefaction Plant Cycle Analysis
The mathematical model presented in Section 4 is a universal one for evaluating any reverse thermodynamic cycles (refrigeration and heat pump application).
When analyzing such thermodynamic cycles, it is impossible to account for all the factors that affect changes in the system parameters (for example, additional heat transfer to/from components and pipelines, possible leaks of pure working fluids from the mixture, etc.). It is proposed to replace a universal mathematical model with a mixture as a working fluid by mathematical models of cycles with pure components at their partial pressures, i.e., to use the equivalence principle. This allows one to keep the parameters at the states of the thermodynamic cycle before and after the equivalence.
The results can provide the information on the sources and consequences caused by variations of the operating parameters.
Equivalence, in general, leads to a decrease in the complexity of the problem being solved and the creation of a simplified model of each component. This also allows for an increase in the clarity of the obtained results [21,22]. The use of the equivalence model definitely causes some differences in the obtained results. In the present study, the initial information for the implementation of the method of equivalence is the data on the actual operating parameters of the reliquefaction plant (Figure 3 and Figure 4).
The working fluid is the gas mixture of propane and butane with 51%/49% mass concentration. This mixture is zeotropic; therefore, the processes in a two-phase zone (condensation and evaporation) are not isothermal. The temperature glide for the mixture is around 15 K (Figure 5). In this mixture, butane is the high-boiling component (RH component), and propane is the low-boiling component (RL component).
The analysis of the thermodynamic cycle and the synthesis of the equivalent schematic is carried out with equivalent processes operating with pure components during compression and condensation. The mixture components in the elements of the equivalent scheme carry out thermodynamic processes at their own partial pressures and temperatures of the mixture. The mass flow rates of the components are calculated relative to 1 kg of the working mixture. The partial pressures of the mixture components are determined using Equation (7) and are presented in Table 6. Cycles for butane, propane, and their mixture are presented in the T–s diagrams shown in Figure 6a–c, respectively. The equivalent technological scheme is presented in Figure 7.
Table 6.
Partial pressures of mixture components.
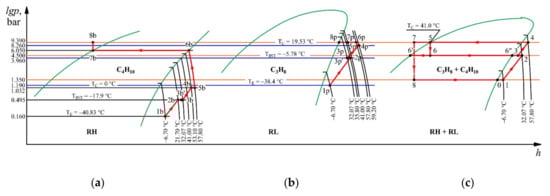
Figure 6.
Processes occurring with working fluids in equivalent cycles in comparison with the main processes occurring in the mixture in the lgp–h diagram: (a) processes with butane; (b) processes with propane; (c) processes with a mixture.
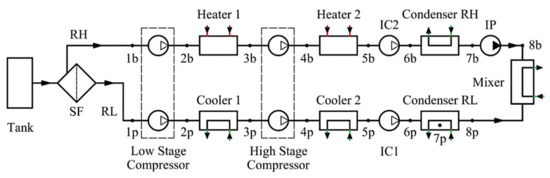
Figure 7.
Equivalent scheme of separation processes: SF—Semipermeable filter; IC1, IC2—Isothermic compressors; IP—Isothermic pump.
The components of the equivalent scheme are compressors and heat exchangers. The mixture in the amount of 1 kg is separated into two components in a semipermeable filter. The relative mass of the RL component is ṁRL kg·kg−1, and the relative mass of the RH component is (1—ṁRL) kg·kg−1. Thermodynamic analysis has been performed in parallel using the cycle and the equivalent scheme.
The compression processes in the compressors of the low and high stages as well as the condenser that occurs with the RH component are shown in the T–s diagram in Figure 6a. At the same time, the RH component carries out the processes on its own when the boundary conditions of the processes of the real cycle operating with the mixture are met. The RH component enters the low stage compressor under its partial pressure pERH = 0.16 bar and the mixture temperature T1MIX = −6.70 °C (state 1b) and is compressed isentropically. The end of the compression process (state 2b) is characterized by the following parameters: discharge pressure pINTRH = 0.50 bar and discharge temperature T2RH = 21.7 °C. To meet the suction conditions of the high-stage compressor, the vapor must be heated at a constant pressure to the mixture temperature T3MIX = 31.1 °C (state 3b). The end of the isentropic compression in the high-stage compressor is characterized by the following parameters: discharge pressure pCRH = 1.032 bar and discharge temperature T4RH = 50.3 °C (state 4b). To satisfy the boundary conditions of the end of the compression in the high-stage compressor, the vapor must be heated in an isobaric manner to a temperature of T4MIX = 57.8 °C (state 5b). The condensation process of the mixture ends with a liquid outlet with the following parameters: temperature TCMIX = 41.0 °C and pressure pCMIX = 9.39 bar. To ensure the conditions of the actual cycle, the component in an equivalent cycle must be isothermally compressed at T4MIX = 57.8 °C to a state of saturated vapor, and the corresponding partial pressure must be p1RH = 6.05 bar (state 6b), with heat rejection to the environment (state 7b). The isothermic pump raises the pressure of the saturated liquid to the condensing pressure of pCMIX = 9.39 bar (state 8b). In this state, the RH component enters the mixer.
The compression processes in the compressors of the low and high stages and the condenser occurring with the RL component are presented in the T–s diagram in Figure 6b by analogy with the previous case, where the boundary conditions of the processes of the actual cycle operating with the mixture are also met. The RL component enters the compressor under its partial pressure pERL = 1.19 bar and the mixture temperature T1MIX = −6.7 °C (state 1p) and is compressed isentropically. The end of the compression (state 2p) is characterized by the following parameters: discharge pressure pINTRL = 3.96 bar and discharge temperature T2RL = 35.8 °C. To meet the boundary conditions for the suction of the high-stage compressor, the vapor must be cooled down at a constant pressure to the mixture temperature T3MIX = 31.1 °C (state 3p). The end of the isentropic compression in the high-stage compressor is characterized by the following parameters: discharge pressure pCRL = 8.26 bar and discharge temperature T4RL = 59.2 °C (state 4p). To satisfy the boundary conditions of the end of the compression in the high-stage compressor, the vapor must be cooled again at a constant pressure to T4MIX = 57.8 °C (state 5p). To achieve the condensation pressure of the mixture, the RL component in the equivalent cycle must be isothermally compressed (state 6p) and then condensed at its own saturation temperature TSRL = 24.5 °C (state 8p). The obtained saturated liquid is sent to the mixer. The components in the liquid state are mixed to form a mixture. To evaluate the work of compression in processes with pure components, the parameters are determined at the states of the equivalent cycle (Table 7 and Table 8).
Table 7.
Thermodynamic parameters for the states of the cycle with low-boiling component RL (C3H8).
Table 8.
Thermodynamic parameters for the states of the cycle with high-boiling component RH (C4H10).
Comparative analysis of the process parameters in the actual and equivalent cycles is accomplished in accordance with the following method.
The mass flow rate of the components in the equivalent scheme is determined from the energy balance equation for the mixing process:
The total compression power in separate equivalent processes is determined by Equations (23) and (24):
- RL component:
- RH component:
The total compression power in the equivalent cycle is determined by Equation (25):
The specific work of the compression in the actual cycle with a mixture (see Section 4) is calculated by Equation (26):
The calculation results are presented in Table 9.
Table 9.
Calculation of the process parameters in the actual and equivalent cycles.
The discrepancy in the values of the work of compression obtained by Equations (25) and (26) does not exceed 4.0%. The obtained result proved the legitimacy of using the method of equivalence in the analysis of the real energy conversion systems operating with non-mixable components.
An analysis of the possibility of using an equivalent model to evaluate individual moments of reliquefaction plant operation is presented below. The parameters of the reliquefaction plant are determined by the pressure in the tank and the suction temperature in the low-stage compressor (Table 3 and Table 4). The vapor phase of the mixture is enriched with the RL component, i.e., propane (Table 3). The exact thermodynamic properties of the RL component determine the pressure in the tank dome, which, in turn, determines the set pressure of the safety valves on the MARV (Maximal Allowable Relief Valve Set) tanks. The same RL component determines the maximum allowable discharge pressure of the high-stage compressor when running on a mixture at a given condensing temperature.
At the discharge of the high-stage compressor (Figure 6), the mixture consists of the liquid phase of the RH component (state 8b) and the vapor phase of the RL component (state 7p). If there is a leak in the discharge line of the high-stage compressor, the RL component may leak, and the presence of this leak is indicated by a pressure drop in this line. The partial pressure of the RL component at the suction to the low-stage compressor (state 1p) exceeds the atmospheric pressure and thereby increases the likelihood of its leakage. The result of the analysis shows the possibilities of the practical application of the equivalent model in similar operating conditions.
6. Conclusions
Mixing propane and butane on board LPG carriers is a common practice today, as it makes it possible to account for the fast-changing market conditions and climatic conditions of the liquefied-gas-importing countries. This practice raises a number of issues related to the ship safety and the operational reliability of the reliquefaction plant. To analyze the problems in the present study, the authors used the monitoring data of cargo operations for the operation of the LPG carrier “ANAFI” during the mixing of propane and butane in tanks.
Using the provisions of the theory of mixtures, the authors determined the parameters of the mixture and its components. The obtained results are confirmed by the monitoring data of cargo operations. An energy analysis was performed for the reliquefaction plant operating with a zeotropic mixture. The operating parameters in the reliquefaction plant components and the performance and energy efficiency of the system have been determined.
Changes in the operating parameters lead to corresponding variances in the characteristics of the reliquefaction plant and a deviation in the operating mode from the design characteristics, with a violation of the system operational reliability.
A method of equivalence of the steady state to control the parameters of the reliquefaction plant is proposed by replacing processes with mixtures with processes with pure components. This method for analyzing thermodynamic processes allows for the control of the parameters of each component of the mixture as an independent working substance and the evaluation of individual moments of operation. At the same time, the method is simple and based on classical thermodynamics, taking into account the refined values of the thermophysical properties of the mixture. The energy analysis of equivalent cycles confirmed the calculation results of the actual reliquefaction plant parameters. The discrepancy in the calculations does not exceed 4%. The use of such information allows operators to provide additional independent control of the operation of the reliquefaction plant and the reliable operation of safety equipment.
The method of equivalence contributes to the development of an appropriate strategy for managing the operation of the reliquefaction plant to adapt to changes in operating conditions.
Author Contributions
Conceptualization, L.M. and V.S.-Y.; methodology, L.M. and V.S.-Y.; validation, B.K. and V.I.; formal analysis, B.K. and L.M.; investigation, B.K. and L.M.; resources, V.S.-Y.; data curation, L.M.; writing—original draft preparation, L.M. and B.K.; writing—review and editing, V.I. and V.S.-Y.; visualization, V.I.; supervision, B.K.; project administration, V.I. All authors have read and agreed to the published version of the manuscript.
Funding
This research received no external funding.
Institutional Review Board Statement
Not applicable.
Informed Consent Statement
Not applicable.
Data Availability Statement
Data is contained within the article.
Conflicts of Interest
The authors declare no conflict of interest.
Nomenclature
| a | mass flow rate ratio | Subscripts | |
| cP | specific heat at a constant pressure, kJ·kg−1·K−1 | CG | cargo |
| C | molar concentration, mol·mol−1 | CS | irreversibility in the compressor |
| h | specific enthalpy, kJ·kg−1 | E | evaporator |
| m | mass, kg | i | index number |
| ṁ | mass flow rate, kg·s−1 | INT | intermediate |
| M | number of moles, mol | MIX | mixture |
| n | molar mass, kg·mol−1 | MECH | mechanical |
| p | pressure, partial pressure, bar or kPa | R | refrigerant |
| q | specific heat, kJ·kg−1 | 0, 1,…8 | state of cycle |
| heat rate, kW | |||
| s | specific entropy, kJ·kg−1·K−1 | Superscripts | |
| T | temperature, °C or K | ′ | saturated liquid |
| υ | specific volume, m3·kg−1 | ″ | saturated vapor |
| V | volume, m3 | COIL | coil |
| w | specific work, kJ·kg−1 | EQ | equivalent |
| Ẇ | power, kW | HS | high stage |
| x | quality, kg·kg−1 | LS | low stage |
| X | mass concentration, kg·kg−1 | RH | high-boiling component |
| COP | coefficient of performance | RL | low-boiling component |
| Acronyms | Greek symbols | ||
| BOG | boil-off gas | Δ | difference |
| LNG | liquefied natural gas | η | efficiency |
| LPG | liquefied petroleum gas | λ | compressor volumetric efficiency |
References
- Lee, D.-H.; Ha, M.-K.; Kim, S.-Y.; Shin, S.-C. Research of design challenges and new technologies for floating LNG. Int. J. Nav. Archit. Ocean Eng. 2014, 6, 307–322. [Google Scholar] [CrossRef] [Green Version]
- IMO. International Code for the Construction and Equipment of Ships Carrying Liquefied Gases in Bulk (IGC Code) 2008, MSC.5. Available online: https://puc.overheid.nl/nsi/doc/PUC_2389_14/7/ (accessed on 17 February 2022).
- The Society of International Gas Tanker & Terminal Operators Ltd Guidelines for the Co-Mingling of LPG, 2005. Co-Mingling of LPG. Available online: http://www.kentsoerensen.dk/default.asp?page=78 (accessed on 8 September 2021).
- Saputra, S.; Supramono, D. Optimization of Propane Reliquefaction Cycle in LPG Plant. In Proceedings of the IEEE International Conference on Innovative Research and Development (ICIRD), Jakarta, Indonesia, 28–30 June 2019; pp. 1–6. [Google Scholar]
- Nanowski, D. The comparison of theoretical to practical cargo loading rate of butane–analysis of LPG carrier reliquefaction plant. J. KONES Powertrain Transp. 2013, 20, 227–231. [Google Scholar] [CrossRef]
- Tong, Z.; Zhou, B.; Zhu, J.; He, J.; Bao, J. Cold half pressure type of LPG ships and thermodynamic study of its reliquefaction system. J. Univ. Shanghai Sci. Technol. 2015, 37, 344–349. [Google Scholar]
- Chien, M.H.; Shih, M.Y. An Innovative Optimization Design for a Boil-off Gas Reliquefaction Process of LEG Vessels. J. Pet. 2011, 47, 65–74. [Google Scholar]
- Li, Y.; Jin, G.; Zhong, Z. Thermodynamic Analysis-Based Improvement for the Boil-off Gas Reliquefaction Process of Liquefied Ethylene Vessels. Chem. Eng. Technol. 2012, 35, 1759–1764. [Google Scholar] [CrossRef]
- Berlinck, E.C.; Parise, J.A.R.; Pitanga, M.R. Numerical simulation of an ethylene re-liquefaction plant. Int. J. Energy Res. 1997, 21, 597–614. [Google Scholar] [CrossRef]
- Nanowski, D. The Influence of Incondensable Gases on the Refrigeration Capacity of The Reliquefaction Plant During Ethylene Carriage by Sea. J. KONES Powertrain Transp. 2016, 3, 359–364. [Google Scholar] [CrossRef]
- Gómez, J.R.; Gómez, M.R.; Garcia, R.F.; Catoira, A.D.M. On board LNG reliquefaction technology: A comparative study. Pol. Marit. Res. 2014, 21, 77–88. [Google Scholar] [CrossRef] [Green Version]
- Kwak, D.-H.; Heo, J.-H.; Park, S.-H.; Seo, S.-J.; Kim, J.-K. Energy-efficient design and optimization of boil-off gas (BOG) re-liquefaction process for liquefied natural gas (LNG)-fuelled ship. Energy 2018, 148, 915–929. [Google Scholar] [CrossRef]
- Al Ghafri, S.Z.S.; Perez, F.; Heum Park, K.; Gallagher, L.; Warr, L.; Stroda, A.; Siahvashi, A.; Ryu, Y.; Kim, S.; Kim, S.G.; et al. Advanced boil-off gas studies for liquefied natural gas. Appl. Therm. Eng. 2021, 189, 116735. [Google Scholar] [CrossRef]
- Tan, H.; Shan, S.; Nie, Y.; Zhao, Q. A new boil-off gas re-liquefaction system for LNG carriers based on dual mixed refrigerant cycle. Cryogenics 2018, 92, 84–92. [Google Scholar] [CrossRef]
- Kochunni, S.K.; Chowdhury, K. Effect of precooling with transcritical CO2 cycle on two types of LNG boil-off gas reliquefaction systems. J. Nat. Gas Sci. Eng. 2021, 89, 103876. [Google Scholar] [CrossRef]
- VesselFinder. ANAFI, LPG Tanker, IMO 9411733. 2021. Available online: https://www.vesselfinder.com/vessels/ANAFI-IMO-9411733-MMSI-240848000 (accessed on 8 September 2021).
- McGuire, J.J.; White, B. Liquefied Gas Handling Principles on Ships and in Terminals; Witherby & Co.: London, UK, 2000. [Google Scholar]
- Burckhardt Compression. LABY® COMPRESSORS. 2021. Available online: https://www.burckhardtcompression.com/solution/compressor-technologies/laby-compressor/ (accessed on 8 September 2021).
- Yaws, C.L. Thermophysical Properties of Chemicals and Hydrocarbons, 2nd ed; William Andrew: Norwich, NY, USA; pp. 1–991.
- Lemmon, E.W.; Bell, I.H.; Huber, M.L.; McLinden, M.O. Reference fluid Thermodynamic and Transport Properties Database (REFPROP); NIST Standard Reference Database 23. Version 10.0; National Institute of Standards and Technology: Gaithersburg, MD, USA, 2018. [Google Scholar]
- Tchoń, K. The method of equivalence in robotics. In Systems: Theory and Practice; Albrecht, R., Ed.; Advances in Computing Science; Springer: Vienna, Austria, 1998; Available online: https://link.springer.com/chapter/10.1007/978-3-7091-6451-8_12 (accessed on 17 February 2022).
- Gardner, R.B. The Method of Equivalence and Its Applications; SIAM: Philadelphia, PA, USA, 1989. [Google Scholar]
- Bejan, A.; Tsatsaronis, G.; Moran, M. Thermal Design and Optimization; John Wiley: New York, NY, USA, 1996. [Google Scholar]
Publisher’s Note: MDPI stays neutral with regard to jurisdictional claims in published maps and institutional affiliations. |
© 2022 by the authors. Licensee MDPI, Basel, Switzerland. This article is an open access article distributed under the terms and conditions of the Creative Commons Attribution (CC BY) license (https://creativecommons.org/licenses/by/4.0/).