Review

Using the Allen Brain Cell Atlas of the Human Brain to Gain Insights into C-Terminal-Binding Protein 1 (CtBP1)’s Potential Function

by
Suhjin Lee
1 and
Uthayashanker R. Ezekiel
2,*
1
Department of Health Management, College of Public Health and Social Justice, Saint Louis University, St. Louis, MO 63104, USA
2
Department of Clinical Health Sciences, Doisy College of Allied Health Sciences, Saint Louis University, St. Louis, MO 63104, USA
*
Author to whom correspondence should be addressed.
Biologics 2025, 5(2), 14; https://doi.org/10.3390/biologics5020014
Submission received: 6 March 2025 / Revised: 8 April 2025 / Accepted: 29 April 2025 / Published: 5 May 2025

Abstract

:
C-terminal-binding proteins (CtBPs) dimerize and function predominantly as transcriptional corepressors by recruiting various chromatin-modifying factors to promoter-bound repressors. Hypotonia, ataxia, developmental delay, and tooth enamel defects syndrome (HADDTS) is a recently discovered neurodevelopmental disorder resulting from a heterozygous missense mutation in CTBP1. It is often associated with the early onset of profound cerebellar atrophy in patients. Allen Institute’s Allen Brain Cell (ABC) atlas of human brain data was used to localize CTBP1 expression in the brain to elucidate the etiology of HADDTS. Based on the ABC atlas, CTBP1 is highly expressed in the upper rhombic lip supercluster, which gives rise to cerebellar cells and provides insights into the cerebellar pathophysiology observed in HADDTS patients.

1. Introduction

Neurodegenerative disorders have been shown to be associated with the early onset of neurodevelopmental abnormalities during childhood or embryonic development. Mutations that cause neurodevelopmental defects can lead to the development of an ‘at-risk normal brain’ susceptible to intrinsic and extrinsic factors, possibly leading to clinical manifestations of neurological disorders at an early age or later in life.
A recently identified syndrome involving hypotonia, ataxia, developmental delay, and tooth enamel defects syndrome (HADDTS) is linked to a de novo heterozygous missense mutation in the C-terminal-binding protein (CTBP1) (c.991 C → T, p.R331W in NM_001012614.1; c.1024 C → T, p.R342W in NM_001328.2) and is often associated with the early onset of profound cerebellar atrophy, hypotonia, and ataxia in patients [1,2].
To understand which areas of the brain are involved in a disorder, it is critical to identify which regions of the brain express the disorder-associated genes at high levels. Allen Institute’s Allen Brain Cell (ABC) atlas using human brain data helps one to visualize the localization of gene expression in anatomical regions and superclusters. Using the ABC atlas to ascertain where CTBP1 and its partner protein-coding genes are expressed in the brain allows for a better understanding of the clinical features observed in HADDTS patients and provides guidance regarding which cell types or genes should be further investigated.

2. CtBP Family Proteins and Their Functions

CtBPs are highly conserved family proteins. CtBP1 was first identified by its binding to the C-terminus of the adenovirus protein E1A [3]. CtBPs play critical roles during early development and are highly conserved among invertebrates and vertebrates [4]. Vertebrate CtBPs exhibit structural and functional similarities to the D-isomer-specific 2-hydroxy acid dehydrogenases (D2-HDH) [4]. Invertebrate genomes contain a single CtBP, whereas vertebrate genomes encode two highly related proteins, CtBP1 and CtBP2. CtBP2 was identified through sequence homology analysis of the expressed sequence tag (EST) database as it is highly homologous to CtBP1 [5].
The human CTBP1 gene is located on chromosome 4 and encodes two major splice variants: the CtBP1-long (CtBP1-L) isoform and the CtBP1-short (CtBP1-S) isoform, which is also called BARS [4,6]. The CtBP1-L isoform has 13 amino acids at the N-terminus that are not present in CtBP1-S. CTBP2 is localized on the human chromosome 10 and encodes two transcripts, namely CtBP2 (48kD) and RIBEYE (120kD), that are transcribed from two distinct promoters and differ in the first exon [4,6]. In the ubiquitously expressed CTBP2, the first coding exon encodes an N-terminal 20-amino-acid sequence that is highly homologous to that of CTBP1. In contrast, the RIBEYE first exon is located in the intronic region of the CTBP2 locus and encodes a large N-terminal domain, known as the A-domain, which is unrelated to other proteins. The RIBEYE B-domain (from aa21 to aa445) is identical to CtBP2 [4,6]. While RIBEYE is localized to the cytoplasm, CtBP2 is localized to the nucleus. RIBEYE associates with CtBP1 and other proteins, forming the specialized ribbon synaptic terminals in sensory neurons. CtBP1-L (NM_001328.2) and CtBP2 (NM_0.22802.2) mediate transcription repression [4,6].
CtBPs function as metabolic sensors based on the ratio of NAD+/NADH, which determines the monomeric-dimeric form [7]. CtBP1 and CtBP2 form homo or heterodimer complexes in the presence of NADH and recruit various chromatin-modifying factors, such as histone deacetylases (HDACs) and histone demethylases (HDMs), to the chromatin-bound sequence-specific transcription factors [8,9]. The chromatin modification mediated by CtBP-associated proteins leads to the transcriptional repression of the target genes [4]. The presence of PLDLS- and RRT-binding motifs in CtBPs is crucial to the recruitment of the corepressor complex, which is transported to the nucleus to repress transcription [4]. The CtBP corepressor complex mediates coordinated histone modifications by deacetylation and methylation of histone H3-lysine 9 (H3K9) and demethylation of histone H3-lysine 4 (H3K4), thereby repressing targeted gene expression [4]. Despite CtBPs’ main role in regulating gene expression, other evidence suggests they may function as coactivators, interact with signaling pathways, and contribute to development [10].
Both CtBP1 and CtBP2 play overlapping and unique transcriptional roles during animal development [8]. Early animal model studies on Ctbp knockout (KO) mice suggested the importance of CtBPs in neurogenesis. While Ctbp1 KO mice are viable with reduced size and lifespan, the Ctbp2 KO mutation primarily affects neurogenesis and myogenic development, resulting in embryonic lethality [11]. Ctbp double-KO mutants exhibit more severe developmental abnormalities when compared to Ctbp2 KO mutants, suggesting the importance of both Ctbp1 and Ctbp2 in neurogenesis [11].
Beyond their role in transcriptional regulation and development, CtBPs also function as pro-survival proteins in neurons [12,13]. CTBP1 and CTBP2 downregulation leads to the derepressed expression of pro-apoptotic genes, resulting in apoptosis [14]. In an animal model for Alzheimer’s disease, Ctbp1 overexpression prevents the degeneration of hippocampal and cortical neurons, decreasing hippocampal and cortical neuron apoptosis and enhancing neuronal activity [13]. Similarly, the upregulation of Ctbp1 has been shown to prevent dopaminergic cell death in the Parkinson’s toxin-based disease model [12].
In normal cells, transcription factors regulate the temporal and spatial expression of genes, thereby maintaining the balance between proliferation and differentiation. However, any imbalance can lead to tumorigenesis. CtBP1 plays a multifaceted role as a corepressor, being involved in cell migration, survival, and apoptosis. The overexpression of CtBPs has been observed in many cancers, and it leads to the dysregulation of genes, thereby causing malignant behavior such as increased cell survival, migration, proliferation, and invasion, which are hallmarks of cancer [6,14]. In essence, CtBPs play a myriad of roles and are critical for the development and maintenance of normal cell function.

3. CtBP1 and HADDTS

Although several animal models have indicated CtBP’s role in neurogenesis, proliferation, and differentiation, no direct link between CtBPs and neurological disorders has been suggested until recently [12,13,15,16,17,18]. HADDTS is a recently identified neurodevelopmental disorder linked to a de novo mutation in CTBP1 [1,2]. Children heterozygous for the CTPB1 missense have exhibited HADDTS, along with cerebellar atrophy [1,2]. Thirteen HADDTS patients identified thus far harbor a missense mutation, and one patient harbors a deletion mutation (c.1315_1316delCA) [19]. Both mutations are mapped within the α-helical region (α-5) that forms part of the PLDLS interaction cleft of CTBP1. These mutations alter important protein interactions, cause dysregulated chromatin modification, and affect gene expression [1,20,21]. Interestingly, neither the CTBP1 homozygous mutation nor the CTBP2 mutation has been reported in humans, suggesting that these mutations may lead to perinatal or prenatal death [19].

4. ABC Atlas

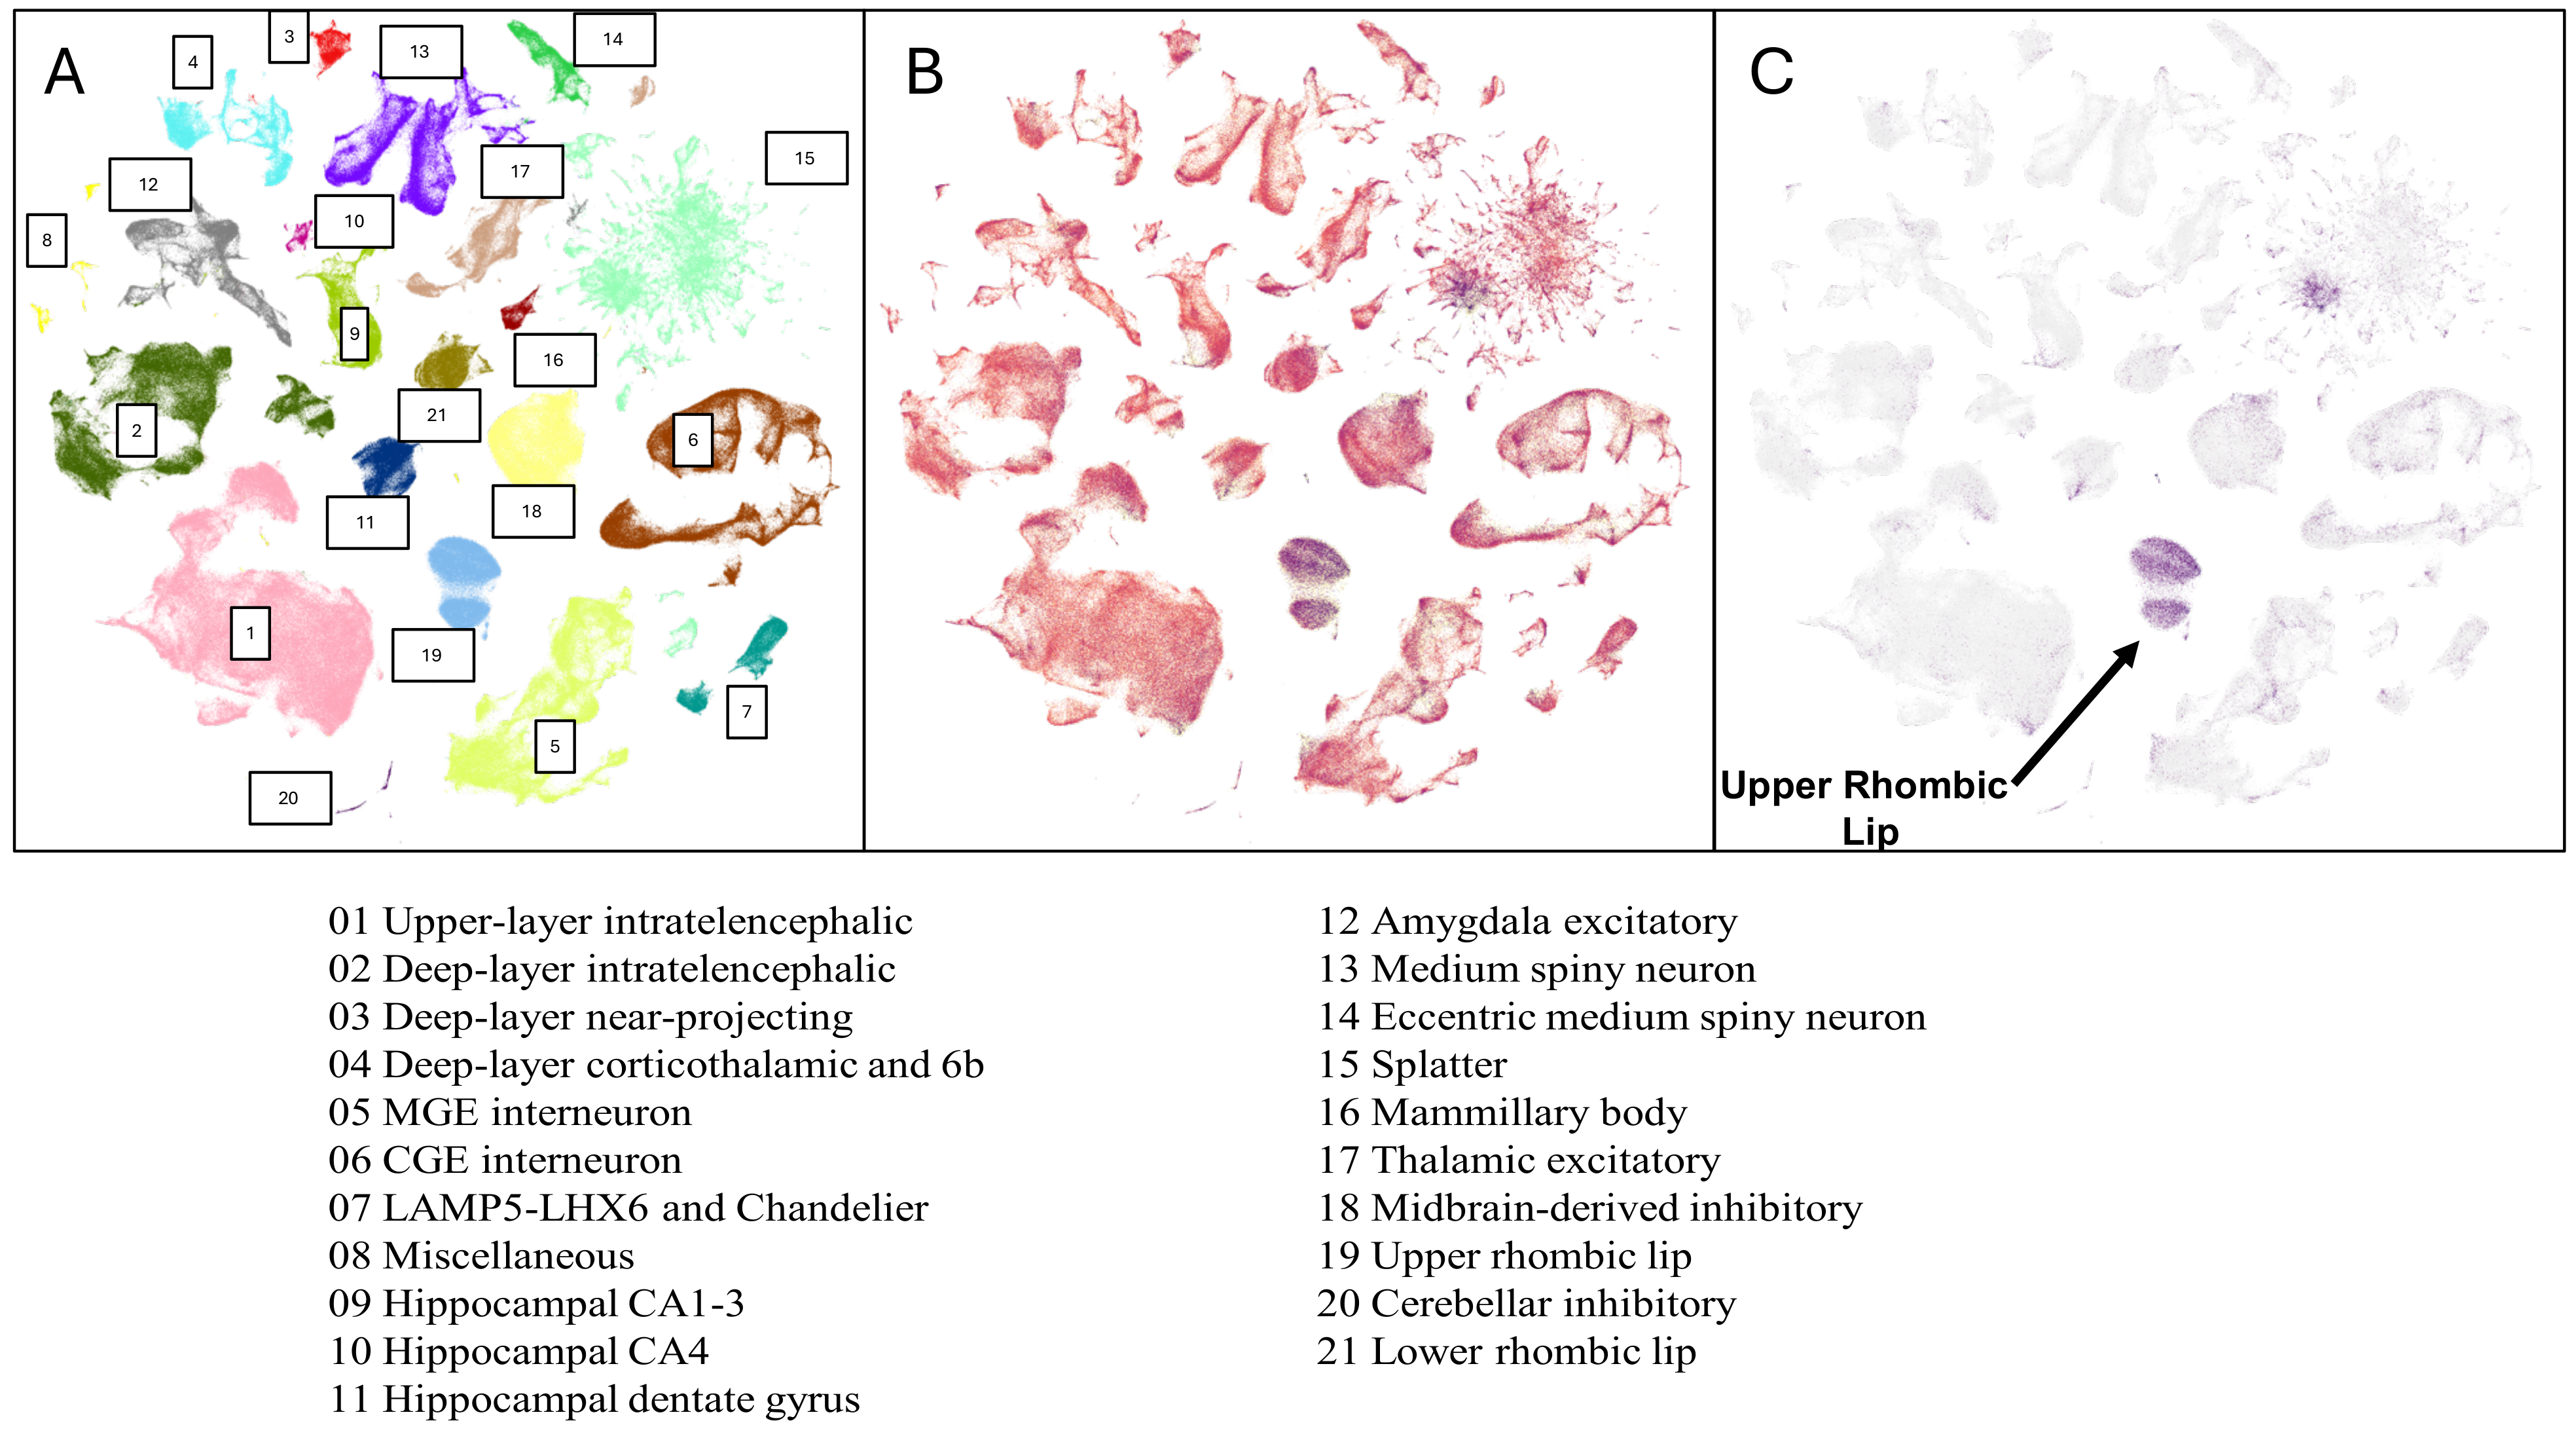
4.1. Step 1: Selection of the Dataset

Allen Institute’s ABC atlas tool was used, and the “Human Brain Cell Type Diversity: Neurons” dataset was selected. The “Neurons” dataset includes gene expression data of human brains organized using the t-SNE statistical method (a distinct cluster of data points on a t-distributed stochastic neighbor embedding) [22,23,24].

4.2. Step 2: Identification of Key Cell Properties

Among the many cell properties within the atlas, this paper specifically focused on the anatomical division and supercluster properties. The ABC atlas categorizes all cells into 13 anatomical divisions: cerebral cortex, hippocampus, amygdaloid complex, extended amygdala, basal nuclei, claustrum, basal forebrain, thalamus, hypothalamus, midbrain, cerebellum, pons, myelencephalon (or medulla in non-embryological terms), and the spinal cord. The dataset also categorizes all cells into 31 superclusters, the broadest category, which further branches down to 461 clusters and 3313 subclusters hierarchically. Each supercluster contains cells that share similar general transcriptional or functional characteristics and is named based on the grouping of similar cells [22,23]. Many superclusters, such as the upper rhombic lip (URL), include cells localized to specific brain regions, giving insights into their developmental pathways.

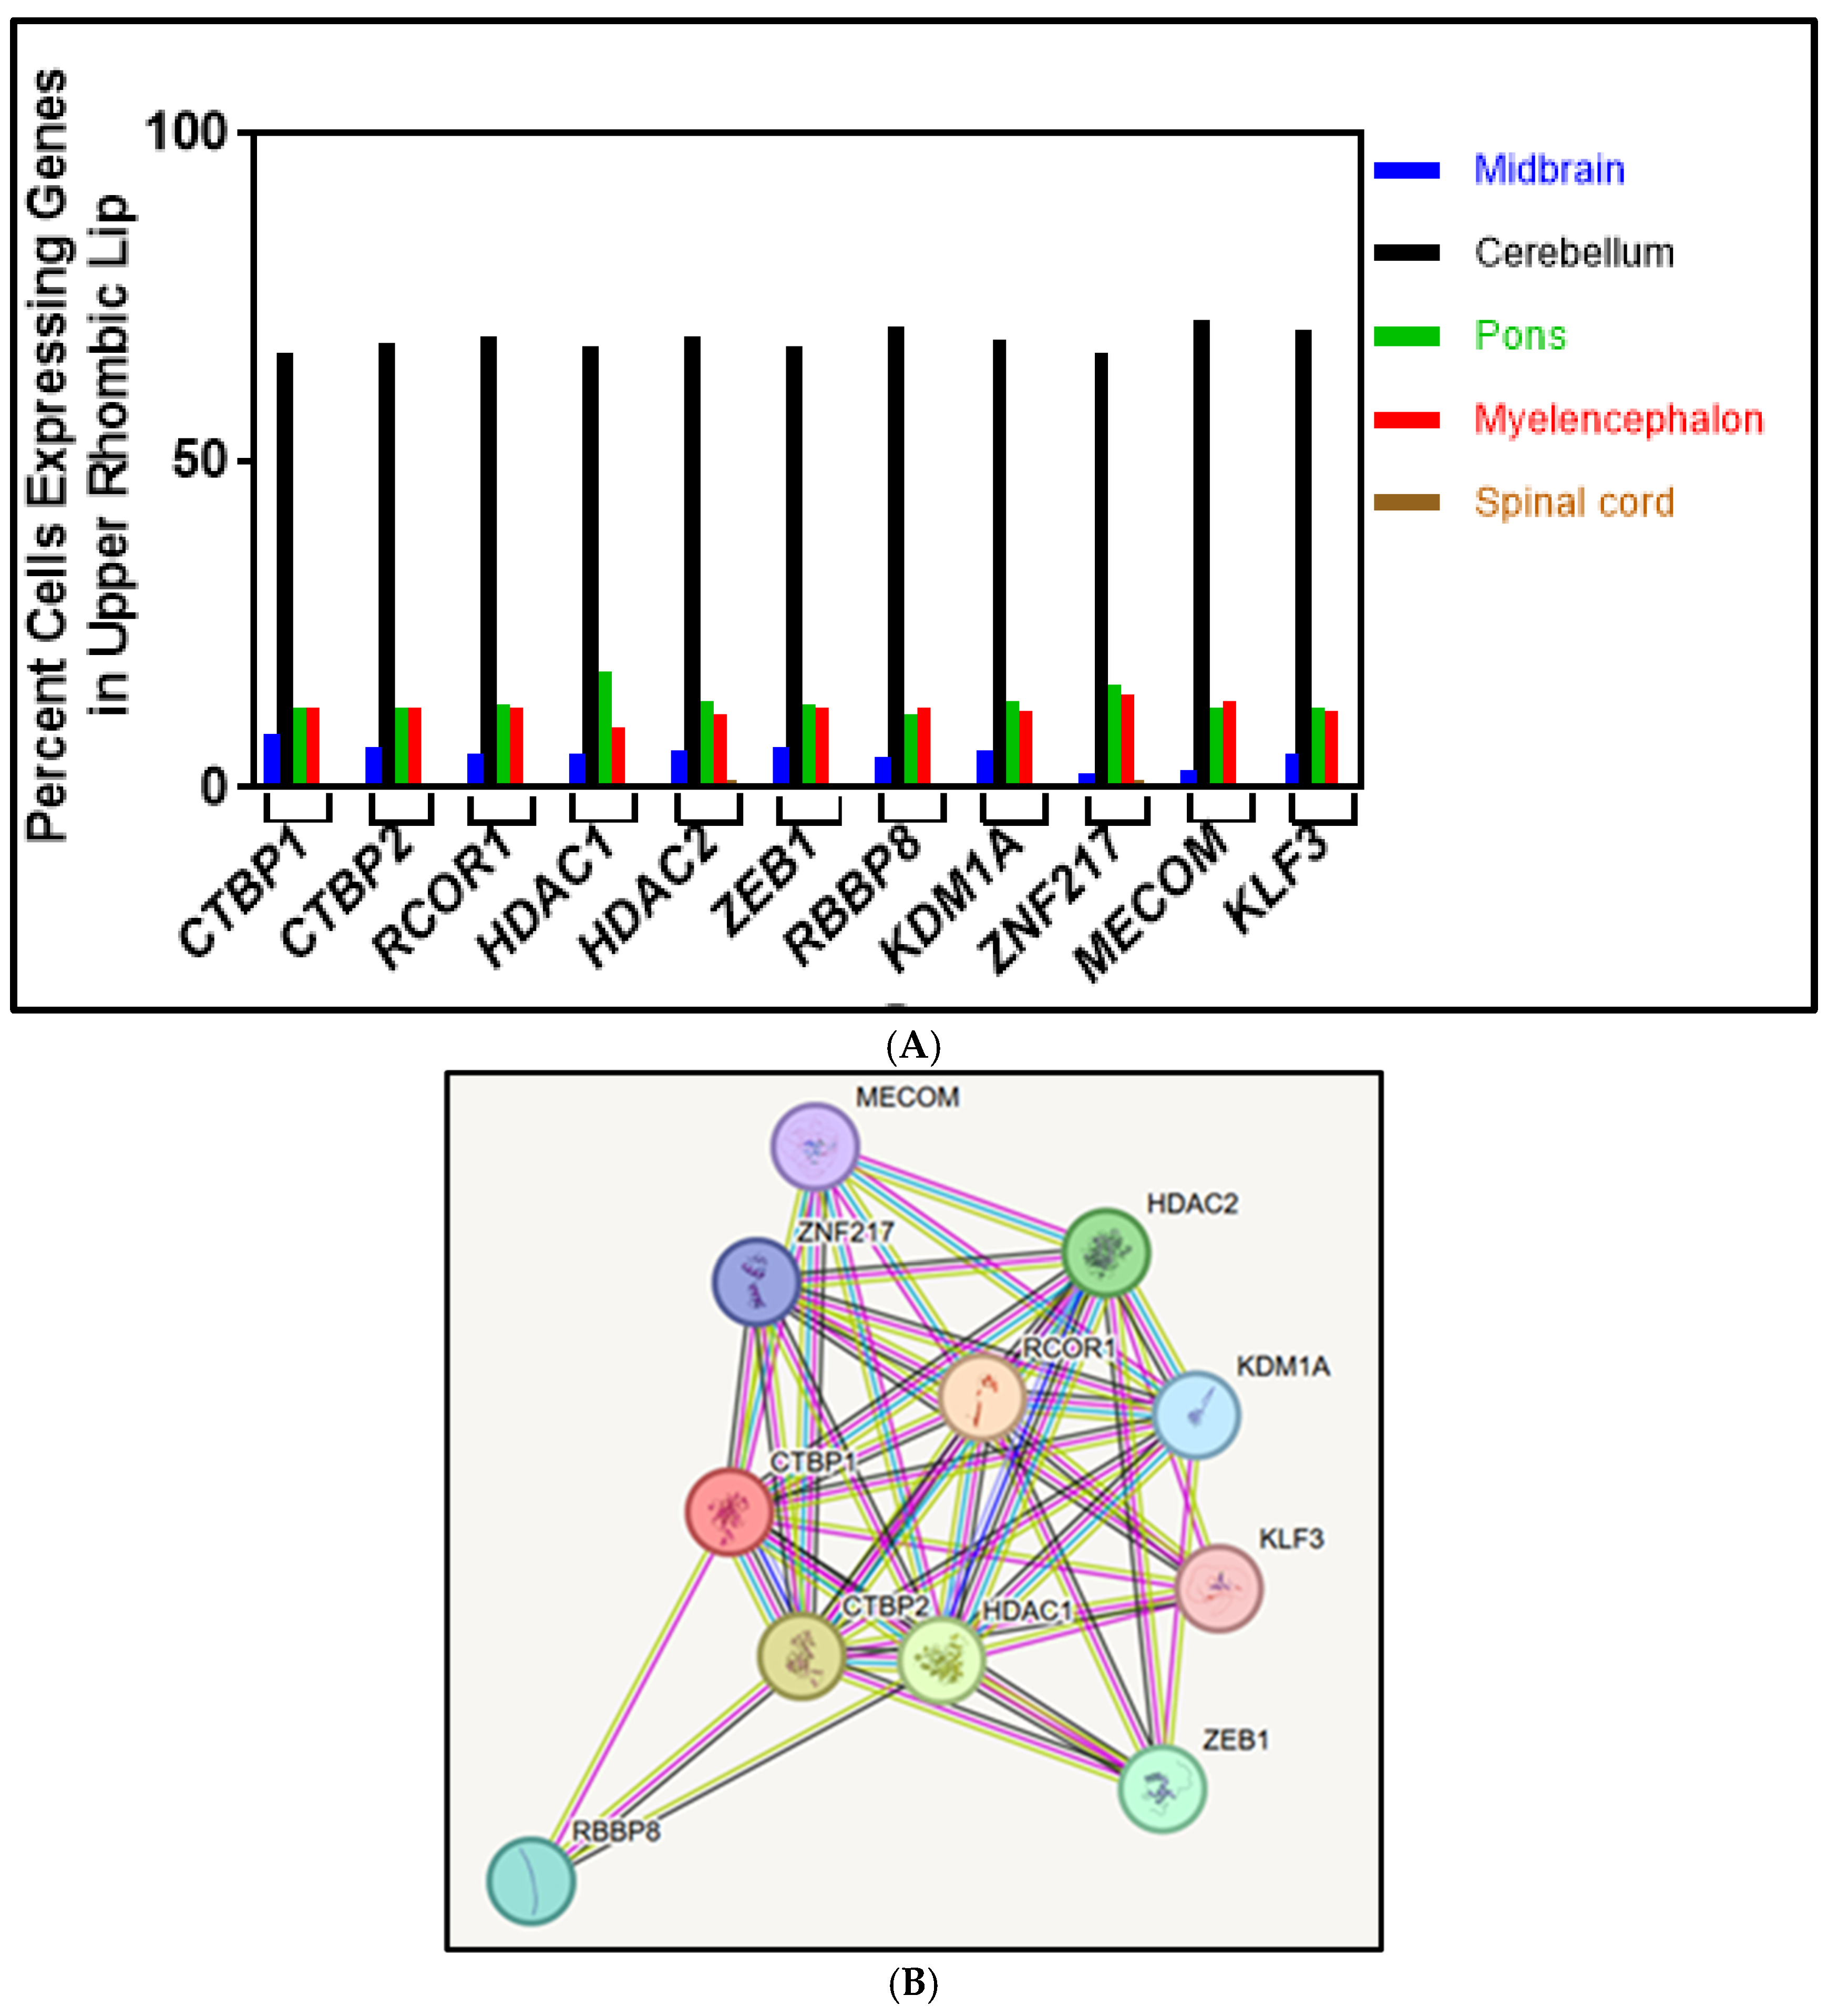
4.3. Step 3: Gene Expression Comparison in the URL

Each t-SNE island represents a supercluster [22,23,24]. The expression levels of CTBP1 and CTBP2 were predominantly highlighted in one particular t-SNE island, the URL, after setting the value of expression levels (Log2 (CPM + 1)) above 7.8. The URL predominantly contained cells highly expressing CTBP1 when compared to other superclusters, as seen in the brain atlas and shown quantitatively (Figure 1 and Figure 2 and Table 1). For the CtBP1-interacting protein-coding genes (MECOM, RBBP8, KLF3, CTBP2, HDAC2, RCOR1, KDM1A, HDAC1, ZEB1, and ZNF1), the number of cells expressing the gene of interest in the URL supercluster and their respective anatomical regions were analyzed (Figure 1A).

4.4. Step 4: Analysis of CtBP1-Interacting Protein-Coding Genes

The ABC atlas was used to map the expression of CTBP1 and its binding partners [22,23,26]. CtBP2 was also mapped as it can dimerize/oligomerize with CtBP1 [8,9]. Based on the ABC atlas, CTBP1 is expressed in all regions of the brain; however, the highest expression is found in the URL, which is the posterior section of the developing metencephalon found in vertebrate embryos. During the development of the brain, the URL gives rise to cells with migratory functions, such as cerebellar granule cell precursors, which provide cues for migratory pathways crucial in proper neurodevelopment [27,28,29]. The metencephalon develops into the cerebellum and pons during embryonic development [30]. High levels of CTBP1 expression in the URL and its related brain regions reveal why HADDTS patients exhibit cerebellar manifestations such as ataxia, hypotonia, and cerebellar atrophy, and CTBP1 expression in other areas of the brain suggests the importance of the corepressor CtBP1 in brain development and function.
The highest CTBP1 gene expression is predominantly located in the URL (Log2 (CPM + 1) > 7.8), which gives rise to cerebellum-originated cells such as granule cells (Figure 1) [27,28,29,30,31]. The predominant relevance of the URL was underscored as HADDTS patients exhibit cerebellar physical manifestations—ataxia, hypotonia, and cerebellar atrophy. CTBP2 expression was also found to be predominantly expressed in the URL (Log2 (CPM + 1) > 7.8). Based on these results, this paper focuses on the URL due to its relevance to HADDTS, which is caused by a heterozygous missense mutation in CTBP1 [1,2].

5. CtBP1-Interacting Proteins

Early neurodevelopment encompasses vital cellular processes such as neurogenesis, cell migration, differentiation, synaptogenesis, neuronal cell death, and synaptic rearrangement [13,24,27,28,29,30,31]. Neurodevelopment requires precise expression and the orchestration of dynamic changes in gene expression to decide the fate of the developing cells. In a previously published paper, comparisons between the RNA-seq data of neurons derived from induced pluripotent stem cells of patients and normal donors revealed the downregulation of gene networks involved in neurodevelopment, as well as synaptic adhesion [32].
CtBP1, as a corepressor, interacts with chromatin-modifying enzymes and transcription factors to repress transcription [4,5,6,7,8,9,10]. Most of the CtBP1-interacting proteins are characterized in cancer cells, and CtBP1 data on neurodevelopment is limited. Therefore, the Search Tool for Retrieval of Interacting Genes/Proteins (STRING) database [25] was used to find ten CtBP1-interacting proteins (Figure 2B). STRING provides uniquely comprehensive coverage and access to experimental and predicted protein interactions [25]. CtBP1 was entered to display a graphical network of its interaction partners. Ten proteins that interact with CtBP1 were found, and their respective genes were chosen as candidates to assess their expression patterns in the URL. Although the STRING database showed these ten proteins, there can be other proteins that interact with CtBP1 during neurodevelopment.
CtBP1’s association with these interacting proteins suggests that their expression should correlate with CTBP1 expression in the URL supercluster. Cells expressing CTBP1 and its interacting genes that encode proteins in the URL were categorized into 13 anatomical regions (Table 1 and Figure 2A). A total of 213,350 cells expressed CTBP1 in the URL, of which 96% are in the cerebellum; a total of 70,216 cells expressed CTBP2 in the URL, of which 69.2% are in the cerebellum. Even though most of the cells in the URL give rise to cerebellar cells, other brain region cells can also originate from the URL [27,28,29]. When the supercluster cells expressing genes are categorized into anatomical regions, the CtBP1-interacting protein genes are highly expressed in the cerebellum and, to some extent, in the pons, myelencephalon, and midbrain (Table 1 and Figure 2B). In the cerebellum, the expression of CtBP1 corepressor-binding protein-coding genes is as follows: MECOM (71.5%) > RBBP8 (70.4%) > KLF3 (69.7%) > CTBP2 (69.2%) > HDAC2 (68.9%) > RCOR1 (68.8%) > KDM1A (68.4%) > HDAC1 (67.5%) > ZEB1 (67.4%) > ZNF217 (66.2%). All ten genes are predominantly expressed in the URL and the cerebellum. Below are the descriptions of the roles and some of the known functions of the ten CtBP1-interacting proteins identified by the STRING database (Figure 2B) and their percentage of gene expression as determined using the ABC atlas (Figure 1A).

5.1. CTBP2

CTBP2 is highly expressed in the supercluster URL, and 69.2% of the cells expressing CTBP2 are located in the cerebellum (Figure 2A). Even though CtBP1 and CtBP2 execute shared functions as transcription regulators, they often play distinct roles in cellular function [4,11]. It has been shown that CtBP-interacting protein (CtIP, also called retinoblastoma binding protein 8 (RBBP8)) assembles CtBP1 and CtBP2 heterodimers, histone deacetylase 1 (HDAC1), and two subunits of the activating protein 1 transcription factor (AP1). This assembled repressor complex suppresses genes involved in DNA repair—such as MutL homolog 1 (MLH1), MutS homolog 3 (MSH3), breast cancer gene 1 (BRCA1), and cyclin-dependent kinase inhibitor 1A (CDKN1A)—by binding to their promoter region in the osteosarcoma [33]. This suggests that in certain instances, heterodimers formed by CTBP1 and CTBP2 play critical roles in regulating gene repression [9,33].
The cerebellum is vulnerable to oxidative DNA damage due to its high level of oxidative metabolism [34,35]. DNA damage needs to be repaired to keep the neuron functional; otherwise, it can lead to neuronal dysfunction and apoptotic cell death [34,35]. A defective DNA damage repair system can result in a multitude of human syndromes that feature pronounced neuropathology, such as spinocerebellar ataxia which is associated with axonal neuropathy (SCAN1). Ataxia is associated with oculomotor apraxia (AOA1) where defects occur in the single-strand break repair (SSBR) and exhibits ataxia-linked cerebellar degeneration and neuropathy [35,36]. A mouse model with the inactivation of Xrcc1, a DNA repair factor associated with single-strand breaks, showed profound neuropathy characterized by the loss of cerebellar interneurons [37]. Based on the high expression levels of CTBP1 and CTBP2 in the URL, and especially in the cerebellum where high oxidative metabolism can lead to DNA damage, one can predict that CtBPs may play an important role in maintaining genomic integrity in the cerebellum.

5.2. RCOR1

The corepressor of the repressor element-1 silencing transcription (CoREST) protein is encoded by the RCOR1 gene. RCOR1 is highly expressed in the supercluster URL and 68.8% of the cells in the cerebellum express this gene (Figure 2). The RE1 silencing transcription factor (REST) cooperates with CoREST and silences neuron-specific genes in non-neuronal cells [38]. CoREST forms a multi-subunit complex with lysine-specific demethylase 1 (LSD1) and modifies nucleosomes by deacetylation and demethylation, thereby regulating transcription [38]. Depending on the function and the environmental context of the cell, several core subunits have been identified to interact with CoREST, which include LSD1, HDAC1, HDAC2, CtBP1, ZNF217, BHC80, and BRAF35. CoREST binds to the SIRT1-LSD1-CtBP1 complex and represses Notch target genes [33]. Notch signaling plays a critical role in neurodevelopment, mainly by regulating the balance of neural progenitor cells and their differentiation into neurons and glial cells [39].

5.3. HDAC1 and HDAC2

HDAC1 and HDAC2 (HDAC1/2) are highly related histone deacetylases that form the catalytic core of multiple corepressor complexes. The PLDLS-binding cleft region in CtBP1 functions as the primary recruitment center for DNA-binding factors and the core and auxiliary enzymatic constituents of the CtBP1 corepressor complex, including HDAC1/2 and CoREST/LSD1. This shows that the functions of HDAC1/2 are extensively linked to the repression activity of CtBP1 [33]. Both HDAC1 and HDAC2 are highly expressed in the URL and the cerebellum; 67.5% of the cells expressing HDAC1 and 68.9% of the cells expressing HDAC2 are localized to the cerebellum (Figure 2A).

5.4. ZEB1

In cancer metastasis, the epithelial–mesenchymal transition is regulated by the zinc-finger E-box binding homeobox 1 (ZEB1). ZEB1 binds to the promoter region and recruits CtBP1, thereby repressing gene expression [5]. In total, 67.4% of the cells expressing ZEB1 are localized to the cerebellum (Table 1 and Figure 2). During cancer metastasis, ZEB1 forms a complex with CtBP1, which is transported to the nucleus and suppresses epithelial genes, resulting in cell migration, invasion, and tumor progression. Mutation in ZEB1 is associated with defective brain development [40]. Interactions between ZEB1 and CtBP2 in the mouse embryonic cerebral cortex are required for ZEB1 to elicit its effect on multipolar-to-bipolar transition, which is crucial for proper neural functioning during cortical development [40]. The ZEB1 protein level decreases during differentiation and is undetectable in neurons, suggesting that timed repression is critical in controlling the transition from the progenitor stage to the differentiated stage [40].

5.5. RBBP8

RBBP8 acts as an adaptor protein, thereby allowing the association of CtBP1 with another transcription factor. RBBP8 is highly expressed in the supercluster URL, and 70.4% of the cells in the cerebellum express this gene (Figure 2A). RBBP8 plays multiple roles apart from forming the transcriptional repression complex [33]. It is involved in initiating DNA-end resection of double-strand breaks (DSBs) during homologous recombination, thereby maintaining genomic integrity. It is also involved in damage checkpoint signaling and replication fork protection pathways [33]. As a multifunctional protein, RBBP8 may carry out other functions apart from being part of the transcriptional repression complex.

5.6. KLF3

The Krüppel-like factor (KLF) family of sequence-specific DNA-binding proteins binds GC-rich regions and related CAC sequences in the DNA [41]. KLF3 is one of the 17 members of the KLF family. KLF3 is highly expressed in the supercluster URL, and 69.7% of the cells in the cerebellum express KLF3 (Figure 2A). KLF family members regulate cellular processes such as cell proliferation and differentiation, as well as cell survival [41]. In KLF3, the N-terminal consensus motif, PVALS/T, is shown to interact with CtBPs and cause transcriptional suppression [41]. KLF3 interacts with CtBP1 and regulates adipogenesis, erythropoiesis, and B cell development [41]. Based on the functions of KLF3, the expression of KLF3 in the URL suggests that it may be involved in neurodevelopment.

5.7. KDM1A

Lysine-specific demethylase 1 (LSD1), also known as lysine(K)-specific demethylase 1A (KDM1A), is encoded by the KDM1A gene [42]. KDM1A is highly expressed in the supercluster URL, and 68.4% of the cells in the cerebellum express this gene (Figure 2A). KDM1A demethylates mono- and dimethylated lysines, specifically histone 3 lysine 4 (H3K4me3) [42]. KDM1A interacts with the orphan hormone receptor and regulates neural stem cell proliferation and differentiation [42]. This demethylase was first identified to be a part of the CtBP1 corepressor complex. KDM1A downregulates notch pathway genes, namely JAG2, ASMA12, PSEN2, HES6, TLE1, and CDKN1A, playing a critical role in neurogenesis [42,43].

5.8. MECOM

The MDS1 and EVI1 complex locus (MECOM), also known as ectopic virus integration site 1 (EVI1) or positive regulatory domain zinc finger protein 3 (PRDM3), encodes a protein that can act as an oncoprotein and a transcriptional regulator [44]. It is highly expressed in the supercluster URL, and 71.5% of the cells in the cerebellum express this gene (Figure 2A). EVI1 interacts with other transcription factors in a context-dependent manner, regulates chromatin remodeling, and is involved in the differentiation of the nervous system and hematopoiesis. Overexpression of this oncogene, EVI1, has been associated with several types of cancers, such as breast, lung, ovarian, and prostate cancer [44]. CtBP1 has been shown to interact with MECOM/EVI1 and repress transforming growth factor beta (TGF-beta) signaling [45]. TGF-beta plays an important role in both embryonic and adult signaling, providing tissue-specific control of differentiation, proliferation, and cell-specific or tissue-specific motility [45]. By interacting with CtBP1, MECOM represses the expression of its target genes in stem cells and neurons.

5.9. ZNF217

Zinc finger 217 (ZNF217) codes for an oncogenic protein, and its expression is frequently amplified in tumors [46]. ZNF217 is highly expressed in the supercluster URL, and 66.2% of the cells in the cerebellum express this gene (Figure 2A). It is also found in the corepressor complex CtBP1-CoREST-HDAC and other repressor protein complexes [47]. ZNF217 is involved in the self-renewal and maintenance of stem cells, also inhibiting differentiation [48].

6. Conclusions

This review focused on using Allen Institute’s ABC atlas to understand how a heterozygous CTBP1 missense mutation causes HADDTS [22,23,26]. The greatest number of CTBP1-expressing cells were found in the URL, which was further categorized into 13 distinct anatomical regions. CTBP1 and its associated partner protein-coding genes, which encode chromosome-modifying proteins, are highly expressed in the URL and the cerebellum, as indicated by the ABC atlas (Figure 2B). An immunohistochemical study of the postnatal day-30 mouse cerebellum also supports the analysis shown in this review, suggesting that CTBP1 is predominantly expressed in the cerebellum [49].
HADDTS patients harbor a heterozygous mutation in CtBP1; the pathogenic allele encodes a mutant protein (m), and the wild-type allele encodes a normal, functional protein (wt). In the presence of NADH, CtBP1 dimerizes and functions as a transcriptional repressor [7,8,9]. Therefore, the amount of the monomeric or dimeric form of CtBP1 is dependent on the ratio of NADH/NAD+ [8]. The functional dimeric form of the repressor complex can be composed of two monomeric mutant proteins (m-m), a mutant and a wild-type monomeric protein (m-wt), and two wild-type monomeric proteins (wt-wt). One can hypothesize that CtBP1 dimers formed by mutant proteins alone (m-m) or a mutant and wild-type protein (m-wt) can dysregulate transcription, thereby affecting the cerebellum’s function.
Brain development involves the finely tuned transcriptional regulation of genes, and the expression of these genes at the appropriate time and space is critical [16]. Transcriptome analysis of neurons obtained from induced pluripotent stem cells (iPSCs) derived from HADDTS patients revealed that the majority of the genes involved in neurodevelopment are downregulated [32]. Therefore, understanding CTBP1 involvement in the various cellular processes will help elucidate the effects of the heterozygous CTBP1 mutation that causes HADDTS. For instance, CtBP1 is also involved in presynaptic assembly through direct interaction with the active zone scaffolding proteins Bassoon and Piccolo [50]. Based on the neuronal activity requirement, CtBP1 can shuttle between the nucleus as a corepressor complex and the cytoplasm for presynapsis and regulation of membrane fission [50,51].
Studies using mice have shown that CtBP1 is expressed in the central nervous system throughout development [49]. At postnatal day 30, CtBP1 is expressed in the nucleus and cytoplasm of Purkinje cells, the nucleus of granule cells, and cells in the molecular layer [49]. As CTBP1 is highly expressed in the URL, as shown in the ABC atlas and in the mouse cerebellum [49], CtBP1 must play a critical role in cerebellar development and function. Studies suggest that, apart from its role in motor functions, the cerebellum is also involved in a range of cognitive and emotional functions [52,53].
To further elucidate the role of CTBP1 mutation in HADDTS, future studies can focus on wild-type and CTBP1-mutant iPSC-derived cerebellar organoids. A comparison of wild-type and heterozygous mutant cerebellar organoids can reveal whether cerebellar cell development and functions are affected by the CtBP1 mutation. Based on the ABC atlas results, one can predict that the transcription factors involved in cerebellar development are downregulated in the mutant cells compared to the wild-type cells. Single-cell transcriptome analysis of cerebellar organoids can provide detailed information on gene expression at the level of individual cells, enabling the identification of distinct cell types and their gene expression profiles. Specifically, comparing the expression of transcription factors involved in cerebellar development, such as Atoh1 and Zic [27,28,29], in wild-type and mutant cerebellar organoids will provide insights into the dysregulation caused by the CTBP1 mutation. As granule cells are the predominant cell type in the cerebellum and CTBP1 is highly expressed in the cerebellum [27,28,29], one can postulate that CTBP1 mutation causes a major disruption to granule cell development and its function, revealing a possible primary cause of HADDTS. Differentiating iPSCs into granule cells and performing a transcriptome analysis of wild-type versus mutant cells can provide valuable information regarding the dysregulation of granule cell development and function caused by the mutation. Thus, the analysis of CTBP1 expression patterns in various brain regions using the ABC atlas offers a valuable tool for designing experimental strategies and gaining insights into the pathogenesis of neurodevelopmental disorders.

Author Contributions

Conceptualization, U.R.E.; methodology, S.L.; formal analysis, U.R.E. and S.L.; data curation, U.R.E. and S.L.; writing—original draft preparation, U.R.E.; writing—review and editing, U.R.E. and S.L. funding acquisition, U.R.E. All authors have read and agreed to the published version of the manuscript.

Funding

This research was funded by DeNardo Education and Research Foundation.

Acknowledgments

S.L. and U.R.E. supported by the DeNardo Education and Research Foundation. The authors thank R Heuertz for critically reading the paper.

Conflicts of Interest

The authors declare no competing financial interests.

References

  1. Beck, D.B.; Cho, M.T.; Millan, F.; Yates, C.; Hannibal, M.; O’Connor, B.; Shinawi, M.; Connolly, A.M.; Waggoner, D.; Halbach, S.; et al. A recurrent de novo CTBP1 mutation is associated with developmental delay, hypotonia, ataxia, and tooth enamel defects. Neurogenetics 2016, 17, 173–178. [Google Scholar] [CrossRef] [PubMed]
  2. Beck, D.B.; Subramanian, T.; Vijayalingam, S.; Ezekiel, U.R.; Donkervoort, S.; Yang, M.L.; Dubbs, H.A.; Ortiz-Gonzalez, X.R.; Lakhani, S.; Segal, D.; et al. A pathogenic CtBP1 missense mutation causes altered cofactor binding and transcriptional activity. Neurogenetics 2019, 20, 129–143. [Google Scholar] [CrossRef] [PubMed]
  3. Boyd, J.M.; Subramanian, T.; Schaeper, U.; La Regina, M.; Bayley, S.; Chinnadurai, G. A region in the C-terminus of adenovirus 2/5 E1a protein is required for association with a cellular phosphoprotein and important for the negative modulation of T24-ras mediated transformation, tumorigenesis and metastasis. EMBO J. 1993, 12, 469–478. [Google Scholar] [CrossRef] [PubMed]
  4. Chinnadurai, G. CtBP, an unconventional transcriptional corepressor in development and oncogenesis. Mol. Cell 2002, 9, 213–224. [Google Scholar] [CrossRef]
  5. Katsanis, N.; Fisher, E.M. A novel C-terminal binding protein (CTBP2) is closely related to CTBP1, an adenovirus E1A-binding protein, and maps to human chromosome 21q21.3. Genomics 1998, 47, 294–299. [Google Scholar] [CrossRef]
  6. Blevins, M.A.; Huang, M.; Zhao, R. The Role of CtBP1 in Oncogenic Processes and Its Potential as a Therapeutic Target. Mol. Cancer Ther. 2017, 16, 981–990. [Google Scholar] [CrossRef]
  7. Fjeld, C.C.; Birdsong, W.T.; Goodman, R.H. Differential binding of NAD+ and NADH allows the transcriptional corepressor carboxyl-terminal binding protein to serve as a metabolic sensor. Proc. Natl. Acad. Sci. USA 2003, 100, 9202–9207. [Google Scholar] [CrossRef]
  8. Jaiswal, A.; Singh, R. CtBP: A global regulator of balancing acts and homeostases. Biochim. Biophys. Acta Rev. Cancer 2023, 1878, 188886. [Google Scholar] [CrossRef]
  9. Li, J.; Wang, Y.; Wang, L.; Hao, D.; Li, P.; Su, M.; Zhao, Z.; Liu, T.; Tai, L.; Lu, J.; et al. Metabolic modulation of CtBP dimeric status impacts the repression of DNA damage repair genes and the platinum sensitivity of ovarian cancer. Int. J. Biol. Sci. 2023, 19, 2081–2096. [Google Scholar] [CrossRef]
  10. Bhambhani, C.; Chang, J.L.; Akey, D.L.; Cadigan, K.M. The oligomeric state of CtBP determines its role as a transcriptional co-activator and co-repressor of Wingless targets. EMBO J. 2011, 30, 2031–2043. [Google Scholar] [CrossRef]
  11. Hildebrand, J.D.; Soriano, P. Overlapping and unique roles for C-terminal binding protein 1 (CtBP1) and CtBP2 during mouse development. Mol. Cell Biol. 2002, 22, 5296–5307. [Google Scholar] [CrossRef] [PubMed]
  12. Saraiva, C.; Lopes-Nunes, J.; Esteves, M.; Santos, T.; Vale, A.; Cristovao, A.C.; Ferreira, R.; Bernardino, L. CtBP Neuroprotective Role in Toxin-Based Parkinson’s Disease Models: From Expression Pattern to Dopaminergic Survival. Mol. Neurobiol. 2023, 60, 4246–4260. [Google Scholar] [CrossRef] [PubMed]
  13. Hu, K.; Li, Y.; Yu, H.; Hu, Y. CTBP1 Confers Protection for Hippocampal and Cortical Neurons in Rat Models of Alzheimer’s Disease. Neuroimmunomodulation 2019, 26, 139–152. [Google Scholar] [CrossRef] [PubMed]
  14. Stankiewicz, T.R.; Schroeder, E.K.; Kelsey, N.A.; Bouchard, R.J.; Linseman, D.A. C-terminal binding proteins are essential pro-survival factors that undergo caspase-dependent downregulation during neuronal apoptosis. Mol. Cell Neurosci. 2013, 56, 322–332. [Google Scholar] [CrossRef]
  15. Karaca, E.; Li, X.; Lewicki, J.; Neofytou, C.; Guerout, N.; Barnabe-Heider, F.; Hermanson, O. The corepressor CtBP2 is required for proper development of the mouse cerebral cortex. Mol. Cell Neurosci. 2020, 104, 103481. [Google Scholar] [CrossRef]
  16. Hubler, D.; Rankovic, M.; Richter, K.; Lazarevic, V.; Altrock, W.D.; Fischer, K.D.; Gundelfinger, E.D.; Fejtova, A. Differential spatial expression and subcellular localization of CtBP family members in rodent brain. PLoS ONE 2012, 7, e39710. [Google Scholar] [CrossRef]
  17. Li, H.; Zhang, C.; Yang, C.; Blevins, M.; Norris, D.; Zhao, R.; Huang, M. C-terminal binding proteins 1 and 2 in traumatic brain injury-induced inflammation and their inhibition as an approach for anti-inflammatory treatment. Int. J. Biol. Sci. 2020, 16, 1107–1120. [Google Scholar] [CrossRef]
  18. Liang, H.; Fekete, D.M.; Andrisani, O.M. CtBP2 downregulation during neural crest specification induces expression of Mitf and REST, resulting in melanocyte differentiation and sympathoadrenal lineage suppression. Mol. Cell Biol. 2011, 31, 955–970. [Google Scholar] [CrossRef]
  19. Acosta-Baena, N.; Tejada-Moreno, J.A.; Arcos-Burgos, M.; Villegas-Lanau, C.A. CTBP1 and CTBP2 mutations underpinning neurological disorders: A systematic review. Neurogenetics 2022, 23, 231–240. [Google Scholar] [CrossRef]
  20. Sommerville, E.W.; Alston, C.L.; Pyle, A.; He, L.; Falkous, G.; Naismith, K.; Chinnery, P.F.; McFarland, R.; Taylor, R.W. De novo CTBP1 variant is associated with decreased mitochondrial respiratory chain activities. Neurol. Genet. 2017, 3, e187. [Google Scholar] [CrossRef]
  21. Jafari Khamirani, H.; Zoghi, S.; Saber Sichani, A.; Dianatpour, M.; Mohammadi, S.; Mohammad Bagher Tabei, S.; Alireza Dastgheib, S. Exome sequencing identified a de novo frameshift pathogenic variant of CTBP1 in an extremely rare case of HADDTS. J. Genet. 2021, 100, 68. [Google Scholar] [CrossRef] [PubMed]
  22. Allen Institute for Brain Science. Allen Brain Cell Atlas [Transcriptomic Diversity of Cell Types in Adult Human Brain Dataset]. 2011. Available online: https://knowledge.brain-map.org/abcatlas (accessed on 23 December 2024).
  23. Zaldivar, A.; Krichmar, J.L. Allen Brain Atlas-Driven Visualizations: A web-based gene expression energy visualization tool. Front. Neuroinform. 2014, 8, 51. [Google Scholar] [CrossRef] [PubMed]
  24. Siletti, K.; Hodge, R.; Mossi Albiach, A.; Lee, K.W.; Ding, S.L.; Hu, L.; Lonnerberg, P.; Bakken, T.; Casper, T.; Clark, M.; et al. Transcriptomic diversity of cell types across the adult human brain. Science 2023, 382, eadd7046. [Google Scholar] [CrossRef] [PubMed]
  25. Szklarczyk, D.; Kirsch, R.; Koutrouli, M.; Nastou, K.; Mehryary, F.; Hachilif, R.; Gable, A.L.; Fang, T.; Doncheva, N.T.; Pyysalo, S.; et al. The STRING database in 2023: Protein-protein association networks and functional enrichment analyses for any sequenced genome of interest. Nucleic Acids Res. 2023, 51, D638–D646. [Google Scholar] [CrossRef]
  26. Acevedo-Triana, C.A.; Leon, L.A.; Cardenas, F.P. Comparing the Expression of Genes Related to Serotonin (5-HT) in C57BL/6J Mice and Humans Based on Data Available at the Allen Mouse Brain Atlas and Allen Human Brain Atlas. Neurol. Res. Int. 2017, 2017, 7138926. [Google Scholar] [CrossRef]
  27. Consalez, G.G.; Goldowitz, D.; Casoni, F.; Hawkes, R. Origins, Development, and Compartmentation of the Granule Cells of the Cerebellum. Front. Neural Circuits 2020, 14, 611841. [Google Scholar] [CrossRef]
  28. Gilthorpe, J.D.; Papantoniou, E.K.; Chedotal, A.; Lumsden, A.; Wingate, R.J. The migration of cerebellar rhombic lip derivatives. Development 2002, 129, 4719–4728. [Google Scholar] [CrossRef]
  29. Casoni, F.; Croci, L.; Marroni, F.; Demenego, G.; Marullo, C.; Cremona, O.; Codazzi, F.; Consalez, G.G. A spatial-temporal map of glutamatergic neurogenesis in the murine embryonic cerebellar nuclei uncovers a high degree of cellular heterogeneity. J. Anat. 2024, 245, 560–571. [Google Scholar] [CrossRef]
  30. Oishi, K.; Chotiyanonta, J.; Wu, D.; Miller, M.I.; Mori, S.; Oishi, K.; Pediatric Imaging, N.; Genetics, S. Developmental trajectories of the human embryologic brain regions. Neurosci. Lett. 2019, 708, 134342. [Google Scholar] [CrossRef]
  31. Hagan, N.; Zervas, M. Wnt1 expression temporally allocates upper rhombic lip progenitors and defines their terminal cell fate in the cerebellum. Mol. Cell Neurosci. 2012, 49, 217–229. [Google Scholar] [CrossRef]
  32. Vijayalingam, S.; Ezekiel, U.R.; Xu, F.; Subramanian, T.; Geerling, E.; Hoelscher, B.; San, K.; Ganapathy, A.; Pemberton, K.; Tycksen, E.; et al. Human iPSC-Derived Neuronal Cells From CTBP1-Mutated Patients Reveal Altered Expression of Neurodevelopmental Gene Networks. Front. Neurosci. 2020, 14, 562292. [Google Scholar] [CrossRef] [PubMed]
  33. Chen, X.; Zhang, Q.; Dang, X.; Fan, J.; Song, T.; Li, Z.; Duan, N.; Zhang, W. The CtIP-CtBP1/2-HDAC1-AP1 transcriptional complex is required for the transrepression of DNA damage modulators in the pathogenesis of osteosarcoma. Transl. Oncol. 2022, 21, 101429. [Google Scholar] [CrossRef] [PubMed]
  34. Kulkarni, A.; Wilson, D.M., 3rd. The involvement of DNA-damage and -repair defects in neurological dysfunction. Am. J. Hum. Genet. 2008, 82, 539–566. [Google Scholar] [CrossRef] [PubMed]
  35. Pakula, A.; Nagar, S.E.; Sumru Bayin, N.; Christensen, J.B.; Stephen, D.N.; Reid, A.J.; Koche, R.; Joyner, A.L. An increase in reactive oxygen species underlies neonatal cerebellum repair. bioRxiv 2024. [Google Scholar] [CrossRef]
  36. Takashima, H.; Boerkoel, C.F.; John, J.; Saifi, G.M.; Salih, M.A.; Armstrong, D.; Mao, Y.; Quiocho, F.A.; Roa, B.B.; Nakagawa, M.; et al. Mutation of TDP1, encoding a topoisomerase I-dependent DNA damage repair enzyme, in spinocerebellar ataxia with axonal neuropathy. Nat. Genet. 2002, 32, 267–272. [Google Scholar] [CrossRef]
  37. Lee, Y.; Katyal, S.; Li, Y.; El-Khamisy, S.F.; Russell, H.R.; Caldecott, K.W.; McKinnon, P.J. The genesis of cerebellar interneurons and the prevention of neural DNA damage require XRCC1. Nat. Neurosci. 2009, 12, 973–980. [Google Scholar] [CrossRef]
  38. Monestime, C.M.; Taibi, A.; Gates, K.P.; Jiang, K.; Sirotkin, H.I. CoRest1 regulates neurogenesis in a stage-dependent manner. Dev. Dyn. 2019, 248, 918–930. [Google Scholar] [CrossRef]
  39. Macinkovic, I.; Theofel, I.; Hundertmark, T.; Kovac, K.; Awe, S.; Lenz, J.; Forne, I.; Lamp, B.; Nist, A.; Imhof, A.; et al. Distinct CoREST complexes act in a cell-type-specific manner. Nucleic Acids Res. 2019, 47, 11649–11666. [Google Scholar] [CrossRef]
  40. Wang, H.; Xiao, Z.; Zheng, J.; Wu, J.; Hu, X.L.; Yang, X.; Shen, Q. ZEB1 Represses Neural Differentiation and Cooperates with CTBP2 to Dynamically Regulate Cell Migration during Neocortex Development. Cell Rep. 2019, 27, 2335–2353.e6. [Google Scholar] [CrossRef]
  41. Moore, D.L.; Apara, A.; Goldberg, J.L. Kruppel-like transcription factors in the nervous system: Novel players in neurite outgrowth and axon regeneration. Mol. Cell Neurosci. 2011, 47, 233–243. [Google Scholar] [CrossRef]
  42. Laurent, B.; Ruitu, L.; Murn, J.; Hempel, K.; Ferrao, R.; Xiang, Y.; Liu, S.; Garcia, B.A.; Wu, H.; Wu, F.; et al. A specific LSD1/KDM1A isoform regulates neuronal differentiation through H3K9 demethylation. Mol. Cell 2015, 57, 957–970. [Google Scholar] [CrossRef] [PubMed]
  43. Katoh, M.; Katoh, M. Notch ligand, JAG1, is evolutionarily conserved target of canonical WNT signaling pathway in progenitor cells. Int. J. Mol. Med. 2006, 17, 681–685. [Google Scholar] [CrossRef] [PubMed]
  44. Leszczynski, P.; Smiech, M.; Parvanov, E.; Watanabe, C.; Mizutani, K.I.; Taniguchi, H. Emerging Roles of PRDM Factors in Stem Cells and Neuronal System: Cofactor Dependent Regulation of PRDM3/16 and FOG1/2 (Novel PRDM Factors). Cells 2020, 9, 2603. [Google Scholar] [CrossRef] [PubMed]
  45. Izutsu, K.; Kurokawa, M.; Imai, Y.; Maki, K.; Mitani, K.; Hirai, H. The corepressor CtBP interacts with Evi-1 to repress transforming growth factor beta signaling. Blood 2001, 97, 2815–2822. [Google Scholar] [CrossRef]
  46. Quinlan, K.G.; Nardini, M.; Verger, A.; Francescato, P.; Yaswen, P.; Corda, D.; Bolognesi, M.; Crossley, M. Specific recognition of ZNF217 and other zinc finger proteins at a surface groove of C-terminal binding proteins. Mol. Cell Biol. 2006, 26, 8159–8172. [Google Scholar] [CrossRef]
  47. Banck, M.S.; Li, S.; Nishio, H.; Wang, C.; Beutler, A.S.; Walsh, M.J. The ZNF217 oncogene is a candidate organizer of repressive histone modifiers. Epigenet. Off. J. DNA Methylation Soc. 2009, 4, 100–106. [Google Scholar] [CrossRef]
  48. Cohen, P.A.; Donini, C.F.; Nguyen, N.T.; Lincet, H.; Vendrell, J.A. The dark side of ZNF217, a key regulator of tumorigenesis with powerful biomarker value. Oncotarget 2015, 6, 41566–41581. [Google Scholar] [CrossRef]
  49. Hamada, N.; Matsuki, T.; Iwamoto, I.; Nishijo, T.; Noda, M.; Tabata, H.; Nakayama, A.; Nagata, K.I. Expression analyses of C-terminal-binding protein 1 (CtBP1) during mouse brain development. Dev. Neurosci. 2023, 46, 262–272. [Google Scholar] [CrossRef]
  50. Ivanova, D.; Dirks, A.; Montenegro-Venegas, C.; Schone, C.; Altrock, W.D.; Marini, C.; Frischknecht, R.; Schanze, D.; Zenker, M.; Gundelfinger, E.D.; et al. Synaptic activity controls localization and function of CtBP1 via binding to Bassoon and Piccolo. EMBO J. 2015, 34, 1056–1077. [Google Scholar] [CrossRef]
  51. Ivanova, D.; Imig, C.; Camacho, M.; Reinhold, A.; Guhathakurta, D.; Montenegro-Venegas, C.; Cousin, M.A.; Gundelfinger, E.D.; Rosenmund, C.; Cooper, B.; et al. CtBP1-Mediated Membrane Fission Contributes to Effective Recycling of Synaptic Vesicles. Cell Rep. 2020, 30, 2444–2459.e7. [Google Scholar] [CrossRef]
  52. Jacobi, H.; Faber, J.; Timmann, D.; Klockgether, T. Update cerebellum and cognition. J. Neurol. 2021, 268, 3921–3925. [Google Scholar] [CrossRef]
  53. Yuan, Q.; Li, H.; Du, B.; Dang, Q.; Chang, Q.; Zhang, Z.; Zhang, M.; Ding, G.; Lu, C.; Guo, T. The cerebellum and cognition: Further evidence for its role in language control. Cereb. Cortex 2022, 33, 35–49. [Google Scholar] [CrossRef]
Figure 1. ABC atlas showing superclusters. Data are from Allen Brain Cell Atlas, Transcriptomic Diversity of Cell Types in Adult Human Brain, https://knowledge.brain-map.org/abcatlas (accessed on 23 December 2024) [22,23,24]. (A) ABC brain atlas showing 31 superclusters. (B) Distribution of cells expressing CTBP1. (C) Distribution of cells highly expressing CTBP1 (Log2 (CPM + 1) > 7.8). Cells in URL express highest levels of CTBP1 and are marked with an arrow.
Biologics 05 00014 g001
Figure 2. (A) The percentage of cells expressing genes in the URL subdivided into anatomical regions is shown in the graph. Anatomical regions expressing cells one percent and above, which includes the midbrain, cerebellum, pons, and spinal cord, are represented in the graph. Data are from Allen Brain Cell Atlas, Transcriptomic Diversity of Cell Types in Adult Human Brain, https://knowledge.brain-map.org/abcatlas (accessed on 23 December 2024) [22,24]. (B) CtBP1-interacting proteins from the STRING database. The network nodes represent proteins, and the edges represent predicted functional associations. An edge was drawn with different colored lines, and these lines represent the expected existing associations. A green line represents neighborhood evidence; a blue line represents co-occurrence evidence; a pink line represents experimental evidence; a light green line represents text mining evidence; and a black line represents co-expression evidence [25].
Biologics 05 00014 g002
Table 1. Number of cells expressing genes in thirteen anatomical regions from the supercluster URL. Data are from Allen Brain Cell Atlas, Transcriptomic Diversity of Cell Types in Adult Human Brain, https://knowledge.brain-map.org/abcatlas (accessed on 23 December 2024) [22,24].
Number of Cells Expressing Genes
Anatomical RegionCTBP1CTBP2RCOR1HDAC1HDAC2ZEB1RBBB8KDM1AZNF217MECOMKLF3
Cerebral Cortex10209013521217006
Hippocampus171011014000
Amygdaloid Complex56203514001
Extended Amygdala01000000000
Basal Nuclei18682001861425003
Claustrum00000000000
Basal Forebrain22101100001
Thalamus19511501858528006
Hypothalamus216830020767420014
Midbrain16104000127046147044904931810421476
Cerebellum205,00048,60016,50062318,10049,000704021,7001125876250
Pons342086503020164349094701140421027991110
Myelencephalon311083402950862970904012303720241091050
Spinal Cord1344031313138427591492442
Total Cells21,33570,21623,94992226,24272,690999231,7091698208959
Disclaimer/Publisher’s Note: The statements, opinions and data contained in all publications are solely those of the individual author(s) and contributor(s) and not of MDPI and/or the editor(s). MDPI and/or the editor(s) disclaim responsibility for any injury to people or property resulting from any ideas, methods, instructions or products referred to in the content.

