Article

The Relationship between Vitamin D and TyG Index in Prediabetes and Type 2 Diabetes Mellitus among an Indian Tribal Community: A Cross-Sectional Study

1
Department of Biochemistry, Dharanidhar Medical College and Hospital, Keonjhar 758002, India
2
Department of Medicine, Pandit Raghunath Murmu Medical College and Hospital, Baripada 757107, India
3
Department of Biochemistry, Shyam Shah Medical College, Rewa 486001, India
4
Department of Biomedical Sciences, Mercer University School of Medicine, Columbus, GA 31901, USA
5
Department of Pharmacology, Dharanidhar Medical College and Hospital, Keonjhar 758002, India
*
Author to whom correspondence should be addressed.
BioMed 2024, 4(4), 404-418; https://doi.org/10.3390/biomed4040032
Submission received: 11 July 2024 / Revised: 28 August 2024 / Accepted: 23 September 2024 / Published: 8 October 2024

Abstract

Background: Vitamin D deficiency is thought to increase the likelihood of insulin resistance (IR) and diabetes onset. The objective of this study was to examine the association between the triglyceride glucose (TyG) index and vitamin D levels in individuals with prediabetes and type 2 diabetes mellitus (T2DM) in the tribal community of India. Methods: This study included 270 participants, consisting of 90 individuals with prediabetes, 90 individuals with T2DM, and 90 control patients. Anthropometric and biochemical characteristics were evaluated in all participants. 25-hydroxyvitamin D [25(OH)D] levels were measured using a chemiluminescent immunoassay. The TyG index was computed as Ln [fasting triglycerides (mg/dL) × fasting glucose (mg/dL)]/2. Spearman correlation analysis and linear regression analysis were performed to assess the relationship between the TyG index and 25(OH)D levels in people diagnosed with prediabetes and T2DM. The optimum cut-off value of the TyG index for detecting vitamin D deficiency was determined by receiver operating characteristic (ROC) curve analysis. Results: We observed a significant reduction in vitamin D levels in individuals with prediabetes and T2DM compared to those in the control group. However, the TyG index was significantly greater in individuals with prediabetes and T2DM than in controls. Statistical analysis revealed a significant negative correlation between the TyG index and 25(OH)D in both prediabetes and T2DM. Conclusions: The TyG index demonstrated a negative association with vitamin D levels and was identified as an independent predictor of vitamin D deficiency in individuals with prediabetes and T2DM.

1. Introduction

Type 2 diabetes mellitus (T2DM) is a multifaceted disease influenced by a combination of genetic predisposition and environmental factors. It is characterized by disruptions in the metabolism of carbohydrates, proteins, and lipids due to reduced insulin production, increased insulin resistance, or a combination of both. This disturbance results in elevated blood sugar levels and persistent inflammation [1]. Prediabetes is a transitional phase that occurs between normal glucose tolerance (NGT) and T2DM and is regarded as a risk factor for the onset of T2DM [2]. The global prevalence of T2DM has been consistently rising over the last three decades, making it a major concern for public health. T2DM ranks as the ninth leading cause of death worldwide, responsible for over 1 million deaths annually [3]. In 2021, the global prevalence of T2DM was 10.5%, affecting approximately 536.6 million people. This figure is projected to rise to 12.2% by 2045, potentially impacting around 783.2 million individuals [4]. India has the second largest population of diabetic patients globally. In 2021, there were 74.9 million individuals with diabetes in the 20–79 age group, with this number expected to rise to 124.9 million by 2045 [4].
An essential seco-steroid hormone, vitamin D improves calcium absorption in the intestines, which in turn promotes healthy bones and muscles [5]. There are a number of non-skeletal cells that express vitamin D receptors, which raises the possibility that vitamin D has a wide range of extraskeletal effects. Diabetes is one of several medical issues that has been associated with vitamin D deficiency [6]. It has been proposed that vitamin D might have anti-diabetic properties via controlling the release or responsiveness of insulin, initiating anti-inflammatory reactions, and decreasing high parathyroid hormone levels, which can have a detrimental influence on insulin synthesis [7,8,9,10]. Additionally, vitamin D enhances insulin sensitivity by promoting insulin receptor expression and facilitating glucose transport [11]. Vitamin D can also improve insulin sensitivity by activating peroxisome proliferator-activated receptor delta (PPAR-δ), which regulates fatty acid metabolism in both adipose tissue and skeletal muscle [12]. Insulin resistance also affects lipid metabolism, leading to atherogenic dyslipidemia. By improving insulin sensitivity, vitamin D may indirectly improve lipid levels. Furthermore, through its anti-inflammatory effects, vitamin D might also influence lipid metabolism [13]. A recent review indicated that vitamin D supplementation in patients with T2DM significantly reduced inflammatory markers, which positively impacted the lipid profile [14]. Vitamin D has the potential to improve abnormalities in hepatic glucose and lipid metabolism both in vitro and in vivo by activating the Ca2+/CaMKKβ/AMPK signaling pathway [12]. Therefore, a deficiency in vitamin D may lead to reduced insulin secretion and increased insulin resistance, ultimately contributing to the development of diabetes.
Insulin resistance, a crucial physiological condition that plays a significant role in the progression of type 2 diabetes, can appear prior to the onset of elevated glucose levels and impaired glucose regulation [15,16]. The hyperinsulinemic–euglycemic clamp is widely regarded as the gold standard for assessing insulin resistance. However, its application in clinical settings is limited by its high cost and complexity, making it impractical for routine use [17]. HOMA-IR (Homeostasis Model Assessment of Insulin Resistance) is frequently used as an alternative measure for evaluating insulin resistance. However, people with defective β cells or those undergoing insulin therapy may find its use limited [18]. Additionally, the infrequent measurement of circulating insulin levels reduces the practicality and effectiveness of using HOMA-IR as an indicator of insulin resistance [17]. The triglyceride glucose (TyG) index is a simple, readily available, and dependable clinical indicator of IR [19,20], and it is more effective than the HOMA-IR [21]. A growing body of research has shown a connection between the TyG index and the onset of newly diagnosed T2DM [22,23]. In addition, it has also been linked to cardiovascular outcomes [24] and diabetic complications [25] in individuals diagnosed with diabetes.
Previous studies conducted in China have identified an inverse relationship between vitamin D levels and the TyG index in individuals with T2DM. These findings indicate that a higher TyG index is associated with an increased likelihood of vitamin D deficiency [26,27]. However, to the best of our knowledge, there is a scarcity of studies investigating the potential association between the TyG index and vitamin D levels in individuals diagnosed with prediabetes and T2DM in general, and particularly within the tribal populations of Odisha, India. Therefore, the objective of this cross-sectional study is to explore the relationship between the TyG index and vitamin D levels in newly diagnosed cases of prediabetes and T2DM within this specific tribal population. The findings of this study could have important clinical implications for the management of prediabetes and T2DM in tribal communities. If the TyG index is found to be a reliable biomarker for vitamin D deficiency, it could be used to identify individuals at risk, allowing for earlier interventions such as vitamin D supplementation and lifestyle modifications. This could be particularly valuable in tribal communities where the burden of metabolic disorders is high and healthcare resources are limited.

2. Materials and Methods

2.1. Study Design

This comparative prospective cross-sectional study was carried out from August 2022 to July 2023 and involved 270 participants aged 30–60 years. Among them, 90 had T2DM, 90 had prediabetes, and 90 were healthy controls who were matched in terms of age and sex. In this study, both T2DM and prediabetes were newly diagnosed, and none of the participants had received any prior medication for these conditions. The study was conducted in the Biochemistry and Medicine Departments of Pandit Raghunath Murmu Medical College and Hospital, Baripada, India. Patients with prediabetes and T2DM were recruited from the outpatient department of medicine at the same medical institution. Participants were selected randomly to minimize potential selection bias and ensure that the study population was representative of the broader patient population attending the hospital. The diagnosis was made using the guidelines set out by the American Diabetes Association [28], taking into account the levels of fasting plasma glucose (FPG) and 2-h plasma glucose (2h-PG) during the oral glucose tolerance test (OGTT). The prediabetic patients had FPG values between 100–125 mg/dL and/or 2-hPG levels between 140–199 mg/dL, while the diabetic patients had FPG ≥ 126 mg/dL and/or 2h-PG ≥ 200 mg/dL during the OGTT. The control group consisted of individuals who were apparently healthy, had no previous history of T2DM or hypertension, and were not taking any drugs at the time when the samples were collected. In this study, participants who had prediabetes or T2DM were categorized into two groups according to their circulatory 25(OH)D levels. The two groups included a vitamin D deficiency group (<20 ng/mL) and a non-vitamin D deficiency group (≥20 ng/mL) [26,29].
Participants were excluded if they were undergoing diabetes treatment that could influence insulin secretion or glucose metabolism, including medication, dietary adjustments, or exercise therapy. Other exclusion criteria included type 1 diabetes, a history of endocrine, neurological, or renal disorders, pregnancy or lactation, use of vitamin D supplements in the past six months or drugs affecting calcium and vitamin D metabolism, and the use of antiepileptic or weight loss medications that might affect vitamin D absorption.
Prior to including participants in the study, we obtained written informed consent from each individual. The research adhered to the ethical guidelines set forth in the Declaration of Helsinki and received approval from the Institutional Ethics Committee at Pandit Raghunath Murmu Medical College and Hospital, Baripada (Reference no. 56/7th IEC meeting, dated 13 July 2022).

2.2. Anthropometric and Blood Pressure Measurements

A digital scale and stadiometer were used to measure the body weight and height of participants, respectively. Body mass index (BMI) was then calculated by dividing weight in kilograms by the square of height in meters. Waist circumference (WC) and hip circumference (HC) were measured using a non-stretchable measuring tape. WC was assessed at roughly the midpoint between the lower edge of the last palpable rib and the top of the iliac crest, while HC was measured at the level of the greater trochanter. To determine the waist-to-hip ratio (WHR), waist circumference (cm) was divided by hip circumference (cm). Blood pressure readings, including systolic (SBP) and diastolic (DBP), were taken with a standardized mercury sphygmomanometer following generally accepted practices.

2.3. Biochemical Analysis

Blood samples were drawn from the antecubital vein following a 10–12 h fasting period and placed into three distinct vacutainers containing sodium fluoride, K2-EDTA, and a clot activator. Sodium fluoride-containing vacutainers were used for blood glucose determination; K2-EDTA-containing vacutainers were used for HbA1c determination; and clot activator-containing vacutainers were used for lipid profile determination and vitamin D determination. Subsequently, 75 g of glucose dissolved in water was given orally to each participant, and blood samples were collected again in a fluoride vial after 2 h for 2h-PG determination. The collected blood samples were centrifuged at 3000 rpm for 10 min to separate the serum or plasma. All analyses were performed on the serum or plasma on the same day as the blood collection. Biochemical parameters, including glucose, total cholesterol, triglycerides, and HDL-C, were assessed using commercially available kits on EM 360, a fully automated clinical chemistry analyzer. Hemoglobin A1c (HbA1c) was measured in whole blood on STANDARD F2400, a fluorescence immunoassay. 25-hydroxyvitamin D [25(OH)D] levels were measured using a chemiluminescent immunoassay with a Cobas 6000 analyzer. LDL-cholesterol and very low-density lipoprotein (VLDL)-cholesterol concentrations were calculated based on the Friedewald equation [30]. The TyG index was computed as Ln [fasting triglycerides (mg/dL) × fasting glucose (mg/dL)]/2 [20,31].

2.4. Statistical Analysis

Data analysis was conducted using the Statistical Package for Social Science version 20 for Windows (IBM, SPSS Statistics 20, Armonk, NY, USA) and the DATAtab: Online Statistics Calculator. The distribution of data was assessed using the Kolmogorov–Smirnov test and Q-Q plots. Data that followed a normal distribution were presented as mean ± SD and analyzed using ANOVA to evaluate differences among the three groups. Subsequently, the Bonferroni post hoc test was applied for comparisons between each pair of groups. Non-parametric data are expressed as median (IQR), and comparisons involved the Kruskal–Wallis test for the three groups and the Dunn–Bonferroni test for each pair of groups. For continuous variables between two groups, either the Mann–Whitney U test or independent samples t-test was performed to determine differences. Categorical data were compared using a chi-square test. To explore the relationship between 25(OH)D and other variables, Spearman correlation analysis was utilized. Linear regression analysis was employed to investigate the association between 25(OH)D and the TyG index. Different models (Models 1, 2, and 3) were adjusted to account for distinct confounding factors. Box-Cox transformation was performed for nonnormally distributed data before conducting linear regression analysis to improve the relationships’ linearity and residuals’ normality. The variance inflation factor (VIF) was employed in the linear regression models to assess the presence of multicollinearity among the independent variables. A variable with a VIF ≥ 3 was deemed to exhibit collinearity and was therefore eliminated from the model. Receiver operating characteristic (ROC) curve analysis was performed to evaluate the effectiveness of the TyG index in identifying vitamin D deficiency (<20 ng/mL) in individuals with prediabetes and T2DM. Results were considered statistically significant if the p-value was less than 0.05.

3. Results

The demographic profile, routine biochemical parameters, TyG index, and 25(OH)D status of the subjects under study are depicted in Table 1. The age and sex distributions across the three groups showed no statistically significant differences, suggesting that the participants in the study were matched in terms of age and sex. Both individuals with prediabetes and those with T2DM had significantly greater BMI and WHR than those in the control group. Nevertheless, no significant differences in BMI or WHR were detected between the prediabetes and T2DM groups. The levels of FPG, 2h-PG, HbA1c, serum TC, TG, LDL-C, and VLDL-C were greater, while the serum levels of HDL-C were significantly lower in individuals with prediabetes and those with T2DM than in healthy control subjects. The TyG index was higher in subjects with prediabetes and in those with T2DM than in healthy controls. Moreover, T2DM patients exhibited a significantly elevated TyG index in comparison to individuals with prediabetes. Conversely, people with prediabetes and those with T2DM had notably lower levels of serum 25(OH)D compared to healthy controls. Furthermore, those with T2DM had lower vitamin D levels than those with prediabetes, although this difference did not reach statistical significance.
Table 2 displays the anthropometric indices and biochemical characteristics of participants with prediabetes and T2DM, categorized based on their 25(OH)D levels. In prediabetes patients, compared to non-vitamin D-deficient participants, vitamin D-deficient participants had significantly increased FPG, 2h-PG, TC, TG, LDL-C, VLDL-C, and TyG index. Similarly, in T2DM patients, vitamin D-deficient subjects had significantly greater FPG, HbA1c, TC, TG, LDL-C, VLDL-C, and TyG index than non-vitamin D-deficient subjects. The vitamin D-deficient participants exhibited significantly decreased levels of HDL-C compared to non-vitamin D-deficient participants in both prediabetes and T2DM patients.
As depicted in Table 3, 25(OH)D exhibited a significant negative correlation with BMI, WHR, SBP, FPG, 2h-PG, HbA1c, TC, TG, LDL-C, VLDL-C, and the TyG index in individuals with prediabetes. Similarly, among patients with T2DM, 25(OH)D was significantly negatively correlated with BMI, WHR, SBP, FPG, 2h-PG, HbA1c, TG, VLDL-C, and the TyG index. Although TC and LDL-C showed a negative correlation with 25(OH)D in T2DM patients, the correlation did not reach statistical significance. In both prediabetes and T2DM patients, 25(OH)D showed a significant positive correlation with HDL-C. In contrast, no correlation was found between 25(OH)D and the studied parameters in the control group.
As presented in Table 4, the TyG index was negatively associated with 25(OH)D in Model 1 (unadjusted) (p < 0.001), Model 2 (adjusted for age, sex, BMI, WHR, SBP, and DBP) (p < 0.001), and Model 3 (adjusted for Model 2 covariates plus 2h-PG, HbA1c, TC, and HDL-C) (p = 0.002) in participants with prediabetes. Similarly, in individuals with T2DM, as illustrated in Table 5, the TyG index was negatively associated with 25(OH)D in Model 1 (unadjusted) (p < 0.001), Model 2 (adjusted for age, sex, BMI, WHR, SBP, and DBP) (p < 0.001), and Model 3 (adjusted for Model 2 covariates plus 2h-PG, HbA1c, TC, and HDL-C) (p = 0.002).
Figure 1 and Figure 2 show the ROC curve analyses for the TyG index in individuals with prediabetes and those with T2DM, respectively. The findings suggest that the TyG index can effectively predict vitamin D deficiency (<20 ng/mL) in individuals with prediabetes, with a sensitivity of 89.3% and specificity of 85.3% (AUC = 0.841; 95% CI = 0.739–0.943; Youden index = 0.75; p < 0.001). Similarly, in patients with T2DM, the TyG index demonstrated a predictive ability for identifying vitamin D deficiency (<20 ng/mL), exhibiting a sensitivity of 98.5% and specificity of 36%. (AUC = 0.701; 95% CI = 0.576–0.826; Youden index = 0.34; p = 0.003). The optimal cut-off value for the TyG index was established based on the point where the Youden index reached its maximum. The optimal cut-off values for the TyG index for detecting vitamin D deficiency in individuals with prediabetes and those with T2DM were determined to be 4.89 and 5.09, respectively.

4. Discussion

In the present prospective cross-sectional study, which was conducted on the tribal population of India, three key findings emerged. First, people with prediabetes and T2DM had significantly lower vitamin D levels compared to controls. Second, the TyG index was notably higher in the prediabetes and T2DM groups compared to the control group. Third, in both prediabetes and T2DM patients, a significant negative association was observed between the vitamin D levels and TyG index.
Although India receives ample sunlight, a considerable section of the population nevertheless suffers from vitamin D deficiency. Research has shown that the prevalence of vitamin D deficiency varies from 40% to 90%, with the majority of studies indicating rates between 80% and 90%. This deficiency affects people of all ages and demographics, including those at higher risk [32]. The factors closely linked with vitamin D deficiency include age, gender, geographical location, altitude, attire, sunscreen application, as well as certain medical conditions such as diabetes, cancer, anemia, hepatitis, fracture, thyroiditis, systemic lupus erythematosus, metabolic illnesses, fatty liver disease, dermatitis, and osteopenia [33,34]. In this study, vitamin D deficiency was reported in 43.33%, 62.22%, and 72.22% of healthy control subjects, individuals with prediabetes, and individuals with T2DM, respectively. According to an Indian study, 40% of people in the control group and 70% of people with T2DM had low 25(OH)D levels [35]. In line with our research, a study carried out in Iran similarly found that 71% of persons with T2DM had a vitamin D insufficiency, whereas the deficiency rate in the control group was reported to be 40% [36].
In humans, the principal source of vitamin D is the conversion of 7-dehydrocholesterol in the epidermis, which happens as a result of exposure to UV radiations. Vitamin D is widely recognized for its crucial role in regulating calcium balance and enhancing bone health in the human body. The growing focus on vitamin D in recent years has uncovered numerous diseases associated with its metabolic abnormalities. These include metabolic bone disorders, kidney issues, cardiovascular diseases, skin diseases like psoriasis and acne, autoimmune diseases such as multiple sclerosis, type 1 diabetes, inflammatory bowel disease, lupus erythematosus, and rheumatoid arthritis, as well as cancer, infectious diseases, and hypercalcemia [37]. Research has shown that there is an inverse association between reduced concentrations of serum 25(OH)D and the prevalence of T2DM [38,39,40]. There is evidence from both in vivo and in vitro research suggesting that vitamin D levels may impact the likelihood of developing T2DM. This is because vitamin D has been found to potentially affect pancreatic β-cell activity and insulin sensitivity, both of which are important factors in T2DM [41,42].
In this study, we found that both people with prediabetes and those with T2DM had lower levels of vitamin D than those in the control group. Moreover, individuals with T2DM had lower vitamin D levels compared to those with prediabetes, but this difference did not reach statistical significance. The findings of our study align with the findings of Fondjo et al. [43] and Salih et al. [36], who likewise reported lower vitamin D levels in individuals with T2DM than in individuals in the control group. Consistent with our findings, Srinath et al. [44] observed decreased vitamin D levels in prediabetes when compared to the control group. A meta-analysis conducted in 2020 provided evidence indicating a link between lower circulating 25(OH)D levels and an increased risk of prediabetes [45]. Furthermore, vitamin D administration enhances impaired glucose tolerance in persons with prediabetes. An independent meta-analysis of eight randomized controlled trials in prediabetic individuals showed that vitamin D treatment lowered the risk of progressing to new-onset T2DM. Similarly, a meta-analysis demonstrated that the administration of vitamin D could increase the likelihood of prediabetes returning to a normal state [46]. Moreover, an additional meta-analysis, which included data from three randomized clinical trials, demonstrated that vitamin D effectively decreases the likelihood of diabetes development in individuals with prediabetes [38]. An umbrella meta-analysis has shown that supplementation of vitamin D has a beneficial impact on fasting blood sugar, HOMA-IR, glycated hemoglobin, and insulin levels, leading to a reduction in these parameters [47]. There are two primary mechanisms that may elucidate how vitamin D supplementation decreases the likelihood of developing T2DM. Firstly, vitamin D plays a crucial role in regulating insulin production and release. The pancreatic islet cells possess all the components of the vitamin D endocrine system, such as the vitamin D receptor, 1α-hydroxylase, and vitamin D-binding protein [46]. Preclinical studies in animals have shown that insufficient vitamin D levels are linked to a reduction in the synthesis and secretion of insulin [48]. Conversely, supplementation with vitamin D has been reported to enhance insulin secretion [49]. Additionally, vitamin D modulates the local renin–angiotensin system in pancreatic islets, enhancing the capacity of β-cells to produce insulin [50]. Second, vitamin D has the potential to mitigate insulin resistance in peripheral insulin target cells through several mechanisms. These include the existence of vitamin D receptors in hepatocytes, muscle, and adipocytes; additionally, they include enhanced insulin receptor expression and responsiveness to insulin for the transportation of glucose [46]. Furthermore, researchers have identified several indirect mechanisms linking vitamin D to insulin sensitivity. Evidence suggests that vitamin D improves the body’s insulin response by regulating calcium levels and facilitating the transport of calcium into cells [51]. Vitamin D elevates the level of calcium inside the cell, leading to the movement of GLUT-4 to the outer membrane of the cell. Consequently, this results in an increase in cellular glucose absorption [52]. A study conducted in 2017 found that a lack of vitamin D causes an increase in insulin resistance by triggering oxidative stress in liver cells [53]. Studies suggest that when the activity of 1,25(OH)2D3 is inhibited in L02 hepatocytes, it causes a decrease in vitamin D levels, which subsequently leads to a substantial increase in reactive oxygen species (ROS) production in the liver. This process contributes to the development of insulin resistance in peripheral tissues [53,54]. The exact mechanism connecting vitamin D and insulin resistance is still uncertain, despite various hypotheses and molecular pathways. Therefore, it is crucial to thoroughly examine the impact of vitamin D on the development of IR, T2DM, and the regulation of glucose levels.
Insulin resistance is the primary causative factor responsible for disorders related to glucose metabolism and is widely acknowledged as a fundamental component of metabolic syndrome [55]. The TyG index is a novel approach for assessing insulin resistance, derived by multiplying fasting triglyceride and glucose levels [20]. It is considered a more economical alternative to HOMA-IR and has shown better predictive ability for the onset of metabolic and cardiovascular disorders [21,56,57]. Our study revealed that individuals with both T2DM and prediabetes had a higher TyG index relative to the control group. Furthermore, there was a statistically significant difference in the TyG index between patients diagnosed with prediabetes and those diagnosed with T2DM. Consistent with our findings, Chen et al. reported that the TyG index was higher in individuals with impaired glucose tolerance (IGT) and diabetes mellitus (DM) compared to those with normal glucose tolerance (NGT). Moreover, as the TyG index increased, the risk of developing prediabetes and diabetes also rose significantly [58]. The TyG index is acknowledged as a potential marker for prediabetes and T2DM and is considered a reliable measure for assessing long-term glycemic control in persons with T2DM [59,60,61]. Recent research has demonstrated a positive association between TyG index levels and the occurrence of diabetic retinopathy and diabetic nephropathy [62,63,64]. In this study, the TyG index and vitamin D levels were found to be significantly inversely correlated in individuals with both prediabetes and type 2 diabetes. Our study’s results are consistent with those of Jia et al. [27] and Xiang et al. [26], who also found a negative correlation between the TyG index and vitamin D levels in T2DM. A recent study reported a significant decrease in 25(OH)D levels with increasing TyG index values among elderly diabetic patients. Furthermore, the study identified a negative correlation between the TyG index and 25(OH)D levels [65]. Similar results were reported in individuals with metabolic-associated fatty liver disease [66] and subclinical hypothyroidism [67]. Additionally, in our study, we divided patients with prediabetes and T2DM into groups based on vitamin D status: deficiency and non-deficiency. We found that the TyG index was significantly higher in the vitamin D deficiency group compared to the non-deficiency group for both prediabetic and T2DM patients. This finding is consistent with the results of Jia et al. [27] and Xiang et al. [26], who also reported a higher TyG index in individuals with vitamin D deficiency compared to those without. Even after controlling for confounding variables, the regression analysis still showed a negative and independent connection between vitamin D and the TyG index. Similar findings were reported by Jia et al. [27] in patients with T2DM.
In this study, we employed receiver operating characteristic (ROC) curve analysis to identify the optimal TyG index cut-off for detecting vitamin D deficiency. The optimal TyG index cut-off value for detecting vitamin D deficiency in individuals with prediabetes was identified as 4.89, with a sensitivity of 89.3% and a specificity of 85.3%. For those with T2DM, the ideal TyG index cut-off value for diagnosing vitamin D deficiency was found to be 5.09, showing a sensitivity of 98.5% but a lower specificity of 36%. A possible explanation for the lower specificity of the TyG index in T2DM compared to prediabetes could be that as T2DM progresses, complex metabolic disturbances occur, which may reduce the utility of the TyG index to accurately identify vitamin D deficiency. However, Xiang et al. [26] reported a different optimal TyG index cut-off for diagnosing vitamin D deficiency in T2DM patients, which was 9.03, with a sensitivity of 75.0% and specificity of 41.9%. This variation is attributed to Xiang et al. [26] using a different formula for computing the TyG index: Ln [fasting triglyceride (mg/dL) × fasting glucose (mg/dL)/2]. Subsequently, in response to the comments raised [68], Xiang et al. [69] employed the same formula that we used in our study for the calculation of the TyG index and reported the optimum cut-off value of the TyG index for diagnosing vitamin D deficiency in patients with T2DM to be 4.86, with the same sensitivity and specificity. The results of our study align closely with the findings reported by Xiang et al. [69]. Despite the lower specificity in T2DM, our findings suggest that the TyG index could still be a useful marker for identifying vitamin D deficiency, particularly in prediabetes. Nevertheless, the low specificity in T2DM is a limitation that warrants further investigation and consideration when interpreting the results.
Furthermore, our study uncovered an inverse relationship between vitamin D and lipid markers, except for HDL-C, which had a favorable connection with both prediabetes and T2DM. Research has indicated that reduced vitamin D levels are associated with atherogenic lipid profiles, which contribute to the development of atherosclerosis. Alternatively, taking vitamin D supplements can improve glycemic control and lower TC, TG, and LDL-C levels while boosting HDL-C levels [70,71]. Vitamin D primarily controls lipid metabolism by inhibiting the activation of sterol regulatory element-binding proteins (SREBPs). This process is achieved by triggering the breakdown of SREBP cleavage-activating protein (SCAP) through proteolytic processing and ubiquitin-mediated degradation. This process ultimately helps to maintain lipid homeostasis in the body [72]. In addition, we noticed an inverse relationship between vitamin D levels and both BMI and the WHR in individuals with both prediabetes and T2DM. The causality between vitamin D deficiency and obesity is a subject of debate. Scientists propose that an elevated BMI can result in reduced levels of vitamin D. This is because vitamin D, a fat-soluble hormone, is stored in adipose tissues, and only a limited amount is released into the bloodstream [73]. In addition, compared to non-obese individuals, obese persons produce lower amounts of enzymes that convert vitamin D into its active form through hydroxylation. Consequently, obese individuals produce relatively smaller amounts of active forms of vitamin D [25 (OH)D and 1,25 (OH)2D] [74].
Our study has a few limitations. First, the study is limited by its small sample size, which undermines the wider relevance and generalizability of the results. Second, it is important to note that this study specifically focused on the tribal population of India, which may limit the applicability of the findings to other groups. Third, the cross-sectional design of our study prevents us from determining a causal link between circulatory 25(OH)D levels and insulin resistance. Fourth, the specificity of the TyG index in T2DM was 36%, which is relatively low. This limitation should be considered when interpreting the results. Moreover, our study lacked data regarding dietary consumption, physical activity, skin color, and sunlight exposure, all of which are factors that can significantly influence vitamin D levels and insulin resistance. The absence of this information introduces potential confounding factors that could affect the observed relationships between the variables of interest. For example, individuals with higher physical activity or regular sunlight exposure might have higher vitamin D levels, which could alter the association observed in our study. Similarly, dietary intake of vitamin D-rich foods could play a role in modulating vitamin D status and related metabolic outcomes. In future studies, it would be beneficial to collect detailed data on these variables to control for their potential confounding effects. This could involve the use of standardized questionnaires to assess diet and physical activity, along with objective measures of sunlight exposure and skin pigmentation. By accounting for these factors, future studies could provide a clear understanding of the relationship between vitamin D and the TyG index.

5. Conclusions

In conclusion, there is an inverse relationship between the TyG index and vitamin D levels among people with prediabetes and those with T2DM. An elevated TyG index emerged as an independent predictor of vitamin D deficiency in individuals with these conditions. While the TyG index shows potential as a biomarker for identifying vitamin D deficiency, these findings should be interpreted with caution due to the study’s limitations, including its small sample size and specific population focus. To strengthen and validate these findings, future studies should be conducted with larger and more diverse populations, incorporating controlled study designs that account for potential confounding factors such as diet, physical activity, and sunlight exposure.

Author Contributions

Conceptualization, R.K.M.; methodology, all authors; formal analysis, R.K.M., P.K.R., M.A. and S.P.; investigation, R.K.M., P.K.R. and G.M.; data curation, R.K.M. and V.R.; writing—original draft, R.K.M. and V.R.; writing—review and editing, all authors; supervision, P.K.R. All authors have read and agreed to the published version of the manuscript.

Funding

This research did not receive any specific grant from funding agencies in the public, commercial, or not-for-profit sectors.

Institutional Review Board Statement

This study was approved by the Institutional Ethics Committee of Pandit Raghunath Murmu Medical College and Hospital, Baripada (Reference no. 56/7th IEC meeting, dated 13 July 2022).

Informed Consent Statement

All participants signed an informed consent letter.

Data Availability Statement

The datasets used and/or analyzed during the current study are available from the corresponding author on reasonable request.

Acknowledgments

The authors want to thank all the laboratory technicians of the central diagnostic laboratory of PRM Medical College and Hospital, Baripada.

Conflicts of Interest

The authors declare no conflicts of interest.

References

  1. DeFronzo, R.A.; Ferrannini, E.; Groop, L.; Henry, R.R.; Herman, W.H. Type 2 diabetes mellitus. Nat. Rev. Dis. Primers 2015, 1, 15019. [Google Scholar] [CrossRef] [PubMed]
  2. Grundy, S.M. Pre-diabetes, metabolic syndrome, and cardiovascular risk. J. Am. Coll. Cardiol. 2012, 59, 635–643. [Google Scholar] [CrossRef] [PubMed]
  3. Khan, M.A.B.; Hashim, M.J.; King, J.K.; Govender, R.D.; Mustafa, H.; Al Kaabi, J. Epidemiology of type 2 diabetes–global burden of disease and forecasted trends. J. Epidemiol. Glob. Health 2020, 10, 107–111. [Google Scholar] [CrossRef] [PubMed]
  4. Sun, H.; Saeedi, P.; Karuranga, S.; Pinkepank, M.; Ogurtsova, K.; Duncan, B.B.; Stein, C.; Basit, A.; Chan, J.C.; Mbanya, J.C.; et al. IDF Diabetes Atlas: Global, regional and country-level diabetes prevalence estimates for 2021 and projections for 2045. Diabetes Res. Clin. Pract. 2022, 183, 109119. [Google Scholar] [CrossRef] [PubMed]
  5. Laird, E.; Ward, M.; McSorley, E.; Strain, J.J.; Wallace, J. Vitamin D and bone health: Potential mechanisms. Nutrients 2010, 2, 693–724. [Google Scholar] [CrossRef]
  6. Rosen, C.J.; Abrams, S.A.; Aloia, J.F.; Brannon, P.M.; Clinton, S.K.; Durazo-Arvizu, R.A.; Gallagher, J.C.; Gallo, R.L.; Jones, G.; Kovacs, C.S.; et al. IOM committee members respond to Endocrine Society vitamin D guideline. J. Clin. Endocrinol. Metab. 2012, 97, 1146–1152. [Google Scholar] [CrossRef]
  7. Borissova, A.M.; Tankova, T.; Kirilov, G.; Dakovska, L.; Kovacheva, R. The effect of vitamin D3 on insulin secretion and peripheral insulin sensitivity in type 2 diabetic patients. Int. J. Clin. Pract. 2003, 57, 258–261. [Google Scholar] [CrossRef]
  8. Pitocco, D.; Crino, A.; Di Stasio, E.; Manfrini, S.; Guglielmi, C.; Spera, S.; Anguissola, G.B.; Visalli, N.; Suraci, C.; Matteoli, M.C.; et al. The effects of calcitriol and nicotinamide on residual pancreatic beta-cell function in patients with recent-onset Type 1 diabetes (IMDIAB XI). Diabet Med. 2006, 23, 920–923. [Google Scholar] [CrossRef]
  9. Mitri, J.; Pittas, A.G. Vitamin D and diabetes. Endocrinol. Metab. Clin. N. Am. 2014, 43, 205–232. [Google Scholar] [CrossRef]
  10. Fadda, G.Z.; Akmal, M.; Lipson, L.G.; Massry, S.G. Direct effect of parathyroid hormone on insulin secretion from pancreatic islets. Am. J. Physiol. 1990, 258, E975–E984. [Google Scholar] [CrossRef]
  11. Gao, Y.; Zheng, T.; Ran, X.; Ren, Y.; Chen, T.; Zhong, L.; Yan, D.; Yan, F.; Wu, Q.; Tian, H. Vitamin D and Incidence of Prediabetes or Type 2 Diabetes: A Four-Year Follow-Up Community-Based Study. Dis. Markers 2018, 2018, 1926308. [Google Scholar] [CrossRef] [PubMed]
  12. Leung, P.S. The potential protective action of vitamin D in hepatic insulin resistance and pancreatic islet dysfunction in type 2 diabetes mellitus. Nutrients 2016, 8, 147. [Google Scholar] [CrossRef] [PubMed]
  13. Al Refaie, A.; Baldassini, L.; Mondillo, C.; De Vita, M.; Giglio, E.; Tarquini, R.; Gonnelli, S.; Caffarelli, C. Vitamin D and Dyslipidemia: Is There Really a Link? A Narrative Review. Nutrients 2024, 16, 1144. [Google Scholar] [CrossRef] [PubMed]
  14. MacGiriley, R.; Phoswa, W.N.; Mokgalaboni, K. Modulatory Properties of Vitamin D in Type 2 Diabetic Patients: A Focus on Inflammation and Dyslipidemia. Nutrients 2023, 15, 4575. [Google Scholar] [CrossRef]
  15. Relimpio, F. The relative contributions of insulin resistance and beta-cell dysfunction to the pathophysiology of type 2 diabetes. Diabetologia 2003, 46, 1707. [Google Scholar] [CrossRef]
  16. Warram, J.H.; Martin, B.C.; Krolewski, A.S.; Soeldner, J.S.; Kahn, C.R. Slow glucose removal rate and hyperinsulinemia precede the development of type II diabetes in the offspring of diabetic parents. Ann. Intern. Med. 1990, 113, 909–915. [Google Scholar] [CrossRef]
  17. Cersosimo, E.; Solis-Herrera, C.; Trautmann, M.E.; Malloy, J.; Triplitt, C.L. Assessment of pancreatic β-cell function: Review of methods and clinical applications. Curr. Diabetes Rev. 2014, 10, 2–42. [Google Scholar] [CrossRef]
  18. Van Minh, H.; Tien, H.A.; Sinh, C.T.; Thang, D.C.; Chen, C.; Tay, J.C.; Siddique, S.; Wang, T.; Sogunuru, G.P.; Chia, Y.; et al. Assessment of preferred methods to measure insulin resistance in Asian patients with hypertension. J. Clin. Hypertens. 2021, 23, 529–537. [Google Scholar] [CrossRef]
  19. Guerrero-Romero, F.; Simental-Mendía, L.E.; GonzálEz-Ortiz, M.; MartínEz-Abundis, E.; Ramos-Zavala, M.G.; HernánDez-GonzálEz, S.O.; Jacques-Camarena, O.; RodrígUez-Morán, M. The product of triglycerides and glucose, a simple measure of insulin sensitivity. Comparison with the euglycemic-hyperinsulinemic clamp. J. Clin. Endocrinol. Metab. 2010, 95, 3347–3351. [Google Scholar] [CrossRef]
  20. Simental-Mendía, L.E.; Rodríguez-Morán, M.; Guerrero-Romero, F. The product of fasting glucose and triglycerides as surrogate for identifying insulin resistance in apparently healthy subjects. Metab. Syndr. Relat. Disord. 2008, 6, 299–304. [Google Scholar] [CrossRef]
  21. Vasques, A.C.J.; Novaes, F.S.; de Oliveira, M.D.S.; Souza, J.R.M.; Yamanaka, A.; Pareja, J.C.; Tambascia, M.A.; Saad, M.J.A.; Geloneze, B. TyG index performs better than HOMA in a Brazilian population: A hyperglycemic clamp validated study. Diabetes Res. Clin. Pract. 2011, 93, e98–e100. [Google Scholar] [CrossRef] [PubMed]
  22. Chen, C.-L.; Liu, L.; Lo, K.; Huang, J.-Y.; Yu, Y.-L.; Huang, Y.-Q.; Feng, Y.-Q. Association between triglyceride glucose index and risk of new-onset diabetes among Chinese adults: Findings from the China Health and Retirement Longitudinal Study. Front. Cardiovasc. Med. 2020, 7, 610322. [Google Scholar] [CrossRef] [PubMed]
  23. Zou, S.; Yang, C.; Shen, R.; Wei, X.; Gong, J.; Pan, Y.; Lv, Y.; Xu, Y. Association between the triglyceride-glucose index and the incidence of diabetes in people with different phenotypes of obesity: A retrospective study. Front. Endocrinol. 2021, 12, 784616. [Google Scholar] [CrossRef]
  24. Ma, X.; Dong, L.; Shao, Q.; Cheng, Y.; Lv, S.; Sun, Y.; Shen, H.; Wang, Z.; Zhou, Y.; Liu, X. Triglyceride glucose index for predicting cardiovascular outcomes after percutaneous coronary intervention in patients with type 2 diabetes mellitus and acute coronary syndrome. Cardiovasc. Diabetol. 2020, 19, 31. [Google Scholar] [CrossRef]
  25. Pan, Y.; Zhong, S.; Zhou, K.; Tian, Z.; Chen, F.; Liu, Z.; Geng, Z.; Li, S.; Huang, R.; Wang, H.; et al. Association between diabetes complications and the triglyceride-glucose index in hospitalized patients with type 2 diabetes. J. Diabetes Res. 2021, 2021, 8757996. [Google Scholar] [CrossRef] [PubMed]
  26. Xiang, Q.; Xu, H.; Zhan, J.; Lu, S.; Li, S.; Wang, Y.; Wang, Y.; He, J.; Ni, Y.; Li, L.; et al. Association between the triglyceride-glucose index and vitamin D status in type 2 diabetes mellitus. Nutrients 2023, 15, 639. [Google Scholar] [CrossRef]
  27. Jia, Y.; Song, T.; Li, Z.; Zhou, L.; Chen, S. The relationship between triglyceride glucose index and vitamin D in type 2 diabetes mellitus. Diabetes Metab. Syndr. Obes. 2022, 15, 511–525. [Google Scholar] [CrossRef] [PubMed]
  28. American Diabetes Association. 2. Classification and diagnosis of diabetes: Standards of medical care in diabetes-2018. Diabetes Care 2018, 41, S13–S27. [Google Scholar] [CrossRef]
  29. Zhen, D.; Liu, L.; Guan, C.; Zhao, N.; Tang, X. High prevalence of vitamin D deficiency among middle-aged and elderly individuals in northwestern China: Its relationship to osteoporosis and lifestyle factors. Bone 2015, 71, 1–6. [Google Scholar] [CrossRef]
  30. Friedewald, W.T.; Levy, R.I.; Fredrickson, D.S. Estimation of the concentration of low-density lipoprotein cholesterol in plasma, without use of the preparative ultracentrifuge. Clin. Chem. 1972, 18, 499–502. [Google Scholar] [CrossRef]
  31. Simental-Mendía, L.E.; Guerrero-Romero, F. The correct formula for the triglycerides and glucose index. Eur. J. Pediatr. 2020, 179, 1171. [Google Scholar] [CrossRef] [PubMed]
  32. Aparna, P.; Muthathal, S.; Nongkynrih, B.; Gupta, S.K. Vitamin D deficiency in India. J. Fam. Med. Prim. Care 2018, 7, 324–330. [Google Scholar]
  33. Jiang, Z.; Pu, R.; Li, N.; Chen, C.; Li, J.; Dai, W.; Wang, Y.; Hu, J.; Zhu, D.; Yu, Q.; et al. High prevalence of vitamin D deficiency in Asia: A systematic review and meta-analysis. Crit. Rev. Food Sci. Nutr. 2023, 63, 3602–3611. [Google Scholar] [CrossRef]
  34. Kennel, K.A.; Drake, M.T.; Hurley, D.L. Vitamin D deficiency in adults: When to test and how to treat. Mayo Clin. Proc. 2010, 85, 752–757, quiz 757–758. [Google Scholar] [CrossRef]
  35. Dhas, Y.; Banerjee, J.; Damle, G.; Mishra, N. Association of vitamin D deficiency with insulin resistance in middle-aged type 2 diabetics. Clin. Chim. Acta 2019, 492, 95–101. [Google Scholar] [CrossRef]
  36. Salih, Y.A.; Rasool, M.T.; Ahmed, I.H.; Mohammed, A.A. Impact of vitamin D level on glycemic control in diabetes mellitus type 2 in Duhok. Ann. Med. Surg. 2021, 64, 102208. [Google Scholar] [CrossRef]
  37. Plum, L.A.; DeLuca, H.F. Vitamin D, disease and therapeutic opportunities. Nat. Rev. Drug Discov. 2010, 9, 941–955. [Google Scholar] [CrossRef] [PubMed]
  38. Pittas, A.G.; Kawahara, T.; Jorde, R.; Dawson-Hughes, B.; Vickery, E.M.; Angellotti, E.; Nelson, J.; Trikalinos, T.A.; Balk, E.M. Vitamin D and risk for type 2 diabetes in people with prediabetes: A systematic review and meta-analysis of individual participant data from 3 randomized clinical trials. Ann. Intern. Med. 2023, 176, 355–363. [Google Scholar] [CrossRef]
  39. Tai, K.; Need, A.G.; Horowitz, M.; Chapman, I.M. Glucose tolerance and vitamin D: Effects of treating vitamin D deficiency. Nutrition 2008, 24, 950–956. [Google Scholar] [CrossRef]
  40. Kobza, V.M.; Fleet, J.C.; Zhou, J.; Conley, T.B.; Peacock, M.; IglayReger, H.B.; DePalma, G.; Campbell, W.W. Vitamin D status and resistance exercise training independently affect glucose tolerance in older adults. Nutr. Res. 2013, 33, 349–357. [Google Scholar] [CrossRef]
  41. Zeitz, U.; Weber, K.; Soegiarto, D.W.; Wolf, E.; Balling, R.; Erben, R.G. Impaired insulin secretory capacity in mice lacking a functional vitamin D receptor. FASEB J. 2003, 17, 509–511. [Google Scholar] [CrossRef] [PubMed]
  42. Kayaniyil, S.; Vieth, R.; Retnakaran, R.; Knight, J.A.; Qi, Y.; Gerstein, H.C.; Perkins, B.A.; Harris, S.B.; Zinman, B.; Hanley, A.J. Association of vitamin D with insulin resistance and beta-cell dysfunction in subjects at risk for type 2 diabetes. Diabetes Care 2010, 33, 1379–1381. [Google Scholar] [CrossRef]
  43. Fondjo, L.A.; Owiredu, W.K.B.A.; Sakyi, S.A.; Laing, E.F.; Adotey-Kwofie, M.A.; Antoh, E.O.; Detoh, E. Vitamin D status and its association with insulin resistance among type 2 diabetics: A case-control study in Ghana. PLoS ONE 2017, 12, e0175388. [Google Scholar] [CrossRef] [PubMed]
  44. Srinath, K.M.; Shashidhara, K.C.; Rajeev, R.; Madhu, B.; Kishaloy, D.; Mahesh, M.G. Pattern of vitamin D status in prediabetic individuals: A case-control study at tertiary hospital in South India. Int. J. Res. Med. Sci. 2016, 4, 1010–1015. [Google Scholar]
  45. Yu, L.; Zhai, Y.; Shen, S. Association between vitamin D and prediabetes: A PRISMA-compliant meta-analysis. Medicine 2020, 99, e19034. [Google Scholar] [CrossRef]
  46. Zhang, Y.; Tan, H.; Tang, J.; Li, J.; Chong, W.; Hai, Y.; Feng, Y.; Lunsford, L.D.; Xu, P.; Jia, D.; et al. Effects of vitamin D supplementation on prevention of type 2 diabetes in patients with prediabetes: A systematic review and meta-analysis. Diabetes Care 2020, 43, 1650–1658. [Google Scholar] [CrossRef]
  47. Musazadeh, V.; Kavyani, Z.; Mirhosseini, N.; Dehghan, P.; Vajdi, M. Effect of vitamin D supplementation on type 2 diabetes biomarkers: An umbrella of interventional meta-analyses. Diabetol. Metab. Syndr. 2023, 15, 76. [Google Scholar] [CrossRef]
  48. Norman, A.W.; Frankel, J.B.; Heldt, A.M.; Grodsky, G.M. Vitamin D deficiency inhibits pancreatic secretion of insulin. Science 1980, 209, 823–825. [Google Scholar] [CrossRef]
  49. Cade, C.; Norman, A.W. Vitamin D3 improves impaired glucose tolerance and insulin secretion in the vitamin D-deficient rat in vivo. Endocrinology 1986, 119, 84–90. [Google Scholar] [CrossRef]
  50. Cheng, Q.; Li, Y.C.; Boucher, B.J.; Leung, P.S. A novel role for vitamin D: Modulation of expression and function of the local renin-angiotensin system in mouse pancreatic islets. Diabetologia 2011, 54, 2077–2081. [Google Scholar] [CrossRef]
  51. Pittas, A.G.; Lau, J.; Hu, F.B.; Dawson-Hughes, B. The role of vitamin D and calcium in type 2 diabetes: A systematic review and meta-analysis. J. Clin. Endocrinol. Metab. 2007, 92, 2017–2029. [Google Scholar] [CrossRef] [PubMed]
  52. Wright, D.C.; Hucker, K.A.; Holloszy, J.O.; Han, D.H. Ca2+ and AMPK both mediate stimulation of glucose transport by muscle contractions. Diabetes 2004, 53, 330–335. [Google Scholar] [CrossRef] [PubMed]
  53. Tao, S.; Yuan, Q.; Mao, L.; Chen, F.L.; Ji, F.; Cui, Z.H. Vitamin D deficiency causes insulin resistance by provoking oxidative stress in hepatocytes. Oncotarget 2017, 8, 67605–67613. [Google Scholar] [CrossRef] [PubMed]
  54. Hurrle, S.; Hsu, W.H. The etiology of oxidative stress in insulin resistance. Biomed J. 2017, 40, 257–262. [Google Scholar] [CrossRef]
  55. Roberts, C.K.; Hevener, A.L.; Barnard, R.J. Metabolic syndrome and insulin resistance: Underlying causes and modification by exercise training. Compr. Physiol. 2013, 3, 1–58. [Google Scholar]
  56. Barzegar, N.; Tohidi, M.; Hasheminia, M.; Azizi, F.; Hadaegh, F. The impact of triglyceride-glucose index on incident cardiovascular events during 16 years of follow-up: Tehran Lipid and Glucose Study. Cardiovasc. Diabetol. 2020, 19, 155. [Google Scholar] [CrossRef]
  57. Lee, S.-H.; Kwon, H.-S.; Park, Y.-M.; Ha, H.-S.; Jeong, S.H.; Yang, H.K.; Lee, J.-H.; Yim, H.-W.; Kang, M.-I.; Lee, W.-C.; et al. Predicting the development of diabetes using the product of triglycerides and glucose: The Chungju Metabolic Disease Cohort (CMC) study. PLoS ONE 2014, 9, e90430. [Google Scholar] [CrossRef]
  58. Chen, Z.; Wen, J. Elevated Triglyceride-Glucose (TyG) Index Predicts Impaired Islet β-Cell Function: A Hospital-Based Cross-Sectional Study. Front. Endocrinol. 2022, 13, 973655. [Google Scholar] [CrossRef]
  59. Low, S.; Khoo, K.C.J.; Irwan, B.; Sum, C.F.; Subramaniam, T.; Lim, S.C.; Wong, T.K.M. The role of triglyceride glucose index in development of Type 2 diabetes mellitus. Diabetes Res. Clin. Pract. 2018, 143, 43–49. [Google Scholar] [CrossRef]
  60. Hameed, E.K. TyG index: A promising biomarker for glycemic control in type 2 diabetes mellitus. Diabetes Metab. Syndr. 2019, 13, 560–563. [Google Scholar] [CrossRef]
  61. Wen, J.; Wang, A.; Liu, G.; Wang, M.; Zuo, Y.; Li, W.; Zhai, Q.; Mu, Y.; Gaisano, H.Y.; He, Y.; et al. Elevated triglyceride-glucose (TyG) index predicts incidence of prediabetes: A prospective cohort study in China. Lipids Health Dis. 2020, 19, 226. [Google Scholar] [CrossRef] [PubMed]
  62. Yao, L.; Wang, X.; Zhong, Y.; Wang, Y.; Wu, J.; Geng, J.; Zhou, Y.; Chen, J.; Guan, P.; Xu, Y.; et al. The Triglyceride-Glucose Index is associated with diabetic retinopathy in Chinese patients with type 2 diabetes: A hospital-based, nested, case-control study. Diabetes Metab. Syndr. Obes. 2021, 14, 1547–1555. [Google Scholar] [CrossRef]
  63. Liu, L.; Xia, R.; Song, X.; Zhang, B.; He, W.; Zhou, X.; Li, S.; Yuan, G. Association between the triglyceride-glucose index and diabetic nephropathy in patients with type 2 diabetes: A cross-sectional study. J. Diabetes Investig. 2021, 12, 557–565. [Google Scholar] [CrossRef]
  64. Zhou, J.; Zhu, L.; Li, Y. Association between the triglyceride glucose index and diabetic retinopathy in type 2 diabetes: A meta-analysis. Front. Endocrinol. 2023, 14, 1302127. [Google Scholar] [CrossRef]
  65. Xiang, Q.; Xu, H.; Liu, Y.; Huang, W. Elevated TyG Index Is Associated with Increased Risk of Vitamin D Deficiency among Elderly Patients with Type 2 Diabetes. Sci. Rep. 2024, 14, 16098. [Google Scholar] [CrossRef]
  66. Liu, Z.; Zhang, W.; Zhao, Z.; Li, W.; Zhang, J. The Triglyceride-Glucose Index is associated with vitamin D status in metabolic-associated fatty liver disease. Diabetes Metab. Syndr. Obes. 2023, 16, 2651–2660. [Google Scholar] [CrossRef] [PubMed]
  67. Mahat, R.K.; Panda, G.; Nayak, B.P.; Panda, S. Association of Vitamin D with Triglyceride-Glucose Index and Cardiometabolic Risk Factors in Subclinical Hypothyroidism. Hum. Nutr. Metab. 2023, 34, 200226. [Google Scholar] [CrossRef]
  68. Mahat, R.K.; Rathore, V. Comment on Xiang et al. Association between the Triglyceride-Glucose Index and Vitamin D Status in Type 2 Diabetes Mellitus. Nutrients 2023, 15, 4068. [Google Scholar] [CrossRef]
  69. Xiang, Q.; Xu, H.; Zhan, J.; Lu, S.; Li, S.; Wang, Y.; Wang, Y.; He, J.; Ni, Y.; Li, L.; et al. Reply to Mahat, R.K.; Rathore, V. Comment on “Xiang et al. Association between the Triglyceride-Glucose Index and Vitamin D Status in Type 2 Diabetes Mellitus”. Nutrients 2023, 15, 4069. [Google Scholar] [CrossRef]
  70. Mohamad, M.I.; El-Sherbeny, E.E.; Bekhet, M.M. The Effect of Vitamin D Supplementation on Glycemic Control and Lipid Profile in Patients with Type 2 Diabetes Mellitus. J. Am. Coll. Nutr. 2016, 35, 399–404. [Google Scholar] [CrossRef]
  71. Surdu, A.M.; Pînzariu, O.; Ciobanu, D.-M.; Negru, A.-G.; Căinap, S.-S.; Lazea, C.; Iacob, D.; Săraci, G.; Tirinescu, D.; Borda, I.M.; et al. Vitamin D and Its Role in the Lipid Metabolism and the Development of Atherosclerosis. Biomedicines 2021, 9, 172. [Google Scholar] [CrossRef] [PubMed]
  72. Asano, L.; Watanabe, M.; Ryoden, Y.; Usuda, K.; Yamaguchi, T.; Khambu, B.; Takashima, M.; Sato, S.-I.; Sakai, J.; Nagasawa, K.; et al. Vitamin D Metabolite, 25-Hydroxyvitamin D, Regulates Lipid Metabolism by Inducing Degradation of SREBP/SCAP. Cell Chem. Biol. 2017, 24, 207–217. [Google Scholar] [CrossRef] [PubMed]
  73. Rafiq, S.; Jeppesen, P.B. Is Hypovitaminosis D Related to Incidence of Type 2 Diabetes and High Fasting Glucose Level in Healthy Subjects: A Systematic Review and Meta-Analysis of Observational Studies. Nutrients 2018, 10, 59. [Google Scholar] [CrossRef] [PubMed]
  74. Wamberg, L.; Christiansen, T.; Paulsen, S.K.; Fisker, S.; Rask, P.; Rejnmark, L.; Richelsen, B.; Pedersen, S.B. Expression of vitamin D-metabolizing enzymes in human adipose tissue—The effect of obesity and diet-induced weight loss. Int. J. Obes. 2013, 37, 651–657. [Google Scholar] [CrossRef]
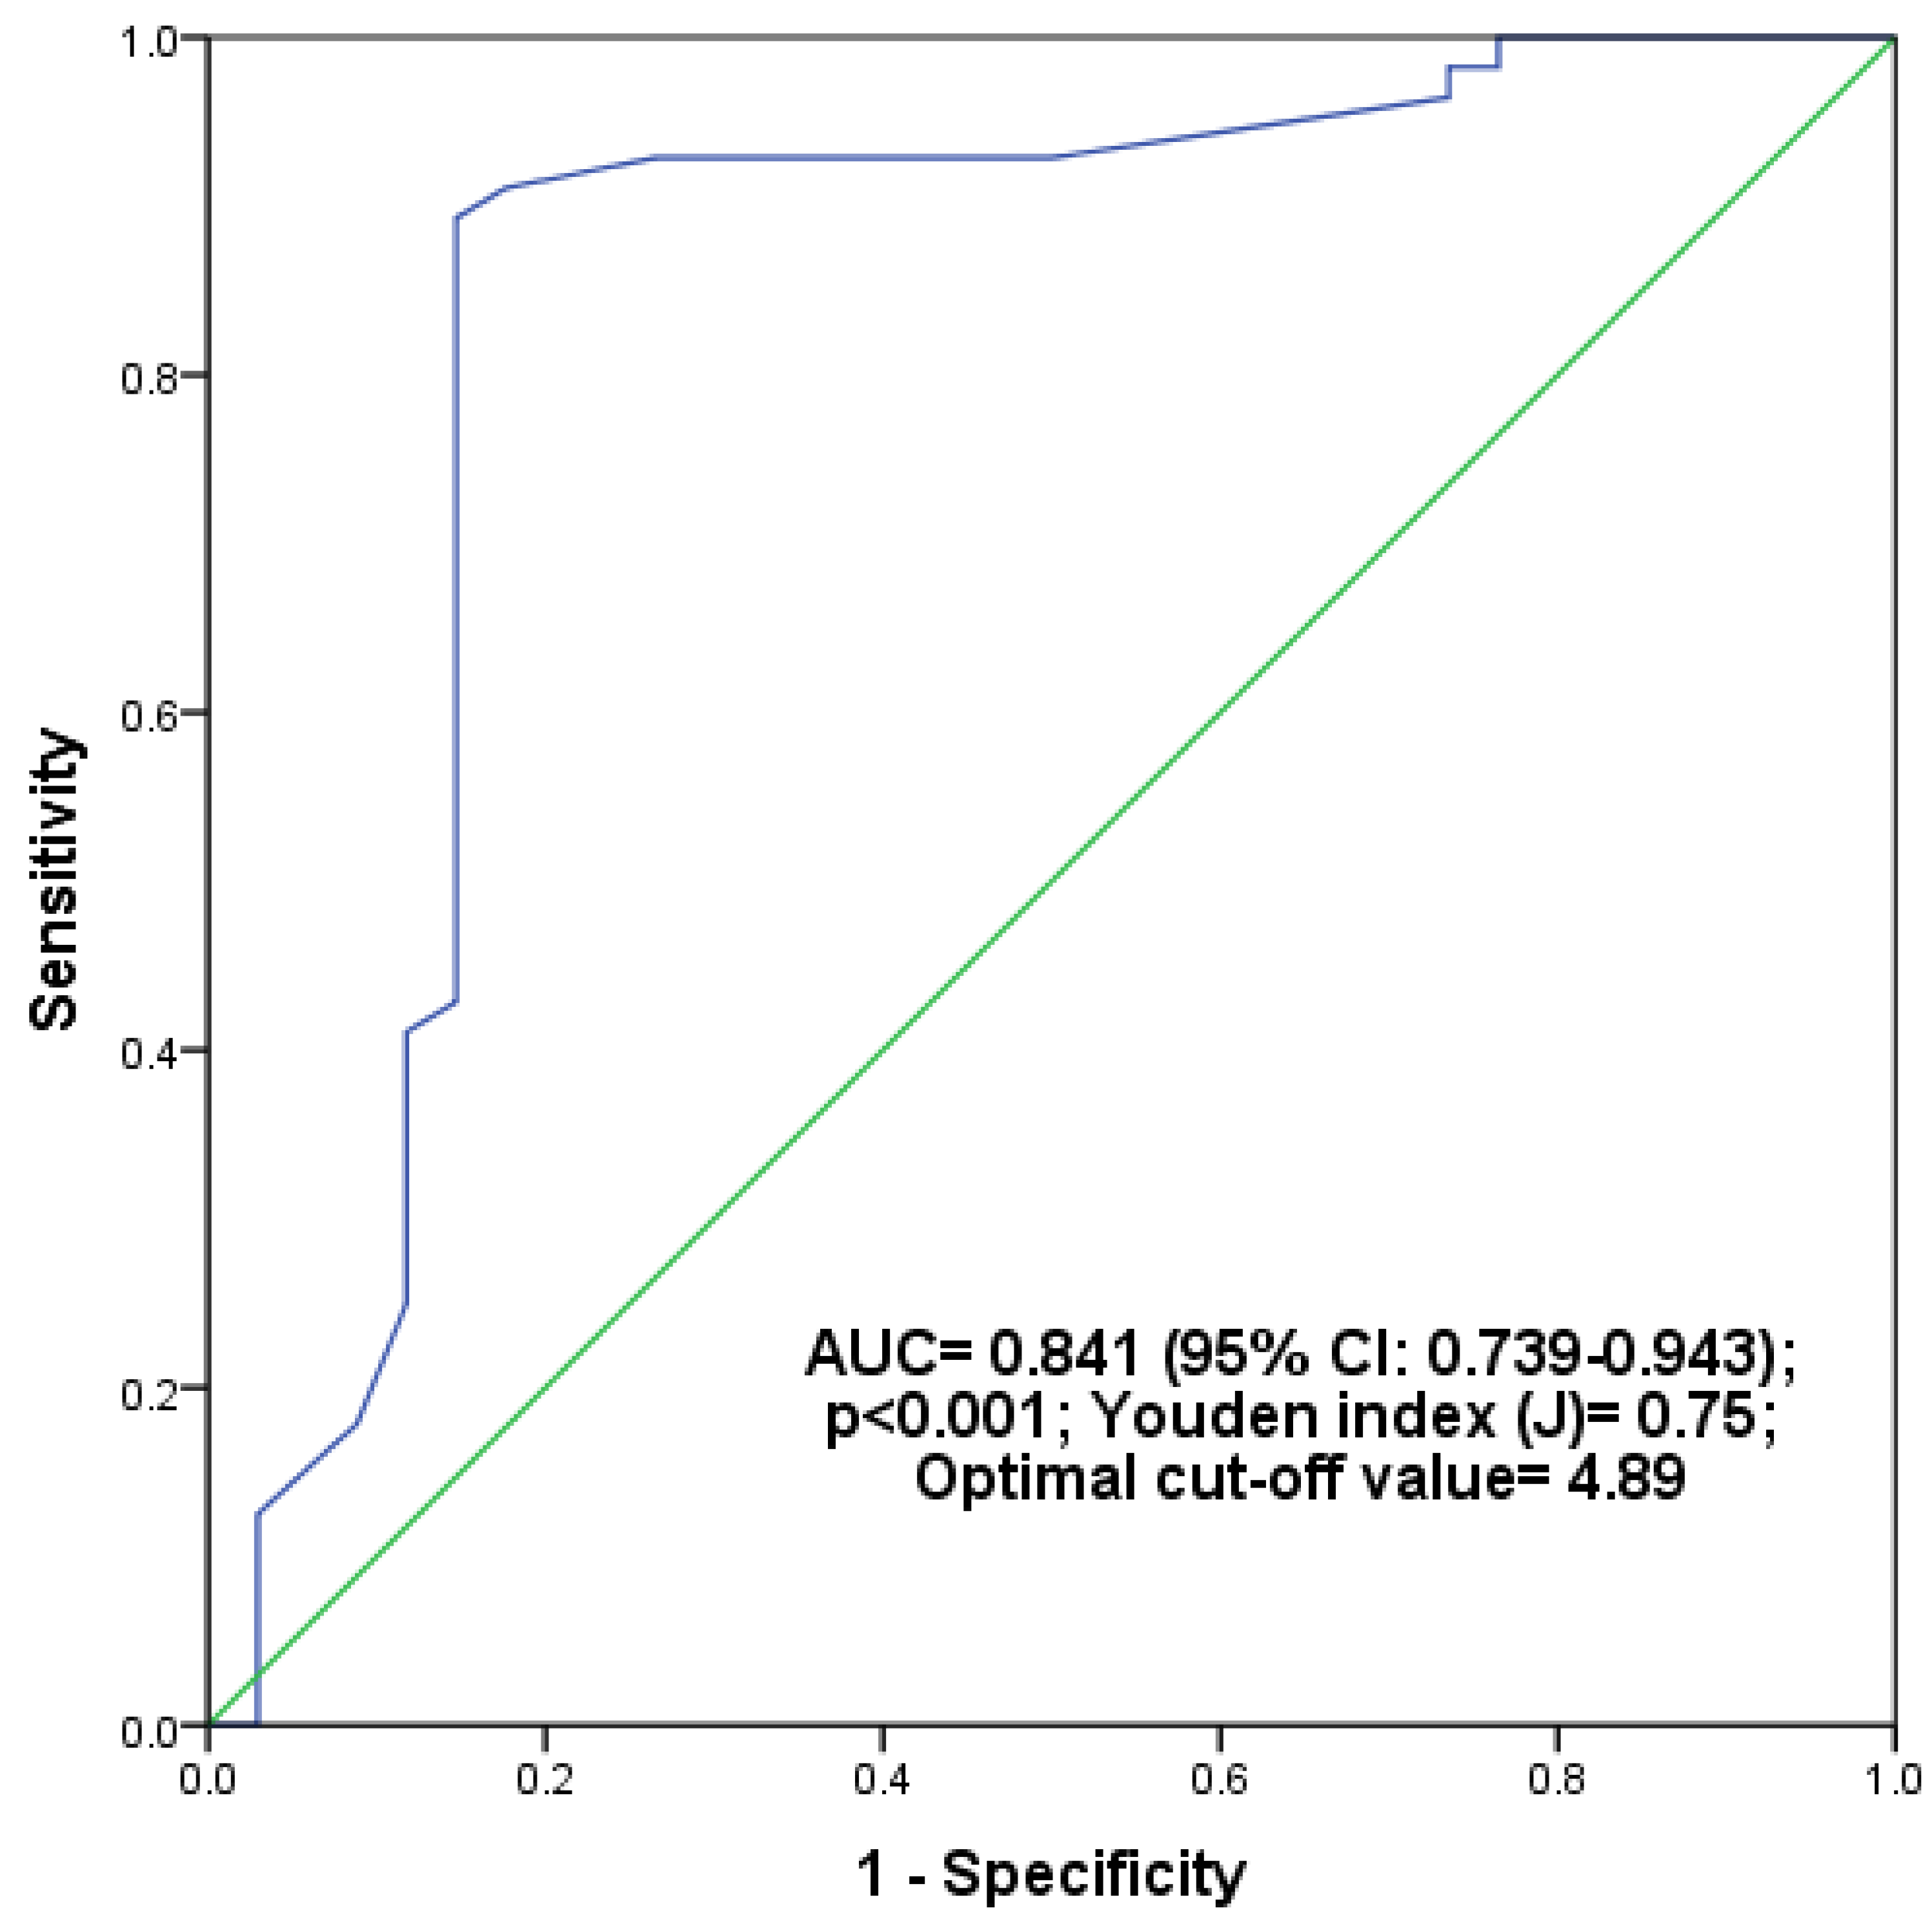
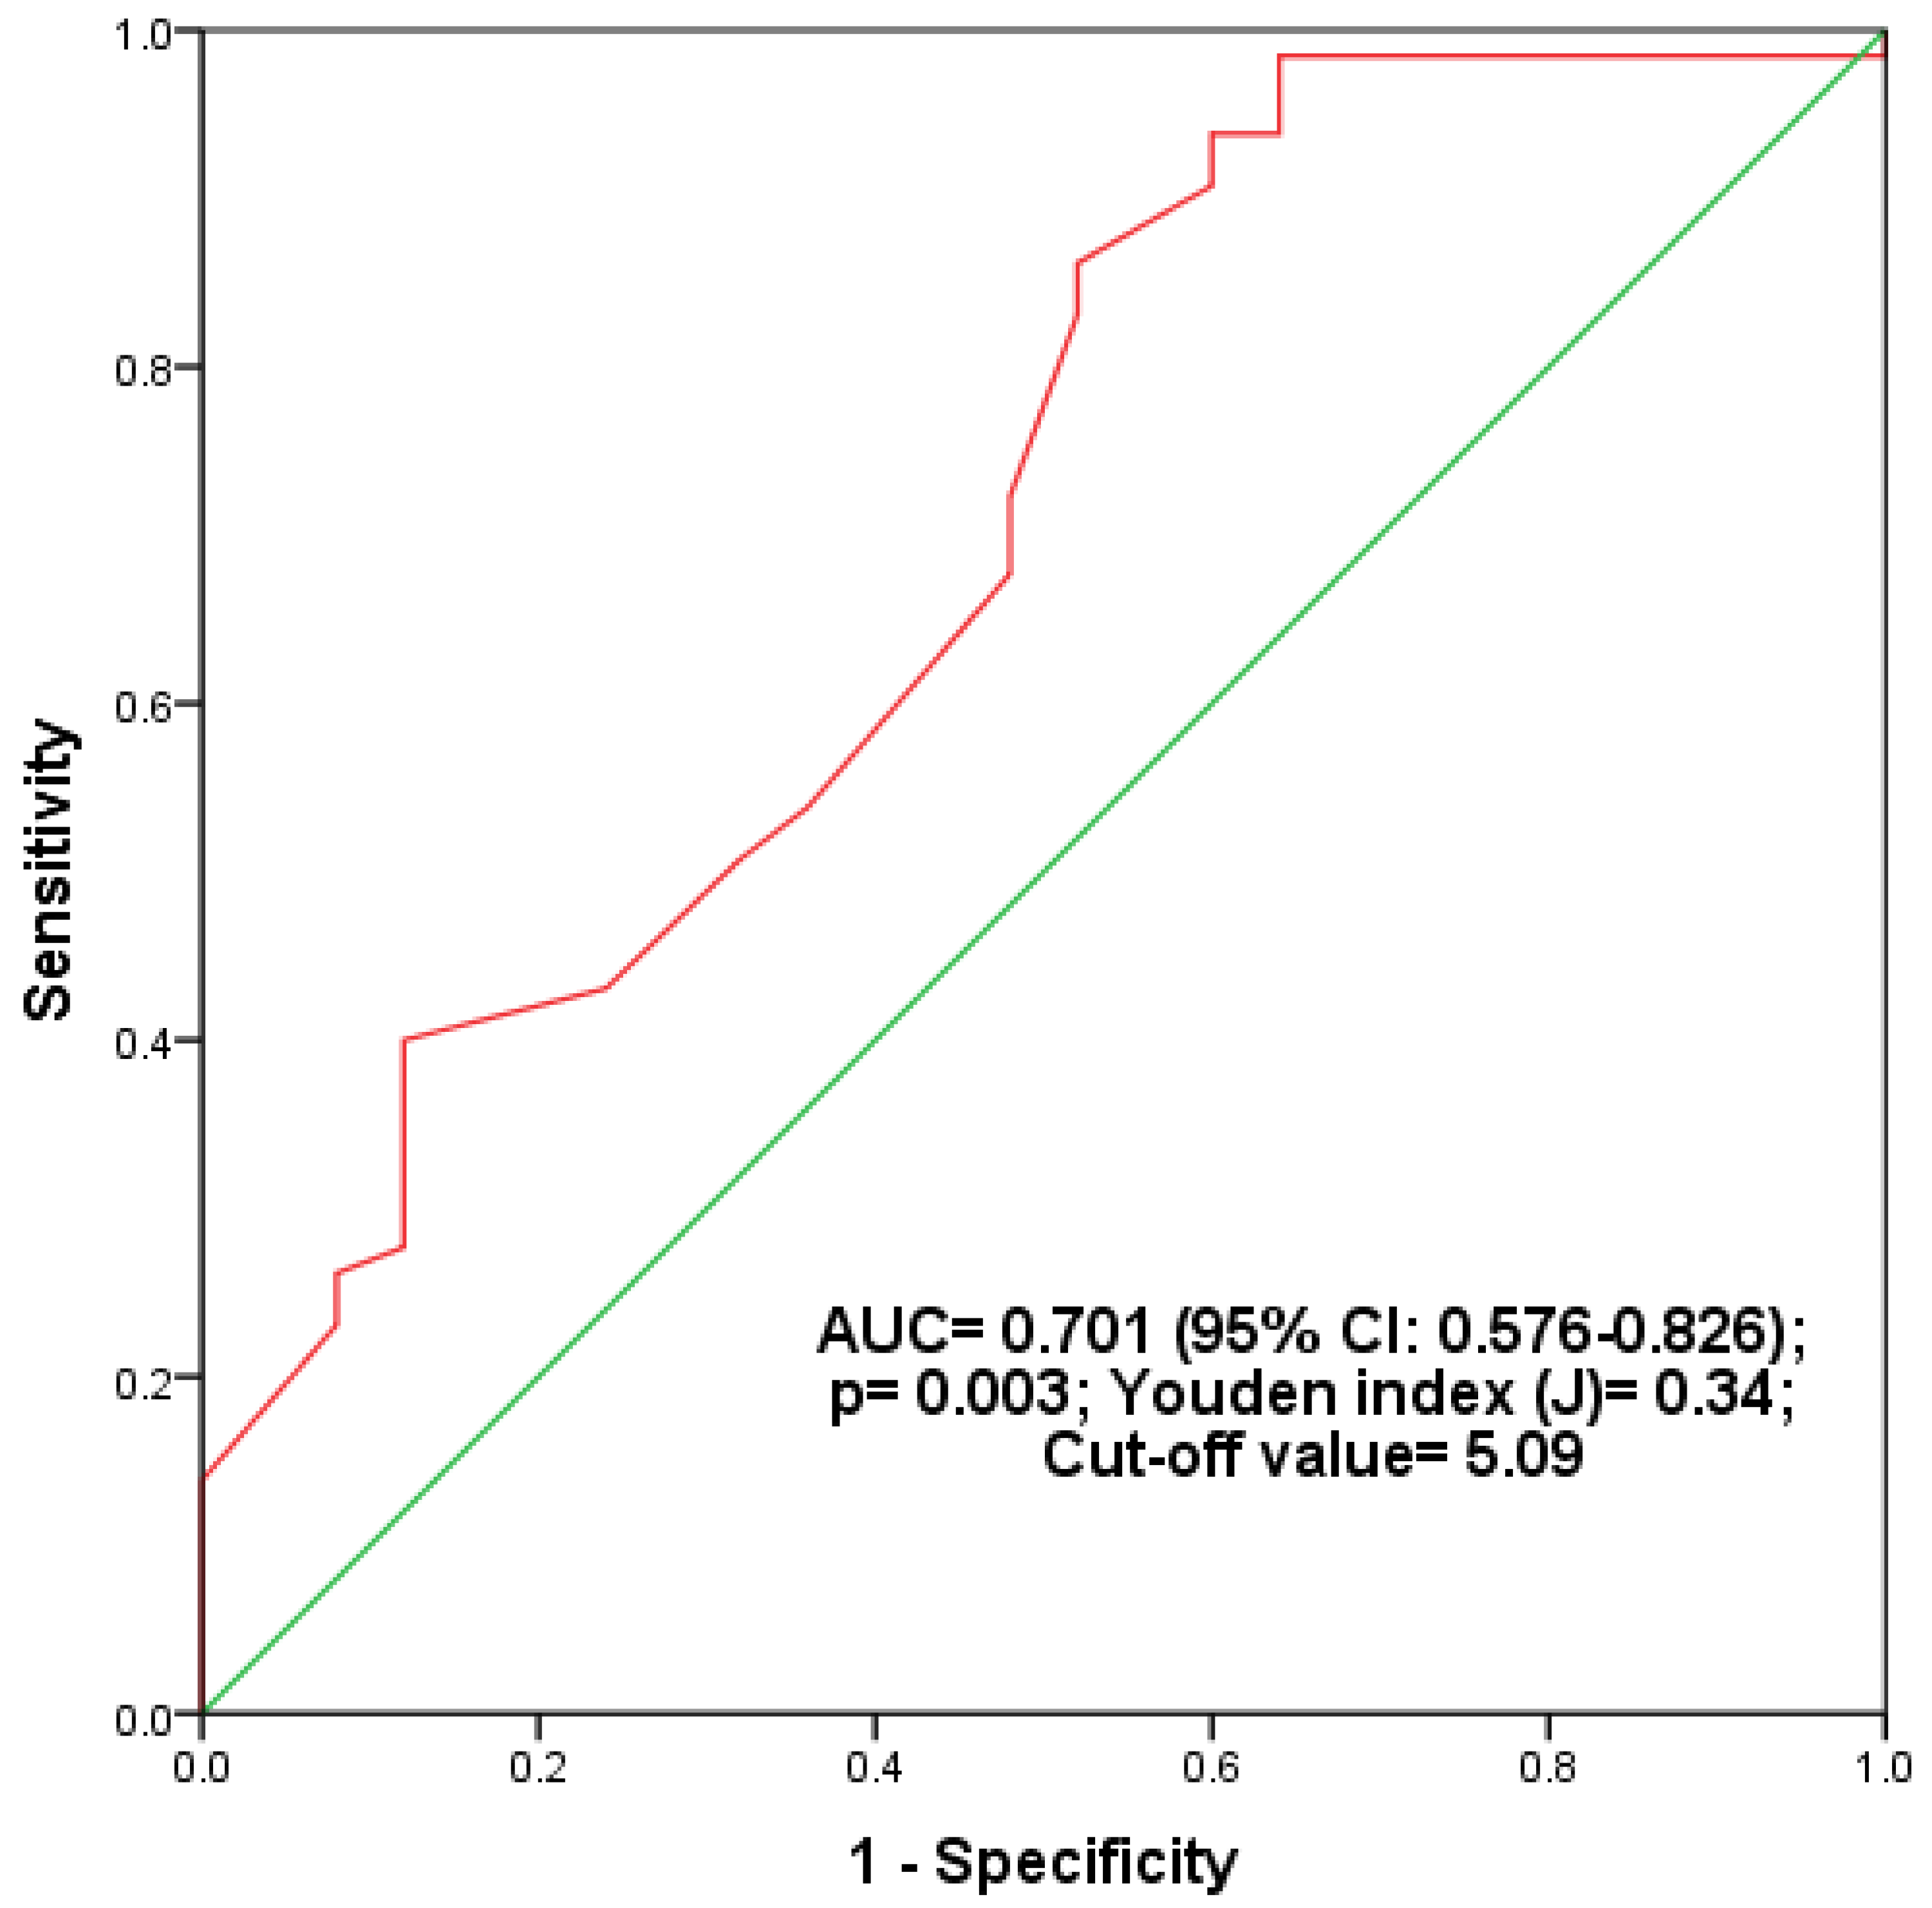
Figure 1. ROC curve analysis for the TyG index showing the optimal cut-off value of the TyG index for the diagnosis of vitamin D deficiency in prediabetes. Green line represents a random distribution. Blue line represents ROC curve of TyG index.
Biomed 04 00032 g001
Figure 2. ROC curve analysis for the TyG index showing the optimal cut-off value of the TyG index for the diagnosis of vitamin D deficiency in T2DM. Green line represents random distribution. Red line represents ROC curve of TyG index.
Biomed 04 00032 g002
Table 1. Baseline characteristics of the studied subjects.
VariablesT2DM
(n = 90)
Prediabetes
(n = 90)
Controls
(n = 90)
ABCD
Age (Years)48.64 ± 9.0347.97 ± 8.7847.31 ± 8.870.60410.9461
Male/Female (n)50/4047/4346/440.8240.6540.5500.881
BMI (Kg/m2)25.1 ± 3.0625.1 ± 2.1722.12 ± 2.48<0.001 *1<0.001 *<0.001 *
WHR0.91 ± 0.050.90 ± 0.030.85 ± 0.03<0.001 *0.195<0.001 *<0.001 *
SBP (mmHg)135.38 ± 9.01124.06 ± 8.1112.5 ± 3.4<0.001 *<0.001 *<0.001 *<0.001 *
DBP (mmHg)88.43 ± 4.9183.39 ± 3.4276.68 ± 3.79<0.001 *<0.001 *<0.001 *<0.001 *
FPG (mg/dL)154.81 ± 13.51112.82 ± 6.586 ± 6.89<0.001 *<0.001 *<0.001 *<0.001 *
2-h PG (mg/dL)249.48 ± 21.55161.67 ± 12.07118.62 ± 7.57<0.001 *<0.001 *<0.001 *<0.001 *
HbA1c (%)9.14 ± 1.56.04 ± 0.194.69 ± 0.4<0.001 *<0.001 *<0.001 *<0.001 *
TC (mg/dL)229.72 ± 27.51205.22 ± 22.14171.33 ± 7.94<0.001 *<0.001 *<0.001 *<0.001 *
TG (mg/dL)214.89 ± 18.3172.58 ± 26.32125.61 ± 10.12<0.001 *<0.001 *<0.001 *<0.001 *
HDL-C (mg/dL)39.29 ± 4.1644.49 ± 4.6258.19 ± 5.11<0.001 *<0.001 *<0.001 *<0.001 *
LDL-C (mg/dL)147.46 ± 28.1126.22 ± 22.6488.02 ± 10.58<0.001 *<0.001 *<0.001 *<0.001 *
VLDL-C (mg/dL)42.98 ± 3.6634.52 ± 5.2625.12 ± 2.02<0.001 *<0.001 *<0.001 *<0.001 *
TyG Index5.2 ± 0.084.93 ± 0.094.64 ± 0.06<0.001 *<0.001 *<0.001 *<0.001 *
25(OH)D (ng/mL)15 (12–27.75)18 (14–39)29.5 (17–48.75)<0.001 *0.054<0.001 *0.032 *
Normally distributed data are expressed as mean ± SD and compared by an ANOVA test for comparison between the three groups, followed by the Bonferroni post hoc test between each two groups. Non-parametric data are presented as median (IQR) and compared by the Kruskal–Wallis test for comparison between the three groups, followed by the Dunn–Bonferroni test between each two groups. * Significant difference at p value < 0.05. A: p value between the three groups. B: p value when T2DM compared with prediabetes. C: p value when T2DM compared with controls. D: p value when prediabetes compared with controls. BMI: body mass index; WHR: waist-to-hip ratio; SBP: systolic blood pressure; DBP: diastolic blood pressure; FPG: fasting plasma glucose; HbA1c: glycated hemoglobin; TC: total cholesterol; TG: triglyceride; HDL-C: high density lipoprotein cholesterol; LDL-C: low density lipoprotein cholesterol; VLDL-C: very low-density lipoprotein cholesterol; TyG Index: triglyceride-glucose index; 25(OH)D: 25-hydroxyvitamin D.
Table 2. Anthropometric indices and biochemical parameters in prediabetes and T2DM stratified by vitamin D status.
VariablesPrediabetes T2DM
Vitamin D Deficiency (n = 56)Non-Vitamin D Deficiency (n = 34)p-ValueVitamin D Deficiency (n = 65)Non-Vitamin D Deficiency (n = 25)p-Value
Age (years)48.23 ±9.2747.53 ± 8.040.71548.42 ± 8.7549.24 ± 9.880.700
BMI (Kg/m2)25.27 ± 2.0324.84 ± 2.390.36325.48 ± 3.0324.11 ± 2.980.057
WHR0.9 ± 0.030.9 ± 0.030.4770.92 ± 0.050.9 ± 0.050.130
SBP (mmHg)125.34 ± 8.34121.94 ± 7.320.053135.88 ± 8.5134.08 ± 10.290.400
DBP (mmHg)83.25 ± 3.5183.62 ± 3.320.62488.88 ± 4.5387.28 ± 5.730.168
FPG (mg/dL)115.43 ± 5.25108.53 ± 6.11<0.001 *157.38 ± 12.9148.12 ± 130.003 *
2-h PG (mg/dL)165.11 ± 11.35156 ± 11.17<0.001 *251.42 ± 20.49244.44 ± 23.810.170
HBA1c (%)6.05 ± 0.176.03 ± 0.210.6569.39 ± 1.488.48 ± 1.360.009 *
TC (mg/dL)210.52 ± 20.67196.5 ± 21.990.003 *233.52 ± 25.98219.84 ± 29.430.034 *
TG (mg/dL)184 (165.75–200)151 (136–156)<0.001 *218.71 ± 15.45204.96 ± 21.530.001 *
HDL-C (mg/dL)43.43 ± 4.3446.24 ± 4.60.005 *38.63 ± 3.9441 ± 4.310.015 *
LDL-C (mg/dL)130.53 ± 21.15119.12 ± 23.510.019 *151.15 ± 26.66137.85 ± 29.980.044 *
VLDL-C (mg/dL)36.8 (33.15–40)30.2 (27.2–31.2)<0.001 *43.74 ± 3.0940.99 ± 4.310.001 *
TyG Index4.97 (4.93–5.03)4.85 (4.81–4.87)<0.001 *5.22 ± 0.075.16 ± 0.08<0.001 *
25(OH)D (ng/mL)14.66 ± 3.1946.32 ± 8.9<0.001 *13.49 ± 3.4142.44 ± 8.14<0.001 *
* Significant difference at p value < 0.05. BMI: body mass index; WHR: waist-to-hip ratio; SBP: systolic blood pressure; DBP: diastolic blood pressure; FPG: fasting plasma glucose; HbA1c: glycated hemoglobin; TC: total cholesterol; TG: triglyceride; HDL-C: high density lipoprotein cholesterol; LDL-C: low density lipoprotein cholesterol; VLDL-C: very low-density lipoprotein cholesterol; TyG Index: triglyceride-glucose index; 25(OH)D: 25-hydroxyvitamin D.
Table 3. Correlation of 25(OH)D with anthropometric indices and biochemical parameters in control, prediabetes, and type 2 diabetes subjects.
VariablesControls Prediabetes T2DM
ρp-Value ρp-Value ρp-Value
Age (years)−0.100.362−0.040.741−0.060.555
BMI (Kg/m2)−0.150.161−0.230.033 *−0.220.038 *
WHR−0.060.557−0.220.034 *−0.250.017 *
SBP (mmHg)−0.060.580−0.240.021 *−0.230.027 *
DBP (mmHg)−0.090.4100.010.958−0.100.331
FPG (mg/dL)−0.050.669−0.260.012 *−0.4<0.001 *
2-h PG (mg/dL)−0.130.213−0.250.019 *−0.220.036 *
HBA1c (%)0.000.986−0.260.013 *−0.270.010 *
TC (mg/dL)−0.130.229−0.260.012 *−0.210.050
TG (mg/dL)−0.150.164−0.350.001 *−0.36<0.001 *
HDL-C (mg/dL)0.080.4460.230.031 *0.260.015 *
LDL-C (mg/dL)−0.120.256−0.240.025 *−0.170.105
VLDL-C (mg/dL)−0.150.164−0.350.001 *−0.36<0.001 *
TyG Index−0.180.084−0.340.001 *−0.42<0.001 *
* Significant at p value < 0.05; ρ = Spearman’s rank correlation coefficient; BMI: body mass index; WHR: waist-to-hip ratio; SBP: systolic blood pressure; DBP: diastolic blood pressure; FPG: fasting plasma glucose; HbA1c: glycated hemoglobin; TC: total cholesterol; TG: triglyceride; HDL-C: high density lipoprotein cholesterol; LDL-C: low density lipoprotein cholesterol; VLDL-C: very low-density lipoprotein cholesterol; TyG Index: triglyceride-glucose index; 25(OH)D: 25-hydroxyvitamin D.
Table 4. Association between vitamin D and TyG index in prediabetes.
B (95% CI)SEBetatp
Model 1−0.78 (−1.13, −0.43)0.18−0.43−4.42<0.001 *
Model 2−0.74 (−1.09, −0.38)0.18−0.40−4.12<0.001 *
Model 3−0.69 (−1.11, −0.27)0.21−0.38−3.270.002 *
* Significant at p value < 0.05. Model 1 (unadjusted); Model 2 (adjusted for age, gender, BMI, WHR, SBP, and DBP); Model 3 (adjusted for Model 2 covariates plus PPG, HbA1C, TC, and HDL-C); SE: standard error; CI: confidence interval.
Table 5. Association between vitamin D and TyG index in diabetes.
B (95% CI)SEBeta tp
Model 1−0.57 (−0.81, −0.34)0.12−0.46−4.79<0.001 *
Model 2−0.55 (−0.81, −0.29)0.13−0.43−4.18<0.001 *
Model 3−0.50 (−0.81, −0.19)0.16−0.40−3.180.002 *
* Significant at p value < 0.05. Model 1 (unadjusted); Model 2 (adjusted for age, gender, BMI, WHR, SBP, and DBP); Model 3 (adjusted for Model 2 covariates plus PPG, HbA1C, TC, and HDL-C); SE: standard error; CI: confidence interval.
Disclaimer/Publisher’s Note: The statements, opinions and data contained in all publications are solely those of the individual author(s) and contributor(s) and not of MDPI and/or the editor(s). MDPI and/or the editor(s) disclaim responsibility for any injury to people or property resulting from any ideas, methods, instructions or products referred to in the content.

