Abstract
Point-of-care ultrasound (POCUS) refers to the use of portable ultrasound systems by clinicians at a patient’s bedside for diagnostic and therapeutic purposes. It is not a substitute but rather a complement to clinical examination, and contrary to the classic ultrasound examination performed by radiologists, POCUS is not a detailed morphologic examination but focuses on answering specific clinical questions in an effort to reduce time to diagnosis and treatment, improve patient safety and decrease complication rates. In this article, we present the POCUS in hemodialysis units for and beyond vascular-access purposes, arguing that its implementation will help the practicing nephrologist who is treating hemodialysis patients on a daily basis to rapidly and efficiently answer several clinical questions that are common to dialysis patients, such as vascular-access assessment and cannulation, and assessment of volume status. POCUS aims to answer specific clinical questions, so a question-answer format is used. This review is divided in two parts. In the first part we will answer specific clinical questions exclusively concerning vascular access. The second part is dedicated to the use of POCUS for the assessment of volume status and dry-weight determination.
1. Introduction
The term point-of-care ultrasound (POCUS) refers to the use of portable ultrasound systems by clinicians at a patient’s bedside for diagnostic and therapeutic purposes. It is not a substitute but rather a complement to clinical examination. It should be emphasized that although POCUS is performed at a patient’s bedside, it is not a comprehensive ultrasound examination (CUE). Contrary to a CUE, which is a detailed morphological examination performed by radiologists or trained technicians, POCUS is usually performed by the treating physician and focuses on answering specific clinical questions in an effort to reduce time to diagnosis and treatment, improve patient safety [1], and decrease complication rates [2].
Bearing that in mind, it is not a surprise that POCUS has been used for more than 15 years for the assessment of critically ill patients, especially in the emergency and intensive-care-unit (ICU) settings. Several protocols have been developed with the aim of facilitating the assessment of patients presenting with major trauma, shortness of breath, shock or cardiac arrest:
- eFAST: extended focused assessment with sonography for trauma [3]
- BLUE: bedside lung ultrasound in emergency settings [4]
- RADIUS: rapid assessment of dyspnea with ultrasound [5]
- RUSH: rapid ultrasound in shock [6]
- FEEL: focused echocardiography in emergency life-support cardiac arrest [7]
- ACES: abdominal and cardiac evaluation with sonography in shock [8]
Patients treated with intermittent hemodialysis constitute a group with several unique characteristics, making them potential candidates that could benefit from the implementation of POCUS in the dialysis setting:
- Vascular-access assessment and cannulation
- Assessment of volume status
- Hypotensive episodes
- Shortness of breath
- Assessment of respiratory symptoms such as cough and fever
- Assessment of abdominal pain
- Leg edema and pain
These are some of the areas of interest in which POCUS use could aid the nephrologist in everyday clinical practice.
Recently, portable ultrasound systems have started to “invade” dialysis units in an effort to assess arteriovenous fistula (AVF) maturation, identify landmarks and abnormalities, facilitate cannulation of “difficult” vascular access and for patient self-cannulating training [9].
The aim of this review is to present the POCUS in hemodialysis units for and beyond vascular-access purposes, arguing that its implementation will have the same advantages as in other medical settings:
- Reduction in time to diagnosis and treatment
- Improvement of patient safety
- Reduction in complication rates
As already stated, POCUS aims to answer specific clinical questions, which is how we will proceed, i.e., with a Q and A format. This review is divided into two parts. In the first part we will answer specific clinical questions exclusively concerning vascular access. The second part is dedicated to the use of POCUS for the assessment of volume status and dry-weight determination.
2. First Part: POCUS for Vascular Access
Question: What are the main features of an ultrasound (US) machine for vascular examination?
Answer: For superficial vessel imaging, a linear transducer having a wide footprint and a central frequency of 2.5 Mhz to 12 Mhz should be used. The US machine should be equipped with 2D imaging, pulse wave Doppler, and color wave Doppler. Although vascular-access-outflow measurements are not part of the POCUS examination, a portable US machine that can calculate fistula outflow (based on diameter measurements and time averaged mean velocity) should be privileged.
Question: What is the vein diameter?
Answer: Using the transverse or longitudinal view and making sure not to apply pressure (to avoid collapsing of the vein), its diameter can easily be assessed. In general, a vein with a diameter ≥ 6 mm is considered mature for cannulation, although smaller veins (4–5 mm) can occasionally be cannulated.
Question: How deep is the vein from the skin surface?
Answer: This very important question can be answered by using POCUS. A vein located > 6 mm from the skin surface is considered too deep to be cannulated and cannulation in this area should be avoided.
Question: Is the segment to be cannulated straight or is there any tortuosity?
Answer: POCUS can explore the entire length of the vein, enabling the cannulator to select only straight segments that are easy to cannulate.
Question: Is there any vein duplication or valves?
Answer: Vein duplication is quite common and can result in miscannulation since it can be very challenging to be detected by physical examination. Valves within the vein lumen are also common and cannulation in these areas should be avoided. POCUS answers accurately both of these questions.
Question: Is there a pseudoaneurysm?
Answer: Contrary to a true aneurysm that is an abnormal dilation of an artery involving all three layers of the arterial wall (intima, media and adventitia), a pseudoaneurysm, also known as a “false aneurysm”, occurs when there is a breach to the vessel wall, resulting in an accumulation of blood between the tunica media and tunica adventitia of the vessel. This typically occurs following damage to the vessel wall from a puncture (needle). POCUS is the best way to identify a pseudoaneurysm, showing turbulent forward and backward flow (termed “yin-yang sign”).
Question: Is an arteriovenous fistula (AVF) mature?
Answer: According to the 2020 EDTA guidelines [10], AVFs with a palpable vein and good thrill at four weeks after their creation can be cannulated successfully in most cases. However, in the absence of such a thrill or when the vein is not easily palpable, there is low-quality evidence in line with clinical practice suggesting that an AV fistula diameter of >4–5 mm or a blood flow >500 mL/min indicates the fistula has matured and can be cannulated successfully. In the absence of a thrill a diameter of <4 mm and a blood flow of <400 mL/min make it highly suspicious that the AV fistula will fail without intervention. In these cases, POCUS provides useful information enabling the clinician to decide whether the AVF is “sufficiently” mature and can be safely cannulated. It should be noted that measuring AVF outflow is not part of POCUS for VA access and requires expert training.
3. Second Part: POCUS for Volume Status and Dry-Weight Assessment
Question: How can volume status be assessed?
Answer: The assessment of fluid and hemodynamic status is a critical skill for nephrologists and occupies a central position in everyday clinical practice in the dialysis setting. Notoriously difficult, volume status can be best evaluated by using clinical parameters such as vital signs, body weight, mucous-membrane examination, and capillary refill time in conjunction with well-validated indices of fluid status: POCUS assessment of the heart, abdominal veins, and lungs [11].
3.1. The Heart
Question: What are the main features of a US machine for heart examination?
Answer: A phased array transducer should be used. The US machine should offer 2D imaging, M-mode, power Doppler, continuous doppler, and color Doppler as well. US machines offering the possibility of ECG tracing should be provided since they facilitate wave recognition by the operator (for example E and A wave during the study of mitral inflow).
Question: What are the specific elements of a POCUS assessment of the heart?
Answer: A POCUS assessment of the heart consists of answering the following questions: (1) Is the ejection fraction (EF) normal (>50%)? (2) Are filling pressures elevated? (3) Is there a pericardial effusion? (4) What is the relative chamber size? (5) What is the estimated right-atrial pressure?
Question: Is the EF normal (>50%)?
Answer: There are several ways to estimate the EF using the POCUS approach.
Eyeballing is a qualitative approach that has shown very good correlation with all formal methods routinely used to assess ejection fraction (p < 0.001): AV plane displacement, four-chamber Simpson ejection fraction, biplane Simpson ejection fraction, and wall-motion score index [12].
Mitral annular plane systolic excursion (MAPSE) is a simple and valuable tool for EF estimation. Mitral annular plane systolic excursion (MAPSE) refers to the displacement of the mitral valvular plane in the z-direction and reflects left-ventricular longitudinal contraction or shortening, which has been attributed to account for about 60% of the stroke volume. The EF can be derived by using the following formula: EF = 4.8 × MAPSE (mm) + 5.8. A MAPSE ≥ 10 mm is considered normal. MAPSE was found to be a highly accurate predictor of EF by an untrained observer [13].
E-point septal separation (EPSS) is the minimum separation between the anterior mitral-valve leaflet and the interventricular septum. The mitral-valve waveform on M-mode contains two peaks. The larger one is called the “E-point” and corresponds to the maximal mitral-valve opening in early LV diastole. The second, smaller peak is called the “A-point” and corresponds to atrial contraction later in LV diastole. Normally, the mitral valve should open with the leaflet coming very near to the interventricular septum at the E-point. Thus, the smaller the distance between the E-point and the interventricular septum, the greater the EF will be. A study comparing the EPSS-derived EF with the EF measured by magnetic resonance imaging derived the following equation: LVEF = 75.5 − (2.5 × EPSS) with a correlation of r = 0.80 [14]. Another study derived a similar equation and correlation. Moreover, it demonstrated 100% sensitivity of an EPSS measurement > 7 mm for detecting severely reduced EF (<30%) [15].
Question: Are left-ventricular filling pressures (LVFPs) elevated?
Answer: This is an important issue for all dialysis patients: if LVFPs are found to be elevated, then the dry weight should be reduced; if normal, the answer is not straightforward and several other parameters have to be taken under consideration. Volume overload (assessed by bioelectrical impedance [16] and plasma-volume monitoring [17]) has been independently associated with mortality even after adjusting for BP. So, in the absence of hypertension, LVFP elevation is an important finding to guide the clinical assessment of volume status. For POCUS examinations, the trans-mitral flow Doppler is commonly used. The Doppler sample volume is placed between the tips of open mitral-valve leaflets in the apical four-chamber view. The normal tracing consists of E (early rapid filling period) and A (atrial systole corresponding to the end of diastole) waves, respectively. Normally, the E-wave peak velocity exceeds that of the A wave (E/A ratio >1). The E-wave deceleration time (DT) represents the dissipation time for the maximal pressure gradient between the left atrium and left ventricle. In echocardiography, it is assessed by the time required for the peak E-wave velocity to cross the baseline. A value of <150 ms is predictive of a PCWP >15 mmHg [18]. Tissue Doppler imaging, when available, can be used to supplement the trans-mitral flow findings. This involves measuring the longitudinal motion of the mitral-valve annulus (septal or lateral) during diastole. The tracing is always below the baseline with an e′ wave, reflecting early relaxation, and an a′ wave, reflecting atrial contraction in late diastole. A lateral E/e′ ratio > 13 or a septal E/e′ > 15 is considered indicative of elevated PCWP. It should always be remembered that mitral annular calcification (quite common in dialysis patients), severe mitral regurgitation, regional wall-motion abnormalities, ventricular desynchrony, and constrictive physiology result in a reduced reliability of tissue Doppler measurements. All in all, the assessment of LVEP in dialysis patients is one of the tools that the clinician uses for the assessment of dry weight.
Question: What is pseudo-normalization of mitral inflow?
Pseudo-normalization of mitral inflow (stage II diastolic dysfunction) indicates that although left-ventricular filling appears normal, significant abnormalities of diastolic function are present. This is due to the fact that the effects of impaired early left-ventricular relaxation on early diastolic filling become opposed by the elevated left-atrial pressure, and the early diastolic trans-mitral pressure gradient and mitral flow-velocity pattern return to normal. The PW Doppler findings are identical to normal (E/A ratio: 1–1.5, Deceleration time: 160–240 msec) except for the presence of pulmonary vein “a” flow reversal (>25 cm/s). Diastolic filling pressures tend to be elevated, the left atrium is increased in size, and patients often complain of exertional dyspnea. The recognition of stage II diastolic dysfunction is important since it suggests a decrease in left-ventricular compliance.
Question: Is a pericardial effusion present?
Answer: The evaluation of the pericardium with POCUS includes one of four standard views: parasternal long axis, parasternal short axis, subxiphoid and apical. A pericardial effusion appears as an anechoic stripe or accumulation surrounding the heart. Pleural effusions can be mistaken for pericardial effusions. The parasternal-long-axis view is most helpful to accurately define the effusion with the descending aorta, serving as a landmark: a pericardial effusion crosses the mid-line and separates the descending aorta from the pericardium (fluid accumulates anterior to the posterior pericardiac wall), while a pleural effusion accumulates posterolateral to the descending aorta. Moreover, pleural effusions are not present in the subxiphoid view given the absence of pleural reflection between the liver and the heart.
Question: What is the normal quantity of pericardial fluid?
Answer: 50 mL.
Question: What are the core echocardiographic findings of tamponade? What determines patient tolerance in terms of pericardial effusions?
Answer: The accumulation rate seems to matter more than absolute volume due to adaptations of cardiac compliance. Once the intrapericardial pressure overcomes the pericardial stretch limit, tamponade develops. The principal echocardiographic findings of pericardial tamponade consist of:
- a pericardial effusion
- diastolic right-ventricular collapse (high specificity)
- systolic right-atrial collapse (earliest sign)
- a plethoric inferior vena cava with minimal respiratory variation (high sensitivity)
- exaggerated respiratory cycle changes in mitral- and tricuspid-valve in-flow velocities as a surrogate for pulsus paradoxus
A retrospective study concerning all patients that had pericardiocentesis for clinically significant pericardial effusion between 2002 and 2018 at a major Canadian academic hospital found that the average time-to-diagnosis with POCUS was 5.9 h compared to >12 h with other imaging, including departmental ECHO. Patients whose pericardial effusion was identified by POCUS had an average time to pericardiocentesis of 28.1 h compared to >48 h with other diagnostic modalities [19].
Question: What is the relative chamber size?
Answer: Before answering this question, it should be remembered that POCUS aims to answer important clinical questions. Therefore, using POCUS, the clinician is trying to answer the following clinical question: Is any cardiac chamber dilated or not? To answer this question, we favor comparative visual assessment of all four chambers using the “rule of thirds”.
In the parasternal long axis, the right ventricle, aortic root and left atrium have almost the same size, each one of them occupying 1/3 of the screen.
In the apical four-chamber view, the right atrium is equal to 1/3 of the right heart while the right ventricle represents the other 2/3. The same analogy holds true for the left atrium and left ventricle, respectively.
To assess for right-ventricular dilatation, the use of the “rule of thirds” can be applied: Normally, the size of the right ventricle is equal to 2/3 of the left ventricle.
When the rule of thirds is not respected, the corresponding cardiac chamber is considered as dilated and the underlying pathology should be investigated.
Question: How can POCUS help the clinician in estimating right-atrial pressure (RAP)?
Answer: POCUS can estimate RAP using several methods:
- Inferior-vena-cava (IVC) diameter and collapsibility
- Hepatic-vein indices of size and flow
- Tricuspid-valve Doppler inflow and tricuspid-valve tissue Doppler
Question: How can the IVC diameter and collapsibility be used to estimate RAP?
Answer: According to the American Society of Echocardiography Guidelines (2010):
IVC diameter < 2.1 cm, and collapse > 50% correlates with a normal RAP of 0 to 5 mmHg.
IVC diameter < 2.1 cm with < 50% collapse and IVC diameter > 2.1 cm with > 50% collapse correspond to an intermediate RAP of 5 to 10 mmHg.
IVC diameter > 2.1 cm with < 50% collapse suggests a high RAP of 15 mmHg.
The guidelines recommend using mid-range values of 3 mmHg for normal and 8 mmHg for intermediate RAP.
If there is minimal collapse of the IVC (<35%) and/or secondary indices of elevated RAP are present, then the guidelines recommend upgrading to the higher-pressure limit (i.e., 5 and 10 mmHg in the cases of normal and intermediate RAPs, respectively). Patients with low compliance with deep inspirations may have diminished IVC collapse, and a ‘‘sniff’’ maneuver might be required, whereby a sudden decrease in intrathoracic pressure is caused in order to accentuate the normal inspiratory response, in order to differentiate those with true diminished IVC collapsibility from those with normal collapsibility.
Question: How can the hepatic-vein indices of size and flow be used to estimate RAP?
Answer: The ideal time to acquire the spectral waveform is during a small (incomplete) inspiratory breath hold since respiratory variation affects the systolic/diastolic ratio. The flow pattern in hepatic veins is characterized by three distinct waveforms when evaluated by Doppler. As in all Doppler examinations, negative waves (below the baseline) indicate that the blood flow is away from the transducer, while positive waves (above the baseline) indicate blood flow towards the transducer. In the case of hepatic veins (RAP normal), a first systolic wave (Vs—negative-below the baseline), caused by RA relaxation and descent of the tricuspid ring associated with RV systole, is followed by a smaller, second diastolic wave (Vd—negative-below the baseline), which occurs during rapid ventricular filling when the tricuspid valve is open. A small, third (positive—above the baseline) A wave may be seen occurring with RA contraction and represents reverse flow. As already mentioned, the spectral waveform shows phasicity; when abnormal, it constitutes an important clue for abnormal right-heart pathology. To define normal phasicity, an A wave has to be observed:
- An A wave above the baseline indicates normal phasicity
- Once the A wave descends below the baseline, there is at least mildly decreased phasicity
- Once the peak of the A wave is at least halfway between the baseline and the peak negative excursion of the waveform, there is at least moderately decreased phasicity.
- When the waveform loses all phasic variation (ie, becomes nonphasic) and no component waves can be distinguished, phasicity is severely decreased.
During inspiration, the negative intrathoracic pressure through a suction effect of blood towards the heart, results in an increase in the magnitude of Vs and Vd and a relative decrease in the A wave [20]. When RAP is normal or low, Vs > Vd. In the case of an elevated RAP, Vs is decreased and the Vs/Vd ratio becomes <1.
However, two important exceptions exist: tricuspid regurgitation and right-sided congestive heart failure (RSCHF). In the former, the S wave is not as deep as the V wave (a finding often described as the deceased S wave) and Vs/Vd <1. The spectral Doppler is characterized by increased pulsatility (wide variation between peaks and troughs) and a prominent v wave.
In the case of RSCHF, as long as the tricuspid valve remains competent, the Doppler US abnormality exhibits tall A (due to increased right-atrial pressure toward end diastole) and V (due to increased right-atrial pressure toward end systole) waves.
So, the clue in the case of RSCHF is a pulsatile waveform with tall A and V waves and a normal relationship [21].
In cases of a severely increased RAP or severe tricuspid regurgitation, the Vs can become positive, meaning that during right-ventricular systole, blood flow is inverted (towards the hepatic veins). The same holds true when Doppler ultrasonography is used for RAP estimation in the superior vena cava and in the internal jugular vein [22,23].
Question: How can tricuspid-valve Doppler inflow and tricuspid-valve tissue Doppler (DTI) help in RAP estimation?
Answer: In dialysis patients, tricuspid Doppler inflow and tricuspid DTI can be used for RAP estimation as a supplement to IVC and hepatic indices. Tissue Doppler allows the recording of myocardial and annular velocities. The maximal early filling velocity through the tricuspid valve during diastole (E wave) increases with increasing RAP. An evaluation using DTI can measure the velocity of tissue relaxation of the lateral tricuspid annulus in diastole (e’ wave). An E/e’ ratio > 6 was correlated with a RAP > 10 mmHg in several studies in different clinical scenarios (with and without mechanical ventilation and after cardiac surgery) [24,25].
3.2. The Abdominal Veins (Other Than IVC and Hepatic Veins)
Question: What is the interest of POCUS of the portal veins?
Answer: Venous congestion can initially be appreciated in the IVC: its size increases proportionally to CVP until it reaches its maximum dilation. Pressure is then transmitted in a retrograde fashion through the veins to the abdominal organs. Portal venous flow does not form a continuum with the systemic circulation due to the presence of the liver sinusoids and splanchnic capillary bed. This explains why hepatic venous pulsatility is partially transmitted to the portal veins through the hepatic sinusoids, which accounts for the cardiac variability seen in this waveform. Between the GI tract and the liver, the portal system should have constant monophasic flow with minimal variation. As venous congestion increases and pressure from the hepatic veins is transmitted across the hepatocytes into the portal system, the flow becomes pulsatile. The pulsatility index quantifies the degree of pulsatility.
Pulsatility index = Flow max − Flow min/Flow max
Flow max is measured as the distance between the baseline and the peak of the wave and Flow min is measured as the distance between the baseline and the trough of the wave. A pulsatility index of less than 30% is normal; between 30 and 49% denotes mild portal-vein abnormality; and greater than 50% indicates severe portal-vein abnormality. It should be noted that interpretation of the pulsatility index in cirrhotic patients and in patients with low BMI requires extreme caution since even when increased, it does not necessarily indicate a high RVP [26,27].
Question: What is the interest of POCUS of the renal veins?
Answer: Normal renal veins have uninterrupted monophasic flow. As venous congestion increases, the systolic component of the flow decreases. The waveform becomes biphasic, with discrete diastolic and systolic phases. Eventually, in severe congestion there is only diastolic flow, and systolic flow is absent.
Question: What is the VExUS score?
Answer: The Venous Excess Ultrasonography Score (VExUS) is a four-step protocol that evaluates the presence of congestion in the IVC and assesses the severity of congestion in three target organs: the liver, the gut and the kidneys. Used by emergency physicians to guide fluid management, the VExUS score can be applied to chronic dialysis patients to aid in the determination of dry weight (Figure 1).
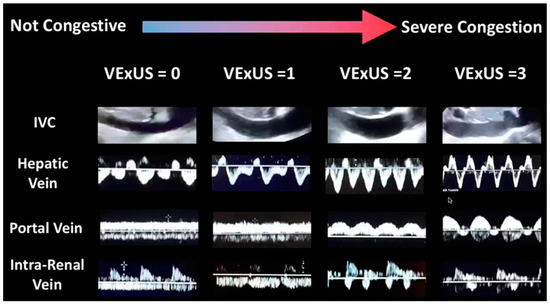
Figure 1.
VExUS score.
IVC diameter, hepatic-vein waveform, portal-vein waveform and intra-renal-vein waveform. These four parameters are used for the calculation of the VExUS score.
Question: How is the VExUS score calculated?
Answer: The VExUS score ranges from grades 0–3 (Table 1)

Table 1.
The VExUS Score.
Interpretation:
Grade 0: IVC < 2 cm
Grade 1: IVC ≥ 2 cm and any combination of normal or mildly abnormal pattern (mild congestion)
Grade 2: IVC ≥ 2 cm and one severely abnormal pattern (moderate congestion)
Grade 3: IVC ≥ 2 cm and > 2 severely abnormal patterns (severe congestion)
3.3. The Lungs
Question: How can lung ultrasound help nephrologists to estimate dry weight in dialysis patients?
Answer: POCUS of the lungs can be a valuable tool for nephrologists treating dialysis patients in terms of dry-weight estimation and volume overload. Dry-weight estimation is a challenging task and every diagnostic tool available should be used in order to answer this crucial clinical question as long as certain criteria are respected:
- Reproducibility
- Precision
- Easy to perform in everyday clinical practice (bedside) by the clinician
- Not ionizing
- Low cost
The POCUS of the lungs fulfills all the above-mentioned criteria.
It aims to answer two distinct questions: (1) Has the patient shown signs of fluid overload in the lungs? (2) Is a pleural effusion present?
The exam is performed with the patient lying on his back, using a curvilinear probe, positioned vertically to the lung and scanning three areas in each lung: the upper blue point (situated on the center of the clinician’s hand below the clavicle), the lower blue point (center of the clinician’s hand below the upper blue point), and the posterior-lateral alveolar pulmonary point situated on the crossing point of the posterior axillary line and a transverse line originating from the lower blue point [28].
The hallmark of pulmonary congestion (assessed by POCUS) is the presence of bilateral diffuse B-lines (reverberation artifacts of ultrasound waves through edematous interlobular septa, Figure 2) having the following characteristics:
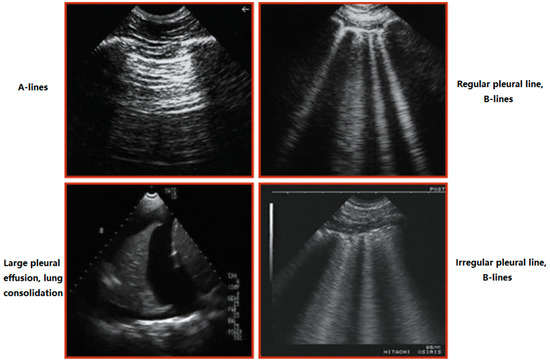
Figure 2.
Main findings in lung sonography. A-lines: Horizontal, echogenic reverberation artifacts beneath the pleural line at multiples of the distance between the ultrasound probe and the visceral-parietal pleural interface, which appear to fatigue as a function of depth. The artifact results from sound reflecting between two parallel reflective surfaces. B lines: They correspond to sub-pleural thickened interlobular septa, absent under normal conditions and present in alveolar-interstitial syndromes. Pleural effusion: Anechoic structure. Lung consolidation: Hypoechoic or isoechoic (hepatization) heterogeneous echotexture. The margin around the consolidation as it abuts normal aerated lung is blurred and irregular. Sonographic air bronchograms appear as multiple hyperechoic millimeter-long air inlets or as hyperechoic branching tubular structures within the consolidated lung parenchyma.
- Hyper-resonant
- Vertical
- Well-defined
- Cover the entire screen
- Comet-tail appearance
- Originate from the pleural line
- Follow pleural sliding
- Erase A-lines
- Diffuse-Bilateral
- ≥ 3 between two ribs
When predominantly over the normal A-lines, they are the ultrasonographic hallmark of pulmonary congestion. On the contrary, for diagnosing PAOP < or = 18 mmHg, A-line predominance had 93% specificity, 50% sensitivity, 97% positive predictive value, and 24% negative predictive value, respectively [29]. B-lines can be present in the case of ARDS, but the clinical scenario is quite different and less frequent in dialysis patients.
Volume overload in patients on hemodialysis (HD) is an independent risk factor for cardiovascular mortality. Saad et al. investigated the utility of B-lines for assessing volume overload in dialysis patients who were at their dry weight. According to their findings, in a multivariate Cox regression analysis, the number of B-lines showed an independent predictive value for mortality and cardiac events [30]. Moreover, Zoccali et al. showed that lung ultrasound can detect asymptomatic pulmonary congestion in hemodialysis patients, and the resulting BL-US score is a strong, independent predictor of death and cardiac events in this population [31].
As mentioned previously, POCUS can easily identify the presence of unilateral or bilateral asymptomatic pleural effusions. In dialysis patients, the most common causes are parapneumonic effusions (23.7%), uremic pleuritis (23.7%) CHF (19.7%) volume overload (6.6%) tuberculosis (6.6%) and malignancy (5.4%) [32].
Using POCUS, the quantity of the pleural fluid can be measured (a 20 mm interpleural distance corresponds to a volume of 380 ± 130 mL, while a 40 mm distance corresponds to a volume of 1000 ± 330 mL) [33]. If the distance between the parietal and the visceral pleura is > 15 mm and the effusion is visualized both in the adjacent superior and inferior intercostal space, then a pleural puncture can be performed in full security at the same position in order to further explore and identify the cause of the pleural effusion.
Question: Does a POCUS (lung)-based strategy impact cardiovascular morbidity/mortality and lung congestion in chronic hemodialysis patients?
Answer: In an international, multi-center randomized controlled trial, Zoccali et al. investigated whether a lung-ultrasound-guided treatment strategy improved a composite end point (all-cause death, non-fatal myocardial infarction, decompensated heart failure) vs. usual care in patients receiving chronic hemodialysis with high cardiovascular risk. According to their results, a treatment strategy guided by lung ultrasound effectively relieved lung congestion but was not more effective than usual care in improving the primary or secondary end points of the trial [34].
4. Deep Venous Thrombosis (DVT)
Question: What information can POCUS offer to the clinician examining a dialysis patient with unilateral leg edema?
Answer: The POCUS exam of the lower-limb veins is rapid, easy to perform and has a high sensitivity and specificity for DVT.
Question: How and what needs to be scanned?
Answer: With the patient lying supine, elevate the head of the bed to 30°, since this helps to pool the blood in the veins of the lower extremities and aids in visualization of the vein.
The ideal position is the frog-leg position (external rotation of the leg, bending the knee) since it enlarges the vein and brings it closer to the field of vision for the plane of the ultrasound probe.
A pillow under the patient’s knee increases comfort.
We use the 3-Point Lower Extremity DVT Ultrasound, described by Garcia [35]:
Using a linear high-frequency probe, the femoral vein is compressed 1 to 2 cm above and below the saphenofemoral junction, 1 to 2 cm above and below the bifurcation of the common femoral vein into the deep femoral vein and the (superficial) femoral vein, and lastly the popliteal vein up to the trifurcation into the anterior tibial vein, the posterior tibial vein, and the peroneal vein.
With the probe in a perpendicular orientation, firm pressure should be applied until the pulsatile artery compresses slightly. If the adjacent vein compresses completely, there is no DVT.
Evaluation of respiratory phasicity and augmentation are optional techniques in the evaluation for DVT and do not provide additional information. Augmentation of flow is performed by squeezing the limb at a level below the area of insonation. If the subsequent increased venous flow is transmitted to the level of evaluation, it suggests that no occlusive thrombus exists between the level of compression and insonation.
Question: What is the role of POCUS for detection of thrombosis related to central venous catheter for dialysis (TR-CVCd)?
Answer: Vieira et al. [36] studied the utility of a compression technique for the diagnosis of TR-CVCd blindly performed by POCUS experts and medical students when compared to a Doppler study.
According to their findings, the compression technique performed by experts (but not students) has a high accuracy in the diagnosis of TR-CVCd and should represent a standard in the routine examination of dialytic patients.
Question: What should be the minimum US core curriculum for POCUS use in dialysis?
Answer: Although we cannot provide a straightforward answer to this question, we strongly believe that a POCUS curriculum should be integrated with all nephrology training programs. We propose a combination of standardized lectures and hands-on training aiming at covering the core dialysis-related sonography topics as listed below [37].
4.1. Ultrasound Physics
- Ultrasound wave properties, transducer types
- Introduction to modes
- Image optimization
- Image orientation
- Basics of image interpretation
- Common ultrasound artifacts
4.2. Limited Doppler Echocardiography
Principles of cardiac Doppler: continuous and pulsed-wave Doppler, tissue velocity imaging.
Technique: appropriate cardiac view and correct placement of Doppler gate and/or cursor to obtain the chosen parameter.
Doppler parameters: left-ventricular outflow-tract velocity time integral, cardiac output, right-ventricular outflow-tract velocity time integral and waveform assessment, pulmonary artery systolic pressure, mitral inflow Doppler including E/A ratio, E-wave deceleration time, mitral annular E’, tricuspid annular S’.
4.3. Quantification of Venous Congestion Using Doppler Ultrasound
- Rationale
- Technique
- Components of VExUS:
- Hepatic-vein waveform: genesis, nomenclature of normal waves, transformation with increasing right-atrial pressure, pitfalls, utility of simultaneous electrocardiographic trace
- Portal-vein waveform: normal appearance, transformation with increasing right-atrial pressure, pitfall
4.4. Lung Ultrasound
- Technique
- Sonographic zones of evaluation: rationale
- A and B lines: physics underlying artifact generation
- Pleural effusion: simple effusion, spine sign, recognition of complex/exudative effusions
- Consolidations: differentiating lobar pneumonia and atelectasis, static and dynamic air bronchograms, sub-pleural consolidations
4.5. Focused Cardiac Ultrasound
- Technique: probe and preset selection, acquisition of basic cardiac views and inferior vena cava
- Utility of M-mode and color Doppler
- Cardiac anatomy: gross and sonographic correlation of the basic views
- Evaluation of 5 Es: ejection, effusion, equality, entrance, and exit
- Pitfalls of isolated inferior-vena-cava ultrasound
4.6. Integrative Assessment of Fluid-Volume Status
- Rationale
- Patient studies
- Limitations of basic POCUS and introduction to hemodynamic assessment using Doppler ultrasound
4.7. Sonographic Evaluation of the Dialysis Access
- Principles of spectral Doppler
- Anatomy of vascular access: gross and sonographic correlation in long and short axes
- Technique: probe selection, measurement of depth, diameter, volume flow
- Core pathologies: pseudoaneurysm, hematoma, thrombosis, narrowing and turbulent flow; assessment of maturity of a newly placed access. Detailed assessment of stenosis/vein mapping is beyond the scope of POCUS
4.8. Ultrasound-Guided Procedures
- Temporary hemodialysis catheter placement: probe selection, vessel selection, visualization of the needle tip, technique of catheter insertion, confirmation of correct placement by cardiac ultrasound (rapid atrial-swirl sign)
5. Conclusions
With a rapidly growing number of aged dialysis patients, the practicing nephrologist is confronted with multiple and often complex pathologies on a daily basis. Speed and accuracy of diagnostic testing is of paramount importance and every effort should be made to minimize delay between symptom onset and initiation of therapy. In this direction, POCUS is a rapid and reliable tool for the nephrologist treating dialysis patients on a daily basis.
Author Contributions
Conceptualization: G.T.; methodology G.T. and V.L.; writing-original draft preparation G.T.; validation G.T. and V.L. All authors have read and agreed to the published version of the manuscript.
Funding
This research received no external funding.
Institutional Review Board Statement
Not applicable.
Informed Consent Statement
Not applicable.
Data Availability Statement
Not applicable.
Conflicts of Interest
The authors declare no conflict of interest.
References
- Smallwood, N.; Dachsel, M. Point-of-care ultrasound (POCUS): Unnecessary gadgetery or evidence-based medicine. Clin. Med. 2018, 18, 219–226. [Google Scholar] [CrossRef] [PubMed]
- Takatami, J.; Takeshima, N.; Okuda, K.; Uchimo, T.; Hagiwara, S.; Naguchi, T. Enhanced needle visualization: Advantages and indications of an ultrasound software package. Anaesth. Intensive Care 2012, 40, 856–860. [Google Scholar] [CrossRef] [PubMed]
- Kirkpatrick, A.W.; Sirdis, M.; Laupland, L.; Liu, D.; Rowan, K.; Ball, C.G.; Hameed, S.M.; Brown, R.; Simons, R.; Dulchavsky, S.A.; et al. Hand-held thoracic sonography for detecting post-traumatic pneumothoraces: The Extended Focused Assessment with Sonography for Trauma (EFAST). J. Trauma Acute Care Surg. 2004, 57, 288–295. [Google Scholar] [CrossRef] [PubMed]
- Lichtenstein, D.; Mezière, G. Relevance of ling ultrasound in the diagnosis of acute respiratory failure: The Blue protocol. Chest 2008, 134, 117–125. [Google Scholar] [CrossRef]
- Manson, W.; Hafez, N.M. The rapid assessment of dyspnea with ultrasound (RADIUS). Ultrasound Clin. 2011, 6, 261–276. [Google Scholar] [CrossRef]
- Perera, P.; Mailhot, M.T.; Riley, D.; Mandaria, M.D. The RUSH exam: Rapid Ultrasound in Shock in the evaluation of critically ill. Emerg. Med. Clin. N. Am. 2010, 628, 29–56. [Google Scholar] [CrossRef]
- Breitkreutz, R.; Walcher, S.; Seeger, F.H. Focus echocardiographic evaluation in resuscitation management: Concept of an advanced life support-conformed algorithm. Crit. Care Med. 2007, 35 (Suppl. S5), S150–S161. [Google Scholar] [CrossRef]
- Atkinson, P.R.T.; McAuley, D.J.; Kendall, R.J.; Abeyakoon, O.; Reid, C.G.; Connolly, J.; Lewis, D. Abdominal and Cardiac Evaluation with sonography in Shock (ACES): An approach by emergency physicians for the use of ultrasound in patients with undifferentiated hypotension. Emerg. Med. J. 2009, 26, 87–91. [Google Scholar] [CrossRef]
- Schoch, M.; Bennett, P.; Currey, J.; Hutchinson, A. POCUS use for vascular access assessment and cannulation in hemodialysis: A scoping review. Semin. Dial. 2020, 33, 355–368. [Google Scholar] [CrossRef]
- ERBP Guideline Development Group on Vascular Access. Clinical practice guideline on peri- and postoperative care of arteriovenous fistulas and grafts for haemodialysis in adults. Nephrol. Dial. Transplant. 2019, 34, ii1–ii42. [Google Scholar] [CrossRef]
- Koratala, A.; Kazory, A. Point of Care Ultrasonography for Objective Assessment of Heart Failure: Integration of Cardiac, Vascular, and Extravascular Determinants of Volume Status. Cardiorenal. Med. 2021, 11, 5–17. [Google Scholar] [CrossRef] [PubMed]
- Gudmundsson, P.; Rydberg, E.; Winter, R.; Willenheimer, R. Visually estimated left ventricular ejection fraction by echocardiography is closely correlated with formal quantitative methods. Int. J. Cardiol. 2005, 101, 209–212. [Google Scholar] [CrossRef] [PubMed]
- Matos, J.; Kronzon, I.; Panagopoulos, G.; Perk, G. Mitral annular plane systolic excursion as a surrogate for left ventricular ejection fraction. J. Am. Soc. Echocardiogr. 2012, 25, 969–974. [Google Scholar] [CrossRef] [PubMed]
- Silverstein, J.R.; Laffely, N.H.; Rifkin, R.D. Quantitative estimation of left ventricular ejection fraction from mitral valve E-point to septal separation and comparison to magnetic resonance imaging. Am. J. Cardiol. 2006, 97, 137–140. [Google Scholar] [CrossRef] [PubMed]
- McKaigney, C.J.; Krantz, M.J.; La Rocque, C.L.; Hurst, N.D.; Buchanan, M.S.; Kendall, J.L. E-point septal separation: A bedside tool for emergency physician assessment of left ventricular ejection fraction. Am. J. Emerg. Med. 2014, 32, 493–497. [Google Scholar] [CrossRef]
- Wizemann, V.; Wabel, P.; Chamney, P.; Zaluska, X.; Moissl, U.; Rode, C.; Malecka-Masalska, T.; Marcelli, D. The mortality risk of overhydration in haemodialysis patients. Nephrol. Dial. Transplant. 2009, 24, 1574–1579. [Google Scholar] [CrossRef]
- Agarwal, R. Hypervolemia is associated with increased mortality among hemodialysis patients. Hypertension 2010, 56, 512–517. [Google Scholar] [CrossRef]
- Whalley, G.A.; Doughty, R.N.; Gamble, G.D.; Wright, S.P.; Walsh, H.J.; Muncaster, S.A.; Sharpe, N. Pseudonormal mitral filling pattern predicts hospital re-admission in patients with congestive heart failure. J. Am. Coll. Cardiol. 2002, 39, 1787–1795. [Google Scholar] [CrossRef]
- Hanson, B.G.; Chan, B. The role of point-of-care ultrasound in the diagnosis of pericardial effusion: A single academic center retrospective study. Ultrasound J. 2021, 13, 1–6. [Google Scholar] [CrossRef]
- Reynolds, T.; Appleton, C.P. Doppler flow velocity patterns of the superior vena cava, inferior vena cava, hepatic vein, coronary sinus, and atrial septal defect: A guide for the echocardiographer. J. Am. Soc. Echocardiogr. 1991, 4, 503–512. [Google Scholar] [CrossRef]
- McNaughton, D.A.; Abu-Yousef, M.M. Doppler US of the liver made simple. Radiographics 2011, 31, 161–188. [Google Scholar] [CrossRef] [PubMed]
- Sivaciyan, V.; Ranganathan, N. Transcutaneous Doppler jugular venous flow velocity recording. Circulation 1978, 57, 930–939. [Google Scholar] [CrossRef] [PubMed]
- Appleton, C.P.; Hatle, L.K.; Popp, R.L. Superior vena cava and hepatic vein doppler echocardiography in healthy adults. J. Am. Coll. Cardiol. 1987, 10, 1032–1039. [Google Scholar] [CrossRef]
- Nagueh, M.F.; Kopelen, H.A.; Zoghbi, W.A.; Quinones, M.A.; Nagueh, S.F. Estimation of mean right atrial pressure using tissue Doppler imaging. Am. J. Cardiol. 1999, 84, 1448–1451. [Google Scholar] [CrossRef]
- Sade, L.E.; Gulmez, O.; Eroglu, S.; Sezgin, A.; Muderrisoglu, H. Noninvasive estimation of right ventricular filling pressure by ratio of early tricuspid inflow to annular diastolic velocity in patients with and without recent cardiac surgery. J. Am. Soc. Echocardiogr. 2007, 20, 982–988. [Google Scholar] [CrossRef]
- Patel, A.R.; Alsheikh-Ali, A.A.; Mukherjee, J.; Evangelista, A.; Quraini, D.; Ordway, L.J.; Kuvin, J.T.; DeNofrio, D.; Pandian, N.G. 3D echocardiography to evaluate right atrial pressure in acutely decompensated heart failure correlation with invasive hemodynamics. J. Am. Coll. Cardiol. Imaging 2011, 4, 938–945. [Google Scholar] [CrossRef][Green Version]
- Abu-Yousef, M.M. Normal and respiratory variations of the hepatic and portal venous duplex Doppler waveforms with simultaneous electrocardiographic correlation. J. Ultrasound Med. 1992, 11, 263–268. [Google Scholar] [CrossRef]
- Baik, S.K. Haemodynamic evaluation by Doppler ultrasonography in patients with portal hypertension: A review. Liver Int. 2010, 30, 1403–1413. [Google Scholar] [CrossRef]
- Lichtenstein, D.; Mezière, G.; Lagoueyte, J.F.; Biderman, P.; Goldstein, I.; Gepner, A. A-Lines and B-Lines. Lung Ultrasound as a Bedside Tool for Predicting Pulmonary Artery Occlusion Pressure in the Critically Ill. Chest 2009, 136, 1014–1020. [Google Scholar] [CrossRef]
- Saad, M.; Kamal, J.; Moussaly, E.; Karam, B.; Mansour, W.; Gobran, E.; Abbasi, S.H.; Mahgoub, A.; Singh, P.; Hardy, R.; et al. Relevance of B-Lines on Lung Ultrasound in Volume Overload and Pulmonary Congestion: Clinical Correlations and Outcomes in Patients on Hemodialysis. Cardiorenal Med. 2018, 8, 83–91. [Google Scholar] [CrossRef]
- Zoccali, C.; Torino, C.; Tripepi, R.; Tripepi, G.; D’Arrigo, G.; Postorino, M.; Gargani, L.; Sicari, R.; Picano, E.; Mallamaci, F. Lung US in CKD Working Group. Pulmonary congestion predicts cardiac events and mortality in ESRD. J. Am. Soc. Nephrol. 2013, 24, 639–646. [Google Scholar] [CrossRef] [PubMed]
- Pourdowlat, G.; Farokhi, F.R. Pleural effusion in hemodialysis patients with chronic kidney disease. Eur. Respir. J. 2012, 39, 889–891. [Google Scholar]
- Eibenberger, K.L.; Dock, W.I.; Ammann, M.E.; Dorffner, R.; Hörmann, M.F.; Grabenwöger, F. Quantification of pleural effusions: Sonography versus radiography. Radiology 1994, 191, 681–684. [Google Scholar] [CrossRef] [PubMed]
- Zoccali, C.; Torino, C.; Mallamaci, F.; Sarafidis, P.; Papagianni, A.; Ekart, R.; Hojs, R.; Klinger, M.; Letachowicz, K.; Fliser, D.; et al. A randomized multicenter trial on a lung ultrasound-guided treatment strategy in patients on chronic hemodialysis with high cardiovascular risk. Kidney Int. 2021, 100, 1325–1333. [Google Scholar] [CrossRef] [PubMed]
- Garcia, J.P.; Alonso, J.V.; Garcia, P.C.; Rodriguez, F.R.; Lopez, M.A.A.; Munoz-Villanueva, M.D.C. Comparison of the Accuracy of Emergency Department-Performed Point-of-Care-Ultrasound (POCUS) in the Diagnosis of Lower-Extremity Deep Vein Thrombosis. J. Emerg. Med. 2018, 54, 656–664. [Google Scholar] [CrossRef]
- Vieira, A.L.S.; Pazeli, J.M.; Matos, A.S.; Pereira, A.M.; Pinto, I.R.; Esteves de Oliveira, L.; Guilherme, L.S.; Silva, S.L.A. Ultrasonographic evaluation of deep vein thrombosis related to the central catheter in hemodialytic patients. Ultrasound J. 2022, 14, 1–6. [Google Scholar]
- Koratala, A.; Olaoye, O.A.; Bhavna Bhasin-Chhabra, B.; Kazory, A. A Blueprint for an Integrated Point-of-Care Ultrasound. Kidney 2021, 2, 1669–1676. [Google Scholar] [CrossRef]


Publisher’s Note: MDPI stays neutral with regard to jurisdictional claims in published maps and institutional affiliations. |
© 2022 by the authors. Licensee MDPI, Basel, Switzerland. This article is an open access article distributed under the terms and conditions of the Creative Commons Attribution (CC BY) license (https://creativecommons.org/licenses/by/4.0/).