
The Role of Gubernatorial Affiliation, Risk Perception, and Trust in COVID-19 Vaccine Hesitancy in the United States


Abstract
1. Introduction
2. Materials and Methods
2.1. Measures
2.1.1. State Party Affiliation
2.1.2. Vaccine Hesitancy
2.1.3. Sociodemographic Information
2.1.4. Trust
2.1.5. Risk Perception
2.1.6. Analysis
3. Results
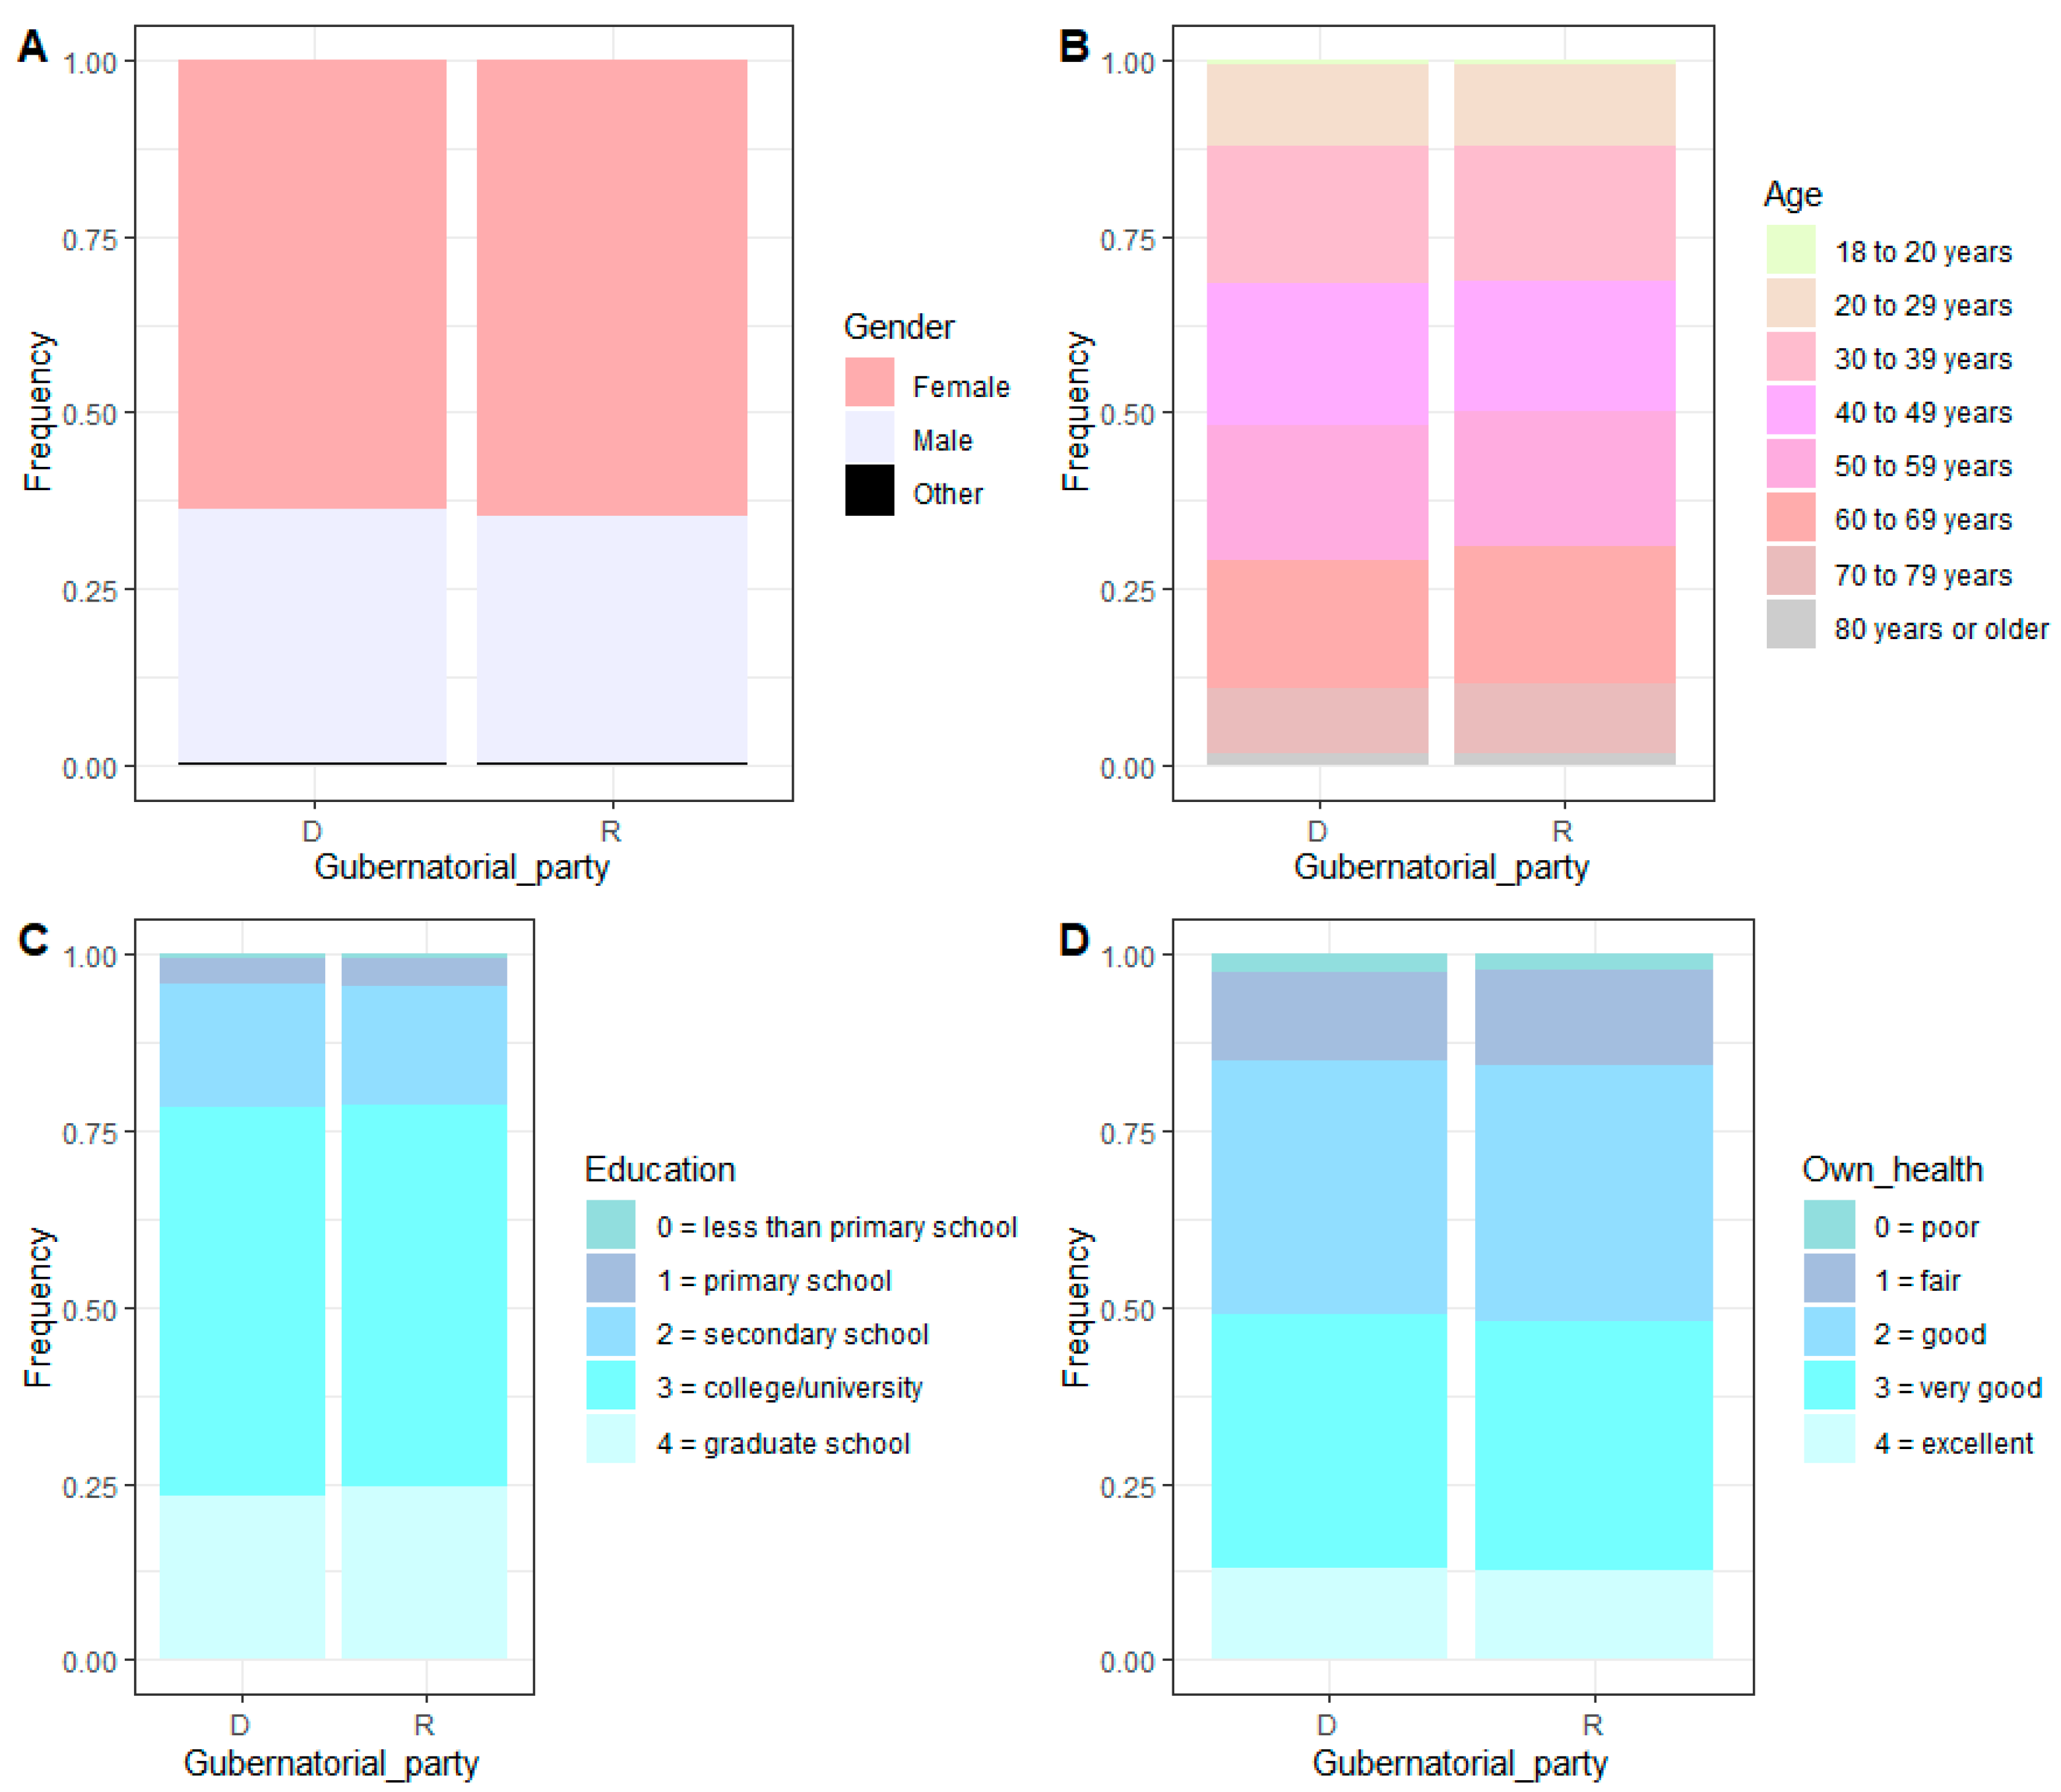
3.1. Demographics
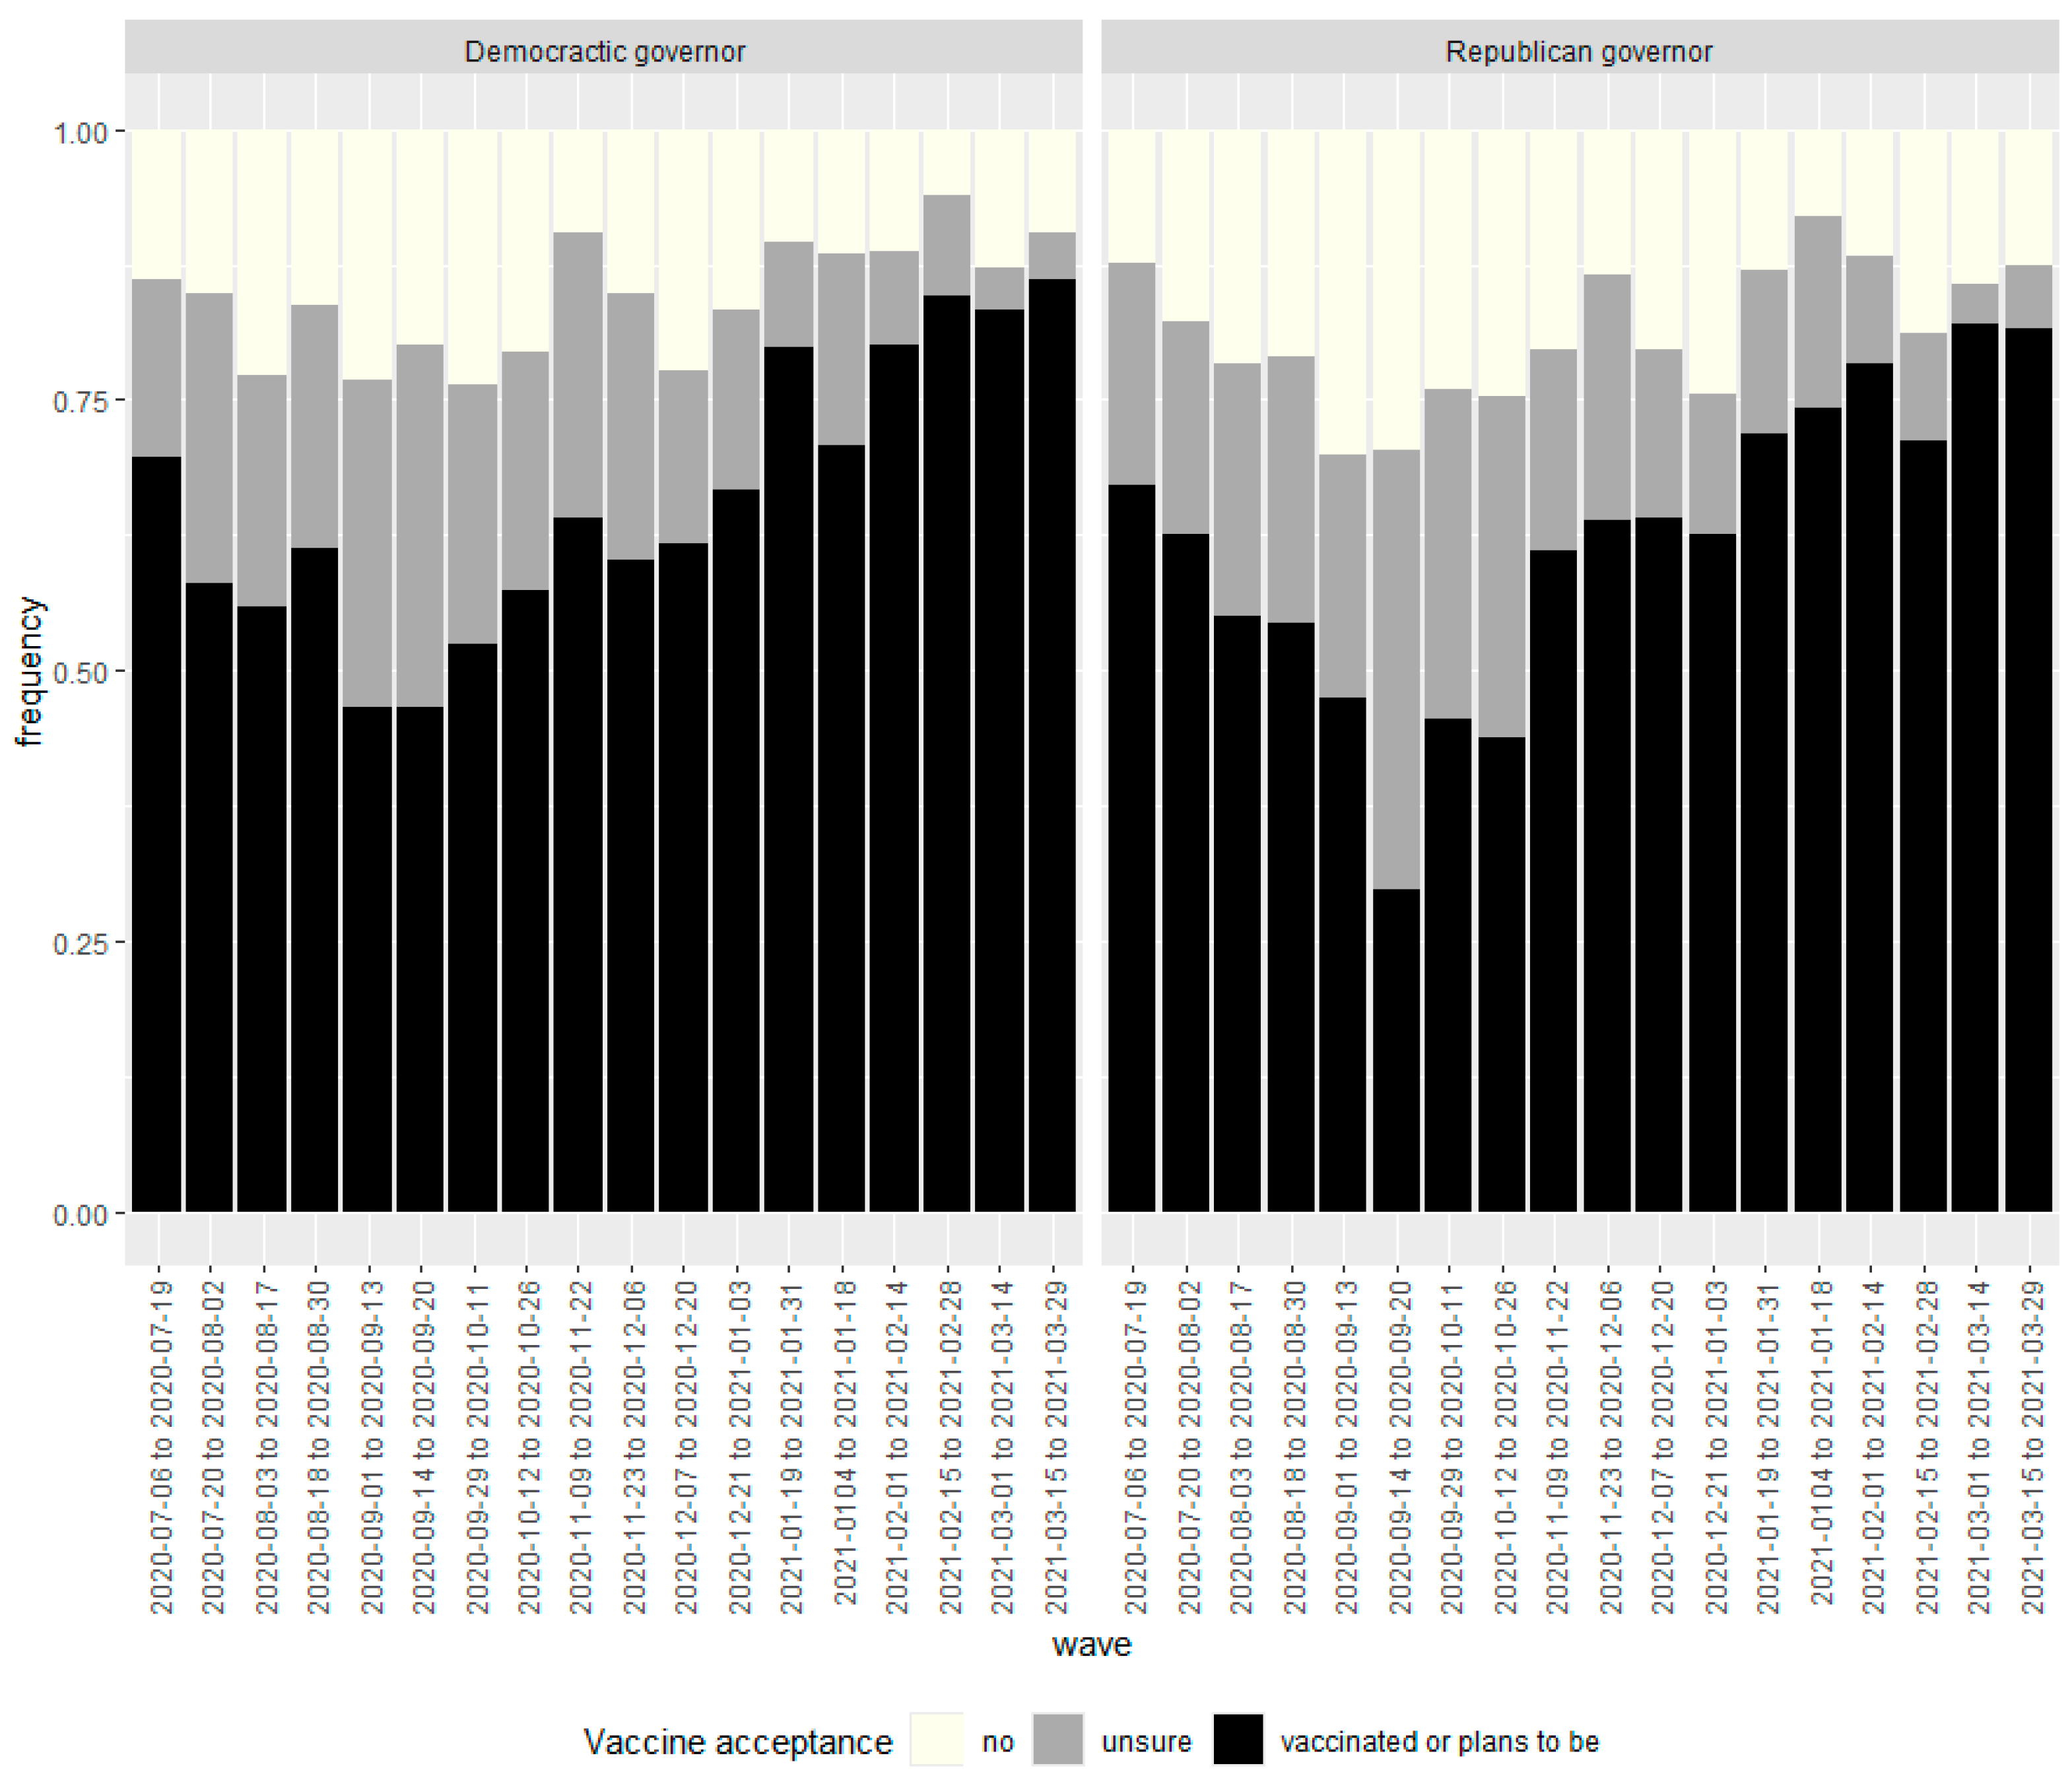
3.2. Temporal Changes in Vaccine Hesitancy
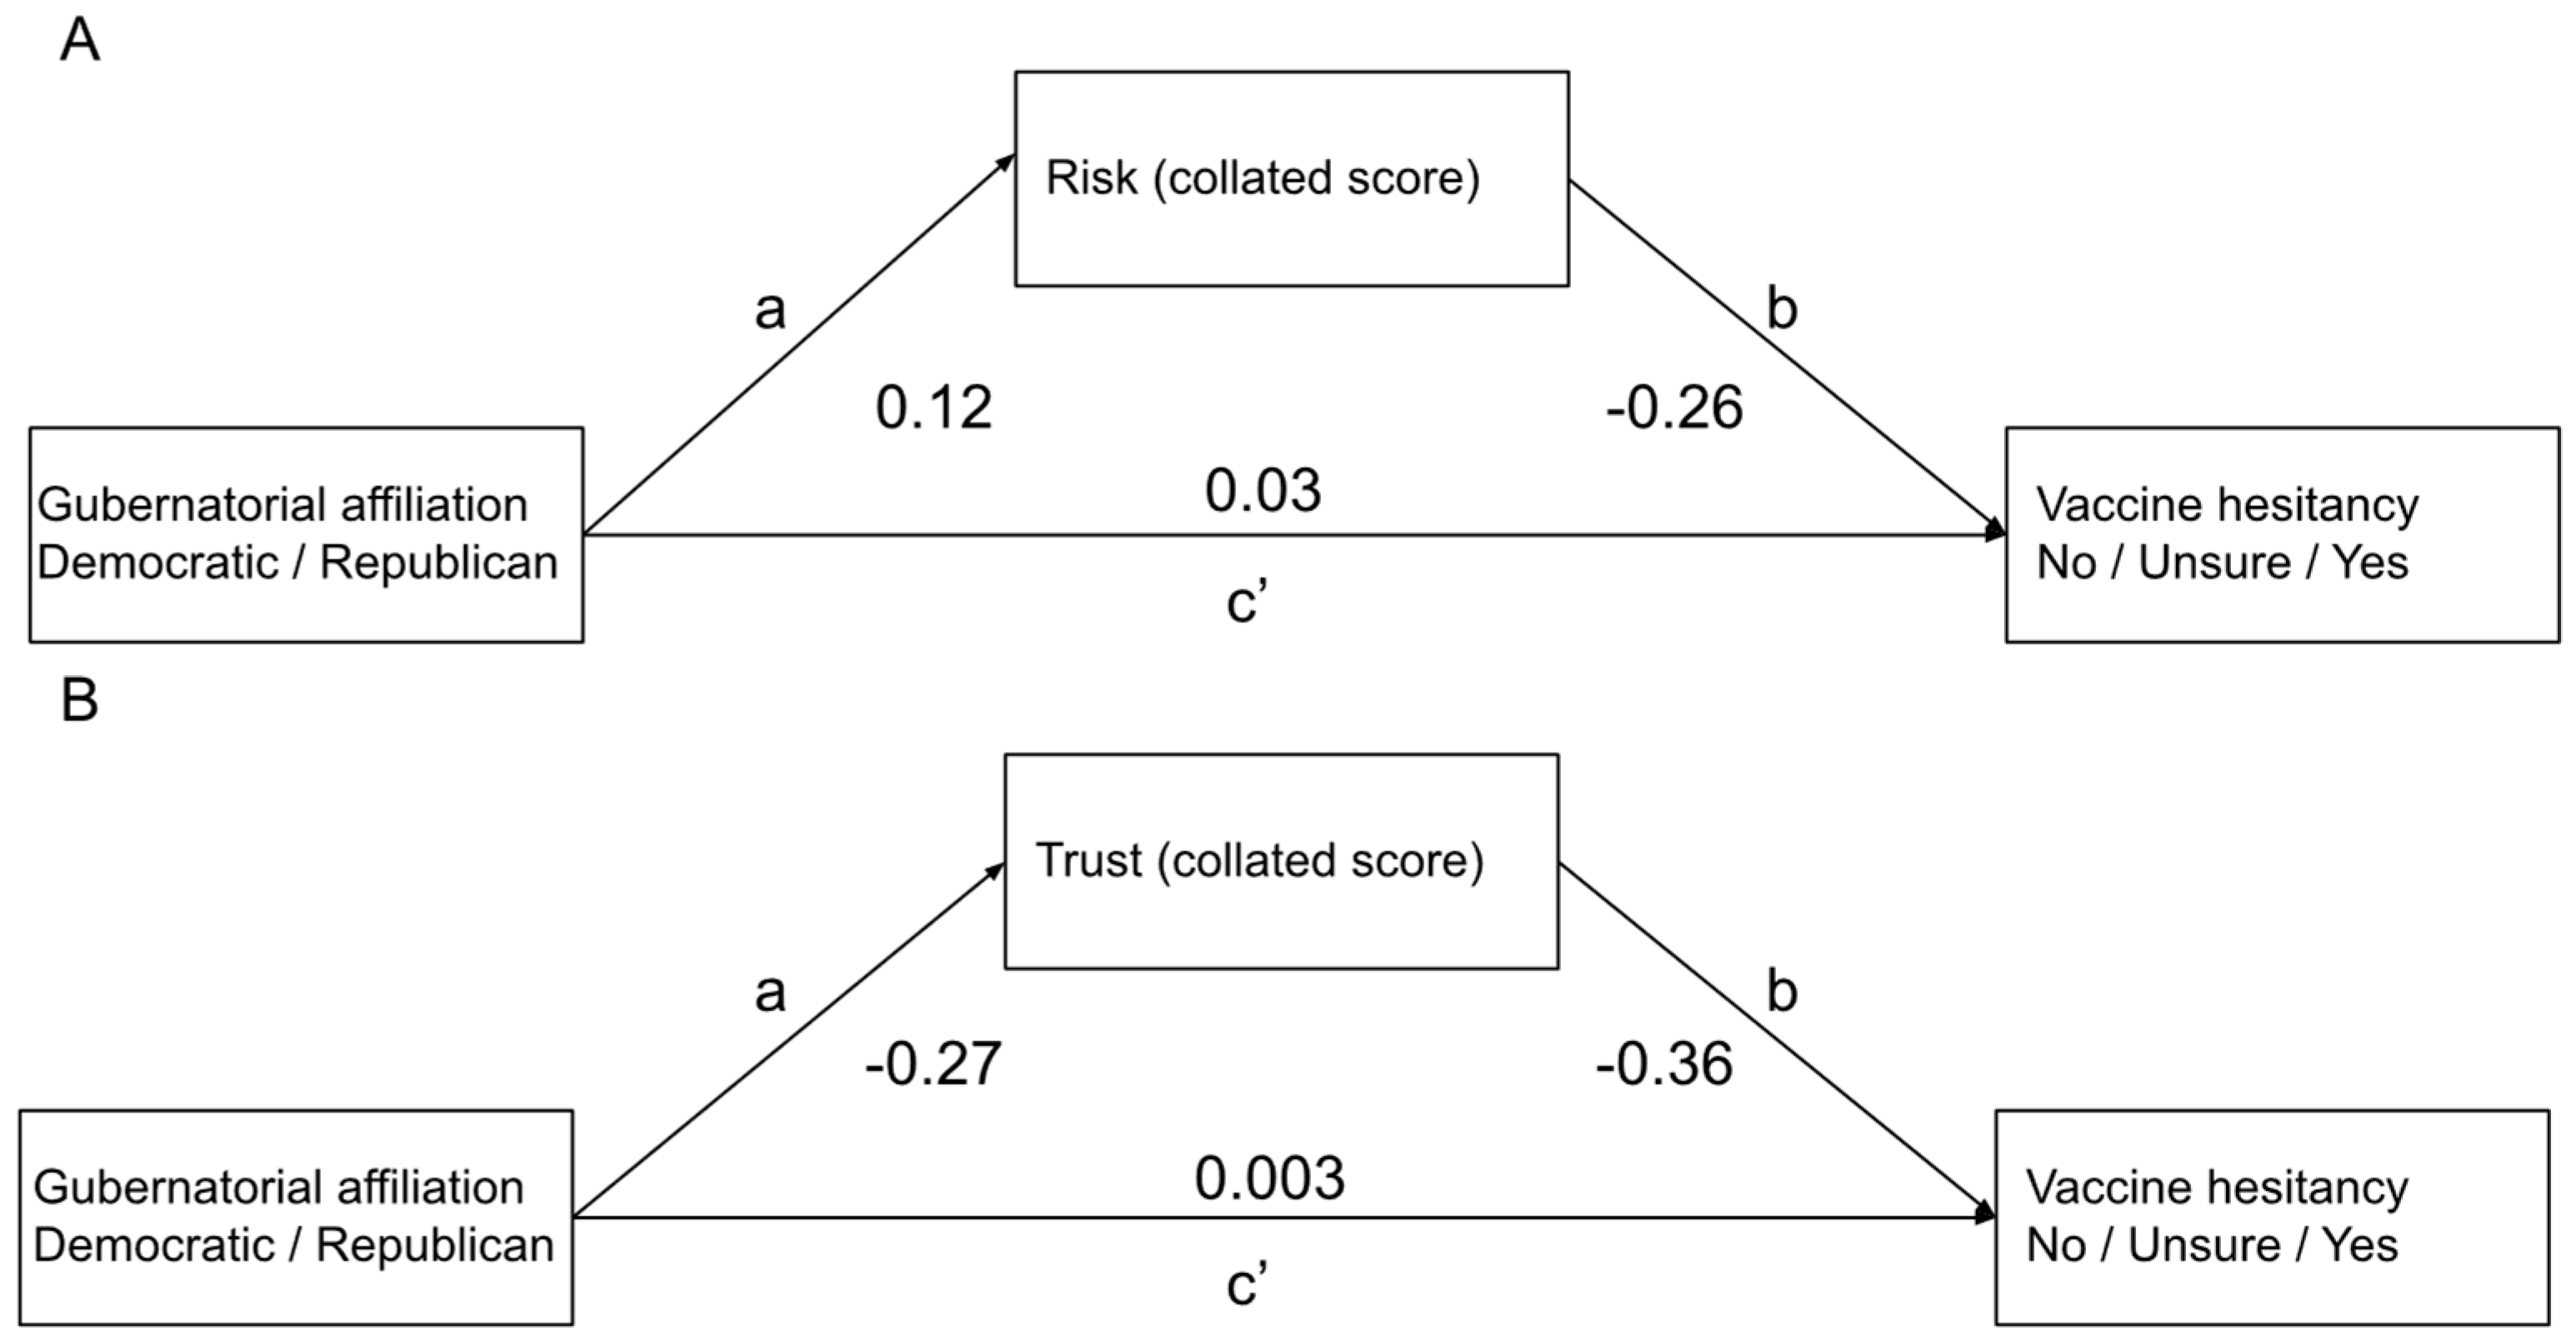
3.3. Risk Perception and Trust Based on Governor’s Political Affiliation
3.4. Gubernatorial Affiliation and Vaccine Hesitancy
4. Discussion
5. Limitations
Author Contributions
Funding
Institutional Review Board Statement
Informed Consent Statement
Data Availability Statement
Acknowledgments
Conflicts of Interest
Abbreviations
| MIT | Massachusetts Institute of Technology |
| FB | |
| CDC | Centers for Disease Control and Prevention |
References
- Silva, S.; Goosby, E.; Reid, M.J.A. Assessing the impact of one million COVID-19 deaths in America: Economic and life expectancy losses. Sci. Rep. 2023, 13, 3065. [Google Scholar] [CrossRef]
- WHO. Ten Threats to Global Health in 2019. Available online: https://www.who.int/news-room/spotlight/ten-threats-to-global-health-in-2019 (accessed on 1 July 2025).
- CDC. Measles Cases and Outbreak. 2025. Available online: https://www.cdc.gov/measles/data-research/index.html (accessed on 1 July 2025).
- Yasmin, F.; Najeeb, H.; Moeed, A.; Naeem, U.; Asghar, M.S.; Chughtai, N.U.; Yousaf, Z.; Seboka, B.T.; Ullah, I.; Lin, C.Y.; et al. COVID-19 Vaccine Hesitancy in the United States: A Systematic Review. Front. Public Health 2021, 9, 770985. [Google Scholar] [CrossRef] [PubMed]
- Wang, Y.; Liu, Y. Multilevel determinants of COVID-19 vaccination hesitancy in the United States: A rapid systematic review. Prev. Med. Rep. 2022, 25, 101673. [Google Scholar] [CrossRef]
- Haeder, S.F. Assessing past and future COVID-19 vaccine hesitancy in the United States in light of federal policy changes. Health Aff. Sch. 2023, 1, qxad073. [Google Scholar] [CrossRef]
- Cooper, C.A. Vaccine hesitancy and respect for public health measures: Citizens’ trust in politicians and public servants across national, subnational and municipal levels of government. SSM-Popul. Health 2023, 22, 101386. [Google Scholar] [CrossRef] [PubMed]
- Lee, C.; Whetten, K.; Omer, S.; Pan, W.; Salmon, D. Hurdles to herd immunity: Distrust of government and vaccine refusal in the US, 2002–2003. Vaccine 2016, 34, 3972–3978. [Google Scholar] [CrossRef]
- Yaqub, O.; Castle-Clarke, S.; Sevdalis, N.; Chataway, J. Attitudes to vaccination: A critical review. Soc. Sci. Med. 2014, 112, 1–11. [Google Scholar] [CrossRef] [PubMed]
- Jennings, W.; Valgarðsson, V.; McKay, L.; Stoker, G.; Mello, E.; Baniamin, H.M. Trust and vaccine hesitancy during the COVID-19 pandemic: A cross-national analysis. Vaccine X 2023, 14, 100299. [Google Scholar] [CrossRef]
- Siddiqui, M.; Salmon, D.A.; Omer, S.B. Epidemiology of vaccine hesitancy in the United States. Hum. Vaccines Immunother. 2013, 9, 2643–2648. [Google Scholar] [CrossRef]
- Harrison, E.A.; Wu, J.W. Vaccine confidence in the time of COVID-19. Eur. J. Epidemiol. 2020, 35, 325–330. [Google Scholar] [CrossRef]
- Schieferdecker, D.; Pfuhl, G.; Kothari, A. The Authorization of the First COVID-19 Vaccines Changed the Level and Nature of Intend to Get Vaccinated. J. Health Commun. 2022, 27, 633–643. [Google Scholar] [CrossRef]
- Milkoreit, M.; Smith, E.K. Rapidly diverging public trust in science in the United States. Public Underst. Sci. 2025, 34, 616–627. [Google Scholar] [CrossRef]
- Biswas, M.R.; Alzubaidi, M.S.; Shah, U.; Abd-Alrazaq, A.A.; Shah, Z. A Scoping Review to Find Out Worldwide COVID-19 Vaccine Hesitancy and Its Underlying Determinants. Vaccines 2021, 9, 1243. [Google Scholar] [CrossRef]
- Viswanath, K.; Bekalu, M.; Dhawan, D.; Pinnamaneni, R.; Lang, J.; McLoud, R. Individual and social determinants of COVID-19 vaccine uptake. BMC Public Health 2021, 21, 818. [Google Scholar] [CrossRef] [PubMed]
- Daly, M.; Robinson, E. Willingness to Vaccinate Against COVID-19 in the U.S.: Representative Longitudinal Evidence From April to October 2020. Am. J. Prev. Med. 2021, 60, 766–773. [Google Scholar] [CrossRef]
- Fridman, A.; Gershon, R.; Gneezy, A. COVID-19 and vaccine hesitancy: A longitudinal study. PLoS ONE 2021, 16, e0250123. [Google Scholar] [CrossRef] [PubMed]
- King, W.C.; Rubinstein, M.; Reinhart, A.; Mejia, R. Time trends, factors associated with, and reasons for COVID-19 vaccine hesitancy: A massive online survey of US adults from January-May 2021. PLoS ONE 2021, 16, e0260731. [Google Scholar] [CrossRef]
- Liu, R.; Li, G.M. Hesitancy in the time of coronavirus: Temporal, spatial, and sociodemographic variations in COVID-19 vaccine hesitancy. SSM-Popul. Health 2021, 15, 100896. [Google Scholar] [CrossRef] [PubMed]
- Dror, A.A.; Eisenbach, N.; Taiber, S.; Morozov, N.G.; Mizrachi, M.; Zigron, A.; Srouji, S.; Sela, E. Vaccine hesitancy: The next challenge in the fight against COVID-19. Eur. J. Epidemiol. 2020, 35, 775–779. [Google Scholar] [CrossRef]
- Lazarus, J.V.; Ratzan, S.C.; Palayew, A.; Gostin, L.O.; Larson, H.J.; Rabin, K.; Kimball, S.; El-Mohandes, A. A global survey of potential acceptance of a COVID-19 vaccine. Nat. Med. 2021, 27, 225–228. [Google Scholar] [CrossRef]
- Ledford, C.J.W.; Cafferty, L.A.; Moore, J.X.; Roberts, C.; Whisenant, E.B.; Garcia Rychtarikova, A.; Seehusen, D.A. The dynamics of trust and communication in COVID-19 vaccine decision making: A qualitative inquiry. J. Health Commun. 2022, 27, 17–26. [Google Scholar] [CrossRef]
- Bass, S.B.; Kelly, P.J.; Hoadley, A.; Arroyo Lloret, A.; Organtini, T. Mapping Perceptual Differences to Understand COVID-19 Beliefs in Those with Vaccine Hesitancy. J. Health Commun. 2022, 27, 49–61. [Google Scholar] [CrossRef]
- Cao, J.; Ramirez, C.M.; Alvarez, R.M. The politics of vaccine hesitancy in the United States. Social. Sci. Q. 2022, 103, 42–54. [Google Scholar] [CrossRef]
- Lim, J.; Moon, K.-K. Political Ideology and Trust in Government to Ensure Vaccine Safety: Using a U.S. Survey to Explore the Role of Political Trust. Int. J. Environ. Res. Public Health 2023, 20, 4459. [Google Scholar] [CrossRef]
- Reiter, P.L.; Pennell, M.L.; Katz, M.L. Acceptability of a COVID-19 vaccine among adults in the United States: How many people would get vaccinated? Vaccine 2020, 38, 6500–6507. [Google Scholar] [CrossRef]
- Adolph, C.; Amano, K.; Bang-Jensen, B.; Fullman, N.; Wilkerson, J. Pandemic Politics: Timing State-Level Social Distancing Responses to COVID-19. J. Health Polit. Policy Law 2021, 46, 211–233. [Google Scholar] [CrossRef]
- Baccini, L.; Brodeur, A. Explaining Governors’ Response to the COVID-19 Pandemic in the United States. Am. Politics Res. 2021, 49, 215–220. [Google Scholar] [CrossRef]
- Neelon, B.; Mutiso, F.; Mueller, N.T.; Pearce, J.L.; Benjamin-Neelon, S.E. Associations Between Governor Political Affiliation and COVID-19 Cases, Deaths, and Testing in the U.S. Am. J. Prev. Med. 2021, 61, 115–119. [Google Scholar] [CrossRef]
- Holt, L.J.; Anselmi, D.; Gasataya, S.A. Predictors of Vaccine Hesitancy in College-Attending Emerging Adults: Implications for Public Health Outreach. Am. J. Health Educ. 2022, 53, 186–195. [Google Scholar] [CrossRef]
- Kirzinger, A.; Sparks, G.; Hamel, L.; Lopes, L.; Kearney, A.; Stokes, M.; Brodie, M. KFF COVID-19 Vaccine Monitor: July 2021. Kaiser Family Foundation. Available online: http://dig.abclocal.go.com/wtvd/docs/KFF%20Vaccine%20Monitor%20Report%20-%20embargoed%20until%205%20AM%20ET%20Wednesday%20August%204.pdf (accessed on 1 July 2025).
- Kelly, B.J.; Southwell, B.G.; McCormack, L.A.; Bann, C.M.; MacDonald, P.D.M.; Frasier, A.M.; Bevc, C.A.; Brewer, N.T.; Squiers, L.B. Predictors of willingness to get a COVID-19 vaccine in the U.S. BMC Infect. Dis. 2021, 21, 338. [Google Scholar] [CrossRef] [PubMed]
- Willis, D.E.; Montgomery, B.E.E.; Selig, J.P.; Andersen, J.A.; Shah, S.K.; Li, J.; Reece, S.; Alik, D.; McElfish, P.A. COVID-19 vaccine hesitancy and racial discrimination among US adults. Prev. Med. Rep. 2023, 31, 102074. [Google Scholar] [CrossRef]
- Cipolletta, S.; Andreghetti, G.R.; Mioni, G. Risk Perception towards COVID-19: A Systematic Review and Qualitative Synthesis. Int. J. Environ. Res. Public Health 2022, 19, 4649. [Google Scholar] [CrossRef]
- Collis, A.; Garimella, K.; Moehring, A.; Rahimian, M.A.; Babalola, S.; Gobat, N.H.; Shattuck, D.; Stolow, J.; Aral, S.; Eckles, D. Global survey on COVID-19 beliefs, behaviours and norms. Nat. Hum. Behav. 2022, 6, 1310–1317. [Google Scholar] [CrossRef]
- Foundation, K.F. State Political Parties. Available online: https://www.kff.org/other/state-indicator/state-political-parties/ (accessed on 1 July 2025).
- R Development Core Team. R Foundation for Statistical Computing: Vienna, Austria, 2023. Available online: https://www.r-project.org/ (accessed on 1 July 2025).
- Tingley, D.; Yamamoto, T.; Hirose, K.; Keele, L.; Imai, K. Mediation: R Package for Causal Mediation Analysis. J. Stat. Softw. 2014, 59, 1–38. [Google Scholar] [CrossRef]
- Latkin, C.A.; Dayton, L.; Strickland, J.C.; Colon, B.; Rimal, R.; Boodram, B. An Assessment of the Rapid Decline of Trust in US Sources of Public Information about COVID-19. J. Health Commun. 2020, 25, 764–773. [Google Scholar] [CrossRef] [PubMed]
- Genovese, C.; La Fauci, V.; Di Pietro, A.; Trimarchi, G.; Odone, A.; Casuccio, A.; Costantino, C.; Restivo, V.; Fantini, M.; Gori, D.; et al. COVID-19: Opinions and behavior of Italian general population during the first epidemic phase. Acta Biomed. 2022, 93, e2022262. [Google Scholar]
- Verger, P.; Dubé, E. Restoring confidence in vaccines in the COVID-19 era. Expert. Rev. Vaccines 2020, 19, 991–993. [Google Scholar] [CrossRef]

| Do Not Trust | Somewhat Trust | Trust | Proportion Trust | |
|---|---|---|---|---|
| Governmental health workers | D: 573 R: 656 | D: 1529 R: 1479 | D: 974 R: 872 | D: 32% R: 29% |
| Local health workers | D: 135 R: 174 | D: 993 R: 1048 | D: 1959 R: 1810 | D: 63% R: 60% |
| Scientists | D: 139 R: 167 | D: 651 R: 761 | D: 2297 R: 2104 | D: 74% R: 69% |
| WHO | D: 498 R: 623 | D: 868 R: 897 | D: 1721 R: 1512 | D: 56% R: 50% |
Disclaimer/Publisher’s Note: The statements, opinions and data contained in all publications are solely those of the individual author(s) and contributor(s) and not of MDPI and/or the editor(s). MDPI and/or the editor(s) disclaim responsibility for any injury to people or property resulting from any ideas, methods, instructions or products referred to in the content. |
© 2025 by the authors. Licensee MDPI, Basel, Switzerland. This article is an open access article distributed under the terms and conditions of the Creative Commons Attribution (CC BY) license (https://creativecommons.org/licenses/by/4.0/).
Share and Cite
Kothari, A.; Godleski, S.A.; Pfuhl, G. The Role of Gubernatorial Affiliation, Risk Perception, and Trust in COVID-19 Vaccine Hesitancy in the United States. COVID 2025, 5, 118. https://doi.org/10.3390/covid5080118
Kothari A, Godleski SA, Pfuhl G. The Role of Gubernatorial Affiliation, Risk Perception, and Trust in COVID-19 Vaccine Hesitancy in the United States. COVID. 2025; 5(8):118. https://doi.org/10.3390/covid5080118
Chicago/Turabian StyleKothari, Ammina, Stephanie A. Godleski, and Gerit Pfuhl. 2025. "The Role of Gubernatorial Affiliation, Risk Perception, and Trust in COVID-19 Vaccine Hesitancy in the United States" COVID 5, no. 8: 118. https://doi.org/10.3390/covid5080118
APA StyleKothari, A., Godleski, S. A., & Pfuhl, G. (2025). The Role of Gubernatorial Affiliation, Risk Perception, and Trust in COVID-19 Vaccine Hesitancy in the United States. COVID, 5(8), 118. https://doi.org/10.3390/covid5080118