Abstract
Adults face a higher risk of exposure to COVID-19 than older adults and children due to their labor force participation. This study investigated the uptake of the initial and second doses of the COVID-19 vaccine among adults, stratified by age, race, ethnicity, sex, and their combinations. Data from the Kentucky Immunization Registry were employed to evaluate temporal changes in COVID-19 vaccine uptake among adults in three age groups (college age: 18–24, prime working age: 25–44, and middle age: 45–64) in Jefferson County, Kentucky (2020 population: 782,969). The analysis explored trends by age, race, and ethnicity; intersections of age with race and ethnicity; and interactions of age–race and age–ethnicity with sex. By May 2022, the highest and lowest COVID-19 vaccination rates were observed among White and Black 45–64-year-old adults: 74.8% and 64.0%, respectively, for dose two. The highest and lowest two-dose vaccination rates at ages 25–44 and 18–24 were also among White and Black residents: 67.9% versus 46.0% and 55.2% versus 35.4%, respectively. Disparities in COVID-19 vaccination by race, ethnicity, sex, and their intersections remained evident during the study period. Efforts in vaccine distribution and promotional initiatives should focus on demographically appropriate strategies.
1. Introduction
COVID-19 can present with a wide range of symptoms, from mild discomfort to severe, life-threatening conditions that lead to hospitalization and death [1]. Another significant complication of COVID-19 is long COVID-19, which the World Health Organization (WHO) defined as a condition where symptoms typically emerge within three months after the initial infection and last at least two months [2]. In May 2022, the United States (U.S.) Centers for Disease Control and Prevention (CDC) used electronic health records and reported that one in five 18–46-year-old adult Americans had long COVID-19 syndrome [3]. Since the majority of them are in the labor force, adults (18–64-year olds) have been faced with a higher risk of COVID-19 infection, as more severe symptoms have been observed among blue-collar, essential, and social workers and school staff, compared to non-workers, particularly in those with underlying health conditions [4,5]. In addition, disparities in healthcare access can aggravate COVID-19 conditions among adults [6].
According to CDC data, COVID-19 had significant health consequences for American adults during major surges in late 2020 and mid-2021. While COVID-19 mortality remained highest among those 75 and older, 50–64-year-old adults also experienced substantial deaths: the mortality rate among them peaked at approximately 25 per 100,000 in January 2021, dropped, and then rose once more to roughly 28 per 100,000 in September 2021 [7]. COVID-19 hospitalizations among 50–64-year-old adults reached 118 per 100,000 in December 2020, dropped subsequently, and rose to approximately 72 per 100,000 in August 2021 and 157 in January 2022 [8]. For adults 40–49 years old, the mortality rate was about 7 per 100,000 in January 2021, decreased until July 2021 when it reached approximately 2 per 100,000, and then increased to approximately 13 deaths per 100,000 in September 2021 [7]. For adults in this age group, the hospitalization rate reached its highest at about 61 per 100,000 in December 2020; it decreased subsequently but had peaks of 48 per 100,000 in April 2021 and 56 per 100,000 in August 2021 as well [8]. Adults aged 18–39 years experienced near-zero deaths during the mentioned period [7]. COVID-19 hospitalization among adults 18–49 years reached approximately 41 per 100,000 in December 2020, dropped below 2 per 100,000 in June 2021, and climbed to approximately 80 per 100,000 in January 2022 [8].
In addition to age, COVID-19 mortality and hospitalization rates differed widely by race, ethnicity, and sex in the U.S., demonstrating that health disparities cannot be attributed to a singular factor; rather, various socioeconomic situations intersect to influence health risks. American Indian and Alaska Native (AI/AN) populations had the highest mortality consistently, reaching a high of approximately 50 deaths per 100,000 in December. White, Hispanic, Black, and Native Hawaiian or Other Pacific Islander populations also experienced high death rates—frequently over 20 or 30 per 100,000—while Asian populations had a lower peak [7]. Between October 2020 and the end of 2021, COVID-19 weekly hospitalization rates also differed widely across racial and ethnic populations in the U.S. American Indian and Alaska Native (AI/AN) populations had the highest hospitalization rates consistently, peaking at over 270 hospitalizations per 100,000 in December. Black, Hispanic, and Native Hawaiian or Other Pacific Islander populations also experienced elevated hospitalization rates—frequently exceeding 80 per 100,000—while White and Asian/Pacific Islander populations had lower peaks [8]. These trends illustrate ongoing racial and ethnic disparities in COVID-19 hospitalization outcomes, emphasizing the need for targeted public health efforts to address these disparities. Noticeable sex differences were reported in COVID-19 outcomes in the U.S. as well, as males consistently experienced higher mortality than females. In January 2021, for example, the total male death rate reached a peak of about 35 deaths per 100,000, while the women’s death rate was approximately 28 per 100,000 [7].
Vaccination before COVID-19 infection can reduce the risk of developing severe symptoms, hospitalization, and death among adults [9]. COVID-19 vaccination is also essential because it is not always possible to determine who will experience mild or severe symptoms [10,11,12,13]. Another critical aspect of adult vaccination is its effect on children’s immunization. Adults’ vaccine acceptance explains vaccine uptake among their children [14]. Therefore, timely access to vaccines is crucial for the prevention of severe COVID-19 outcomes. COVID-19 vaccine prioritization policies varied among states in the U.S. However, most states prioritized frontline health/essential workers, first responders, early education staff, adults 65 plus, and adults with high-risk medical conditions [15].
Kentucky’s COVID-19 vaccine prioritization policy, similar to other states, phased out vaccine dissemination to high-risk populations, as per the CDC’s Advisory Committee on Immunization Practices (ACIP) guideline. Phases 1a (14 December 2020), 1b (1 February 2021), and 1c (1 March 2021) focused on health workers and long-term care facility residents; adults 70 plus and those with high-risk medical conditions; and adults 60 plus and essential workers, respectively. In Phase 2 (6 May 2021), unvaccinated adults 40 plus were eligible for vaccines. The eligibility was expanded to a broader population: adults aged 16 or above in Phase 3 (13 May 2020). Kentucky, relying mostly on federal funds, provided the COVID-19 vaccines free of cost throughout all phases, regardless of one’s insurance status. Also, based on vaccine supply and logistics, there was concurrent vaccination of certain groups within these phases [16].
There is limited literature examining the multidimensional vaccine uptake by more than two combinations of age, sex, race, and ethnicity [17,18]. A study that examined COVID-19 vaccine uptake in age–sex combinations using CDC state immunization registry data showed that 58.0% of American adult women and 53.4% of American adult men had received at least one dose of COVID-19 vaccination by 22 May 2021 [19]. Another study analyzing age–ethnicity–race showed that the COVID-19 vaccination rate was persistently higher among non-Hispanic Asian individuals than among other races and ethnicities [20].
This study analyzed the COVID-19 vaccination trends by each possible combination of race/ethnicity (i.e., race or ethnicity) and sex among adults (18–24, 25–44, and 45–64 years) in the city of Louisville/Jefferson County, Kentucky (2020 population: 782,969). The county’s median household income in 2023 was USD 64,542, 17.0% lower than that in the U.S. [21,22]. Approximately 16.0% of the Jefferson County residents lived in poverty in 2023, compared to 12.5% in the country [21,22]. The county’s poverty rate among adult residents was 14.7%, compared to 11.5% in the country [21,22]. The county’s rates of holding a bachelor’s or higher degree and employment were virtually the same as the country in 2023: 36.8% versus 36.2% and 60.6% versus 60.6%, respectively [21,22]. However, the percentage of the population without health insurance coverage was lower than that in the country: 5.6% versus 7.9% [21,22].
2. Materials and Methods
The Kentucky Immunization Registry (KYIR) data were utilized to find the number of COVID-19-vaccinated adults in the first eighteen months of the COVID-19 vaccination campaign in the U.S., namely December 2020 to May 2022. During the period, all healthcare facilities in Kentucky were mandated to report COVID-19 vaccinations to the KYIR system. KYIR data report basic demographic information about vaccine recipients, such as age in single years, biological sex, race, and ethnicity, as well as their ZIP code, vaccination dates and places, and vaccine manufacturer. Race and ethnicity categories in the KYIR data follow the specific way they are defined in the U.S. censuses. Specifically, race is categorized into seven groups: American Indian or Alaska Native (AI/AN), Asian, Black, Multiracial, Native Hawaiian or Other Pacific Islander (NH/OPI), Some Other Races, and White; ethnicity is categorized into two groups: Hispanic (which describes people with either ancestral ties to Spanish-speaking countries or roots in Latin America or the Caribbean) and non-Hispanic. Vaccine manufacturers include Pfizer, Moderna, and Johnson & Johnson. Pfizer and Moderna recommended the receipt of two doses of their vaccines within three and four weeks, respectively, for the completion of the COVID-19 vaccine series; Johnson & Johnson recommended one dose.
The cumulative number of COVID-19-vaccinated adults was calculated by age-race group (e.g., 18–24-year-old Black adults and 18–24-year-old White adults), age-ethnicity group (e.g., 25–44-year-old Hispanic adults and 25–44-year-old non-Hispanic adults), age-race-sex group (e.g., 45–64-year-old Multiracial female adults and 45–64-year-old Multiracial male adults), and age-ethnicity-sex group (e.g., 18–24-year-old Hispanic female adults and 18–24-year-old non-Hispanic male adults). Race and ethnicity were not combined, such as Hispanic Asian, non-Hispanic Asian, Hispanic Black, non-Hispanic Black, and so on, because of the small number of non-White Hispanic populations in the county.
The proportion of the cumulative number of vaccine recipients in a demographic group to the estimated population of the group was used to calculate the COVID-19 vaccination rate. For example, the proportion of the cumulative number of 45–64-year-old Asian female adults who received at least one dose of a COVID-19 vaccine on a specific date to the estimated population of 45–64-year-old Asian adults in the county was calculated as the one-dose COVID-19 vaccination rate among 45–64-year-old Asian female adults on the given date. Censuses of 2010 and 2020 single-year age population data by ZIP code, sex, race, and ethnicity were used to estimate the demographic groups’ population at county and ZIP code levels.
The 18–24, 25–44, and 45–64 age groups were formed because of their economic and labor market conditions, which also have exposure rate implications. The age groups are also commonly used by the Agency for Healthcare Research and Quality (AHRQ), such as college-age young adults, prime working age, and middle age, respectively, when providing healthcare expenditure summary statistics in the U.S. [23,24]. The same or subgroups of these age groups are used by the U.S. Bureau of Labor Statistics [25,26] and other researchers [27,28,29].
An adult’s age, race, and ethnicity were ascertained from the information provided at the time of the initial dosage. The pertinent data from subsequent doses were used to impute an adult’s demographic information if it was absent at the initial dose. Because of their very small numbers in the county, two reported races (AI/AN and NH/OPI) were not included in the analysis. Since non-Hispanic individuals comprised about 92% of the population in the county, those with missing ethnicity were counted as non-Hispanic. More information about the data organization and refinement is available elsewhere [17].
Statistical proportion tests were performed to compare vaccination rates among demographic groups within and across age groups at the final time point of the study. In particular, racial and ethnic differences in vaccination rates within age groups were tested for statistical significance by dose. In addition, differences between first- and second-dose vaccination rates within age groups, as well as overall vaccination rate differences across age groups by dose, were evaluated for statistical significance.
3. Results
At the end of the study period, 31 May 2022, the analyses included 177,150, 167,522, and 47,575 dose-one-vaccinated adults from the 45–64, 25–44, and 18–24 age groups, respectively. Supplementary Tables S1–S3 show the distribution of vaccinated adults by race, ethnicity, sex, and age. Since a small percentage of the vaccine doses administered in the county were one-dose Johnson & Johnson vaccines (1.28%, equivalent to 17,264 doses), two-dose vaccination can nearly be considered as the completion of the COVID-19 vaccination series.
3.1. Inequalities in Uptake by Adult Age-Race Group
3.1.1. 45–64—Year-Olds
The overall and race-specific COVID-19 vaccination rates among 45–64-year-old Jefferson County adults increased rapidly from March 2021 to April 2021. The rates continued to increase but at a slower pace from April 2021 to May 2022 (Figure 1A,B). By 31 May 2022, the overall dose-one and dose-two COVID-19 vaccination rates in this age group were 85.4% and 72.7%, respectively (Table 1).
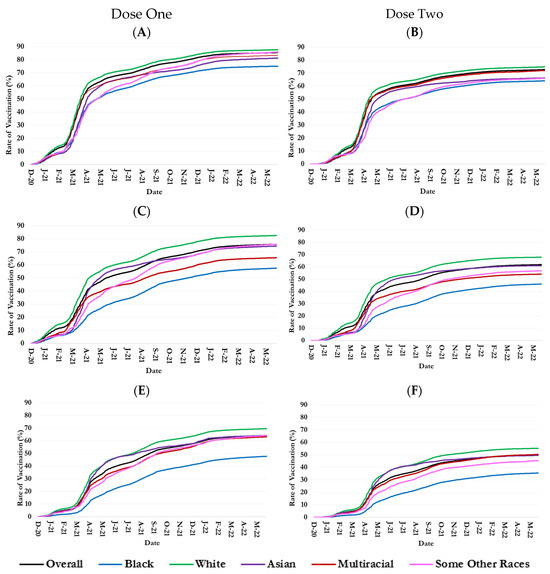
Figure 1.
Trends in one- and two-dose COVID-19 vaccination rates in 18–24-, 25–44-, and 45–64-year-old populations by race in Jefferson County, Kentucky. Age groups: (A) 45–64; (B) 45–64; (C) 25–44; (D) 25–44; (E) 18–24; and (F) 18–24.

Table 1.
Adult vaccination rates by age, race, ethnicity, and sex at the end of the study period, 31 May 2022, in Jefferson County, Kentucky.
During the study period, 1 December 2020–31 May 2022, 45–64-year-old White residents consistently had the highest vaccination rates among all races, reaching 87.6% for dose one and 74.8% for dose two on 31 May 2022, exceeding the overall rates by 2.2% and 2.1%, respectively (Figure 1A,B and Table 1). Initially, 45–64-year-olds of Some Other Races had the second-highest dose-one and dose-two vaccination rates until February 2021. However, they were surpassed by Multiracial individuals until September 2021, when Some Other Races surpassed Multiracial again in the dose-one rate. Dose-one and dose-two vaccination rates by 31 May 2022 were 83.3% and 72.0% among Multiracial and 85.8% and 66.0% among Some Other Races aged 45–64.
The COVID-19 vaccination rates in 45–64-year-old Asian adults were usually among the second or third lowest rates among all racial groups (Figure 1A,B): on 31 May 2022, dose-one and dose-two vaccination rates were 81.3% and 66.3%, respectively (Table 1). Black 45–64-year-old residents consistently had the lowest COVID-19 vaccination rates among all races. Their dose-one vaccination rate was 75.0% on 31 May 2022, 10.4% below the overall vaccination rate (Figure 1A and Table 1), and it was 64.0% for dose two, 8.7% lower than the overall rate (Figure 1B and Table 1).
3.1.2. 25–44—Year-Olds
The overall and race-specific COVID-19 vaccination rates among 25–44-year-old Jefferson County adults increased at a much faster pace during March 2021–May 2021, compared to periods (Figure 1C,D). By 31 May 2022, the overall dose-one and dose-two COVID-19 vaccination rates in this age group were 75.8% and 61.8%, respectively (Table 1).
During the study period, 11 December 2020–31 January 2022, 25–44-year-old White residents consistently had the highest vaccination rates among all races: they reached 82.5% and 67.9% for doses one and two, respectively, on 31 May 2022 (Figure 1C,D and Table 1). The second-highest rates belonged to Asian 25–44-year-old adults for most of the period (Figure 1C,D). On 31 May 2022, their dose-one and dose-two vaccination rates were 74.4% and 61.0%, respectively (Table 1). On the other hand, 25–44-year-old Black adults consistently had the lowest COVID-19 vaccination rates among all races (Figure 1C,D). Their dose-one vaccination rate was 57.5% on 31 May 2022, 18.3% below the overall vaccination rate (Table 1); and 46% for dose two, 15.8% lower than the overall rate (Figure 1D and Table 1).
Multiracial adults and adults of Some Other Race exchanged the second-lowest rank in COVID-19 vaccination rates during the study period. However, Multiracial individuals held the second-lowest rank at the end. At the date, the dose-one vaccination rate among Multiracial 25–44-year-olds was 65.5%, 10.3% below the overall rate (Figure 1C and Table 1); and 54.1% for dose two, 7.7% lower than the overall rate (Figure 1D and Table 1).
3.1.3. 18–24—Year-Olds
The overall and race-specific COVID-19 vaccination rates among 18–24-year-old Jefferson County adults rose rapidly from March 2021 to May 2021, followed by a slowdown in the growth. The overall dose-one and dose-two COVID-19 vaccination rates in this age group were 64.2% and 50.1%, respectively (Table 1).
White 18–24-year-olds persistently had the highest dose-one and dose-two vaccination rates among all races (Figure 1E,F). Asian 18–24-year-olds had the second highest dose-one and dose-two vaccination rates throughout the study period. From May 2021 to August 2021, their vaccination rates aligned with that of their White counterparts (Figure 1E,F). COVID-19 vaccination rates in 18–24-year-old adults of White and Asian races reached, respectively, 69.5% and 64.2% for dose one and 55.2% and 49.5% for dose two on 31 May 2022 (Table 1). Conversely, Black 18–24-year-old adults consistently had the lowest COVID-19 vaccination rates among all races. Their dose-one vaccination rate was 53.7% on 31 May 2022, 12.3% below the overall vaccination rate (Figure 1E and Table 1); and their dose-two vaccination rate was 40.7%, 10.8% lower than the overall rate (Figure 1F and Table 1). COVID-19 vaccination rates among 18–24-year-old Multiracial and Some Other Races adults for dose one were similar and lower than the overall trend in the county during the study period; however, for dose two, Multiracial vaccination rates were analogous to the overall rate but higher than the rate in Some Other Races (Figure 1E,F).
3.2. Inequalities in Uptake by Adult Age-Ethnicity Group
The trends in COVID-19 vaccination rates among non-Hispanic adults closely mimicked the overall trends, as people of non-Hispanic ethnicity constitute most of the county’s population. However, the vaccination rate for the Hispanic population was consistently lower than its non-Hispanic counterpart across the study period for all considered adult age groups (Figure 2).
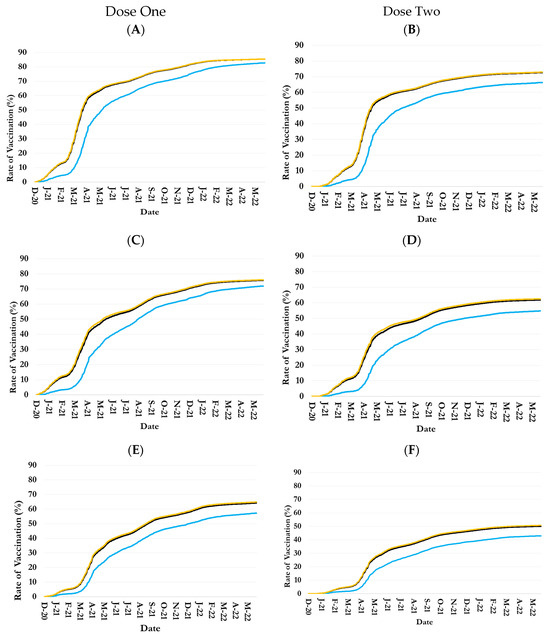

Figure 2.
Trends in one- and two-dose COVID-19 vaccination rates in 18–24-, 25–44-, and 45–64-year-old populations by ethnicity in Jefferson County, Kentucky. Age groups: (A) 45–64; (B) 45–64; (C) 25–44; (D) 25–44; (E) 18–24; and (F) 18–24.
By 31 May 2022, for example, the dose-one and dose-two vaccination rates among Hispanic 45–64-year-old adults were 82.7% and 66.3%, respectively, versus 85.4% and 72.9% among their non-Hispanic counterparts (Figure 2A,B and Table 1). At the date, the rates among Hispanic 25–44-year-old adults were 71.9% and 54.8%, respectively, versus 71.6% and 62.5% among their non-Hispanic counterparts (Figure 2C,D and Table 1). At ages 18–24 years, the dose-one and dose-two vaccination rates among Hispanic adults were 57.2% and 43%, respectively, versus 64.8% and 50.7% among non-Hispanic adults on 31 May 2022 (Figure 2E,F and Table 1).
3.3. Inequalities in Uptake by Adult Age-Race-Sex Group
The non-race- or non-ethnicity-specific COVID-19 vaccination rates among female adults were consistently higher than those of male adults, regardless of age group (Figure 3 and Figure 4). However, there were major disparities among racial and ethnic groups in the sex differences in COVID-19 vaccination rates (Figure 3 and Figure 4).
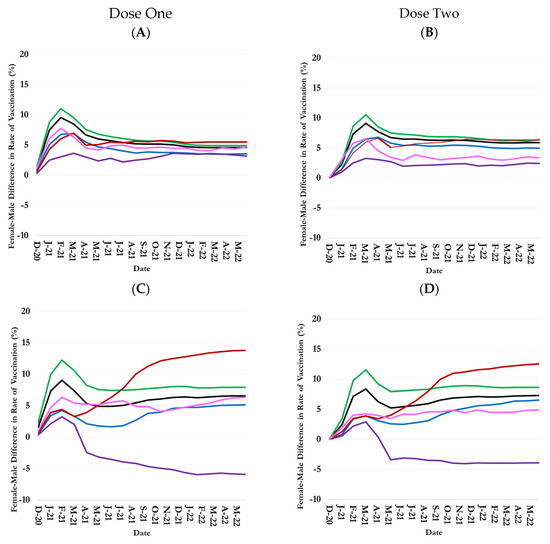
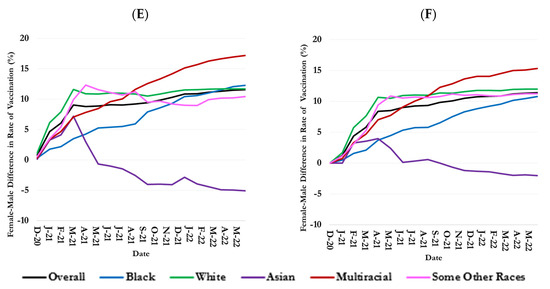
Figure 3.
Sex difference (female minus male) in one- and two-dose COVID-19 vaccination rates over time by adult age group and race in Jefferson County, Kentucky. Age groups: (A) 45–64; (B) 45–64; (C) 25–44; (D) 25–44; (E) 18–24; and (F) 18–24.
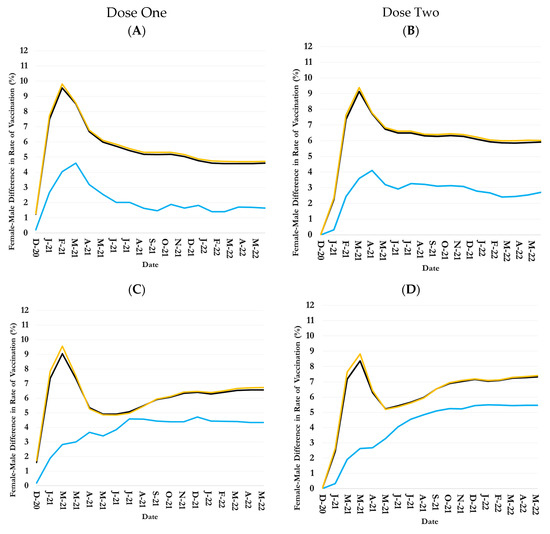
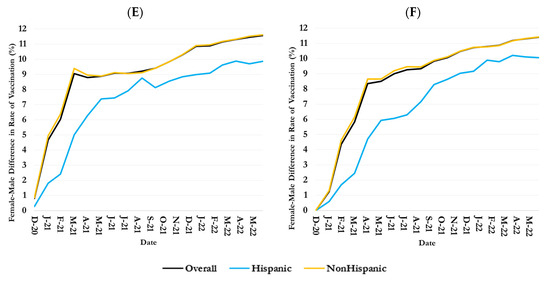
Figure 4.
Sex differences (female minus male) in one- and two-dose COVID-19 vaccination rates over time by adult age group and ethnicity in Jefferson County, Kentucky. Age groups: (A) 45–64; (B) 45–64; (C) 25–44; (D) 25–44; (E) 18–24; and (F) 18–24.
3.3.1. 45–64—Year-Olds
The female–male difference in vaccination rates (i.e., female vaccination rate minus male vaccination rate) among 45–64-year-old adults rose rapidly from December 2020 until March 2021 (Figure 3A,B), then started to decrease until May 2021. The difference remained largely stable thereafter. On 31 May 2022, the rates of dose-one and dose-two vaccinations among 45–64-year-old female adults in the county were 4.9% and 5.9% greater than their male counterparts (Table 1). Notably, the female–male difference in the COVID-19 vaccination rate was the largest among White 45–64-year-old adults in the county: it was 6.4% for dose two on 31 May 2022 (Table 1). The smallest was among Asian 45–64-year-olds: it was 2.5% for dose two on 31 May 2022 (Table 1).
3.3.2. 25–44—Year-Olds
The female–male difference in vaccination rates among 25–44-year-old adults increased sharply from December 2020 to February 2021, while the overall vaccination rate during this period in this age group also increased Figure 1C,D and Figure 3C,D). The difference dropped subsequently but remained largely constant from September 2021 (Figure 3C,D). At the end of the study period, dose-one and dose-two vaccination rates among 25–44-year-old female adults were 6.6% and 7.3% greater than those among 25–44-year-old male adults on 31 May 2022 (Table 1). The trends in female–male differences in vaccination rates among White, Black, and Some Other Race 25–44-year-old adults largely paralleled the overall trend, although the difference was consistently higher than average among White 25–44-year-olds but lower than average among Black and Some Other Race 25–44-year-olds (Figure 3C,D). On 31 May 2022, the dose-one and dose-two vaccination rates among White female adults in the age group were 7.9% and 8.7% greater than that among their male counterparts, respectively; they were 5.2% and 6.5% greater among female Black adults of the same age (Figure 3C,D and Table 1).
For Asian individuals, the female–male difference in vaccination rates was positive until April 2021 but turned negative thereafter. At the end of the study period, Asian females were 5.9% and 3.9% less vaccinated than their male counterparts for doses one and two, respectively, which is an exception compared to other racial groups (Figure 3C,D and Table 1).
The Multiracial female–male difference in vaccination rates among 25–44-year-old adults increased continuously during the study period: at the end of the study period, the dose-one and dose-two vaccination rates among 25–44-year-old female adults of the Multiracial group were 10.3% and 7.7% higher than their male counterparts (Figure 3C,D and Table 1).
3.3.3. 18–24—Year-Olds
Female 18–24-year-old adults were vaccinated more than male adults in most racial groups (Figure 3E,F). However, sex differences in the COVID-19 vaccination rate were much higher among 18–24-year-old adults than older adult age groups (Figure 3E,F).
The highest female–male difference was in the Multiracial and White (Figure 3E,F) groups. On 31 May 2022, 18–24-year-old female adults of the Multiracial group were, respectively, 17.2% and 15.3% more dose-one and dose-two vaccinated than their male counterparts; the female–male differences in the vaccination rates among White 18–24-year-old adults were 11.7% and 12.0%, respectively. Similar to the 25–44 age group, Asian females in this age group were less vaccinated than males (Figure 3E,F and Table 1).
The sharp fluctuations in female–male differences for certain racial/ethnic groups (e.g., Asian, Some Other Races) for the 18–24 age group were due to the smaller number of vaccinated people in these categories. For instance, the total numbers of vaccinated Asian female and male adults for this age group were 918 and 865, respectively, compared to 30,601 females and 16,612 males among White adults. As a result, even minor variations in the numbers of vaccinated males and females over time for this Asian racial group led to more noticeable fluctuations in the figure.
3.4. Inequalities in Uptake by Adults Age-Ethnicity-Sex Group
COVID-19 vaccination rates among 45–64-year-old female adults were persistently greater than those of male adults of both Hispanic and non-Hispanic ethnicities (Figure 4A,B). By 31 May 2022, the dose-one and dose-two COVID-19 vaccination rates among Hispanic 45–64-year-old female adults were respectively 1.6% and 2.7% greater than their male counterparts, compared to 4.7% and 6.0% female-male differences among non-Hispanic 45–64-year-old adults (Figure 4A,B and Table 1).
COVID-19 vaccination rates among 25–44-year-old non-Hispanic female adults were persistently greater than those of their male counterparts (Figure 4C,D). By 31 May 2022, the female–male differences in dose-one and dose-two COVID-19 vaccination rates among non-Hispanic 25–44-year-old adults reached 4.3% and 5.5%, respectively, compared to 6.7% and 7.4% female–male differences among non-Hispanic 25–44-year-old adults (Figure 4C,D and Table 1).
The female–male difference in COVID-19 vaccination rates was much higher among 18–24-year-old adults of Hispanic and non-Hispanic ethnicities than older adults (Figure 4E,F). The dose-one and dose-two female–male differences in vaccination rates among Hispanics were 9.9% and 10.1%, respectively, compared to 11.6% and 11.4% differences for non-Hispanic individuals for this age group on 31 May 2022 (Figure 4E,F and Table 1).
4. Discussion
While receiving at least two doses of the COVID-19 vaccine is notably beneficial [30], the two-dose COVID-19 vaccination rate was statistically significantly lower than the one-dose rate during the study period in Jefferson County, Kentucky (Figure 1). On 31 May 2022, for example, the two-dose rate was at least 12.8 percentage points lower than the one-dose rate in all adult age groups (Table 1). This finding is similar to national findings during the periods that largely overlapped with this study period [31].
Also, the difference in vaccination rates between adult age groups was statistically significant (Supplementary Table S4). White residents consistently demonstrated the highest COVID-19 vaccine uptake of doses one and two in the county among adults aged 18–64 years (Figure 1). Moreover, the difference in White and non-White residents’ vaccination rates was statistically significant (Supplementary Table S5). Asians often had the second-highest COVID-19 vaccination rates (Figure 1). The CDC’s National Immunization Survey Adult COVID Module highlighted Asian residents in the U.S. as the leading racial group vaccinated against COVID-19 with more than one dose [20]. The differences (i.e., White residents leading in Jefferson County and Asians nationwide) can be attributed to persistent disparities in urban areas and in the Midwest region of the U.S., where vaccination access and uptake vary across racial groups [20,32].
Since the initial rollout of the COVID-19 vaccine, Black adults in the county exhibited a persistent low COVID-19 vaccination uptake, a pattern that continued during the study period (Figure 1). This finding in Jefferson County, Kentucky, aligns with the findings of other studies in the U.S. [33,34]. Previous studies have identified four prominent barriers to receiving the COVID-19 vaccine among Black citizens: a lack of trust in the healthcare system, limited healthcare access, limited access to resources, and poor health literacy [34]. Historical structural racism has shaped the distribution of social determinants of health and risk factors to a large extent in the U.S. and has fostered disparities in vaccine hesitancy [35]. This is due primarily to a lack of trust, stemming from both historical and ongoing trauma regarding the potential side effects of the COVID-19 vaccine and the healthcare system [35,36]. These barriers have also contributed to lagging rates of booster shots among Black residents [37,38].
In Jefferson County, Kentucky, the Black–White gap in the COVID-19 vaccine uptake grew over time, with a substantial increase in disparity among 25–44-year-olds, followed by 18–24-year-olds (Figure 1). This widening gap in vaccine uptake between Black Americans and other racial groups is linked to the lack of trust, as studies support the evidence that individuals are less likely to get vaccinated if they do not have faith in the source of information regarding vaccine efficacy and safety [39,40,41]. Recent reports have documented evidence revealing that nearly 7 out of 10 Black Americans believe patients are treated unjustly in healthcare settings when they belong to a certain race and ethnicity [42]. In addition, the rapid development, approval, and distribution of vaccines provided a limited opportunity to tackle issues related to their vaccine efficacy and safety within Black communities [43]. Moreover, Black adults in the county represent a smaller proportion of those with a bachelor’s degree or higher than their White counterparts (26.2% versus 39.4%) [44], which restricts access to vital COVID-19 information and further affects vaccination rates within this population [45].
Among the Multiracial group, individuals aged 18–24 years had some of the highest COVID-19 vaccination rates, while those aged 25–44 years within the same racial groups had a relatively lower vaccination rate, although still higher than the group with the lowest coverage, which was the Black adults (Figure 1). During the 2021–2022 season, Multiracial adults in the U.S. aged 18–49 experienced greater influenza vaccination coverage than Black adults [46].
Hispanic adults in the county across all age groups exhibited a lower COVID-19 vaccination uptake than non-Hispanic adults of the same age groups (Figure 2). The non-Hispanic and Hispanic disparity in vaccine coverage diminished as age increased (Figure 2). The 2022 National Health Interview Survey findings were congruent with this study’s results, revealing that Hispanic adults above 19 years had lower rates of tetanus and Tdap vaccinations than the non-Hispanic adults of the same group [47]. Vaccination acceptance is shaped by cultural factors, and while Latinos are often viewed as a homogenous group, they represent a diverse range of nations of origin, each with unique perspectives on vaccines [48]. This diversity is compounded by challenges such as limited access to services and information that are both linguistically appropriate and culturally relevant, financial barriers, and widespread misconceptions about vaccine side effects [36,49]. Additionally, cultural practices, including skepticism toward non-natural medicines, often lead to a preference for traditional herbal or home remedies, which can reinforce the perception that vaccination is not necessary [48]. A vaccine uptake study conducted among Los Angeles adults confirmed higher odds of delaying the COVID-19 vaccination among Latinos than the non-Latino groups [49].
Adult females of all races and ethnicities had a greater COVID-19 vaccination uptake than their male counterparts in the county, except for 18–44-year-old Asian adults, where males were more often vaccinated against COVID-19 than females (Figure 3 and Figure 4). Other researchers have observed trends in the U.S. similar to those in this study, where females of different races consistently outpaced males of the same racial group in influenza vaccination rates [50], as the opinion about the ineffectiveness of the COVID-19 vaccine, feeling that its risks outweigh the benefits, and the rate of expressing mistrust of the vaccine have been more prevalent among men than women [51]. Therefore, early healthcare access, a more proactive approach to health, and heightened awareness of preventive health behaviors may contribute to a higher willingness among adult women to get vaccinated.
This study’s provided evidence on multidimensional inequalities in COVID-19 vaccine uptake highlights the importance of the intersectional evaluation of health and healthcare access inequalities, described by the intersectionality theory, according to which no single demographic or socioeconomic factor determines health, and various social statuses intersect in shaping health risk [52]. Such studies, however, need to go beyond demographic factors and include economic stability, access to and the quality of healthcare services, and neighborhood and physical environments.
Data limitations could have influenced the findings of this study. A primary challenge was the inconsistent documentation of the Multiracial and Some Other Race categories across vaccine doses, leading to an overrepresentation of these groups in the vaccination data relative to their county populations as reported in U.S. census records. Given the absence of a standardized approach to resolving these discrepancies in racial classification, an algorithm was devised to address this issue [17]. Furthermore, individuals with unknown ethnicity were classified as non-Hispanic to align the number of vaccinated individuals by ethnicity with their respective county population. This approach may have led to an underestimation of the Hispanic population. Also, if specific demographic information was missing when receiving a vaccine dose, it was imputed using the most frequently reported data from all preceding and succeeding doses. Most importantly, the study did not account for socioeconomic determinants of health, such as income, employment, education, healthcare access, and health literacy, in explaining substantial demographic differences in COVID-19 vaccine uptake. Such information is not provided in the KYIR data at the individual level.
5. Conclusions
Public health organizations should devise demographically appropriate strategies to promote vaccination uptake. For example, the success of any program to increase Black individuals’ vaccination rate depends on understanding the root causes of the low COVID-19 vaccination rate among them, especially the lack of trust in the healthcare system and limited access to resources, and considering devising multisector interventions that engage stakeholders. Increasing Hispanic residents’ vaccine uptake also depends on understanding the root causes of their barriers, particularly financial barriers, restricted access to health services, and information that is language-accessible and culturally tailored. In addition, barriers to access to vaccines among Asian residents must be identified and addressed. Moreover, promoting vaccine uptake among males and females requires adopting strategies that account for sex differences in motivation for vaccinations and the roots of vaccine hesitancy.
Future research should use rich data to investigate the reasons for not receiving the complete series of vaccines (including COVID-19) and consider access barriers and behavioral factors.
Supplementary Materials
The following supporting information can be downloaded at: https://www.mdpi.com/article/10.3390/covid5050075/s1, Table S1: Frequencies and percentages of COVID-19 vaccination among the 18–24-year-olds in Jefferson County, Kentucky, by dose number, sex, race, and ethnicity; Table S2: Frequencies and percentages of COVID-19 vaccination among the 25–44-year-olds in Jefferson County, Kentucky, by dose number, sex, race, and ethnicity; Table S3: Frequencies and percentages of COVID-19 vaccination among the 45–64-year-olds in Jefferson County, Kentucky, by dose number, sex, race, and ethnicity. Table S4: p-values from proportion tests assessing vaccination rate differences across age groups for each dose on 31 May 2022. Table S5: p-values from proportion tests assessing vaccination rate differences between females and males, White and other racial groups, and Hispanic and non-Hispanic groups within the age group by dose on 31 May 2022.
Author Contributions
Conceptualization, all authors; methodology, S.M.K., M.Y.A.P., S.H.S., H.Z., B.B.L. and A.G.; validation, S.M.K., M.M., M.Y.A.P., S.H.S., H.Z. and S.P.; formal analysis, S.M.K., M.M., M.Y.A.P., S.H.S., H.Z. and S.P.; resources, T.I. and A.G.; data curation, S.M.K., M.Y.A.P., S.H.S., H.Z., T.A., Y.-T.C. and A.G.; writing—original draft preparation S.M.K., M.M. and V.A.; writing—review and editing, all authors; visualization, S.M.K., M.M., M.Y.A.P., S.H.S. and S.P.; supervision, S.M.K. and A.G. All authors have read and agreed to the published version of the manuscript.
Funding
This research was supported through funding to the University of Louisville from the Louisville Metro Department of Public Health and Wellness, Louisville Metro Government, Louisville, Kentucky, from the American Rescue Fund (grant OGMB220965A) and CDC’s National Initiative to Address COVID-19 Health Disparities Among Populations at High-Risk and Underserved, Including Racial and Ethnic Minority Populations and Rural Communities (grant OGMB220965B).
Institutional Review Board Statement
This study was approved by the Institutional Review Board (IRB) at the University of Louisville (approval no. 22.0681) on 6 September 2022 and by the IRB at the Kentucky Cabinet for Health and Family Services (approval no. CHFS-IRB-DPH-FY22-33) on 1 November 2022.
Informed Consent Statement
Patient consent was waived because the research involved no more than minimal risk to the participants, as secondary COVID-19 surveillance data were used, and participants were not directly involved in this research. Therefore, the probability and magnitude of harm or discomfort anticipated in the research were minimal. Patient consent was also waived because the research could not be practicably carried out without waiver or alteration.
Data Availability Statement
The datasets presented in this article are not readily available because they are proprietary and protected by federal law. Requests to access the datasets should be directed to Louisville Metro Department of Public Health and Wellness (LMPHW). More information about the LMPHW data request processing can be found at https://louisvilleky.gov/government/health-wellness/public-health-data-reports (accessed on 2 April 2025).
Conflicts of Interest
The authors declare no conflicts of interest. The funder had no role in the study design, data curation and analysis, interpretation of findings, the writing of the article, or the decision to submit for publication.
Abbreviations
The following abbreviations are used in this manuscript:
| AI/AN | American Indian and Alaska Native |
| CDC | Centers for Disease Control and Prevention |
| KYIR | Kentucky Immunization Registry |
| NH/OPI | Native Hawaiian or Other Pacific Islander |
| U.S. | United States |
| WHO | World Health Organization |
References
- Centers for Disease Control and Prevention. Symptoms of COVID-19. Available online: https://www.cdc.gov/covid/signs-symptoms/index.html (accessed on 10 February 2025).
- World Health Organization. Post COVID-19 Condition (Long COVID). Available online: https://www.who.int/europe/news-room/fact-sheets/item/post-COVID-19-condition (accessed on 10 February 2025).
- Bull-Otterson, L. Post–COVID conditions among adult COVID-19 survivors aged 18–64 and ≥65 years—United States, March 2020–November 2021. MMWR Morb. Mortal. Wkly. Rep. 2022, 71, 713–717. [Google Scholar] [CrossRef]
- CDC COVID-19 Response Team. Preliminary estimates of the prevalence of selected underlying health conditions among patients with coronavirus disease 2019—United States, February 12–March 28, 2020. MMWR Morb. Mortal. Wkly. Rep. 2020, 69, 382–386. [Google Scholar] [CrossRef]
- Rosengren, A.; Söderberg, M.; Lundberg, C.E.; Lindgren, M.; Santosa, A.; Edqvist, J.; Åberg, M.; Gisslén, M.; Robertson, J.; Cronie, O. COVID-19 in people aged 18–64 in Sweden in the first year of the pandemic: Key factors for severe disease and death. Glob. Epidemiol. 2022, 4, 100095. [Google Scholar] [CrossRef] [PubMed]
- Bergersen, K.V.; Pham, K.; Li, J.; Ulrich, M.T.; Merrill, P.; He, Y.; Alaama, S.; Qiu, X.; Harahap-Carrillo, I.S.; Ichii, K. Health disparities in COVID-19: Immune and vascular changes are linked to disease severity and persist in a high-risk population in Riverside County, California. BMC Public Health 2023, 23, 1584. [Google Scholar] [CrossRef]
- Centers for Disease Control and Prevention. COVID Data Tracker. Available online: https://covid.cdc.gov/covid-data-tracker/#demographicsovertime (accessed on 13 February 2025).
- Centers for Disease Control and Prevention. COVID-19 Tracker. Available online: https://covid.cdc.gov/covid-data-tracker/#covidnet-hospitalization-network (accessed on 13 February 2025).
- Perlis, R.H.; Santillana, M.; Ognyanova, K.; Safarpour, A.; Trujillo, K.L.; Simonson, M.D.; Green, J.; Quintana, A.; Druckman, J.; Baum, M.A. Prevalence and correlates of long COVID symptoms among US adults. JAMA Netw. Open 2022, 5, e2238804. [Google Scholar] [CrossRef] [PubMed]
- Lewis, N.M.; Naioti, E.A.; Self, W.H.; Ginde, A.A.; Douin, D.J.; Keipp Talbot, H.; Casey, J.D.; Mohr, N.M.; Zepeski, A.; Gaglani, M. Effectiveness of mRNA vaccines against COVID-19 hospitalization by age and chronic medical conditions burden among immunocompetent US adults, March-August 2021. J. Infect. Dis. 2022, 225, 1694–1700. [Google Scholar] [CrossRef]
- Tenforde, M.W.; Self, W.H.; Zhu, Y.; Naioti, E.A.; Gaglani, M.; Ginde, A.A.; Jensen, K.; Talbot, H.K.; Casey, J.D.; Mohr, N.M.; et al. Protection of mRNA vaccines against hospitalized COVID-19 in adults over the first year following authorization in the United States. Clin. Infect. Dis. Off. Publ. Infect. Dis. Soc. Am. 2022, 76, e460–e468. [Google Scholar] [CrossRef]
- Dagan, N.; Barda, N.; Kepten, E.; Miron, O.; Perchik, S.; Katz, M.A.; Hernán, M.A.; Lipsitch, M.; Reis, B.; Balicer, R.D. BNT162b2 mRNA COVID-19 vaccine in a nationwide mass vaccination setting. N. Engl. J. Med. 2021, 384, 1412–1423. [Google Scholar] [CrossRef]
- Centers for Disease Control and Prevention. COVID Data Tracker. Available online: https://covid.cdc.gov/covid-data-tracker/#vaccine-effectiveness (accessed on 13 February 2025).
- Ruiz, J.B.; Bell, R.A. Parental COVID-19 vaccine hesitancy in the United States. Public Health Rep. 2022, 137, 1162–1169. [Google Scholar] [CrossRef]
- Jain, V.; Schwarz, L.; Lorgelly, P. A rapid review of COVID-19 vaccine prioritization in the US: Alignment between federal guidance and state practice. Int. J. Environ. Res. Public Health 2021, 18, 3483. [Google Scholar] [CrossRef]
- Cabinet for Health and Family Services. Kentucky’s COVID-19 Vaccination Plan; U.S. Department of Health and Human Services, Centers for Disease Control and Prevention: Atlanta, GA, USA, 2021.
- Karimi, S.M.; Parh, M.Y.A.; Shakib, S.H.; Zarei, H.; Aranha, V.; Graham, A.; Allen, T.; Khan, S.M.; Moghadami, M.; Antimisiaris, D. COVID-19 vaccine uptake inequality among older adults: A multidimensional demographic analysis. Am. J. Infect. Control. 2025, 53, 115–125. [Google Scholar] [CrossRef] [PubMed]
- Karimi, S.M.; Khan, S.M.; Moghadami, M.; Parh, M.Y.A.; Shakib, S.H.; Zarei, H.; Poursafargholi, S.; Little, B.B. Multidimensional Demographic Analyses of COVID-19 Vaccine Inequality in the United States: A Systematic Review. Healthcare 2025, 13, 139. [Google Scholar] [CrossRef]
- Diesel, J.; Sterrett, N.; Dasgupta, S.; Kriss, J.L.; Barry, V.; Vanden Esschert, K.; Whiteman, A.; Cadwell, B.L.; Weller, D.; Qualters, J.R.; et al. COVID-19 Vaccination Coverage Among Adults—United States, December 14, 2020–May 22, 2021. MMWR Morb. Mortal. Wkly. Rep. 2021, 70, 922–927. [Google Scholar] [CrossRef] [PubMed]
- Kriss, J.L.; Hung, M.C.; Srivastav, A.; Black, C.L.; Lindley, M.C.; Lee, J.T.; Koppaka, R.; Tsai, Y.; Lu, P.J.; Yankey, D.; et al. COVID-19 vaccination coverage, by race and ethnicity—National immunization survey adult COVID module, United States, December 2020–November 2021. MMWR Morb. Mortal. Wkly. Rep. 2022, 71, 757–763. [Google Scholar] [CrossRef]
- United States Census Bureau. Jefferson County, Kentucky. Available online: https://data.census.gov/profile/Jefferson_County,_Kentucky?g=050XX00US21111#employment (accessed on 13 March 2025).
- United States Census Bureau, United States. 2023. Available online: https://data.census.gov/profile/United_States?g=010XX00US (accessed on 13 March 2025).
- Medical Expenditure Panel Survey. 2022 FULL YEAR CONSOLIDATED DATA CODEBOOK. Available online: https://meps.ahrq.gov/mepsweb/data_stats/download_data_files_codebook.jsp?PUFId=H243&varName=AGE31X (accessed on 20 February 2025).
- Medical Expenditure Panel Survey. Information on the Health Status of Americans, Health Insurance Coverage, and Access, Use, and Cost of Health Services. Available online: https://datatools.ahrq.gov/meps-hc/ (accessed on 20 February 2025).
- U.S. Bureau of Labor Statistics. Labor Force Statistics from the Current Population Survey. Available online: https://www.bls.gov/cps/cpsaat48.htm (accessed on 13 March 2025).
- U.S. Bureau of Labor Statistics. NUMBER OF JOBS, LABOR MARKET EXPERIENCE, MARITAL STATUS, AND HEALTH FOR THOSE BORN 1957–1964; U.S. Bureau of Labor Statistics: Washington, DC, USA, 2023.
- Wang, Y.; Lee, J.S.; Pollack, L.M.; Kumar, A.; Honeycutt, S.; Luo, F. Health Care Expenditures and Use Associated with Hypertension Among US Adults. Am. J. Prev. Med. 2024, 67, 820–831. [Google Scholar] [CrossRef]
- Karimi, S.M.; Eslami, K.; Johnson, C.E. US health care expenditure across income groups by age and type of care. J. Health Care Poor Underserved 2021, 32, 958–970. [Google Scholar] [CrossRef] [PubMed]
- DeVoe, J.E.; Wallace, L.S.; Fryer, G.E., Jr. Patient age influences perceptions about health care communication. Fam. Med. 2009, 41, 126. [Google Scholar]
- Guo, F.; Adekanmbi, V.; Hsu, C.D.; Polychronopoulou, E.; Berenson, A.B. One dose versus two doses of COVID-19 vaccine for the prevention of breakthrough infections among people previously infected with SARS-CoV-2. J. Med. Virol. 2024, 96, e29391. [Google Scholar] [CrossRef]
- Lu, P.-j.; Srivastav, A.; Vashist, K.; Black, C.L.; Kriss, J.L.; Hung, M.-C.; Meng, L.; Zhou, T.; Yankey, D.; Masters, N.B. COVID-19 booster dose vaccination coverage and factors associated with booster vaccination among adults, United States, March 2022. Emerg. Infect. Dis. 2023, 29, 133. [Google Scholar] [CrossRef]
- DiRago, N.V.; Li, M.; Tom, T.; Schupmann, W.; Carrillo, Y.; Carey, C.M.; Gaddis, S.M. COVID-19 vaccine rollouts and the reproduction of urban spatial inequality: Disparities within large US cities in March and April 2021 by racial/ethnic and socioeconomic composition. J. Urban Health 2022, 99, 191–207. [Google Scholar] [CrossRef]
- Funk, C.; Tyson, A. Growing Share of Americans Say They Plan to Get a COVID-19 Vaccine–or Already Have; Pew Research Cente: Washington, DC, USA, 2021. [Google Scholar]
- Roat, C.; Webber-Ritchey, K.J.; Spurlark, R.S.; Lee, Y.-M. Black Americans receiving the COVID-19 vaccine and effective strategies to overcome barriers: An integrative literature review. J. Racial Ethn. Health Disparit. 2023, 10, 2577–2587. [Google Scholar] [CrossRef]
- Egede, L.E.; Walker, R.J. Structural racism, social risk factors, and COVID-19—A dangerous convergence for Black Americans. N. Engl. J. Med. 2020, 383, e77. [Google Scholar] [CrossRef]
- Khubchandani, J.; Sharma, S.; Price, J.H.; Wiblishauser, M.J.; Sharma, M.; Webb, F.J. COVID-19 vaccination hesitancy in the United States: A rapid national assessment. J. Community Health 2021, 46, 270–277. [Google Scholar] [CrossRef]
- Division, N. Joint Statement from HHS Public Health and Medical Experts on COVID-19 Booster Shots. Available online: https://www.hhs.gov/about/news/2021/08/18/joint-statement-hhs-public-health-and-medical-experts-covid-19-booster-shots.html (accessed on 20 February 2025).
- Vogel, L.; Duong, D. What’s the evidence for COVID-19 booster shots? CMAJ 2021, 193, E1400–E1401. [Google Scholar] [CrossRef]
- Brownlie, J.; Howson, A. ‘Leaps of faith’and MMR: An empirical study of trust. Sociology 2005, 39, 221–239. [Google Scholar] [CrossRef]
- Goldenberg, M.J. Public misunderstanding of science? Reframing the problem of vaccine hesitancy. Perspect. Sci. 2016, 24, 552–581. [Google Scholar]
- Yaqub, O.; Castle-Clarke, S.; Sevdalis, N.; Chataway, J. Attitudes to vaccination: A critical review. Soc. Sci. Med. 2014, 112, 1–11. [Google Scholar] [CrossRef]
- Hamel, L.; Lopes, L.; Muñana, C.; Artiga, S.; Brodie, M. Race, health, and COVID-19: The views and experiences of Black Americans. In Key Findings from the KFF/Undefeated Survey on Race and Health; Kaiser Family Foundation: Menlo Park, CA, USA, 2020. [Google Scholar]
- Niño, M.D.; Hearne, B.N.; Cai, T. Trajectories of COVID-19 vaccine intentions among US adults: The role of race and ethnicity. SSM-Popul. Health 2021, 15, 100824. [Google Scholar] [CrossRef]
- U.S. Census Bureau. Available online: https://data.census.gov/table/ACSST1Y2023.S1501?q=United+States&t=Educational+Attainment&g=010XX00US_050XX00US21111 (accessed on 13 March 2025).
- Okoro, O.; Kennedy, J.; Simmons, G.; Vosen, E.C.; Allen, K.; Singer, D.; Roberts, R. Exploring the scope and dimensions of vaccine hesitancy and resistance to enhance COVID-19 vaccination in Black communities. J. Racial Ethn. Health Disparit. 2021, 2117–2130. [Google Scholar] [CrossRef]
- Black, C.L.; O’Halloran, A.; Hung, M.C.; Srivastav, A.; Lu, P.J.; Garg, S.; Jhung, M.; Fry, A.; Jatlaoui, T.C.; Davenport, E.; et al. Vital signs: Influenza hospitalizations and vaccination coverage by race and ethnicity—United States, 2009–2010 through 2021–22 influenza seasons. MMWR Morb. Mortal. Wkly. Rep. 2022, 71, 1366–1373. [Google Scholar] [CrossRef]
- Hung, M.C.; Srivastav, A.; Lu, P.-j.; Black, C.L.; Lindley, M.C.; Singleton, J.A. Vaccination Coverage Among Adults in the United States, National Health Interview Survey, 2022. Centers for Disease Control and Prevention. Available online: https://www.cdc.gov/adultvaxview/publications-resources/adult-vaccination-coverage-2022.html#:~:text=In%202022%2C%20COVID%2D19%20vaccination,among%20adults%20aged%20%E2%89%A565years (accessed on 26 February 2025).
- Smith, D.G.; Smith, C.D.; DeLeon, J.A.; Sandoz, J.L.; Ochoa, C.O.; Pearson, M.P.; Macena, R.H. Factors influencing COVID-19 vaccine uptake among Latinos: A cross-sectional study. PLoS ONE 2024, 19, e0302332. [Google Scholar] [CrossRef] [PubMed]
- Gadoth, A.; Halbrook, M.; Martin-Blais, R.; Gray, A.; Tobin, N.H.; Ferbas, K.G.; Aldrovandi, G.M.; Rimoin, A.W. Assessment of COVID-19 Vaccine Acceptance Among Health Care Workers in Los Angeles. medRxiv 2020. [Google Scholar] [CrossRef]
- Syan, S.K.; Gohari, M.R.; Levitt, E.E.; Belisario, K.; Gillard, J.; DeJesus, J.; MacKillop, J. COVID-19 vaccine perceptions and differences by sex, age, and education in 1367 community adults in Ontario. Front. Public Health 2021, 9, 719665. [Google Scholar] [CrossRef] [PubMed]
- Puzio, A. Why Is There Such A Gender Gap In COVID-19 Vaccination Rates? Available online: https://fivethirtyeight.com/features/why-is-there-such-a-gender-gap-in-COVID-19-vaccination-rates/ (accessed on 26 February 2025).
- Williams, D.R.; Lawrence, J.A.; Davis, B.A. Racism and health: Evidence and needed research. Annu. Rev. Public Health 2019, 40, 105–125. [Google Scholar] [CrossRef]
Disclaimer/Publisher’s Note: The statements, opinions and data contained in all publications are solely those of the individual author(s) and contributor(s) and not of MDPI and/or the editor(s). MDPI and/or the editor(s) disclaim responsibility for any injury to people or property resulting from any ideas, methods, instructions or products referred to in the content. |
© 2025 by the authors. Licensee MDPI, Basel, Switzerland. This article is an open access article distributed under the terms and conditions of the Creative Commons Attribution (CC BY) license (https://creativecommons.org/licenses/by/4.0/).