Article

The Harmful Impact of COVID-19 on Adiposity Markers and Cognitive Development in Maya Children

by
Enrique Barbosa-Martín
1,
Barbara Pena-Espinoza
1,2,
Rachel Escalante-Sosa
3,
Shérlin May-Kim
1,
Katy Sánchez-Pozos
4,
María Guadalupe Ortiz-López
4,
Emmanuel Torre-Horta
5 and
Marta Menjivar
1,2,3,*
1
Laboratorio de Genómica de la Diabetes, Facultad de Química, Universidad Nacional Autónoma de México Campus Yucatán, Mérida 97302, Mexico
2
Unidad de Medicina Personalizada en el Hospital Regional de Alta Especialidad de la Península de Yucatán, Mérida 97130, Mexico
3
Laboratorio de Diabetes, Facultad de Química de la Universidad Nacional Autónoma de México, Ciudad de México 04510, Mexico
4
División de Investigación, Hospital Juárez de México, Av. Instituro Politecnico Nacional 5160, Ciudad de México 07760, Mexico
5
Servicios de Salud de Yucatán, Mérida 97000, Mexico
*
Author to whom correspondence should be addressed.
COVID 2025, 5(10), 164; https://doi.org/10.3390/covid5100164
Submission received: 30 July 2025 / Revised: 19 September 2025 / Accepted: 23 September 2025 / Published: 25 September 2025
(This article belongs to the Section COVID Public Health and Epidemiology)

Abstract

The isolation period during the COVID-19 pandemic significantly altered physical activity and social interactions in children, with disproportionately severe effects in impoverished indigenous communities. To evaluate the impact of the COVID-19 pandemic on body composition and cognitive status in Maya children. A prospective study conducted from March 2020 (pre-COVID) to April 2022 (post-COVID) involving 80 school-aged children from Tahdziú, Yucatán, México. Somatometric, cognitive, and dietary parameters were assessed. Post-pandemic assessments revealed a statistically significant increase in the prevalence of excess body fat mass (2.5% vs. 16.3%)*, fat arm area (7.6% vs. 20%)*, and fat mass index (5.1% vs. 16.3%)*. There was also an upward trend in excess body weight (24.1% vs. 31.1%) and cardiometabolic risk index (24.1% vs. 32.5%). High rates of undernutrition persisted (78.8% and 76.3%), as did impaired cognitive function (13.8% and 21.3%). Additionally, 97.8% of children reported a low-dietary-quality (HEI score < 80). The pandemic negatively impacted body composition, increasing adiposity markers associated with future cardiometabolic risk. It also exacerbated pre-existing vulnerabilities, as evidenced by low diet quality and worsening cognitive performance, potentially contributing to long-term educational disparities in this population.

1. Introduction

In México, the binomial poverty marginalization has characterized indigenous communities for years, particularly the Maya population [1]. Yucatán is located in the southeast of Mexico with the highest proportion of indigenous Maya inhabitants in the country [2]. In the state of Yucatán, the official poverty and marginalization figures are alarming, as it has been reported that 40.8% of the population lives in poverty (83.6% live in moderate poverty, and 16.4% live in extreme poverty). Of all the 106 municipalities in Yucatán, Tahdziú has the highest poverty rate [3].
Particularly for the Maya child population, poverty and marginalization generate greater probabilities of compromising their development as a result of the direct effects on health and education. Regarding the negative impact on health, undernutrition and excess weight conditions have been reported in rural and semi-urbanized Maya children populations [4].
Undernutrition problems (short stature and underweight) lead to a severe restriction in children’s nutritional reserves, generating abnormalities in fat, muscle [5], and bone mass [6], and in cerebral tissue [7]. On the other hand, children with excess weight (overweight and obesity) develop adipose hypertrophy and hyperplasia, which they maintain throughout their lives [8]. Hence, excess weight impacts adiposity markers such as body fat, fat arm area, tricipital skinfold, and waist circumference [4] and elicits an uncontrolled inflammatory response that leads to cardiometabolic complications [8]. In this context, some indices used in children to determine the cardiometabolic risk associated with excessive weight are the fat mass index [9] and the waist-to-height ratio [10].
Undernutrition and excess weight conditions can appear individually or simultaneously; the latter is known as the “double burden of malnutrition”. A characteristic manifestation of the double burden of malnutrition is the coexistence of overnutrition alongside undernutrition [11].
Alterations associated with overnutrition and undernutrition can occur as a result of poverty and marginalization; implicit food insecurity leads to a lack of food and low-quality food intake [12]. Besides poverty and an imbalanced diet, the coexistence of aspects such as limited access to safe water, lack of health services, and unsanitary excreta disposal are factors that contribute to the development of nutrition-related metabolic abnormalities in the Maya child population [13,14]. This harsh reality highlights the early onset of metabolic diseases in the early adult life of the Maya population.
All the nutritional alterations mentioned above have a transgenerational effect since high rates of cardiometabolic problems and diabetes have been reported in the Maya adult population [15].
Another factor associated with food insecurity in children is cognitive development [7], as it is closely related to nutritional status [16]. Specifically, nutrition deficiencies have been related to poor cognitive development. Deficiencies in daily protein, essential amino acid, vitamin, mineral, and polyunsaturated fatty acid intake affect the development of the central nervous system and generate alterations in cognitive function [16]. In children, it has been shown that nutritional backwardness due to chronic undernutrition is negatively related to cognitive ability [7].
Additionally, to the environment of backwardness and poverty previously discussed, in recent years, it has been documented that conditions during the COVID-19 pandemic, like lockdown and closure of educational, sports, and recreational centers, mainly triggered the appearance of somatometric [17], metabolic [18], and cognitive [19] alterations in children. Furthermore, in Mexico, where social disadvantage and food insecurity prevail, since 2020, the National Institute of Public Health has warned that the children and adolescents most affected by the pandemic are those from vulnerable rural communities [20]. Thus, the present study aimed to assess school-age children living in Maya communities in backwardness affected by the COVID-19 pandemic to identify alterations in body composition, nutritional status, and cognitive ability.

2. Materials and Methods

2.1. Study Design and Participants

The present work was an observational and prospective study consisting of three periods: pre-COVID, inter-COVID, and post-COVID. The two periods, pre- and post-COVID, included somatometric, dietary, and cognitive indicators that were assessed before the COVID-19 pandemic (pre-COVID). In addition, due to COVID restrictions, an inter-COVID evaluation was performed only for the dietary record.
School-age children from Tahdziú, a Maya community from southern Yucatán, México, were included. Measurements were made directly at school centers. Therefore, 114 and 86 children were evaluated in the pre-COVID and post-COVID periods, respectively. Post-COVID evaluation was conducted once the pandemic conditions allowed entry into Maya communities and return to face-to-face activities. To perform a paired analysis between the pre-COVID and post-COVID periods, of the total sample, 80 children were selected. (Scheme 1).
This study was performed in accordance with the principles of the Declaration of Helsinki. The Study was approved by the Human Ethics Committee of the Hospital Regional de Alta Especialidad de la Península de Yucatán (HRAEPY 2018-002). Both children and their parents provided voluntary consent to participate. Written informed consent was obtained from the participants (children) and their legal guardians (parents).

2.2. Somatometric and Clinical Evaluation

Somatometric measurements were carried out by trained nutritionists (the same evaluators both times), who performed standardized measurements in duplicate. The following measures were performed on the children without shoes and wearing light clothing: height (SECA 217 portable stadiometer, SECA, Hamburg, Germany ), weight (SECA 869 digital scale, SECA, Hamburg, Germany), body composition by bioimpedance (TANITA BC-1500, TANITA, Tokyo, Japan) [21], blood pressure (OMRON baumanometer, OMRON, Kyoto, Japan) [22], tricipital skinfold (LANGE caliper, LANGE, Sonoma, CA, USA), and waist and arm circumference (LUFKIN flexible tape, LUFKIN, Medina, OH, USA) [23]. Waist circumference was taken from the equidistant point between the lower edge of the last rib and the upper edge of the iliac crest [23]. The tricipital skinfold was taken vertically, in the middle of the tricipital muscle, at the midpoint between the acromion and the olecranon [23]. Fat mass and fat arm area were calculated based on formulas for the Mexican child population validated by Alpízar et al. [8] and by Ramírez et al. [24], respectively.
Z-scores of height-for-age (HAZ) and BMI-for-age (BMIZ) [25] were calculated, all of them considering the height, age, and sex of participants. Percentiles of tricipital skinfold, fat arm area, waist [26], and systolic blood pressure [27] were also determined considering age, sex, and height. Fat mass index (FMI) [8] and waist-to-height ratio (WHtR) [10] were also calculated. Growth alterations were defined as undernutrition, which is the addition of the linear growth deficiency (LGD) (short height, HAZ ≤ −1.99 to −1) [4] and the stunting (HAZ ≤ −2 SD); excess of weight (BMIZ > 1 SD) [25]; and double burden of malnutrition (DBM) (HAZ ≤ −2 SD + BMIZ > 1 SD) [4].

2.3. Cognitive Evaluation

The human figure drawing (HFD) methodology was applied to assess cognitive ability [28], considering the child’s sex and age. To evaluate concordance, two independent evaluators were assigned cognitive scores, with a high level of agreement (kappa = 0.98, p = 0.04).
The HFD was selected as the sole cognitive assessment tool because it is a validated, non-verbal instrument that can be administered quickly and without specialized equipment, making it feasible in remote, low-literacy indigenous settings. Although cultural bias is an inherent consideration in cognitive testing, the HFD evaluates developmental maturity through universal human figure components, reducing dependence on language, formal schooling, or culturally specific content.

2.4. Dietetic Evaluation

Before and after the COVID pandemic period, a month of dietary data by the frequency of dietary consumption was recorded [29]. The Healthy Eating Index (HEI) [30] was estimated according to the Food and Nutrition Service of the U.S. Department of Agriculture (USDA). A total score of HEI ≤ 80 was defined as “low dietary quality”.
Once the COVID-19 pandemic began, the indigenous community decided to restrict outside access. It was only after the first year of the pandemic that special permission was approved to enter and collect data on the children’s food consumption frequency. We recorded details on all foods and beverages consumed in the previous 24 h. The study collected details on type, preparation, portion size, and timing, using visual aids. Frequencies of dietetic alterations were calculated based on the Recommended Dietary Allowances (RDAs) for the Mexican school-age population [29].

2.5. Statistical Analysis

The normality of data was assessed using the Kolmogorov–Smirnov test. For data with a normal distribution, the paired t-Student was used. For data with no normal distribution, the Wilcoxon signed rank was used. A comparison of proportions was performed using X2 with Yates’ correction. Finally, Cohen’s Kappa test was performed to estimate the degree of agreement between evaluators of cognitive analysis. p-values < 0.05 were considered significant. IBM SPSS Statistics 21 software was used.

3. Results

3.1. Follow-Up Evaluation

In pre-COVID, 114 participants (51.8% boys and 48.2% girls) aged 8–11 years were evaluated, whereas in the post-pandemic period, 86 children (48.8% boys and 51.2% girls) were assessed. To explore the pandemic impact on somatometric and cognitive parameters, comparisons of frequency alterations were made for children who had a follow-up evaluation in post-COVID (n = 80) (Table 1).
A total of 35% and 38.8% (p = 0.660) of the children in pre-COVID and post-COVID had a linear growth deficiency, respectively. In addition, 43.8% and 37.5% of the children were identified as stunted in pre-COVID and post-COVID, respectively (p = 0.472). Interestingly, the data indicate that the undernutrition in the Maya children was present before COVID-19 in such a high frequency that it makes it difficult to estimate the impact of the pandemic on this population (undernutrition frequency 78.8% and 76.3%).
The frequencies of excess weight were 24.1% in pre-COVID and 31.1% in post-COVID (p = 0.342). The frequencies of overweight were 16.5% and 21.3% (p = 0.588), and obesity was 7.6% and 10% (p = 0.804), respectively.
It was also determined that <8% of the children had DBM at both times evaluated (p = 0.371). Considering those children with normal weight and height, frequencies were 15.2% and 12.5% (p = 0.838) in pre-COVID and post-COVID, respectively. After the pandemic, the frequency of children with excess body fat increased sevenfold (2.5% vs. 16.3%, p = 0.001), and the frequency of both high arm fat area and high fat mass index increased threefold (7.6% vs. 20%, p = 0.024 and 5.1% vs. 16.3%, p = 0.011, respectively). In both times evaluated, 20% of the children had elevated systolic blood pressure (22.5% vs. 16.3%, p = 0.284), central obesity (16.5% vs. 26.3%, p = 0.168), and high WHtR (24.1% vs. 32.5%, p = 0.210). Regarding cognitive analysis, the children in both times had a low cognitive score (13.8% vs. 21.3%, p = 0.264) (Table 1). Table S1 shows the differences between children with and without clinical and somatometric alterations in the two evaluated periods, highlighting the impact of the pandemic on these parameters.

3.2. Comparisons Between Boys and Girls

In post-COVID, both boys and girls observed significant increases in body fat and fat mass index. In particular, in girls, a decrease in HAZ was observed (p = 0.045), while in boys, an increase in waist circumference was determined (p = 0.010) (Table 2). Table S2 presents pediatric data expressed in percentiles, adhering to internationally recognized cut-off points and identifying boys and girls at cardiometabolic risk during the COVID-19 pandemic. These findings are visually complemented by the spaghetti plots, which depict the individual changes for each boy (Figure S1) and each girl (Figure S2) across the two evaluated periods, thereby providing a clearer view of the pandemic’s impact on this vulnerable population.

3.3. Dietetic Evaluation

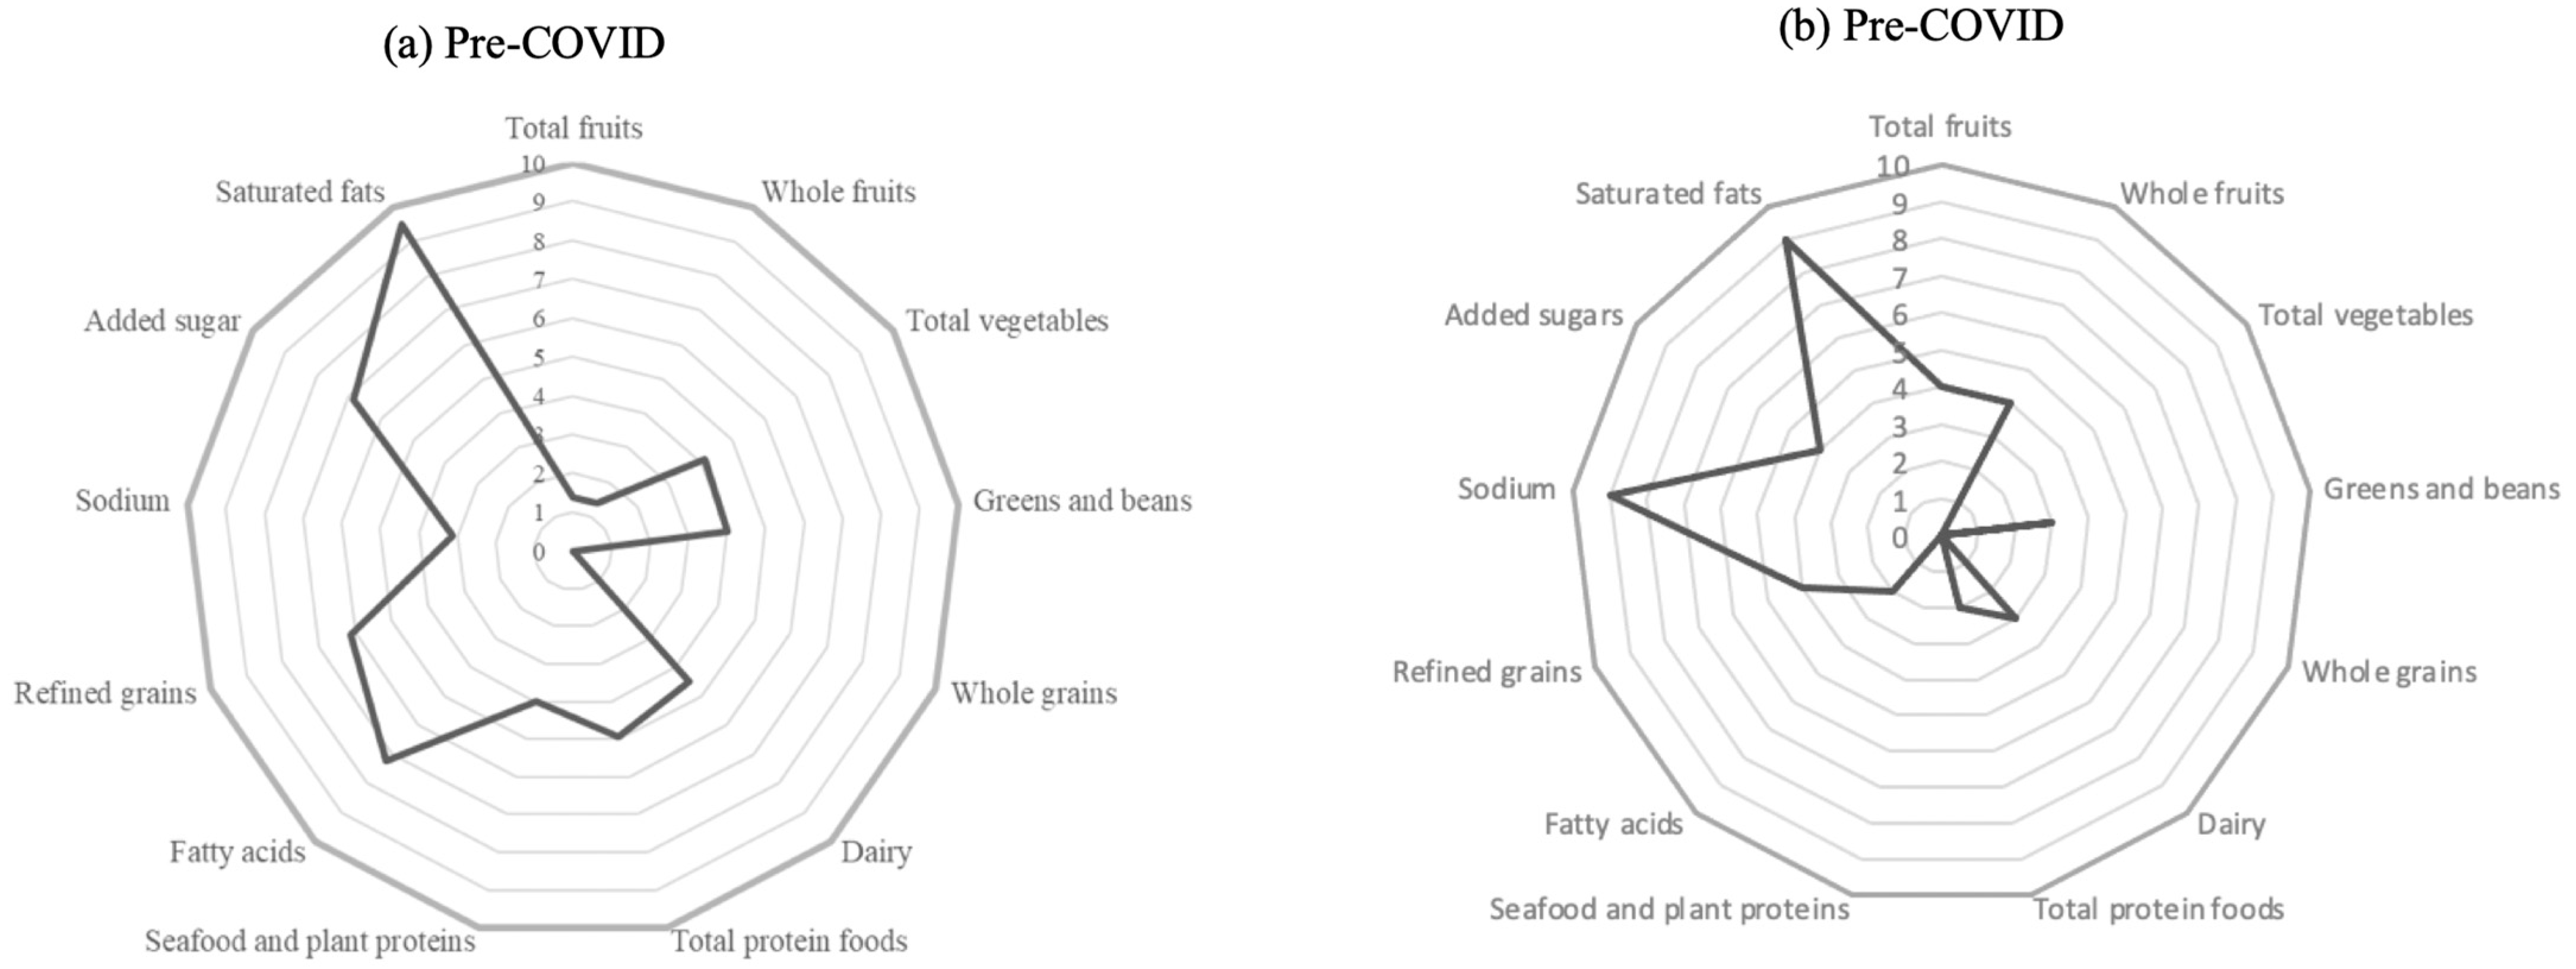
Tahdziú is considered one of the poorest communities in Latin America. In this study, the dietary quality of children and their families was evaluated both before and after the COVID-19 pandemic. The findings are concerning: prior to the pandemic, the average dietary quality score was 57 points, which declined to 46 points after the pandemic (Figure 1). In both periods, dietary quality remained well below the minimum recommended threshold of 80 points. Energy intake was within the recommended values for the group before or after the pandemic (1681 [1181, 2185] kcal and 1667 [1302, 2022] kcal, respectively). However, when considered alongside dietary quality, these findings indicate that the consumed calories came predominantly from energy-dense, high-fat foods that were poor sources of essential nutrients crucial for child growth and development.
Given the poor dietary quality observed among children before the pandemic and considering that a year had passed since its onset, special permission was obtained during 2021 (inter-COVID period) to enter the community and conduct a 24 h dietary recall. This assessment aimed to identify nutritional deficiencies in children and provide targeted food support from the Yucatan health services.
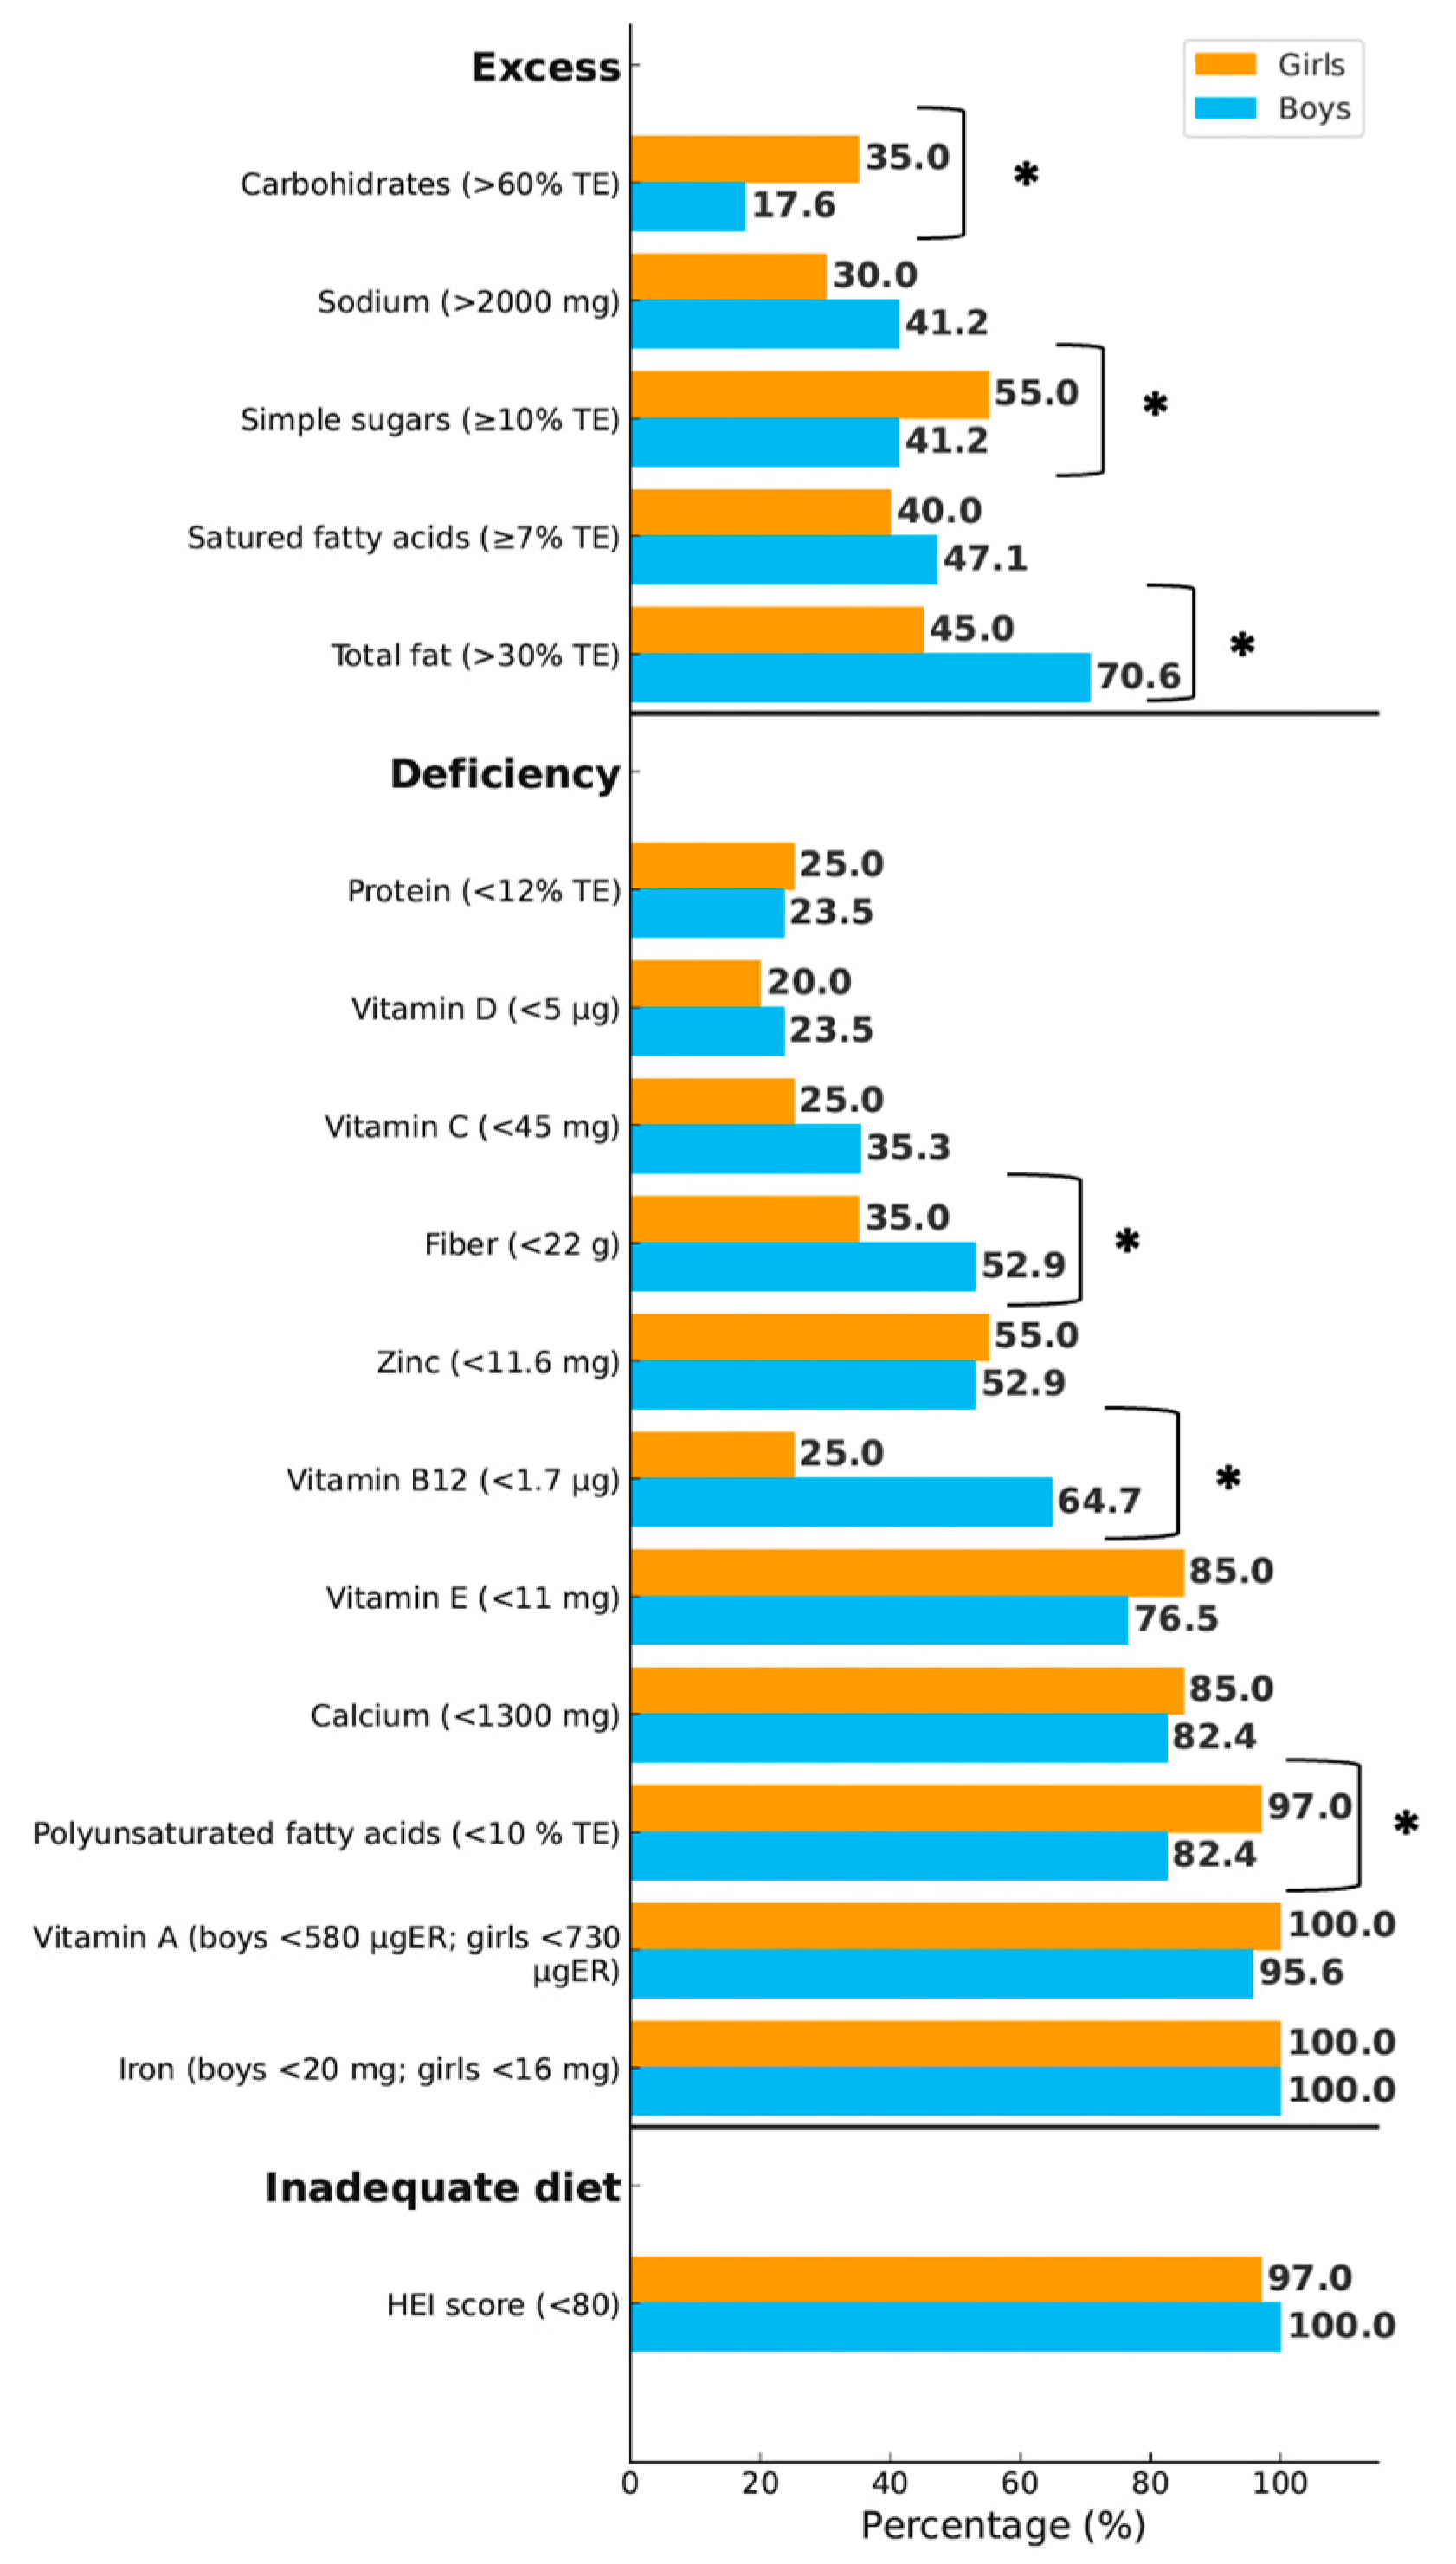
The results revealed excessive intake of carbohydrates, simple sugars, total fat, and saturated fatty acids, exceeding recommended levels (Figure 2). Concurrently, there were marked deficiencies in essential nutrients such as proteins, polyunsaturated fatty acids, calcium, fiber, and vitamin B12. In addition, 100% of boys and 96.2% of girls had a dietary quality score below the minimum recommended threshold of 80 points (HEI score < 80).

4. Discussion

In this study, body composition and cognitive ability were evaluated before and after COVID-19, and food intake midway through the pandemic period of COVID-19. This study community was carried out in a municipality affected by the COVID-19 pandemic, but also by weather events that occurred during June 2020 (hurricanes Gamma and Delta and tropical storm Cristobal) [31]. In addition, this community has been classified as the poorest in the entire state of Yucatán, Mexico [3]. Hence, the results showed the impact of the two-year COVID-19 pandemic period on development and metabolism that can predict chronic diseases at later ages. Interestingly, high rates of linear growth deficiency, stunting, excess weight, low cognitive score, low dietary quality, and increased adiposity markers were observed.
In the pre-COVID stage, the study included 100% of the children enrolled in the fourth grade of elementary school. Due to the COVID-19 pandemic, some participants were lost in the two subsequent assessments, which is a limitation of the study. Nevertheless, all the children attending elementary school in both the pre- and post-pandemic periods were included. During the intermediate period, when data were collected through house-to-house visits, only those who were still residing in the community were assessed. The pandemic, not only in Tahdziú but globally, had severe consequences on living conditions, widening economic disparities, and exacerbating food shortages, which, in some cases, forced families to migrate in search of better opportunities. This study highlights the impact on children who remained in an isolated rural town, characterized by persistent, transgenerational poverty. The consequences for these children extend beyond economic hardship, encompassing educational setbacks that are likely to manifest both in the short and long term.
Frequencies of stunting remained high during pre- and post-COVID evaluation, 43.8% vs. 37.5% (p = 0.472), respectively. It is relevant because they are three times higher than those reported by Azcorra et al. [13] (13.8%) for other Maya school-age children. In the same way, linear growth deficiency frequency was higher during both studied periods, pre- and post-COVID, 35% vs. 38.8%, respectively. Moreover, it is important to mention that if we consider all children with undernutrition, the frequencies observed are alarming: 78.8% and 76.3% (p = 0.734), in pre- and post-COVID, respectively (Table 1).
Medians of HAZ values also evidenced short stature problems in both boys and girls. As far as we know, this is the first study to report the nutritional status of Maya children following a longitudinal approach after the COVID-19 pandemic and considering other adverse situations besides poverty. Interestingly, and contrary to expectations, despite poverty, weather events, and the pandemic, an increase in HAZ values was observed in girls. These higher HAZ values could be interpreted as a positive aspect; however, medians and first quartiles in both evaluated periods reveal an impaired linear growth. HAZ values in boys remained altered, and the same trend was observed in girls (Table 2). These data are in line with previous reports that have shown for almost 30 years, short height problems in Maya children’s populations [4,32]. It is worth mentioning that this scenario was expected because stunting in children reflects exposure to an environment of chronic undernutrition, poverty, and marginalization [33].
The scenario observed in both boys and girls may be due to cell plasticity. However, in girls, the apparent improvement may have been at the expense of their nutritional reserves, most likely leading to deficiencies in later life. In boys, this utilization of nutritional reserves is also likely; however, it was sufficient only to keep the child on the same growth trend. According to the allocation principle, organisms have limited time and energy to maximize growth. In the short and long term, energy allocation can result in fitness costs, especially when resources are scarce. Nevertheless, this adaptive advantage observed can lead to the appearance of chronic diseases at later ages. In this sense, it has been evidenced that growth deficiencies during childhood, in response to an adverse environment, condition both short stature and metabolic alterations, such as diabetes, dyslipidemias, hyperglycemia, and hypertension in adulthood [5].
In both evaluated periods, medians of BMIZ categorized both boys and girls as having adequate weight (Table 2). However, it was also determined that three out of ten children evaluated had excess weight, and this fact did not change after the pandemic (p = 0.342) (Table 1). This is consistent with the work of Zachurzok et al. [34], who assessed the impact of the pandemic on Polish children’s BMI and reported no changes in frequencies of overweight or obesity. As previously described, it can be assumed that children maintained this growth trend due to cell plasticity and energy allocation, though this can also lead to metabolic problems in adulthood. Particularly concerning high BMIZ, a recent longitudinal study by Rundle et al. [9] demonstrated that 5-year-old subjects with obesity had higher BMI (+6.51 units) and FMI (+4.15 units) scores at 50 years of age. In addition, based on epidemiological evidence, it is expected that those children identified with excess weight will present metabolic alterations such as diabetes and cardiovascular diseases in adulthood [8,9,10].
Several factors can explain the relationship between excess weight and lockdown during the pandemic. In this regard, it has been documented that children faced challenges like limited food, prolonged screen time, reduced physical activity, limited availability of health campaigns and programs of health, and limited nutritional supplement distribution [34,35].
Chronic undernutrition, identified by low HAZ values, can also be considered a trigger for excess body weight. In this sense, In this sense, Barrios et al. [36], reported in a longitudinal study with boys Mexican children, report the association between impaired linear growth at 2–4 years of age with higher BMI scores at 8–10 years of age. This association responds to various adaptive mechanisms related to adipose tissue. To the above, it has been documented that in undernutrition conditions, there is a greater fat utilization efficiency to increase energy reserves (adipose tissue) [37].
DBM frequencies revealed that Maya children have a very heterogeneous degrees of altered nutritional status, which depend on several factors such as location, isolation, diet, and urbanization status [4]. In this sense, frequencies of DBM identified in the present study (7.5% vs. 3.75%; p = 0.371) (Table 1) corresponds to children belonging to a rural community in southern Yucatán, which were lower than that documented in Maya children populations in semi-urbanized and rural areas of Yucatán (15%) [4], and we speculated that the difference in the frequency of DBM in Maya children can be explained by the remoteness urban areas and the minor access to industrialized food of children from southern Yucatán. On the other hand, the DBM is four times higher than that reported for Maya children in Guatemala (1.9%) [38]. Furthermore, DBM national frequency in children aged 5–11 years reported by the National Health and Nutrition Surveys conducted in 2012 in México is seven times lower (1%) than the data in the present study [39].
Nevertheless, as previously discussed, short stature reflects the reality of these children; we considered all the children with impaired linear growth and estimated a frequency of DBM of 20% in pre-COVID and post-COVID (p = 0.859). We consider that using a cut-off point < −1 for HAZ for DBM identification in Maya children is appropriate to perform complementary analyses for two main reasons: first, because short stature is a transgenerational problem in these children [4,32,38], and second, because several authors have demonstrated that declines more than one SD in Z-scores of growth indicators already denote children growth alterations [33,40].
Considering body composition indicators, the impact of the pandemic on the study population became evident. In post-COVID frequency of children with excess body fat increased sevenfold (2.5% vs. 16.3%, p = 0.001) (Table 1); even considering body fat percentage values, this significant increase is also confirmed in boys (p < 0.001) and girls (p = 0.005) (Table 2). This adiposity increase is also reflected in the fact that the frequency of children with excess arm fat area (7.6% vs. 20%, p = 0.024) and high FMI (5.1% vs. 16.3%, p = 0.011) increased threefold (Table 1). Regarding FMI values in both boys and girls, significant increases were also found in them after the pandemic (p < 0.001) (Table 2). These increases in the various adiposity markers evaluated could be the result of the factors associated with the pandemic lockdown, such as a sedentary lifestyle, dietary quality, and sleep disturbances [34].
Interestingly, after the course of the pandemic, changes in adiposity markers revealed that fat accumulation occurred at a visceral level. Considering that tricipital skinfold, a subcutaneous fat indicator, showed changes but were not statistically significant (Table 1 and Table 2), it can be assumed that fat gained in post-COVID was deposited viscerally, and it is precisely this type of fat that is associated with metabolic risk [41].
An important finding in the study of the population is the identification of cardiovascular risk through three important adiposity-related indicators: FMI [8], waist circumference, and WHtR [10]. Regarding FMI, as previously discussed, the data revealed an increased risk after the pandemic (Table 1 and Table 2). In addition, in pre- and post-COVID, three out of ten children presented a cardiovascular risk, identified through central obesity (16.5% vs. 26.3%, p = 0.168) and WHtR (24.1% vs. 16.3%, p = 0.210) (Table 1). In boys, a significant increase in waist circumference percentile was observed (p = 0.010) (Table 2); as will be discussed later, this finding may be associated with significantly higher consumption of fats identified in them (Figure 2). All of the aforementioned adiposity-related indicators can explain the frequencies of elevated systolic blood pressure (22.5% vs. 16.3%; p = 0.284) (Table 1), as it has been shown that excess body fat is the main trigger for blood pressure increases in children [42].
Regarding cognitive evaluation, it was determined that after the pandemic, there was an increase in the number of children with low cognitive scores (13.8% vs. 21.3%; p = 0.264) (Table 1). Particularly in boys, there was a reduction in the cognitive score (p = 0.021) (Table 2), which exacerbates pre-existing vulnerability and can predict an educational lag.
It is important to mention that the cognitive assessment methodology used in this study establishes a score that can be extrapolated to intelligence quotient (IQ) values [28]. Although this is a valid approximation, actual IQ estimation should be carried out using a broader cognitive test profile.
In both evaluated periods, the cognitive score was categorized as borderline [28]. This finding is important because it has been evidenced that children with a borderline intelligence IQ (between 70 and 85 points) typically show difficulties in executive functions, such as working memory, problem-solving, and attention [43]. Interestingly, Santegoeds et al. [44] point out that an important factor for borderline IQ in children is a low socioeconomic status, which is an aspect that characterizes the study population. In addition to this adverse environment, pandemic conditions (isolation, lack of face-to-face activities, self-regulated distance learning, and stress) are factors that have been identified as triggers of cognitive impairment in children [19,20]. Another factor that could be associated with observed borderline IQ is chronic undernutrition. A longitudinal work of Alam et al. [7] showed that stunting persists for at least 5 years and generates low cognitive scores in children. As discussed above, these authors also associate this with both biological and environmental factors, such as poverty.
In an attempt to monitor alterations development during the pandemic, we carried out a nutritional analysis in the inter-pandemic period. The high frequencies of deficient fiber intake and excessive consumption of carbohydrates, simple sugars, and saturated fatty acids (Figure 2) can explain both frequencies of excess weight and alterations in adiposity markers (Table 1 and Table 2). Moreover, significantly higher consumption of total fat (p = 0.0001) was observed in boys (Figure 2), which can explain the waist circumference percentile increase in them after the pandemic (Table 2). The reason for the above is that low fiber intake and excess of both sugar and fats (total and saturated) are dietetic factors strongly associated with adiposity gain [45].
Another worrisome nutritional finding was that no child evaluated consumed the minimum daily requirement of polyunsaturated fatty acids (Figure 2). Considering polyunsaturated fatty acid relevance in central nervous system development [46], the severe deficiency identified could be one of the cognitive score determinants. In addition, another nutritional alteration that may have harmed cognitive ability (Table 1 and Table 2) is elevated low dietary quality frequency determined in both boys and girls (100% and 96.2%, respectively) (Figure 2). In this regard, there is evidence of a positive association between appropriate diet quality scores and adequate cognitive development [47].
After the pandemic period the change in quality diet (HEI < 80) is so negative in both groups that it is not statistically significant (57 vs. 46, p = 0.119) (Figure 1).
The present study has some limitations. These include the size of follow-up samples and the use of a single cognitive test. The size of the follow-up sample (n = 80) was smaller than the initial sample (n = 114) because only two months had passed since the decree of return to face-to-face classes by the State Government; therefore, not all children regularly attended schools. In addition, during post-COVID visits, schoolteachers reported the migration of many families due to the pandemic crisis. A non-indigenous control group was not included, as the study was designed to evaluate the dietary quality and nutritional status of the school-age Maya population and to compare the findings with the national survey report.
Regarding cognitive assessment, we decided to implement a single rapid, accurate, and validated measurement strategy. The only evaluation methodology used was Koppitz’s because it considers visual and spatial skills, attention, concentration, and precise perception by sex and age [28]; moreover, its application has been reported in Mexican indigenous children [48] and in conditions of malnutrition and poverty [49].
Despite the limitations, important strengths can be mentioned. To our knowledge, this is the first follow-up report on somatometric and cognitive evaluation in Maya school-age children after pandemic conditions. Moreover, in post-COVID, we re-evaluated almost 80% of the original sample, even after two years of the pandemic in this very isolated community. Furthermore, this study was not based on self-reported data but on the measurement of indicators by trained clinical personnel. Finally, unlike similar works [17,18], the present research used a broad profile of somatometric and dietary indicators, which was crucial to identify specific alterations in body composition.

5. Conclusions

Through various analysis strategies, it was possible to determine that the negative effect of the COVID-19 pandemic was reflected in a significant increase in cardiovascular risk due to the increase in adiposity markers. In addition, particularly in boys, a significant cognitive ability reduction was evidenced after the pandemic.
The results of this work reveal that these affectations in studied children were mainly due to the lockdown associated with the pandemic. However, the findings also point towards the convergence of two other important preexisting factors: poverty and low dietary quality, the environment in which they were raised.
The results obtained are expected to contribute to a comprehensive understanding of the impact of the pandemic on the health status of Maya school-age children. We also hope these findings serve as a baseline evaluation that allows authorities to implement urgent intervention programs to establish a clear path to guide these children to the physical and mental development they deserve.

Supplementary Materials

The following supporting information can be downloaded at https://www.mdpi.com/article/10.3390/covid5100164/s1. Figure S1: Longitudinal changes in clinical and anthropometric characteristics among boys from T1 (3 March 2020) to T2 (26 April 2022) (n = 39); Figure S2: Longitudinal changes in clinical and anthropometric characteristics among girls from T1 (3 March 2020) to T2 (26 April 2022) (n = 41); Table S1: Description of clinical and somatometric characteristics in Maya Children before and after the pandemic, according to cut cut-off points; Table S2: Sex difference in somatometric and clinical parameters.

Author Contributions

Conceptualization, M.M.; methodology, E.B.-M., B.P.-E., S.M.-K., R.E.-S. and E.T.-H.; software, B.P.-E., S.M.-K. and R.E.-S.; validation, M.M., B.P.-E., S.M.-K. and R.E.-S.; formal analysis, E.B.-M., B.P.-E., S.M.-K. and R.E.-S.; investigation, M.M. and E.B.-M.; resources, E.B.-M.; data curation, B.P.-E.; writing—original draft preparation, E.B.-M., B.P.-E., S.M.-K., R.E.-S., K.S.-P., M.G.O.-L., E.T.-H. and M.M.; writing—review and editing, B.P.-E., S.M.-K., R.E.-S., K.S.-P., M.G.O.-L., E.T.-H. and M.M.; visualization, S.M.-K. and R.E.-S.; supervision, M.M.; project administration, M.M.; funding acquisition, M.M. All authors have read and agreed to the published version of the manuscript.

Funding

This research was funded by Universidad Nacional Autónoma de México, grant number IN222920 PAPIIT-DGAPA.

Institutional Review Board Statement

The study was conducted in accordance with the Declaration of Helsinki and approved by the Ethics Committee of the Children’s Hospital Regional de Alta Especialidad de la Península de Yucatán (protocol code HRAEPY 2018-002 and approval on 22 March 2018).

Informed Consent Statement

Written informed consent was obtained from all the participants (children) and their legal guardians (parents).

Data Availability Statement

The data supporting this study’s findings are available on request due to privacy or ethical restrictions. The data supporting this study’s findings are not publicly available due to containing information that could compromise the privacy of research participants, but they are available from the corresponding author, M.M., upon reasonable request. For details, contact Marta Menjivar, menjivar@unam.mx, phone +52-555-622-3822. Laboratory 313—Building F, Chemistry Faculty, Universidad Nacional Autonóma de México.

Conflicts of Interest

The authors declare no conflicts of interest.

Abbreviations

The following abbreviations are used in this manuscript:
HRAEPYHospital Regional de Alta Especialidad de la Península de Yucatán
HAZZ-Score of Height for age
BMIZZ-Score of Body Mass Index for age
FMIFat Mass Index
WHtRWaist to Height Ratio
LGDLinear Growth Deficiency
BDMDouble Burden Malnutrition
HFDHuman Figure Drawing
RDAsRecommended Dietary Advances
HEIHealthy Eating Index
USDAFood and Nutrition Service of the U.S. Department of Agriculture
SDStandard Deviation
IQIntelligence Quotient

References

  1. Robles-Zavala, E. Los múltiples rostros de la pobreza en una comunidad maya de la Península de Yucatán. Estud. Soc. 2010, 18, 100–133. Available online: https://core.ac.uk/reader/25649660 (accessed on 1 July 2023).
  2. Instituto Nacional de Estadística y Geografía (INEGI). Información Por Entidad. Yucatán. Población. Published 2010. Available online: https://cuentame.inegi.org.mx/monografias/informacion/yuc/poblacion/diversidad.aspx?tema%3Dme%26e%3D31 (accessed on 27 February 2023).
  3. Consejo Nacional de Evaluación de la Política de Desarrollo Social (CONEVAL). Informe de Pobreza y Evaluación. Yucatán. 2020. Available online: https://www.coneval.org.mx/coordinacion/entidades/Documents/Informes_de_pobreza_y_evaluacion_2020_Documentos/Informe_Yucatan_2020.pdf (accessed on 1 July 2023).
  4. May-Kim, S.; Peña-Espinoza, B.I.; Menjivar, M. Malnutrition in Maya children: High prevalence of linear growth deficiency. Am. J. Biol. Anthropol. 2022, 177, 620–629. [Google Scholar] [CrossRef]
  5. Grey, K.; Gonzales, G.B.; Abera, M.; Lelijveld, N.; Thompson, D.; Berhane, M.; Abdissa, A.; Girma, T.; Kerac, M. Severe malnutrition or famine exposure in childhood and cardiometabolic non-communicable disease later in life: A systematic review. BMJ Glob. Health 2021, 6, e003161. [Google Scholar] [CrossRef] [PubMed]
  6. Uday, S.; Manaseki-Holland, S.; Bowie, J.; Mughal, M.Z.; Crowe, F.; Högler, W. The effect of vitamin D supplementation and nutritional intake on skeletal maturity and bone health in socio-economically deprived children. Eur. J. Nutr. 2021, 60, 3343–3353. [Google Scholar] [CrossRef]
  7. Alam, M.A.; Richard, S.A.; Fahim, S.M.; Mahfuz, M.; Nahar, B.; Das, S.; Shrestha, B.; Koshy, B.; Mduma, E.; Seidman, J.C.; et al. Impact of early-onset persistent stunting on cognitive development at 5 years of age: Results from a multi-country cohort study. PLoS ONE 2020, 15, e0227839. [Google Scholar] [CrossRef]
  8. Alpízar, M.; Frydman, T.D.; de Reséndiz-Rojas, J.; Trejo-Rangel, M.A.; De Aldecoa-Castillo, J.M. Fat Mass Index (FMI) as a Trustworthy Overweight and Obesity Marker in Mexican Pediatric Population. Children 2020, 7, 19. [Google Scholar] [CrossRef]
  9. Rundle, A.G.; Factor-Litvak, P.; Suglia, S.F.; Susser, E.S.; Kezios, K.L.; Lovasi, G.S.; Cirillo, P.M.; Cohn, B.A.; Link, B.G. Tracking of Obesity in Childhood into Adulthood: Effects on Body Mass Index and Fat Mass Index at Age 50. Child. Obes. 2020, 16, 226–233. [Google Scholar] [CrossRef]
  10. Ashwell, M.; Gibson, S. Waist-to-height ratio as an indicator of ‘early health risk’: Simpler and more predictive than using a ‘matrix’ based on BMI and waist circumference. BMJ Open 2016, 6, e010159. [Google Scholar] [CrossRef]
  11. Popkin, B.M.; Corvalan, C.; Grummer-Strawn, L.M. Dynamics of the double burden of malnutrition and the changing nutrition reality. Lancet 2020, 395, 65–74. [Google Scholar] [CrossRef]
  12. Wrottesley, S.V.; Mates, E.; Brennan, E.; Bijalwan, V.; Menezes, R.; Ray, S.; Ali, Z.; Yarparvar, A.; Sharma, D.; Lelijveld, N. Nutritional status of school-age children and adolescents in low- and middle-income countries across seven global regions: A synthesis of scoping reviews. Public Health Nutr. 2023, 26, 63–95. [Google Scholar] [CrossRef]
  13. Azcorra, H.; Vázquez-Vázquez, A.; Baqueiro, J.; Salazar-Rendón, J.C. Crecimiento y estado nutricional de escolares de tres comunidades de Yucatán, México. Arch. Latinoam. Nutr. 2016, 66, 135–141. [Google Scholar]
  14. Vazquez-Gomez, A.; Ávila-Escalante, M.L.; Azcorra, H.; Varela-Silva, M.I.; Dickinson, F. Body proportionality and adiposity are not related in 6- to 8-year-old Yucatec Maya children. Am. J. Hum. Biol. 2019, 31, e23254. [Google Scholar] [CrossRef]
  15. Uuh Narvaez, J.J.; Segura Campos, M.R. Foods from Mayan Communities of Yucatán as Nutritional Alternative for Diabetes Prevention. J. Med. Food 2020, 23, 349–357. [Google Scholar] [CrossRef] [PubMed]
  16. Roberts, M.; Tolar-Peterson, T.; Reynolds, A.; Wall, C.; Reeder, N.; Rico Mendez, G. The Effects of Nutritional Interventions on the Cognitive Development of Preschool-Age Children: A Systematic Review. Nutrients 2022, 14, 532. [Google Scholar] [CrossRef] [PubMed]
  17. Patel, B.P.; Sathiyamoorthy, T.; Giruparajah, M.; Toulany, A.; Hamilton, J.K. Weighing in on COVID-19: The impact of the pandemic on children and adolescents with obesity participating in a weight management program. Pediatr. Obes. 2022, 17, e12948. [Google Scholar] [CrossRef] [PubMed]
  18. Yang, D.; Luo, C.; Feng, X.; Qi, W.; Qu, S.; Zhou, Y.; Sun, L.; Wu, H. Changes in obesity and lifestyle behaviours during the COVID-19 pandemic in Chinese adolescents: A longitudinal analysis from 2019 to 2020. Pediatr. Obes. 2022, 17, 11. [Google Scholar] [CrossRef]
  19. Bussières, E.-L.; Malboeuf-Hurtubise, C.; Meilleur, A.; Mastine, T.; Hérault, E.; Chadi, N.; Montreuil, M.; Généreux, M.; Chantal Camden and PRISME-COVID Team. Consequences of the COVID-19 Pandemic on Children’s Mental Health: A Meta-Analysis. Front. Psychiatry 2021, 12, 10. [Google Scholar] [CrossRef]
  20. Instituto Nacional de Salud Pública (INSP). Prevención de Mala Nutrición en Niñas y Niños en México Ante la Pandemia de COVID-19. Published online 2020:10. Available online: https://www.insp.mx/micrositio-covid-19/prevencion-de-mala-nutricion-en-ninas-y-ninos-en-mexico-ante-la-pandemia-de-covid-19-recomendaciones-dirigidas-a-tomadores-de-decisiones (accessed on 1 July 2023).
  21. Ironman, T.; InnerScan DUAL. Intruction Manual Model BC-1500 Plus. Published online 2017:1. Available online: https://www.tanitachile.cl/bc-1500-plus-ironman/ (accessed on 1 July 2023).
  22. Muntner, P.; Shimbo, D.; Carey, R.M.; Charieston, J.B.; Gaillard, T.; Misra, S.; Myers, M.G.; Ogedegbe, G.; Schwaartz, J.E.; Townsend, R.R.; et al. Measurement of Blood Pressure in Humans: A Scientific Statement from the American Heart Association. Hypertension 2019, 73, 35–66. [Google Scholar] [CrossRef]
  23. Marfell-Jones, M.; Olds, T.; Stewart, A.; Carter, L. International Standards for Anthropometric Assessment; International Society for the Advancenment of Kinanthropometry (ISAK): Glasgow, UK, 2016. [Google Scholar]
  24. Ramírez, E.; Valencia, M.E.; Bourges, H.; Espinosa, T.; Moya-Camarena, S.Y.; Salazar, G.; Alemán-Mateo, H. Body composition prediction equations based on deuterium oxide dilution method in Mexican children: A national study. Eur. J. Clin. Nutr. 2012, 66, 1099–1103. [Google Scholar] [CrossRef]
  25. de Onis, M. Development of a WHO growth reference for school-aged children and adolescents. Bull. World Health Organ. 2007, 85, 660–667. [Google Scholar] [CrossRef]
  26. Frisancho, R. Anthropometric Standards: An Interactive Nutritional Reference of Body Size and Body Composition for Children and Adults; University of Michigan Press: Ann Arbor, MI, USA, 2008. [Google Scholar]
  27. de Ferranti, S.D.; Gauvreau, K.; Ludwig, D.S.; Neufeld, E.J.; Newburger, J.W.; Rifai, N. Prevalence of the Metabolic Syndrome in American Adolescents. Circulation 2004, 110, 2494–2497. [Google Scholar] [CrossRef]
  28. Münsterberg Koppitz, E. El Dibujo de La Figura Humana En Los Niños, 12th ed.; Gabriel Forqueda, A. El dibujo de la figura humana en niños Koppitz. El Dibujo De La Figura Humana En Los Niños, 2006. Available online: https://www.academia.edu/57035669/El_dibujo_de_la_figura_humana_en_niños_Koppitz (accessed on 11 October 2023).
  29. Bourges, H.; Casanueva, E.; Rosado, J.L. Recomendaciones de Ingestión de Nutrimentos Para La Población Mexicana. In Cuadernos de nutrición; Editorial Médica Panamericana: Madrid, Spain, 2010. [Google Scholar]
  30. Krebs-Smith, S.M.; Pannucci, T.E.; Subar, A.F.; Kirkpatrick, S.I.; Lerman, J.L.; Tooze, J.A.; Wilson, M.M.; Reedy, J. Update of the Healthy Eating Index: HEI-2015. J. Acad. Nutr. Diet. 2018, 118, 1591–1602. [Google Scholar] [CrossRef] [PubMed]
  31. Rodríguez, Y. Campo yucateco, el más afectado por hucarán “Delta” . El Universal 2020. Available online: https://www.eluniversal.com.mx/estados/huracan-delta-campo-yucateco-el-mas-afectado/ (accessed on 12 October 2021).
  32. Solomons, N.W.; Mazariegos, M.; Vettorazzi, C.; Valdez, C.; Grazioso, C.; Romero-Abal, M.E.; Caballero, B. Growth Faltering, Protein Metabolism and Immunostimulation: New Speculations on the Nature of the Relationship with Notes from Observations and Analyses in Guatemala; International Atomic Energy Agency: Vienna, Austria, 1993. [Google Scholar]
  33. Ramírez-Luzuriaga, M.J.; Kobes, S.; Sinha, M.; Knowler, W.C.; Hanson, R.L. Increased Adiposity and Low Height-for-Age in Early Childhood Are Associated With Later Metabolic Risks in American Indian Children and Adolescents. J. Nutr. 2022, 152, 1872–1885. [Google Scholar] [CrossRef] [PubMed]
  34. Zachurzok, A.; Wójcik, M.; Gawlik, A.; Starzyk, J.B.; Mazur, A. An Attempt to Assess the Impact of Pandemic Restrictions on the Lifestyle, Diet, and Body Mass Index of Children with Endocrine Diseases—Preliminary Results. Nutrients 2021, 14, 156. [Google Scholar] [CrossRef] [PubMed]
  35. Rodríguez Osiac, L.; Egaña Rojas, D.; Gálvez Espinoza, P.; Navarro-Rosenblatt, D.; Araya B, M.; Carroza, M.B.; Baginsky G, C. Evitemos la inseguridad alimentaria en tiempos de COVID-19 en Chile. Rev. Chil. Nutr. 2020, 47, 347–349. [Google Scholar] [CrossRef]
  36. Barrios, P.L.; Garcia-Feregrino, R.; Rivera, J.A.; Albino, B.-V.; Leticia, H.-C.; Isabel, R.; Ines, G.-C.; Usha, R.; Daniel J, H. Height Trajectory During Early Childhood Is Inversely Associated with Fat Mass in Later Childhood in Mexican Boys. J. Nutr. 2019, 149, 2011–2019. [Google Scholar] [CrossRef]
  37. Long, K.Z.; Beckmann, J.; Lang, C.; Seelig, H.; Nqweniso, S.; Probst-Hensch, N.; Müller, I.; Pühse, U.; Steinmann, P.; du Randt, R.; et al. Associations of Growth Impairment and Body Composition among South African School-Aged Children Enrolled in the KaziAfya Project. Nutrients 2021, 13, 2735. [Google Scholar] [CrossRef]
  38. Ramirez-Zea, M.; Kroker-Lobos, M.F.; Close-Fernandez, R.; Kanter, R. The double burden of malnutrition in indigenous and nonindigenous Guatemalan populations. Am. J. Clin. Nutr. 2014, 100, 1644S–1651S. [Google Scholar] [CrossRef]
  39. Kroker-Lobos, M.F.; Pedroza-Tobías, A.; Pedraza, L.S.; Rivera, J.A. The double burden of undernutrition and excess body weight in Mexico. Am. J. Clin. Nutr. 2014, 100, 1652S–1658S. [Google Scholar] [CrossRef]
  40. Hulst, J.M.; Huysentruyt, K.; Gerasimidis, K.; Shamir, R.; Koletzko, B.; Chourdakis, M.; Fewtrell, M.; Joosten, K.F. A Practical Approach to Identifying Pediatric Disease-Associated Undernutrition. J. Pediatr. Gastroenterol. Nutr. 2022, 74, 693–705. [Google Scholar] [CrossRef]
  41. Nauli, A.M.; Matin, S. Why Do Men Accumulate Abdominal Visceral Fat? Front. Physiol. 2019, 10, 10. [Google Scholar] [CrossRef]
  42. Yılmazbaş, P.; Haşlak, G.V.; Dursun, H. The relationship between body fat ratio and blood pressure in school-age children. J. Hum. Hypertens. 2020, 34, 826–832. [Google Scholar] [CrossRef]
  43. Baglio, G.; Blasi, V.; Intra, F.S.; Castelli, I.; Massaro, D.; Baglio, F.; Valle, A.; Zanette, M.; Marchetti, A. Social Competence in Children with Borderline Intellectual Functioning: Delayed Development of Theory of Mind Across All Complexity Levels. Front. Psychol. 2016, 7, 1604. [Google Scholar] [CrossRef]
  44. Santegoeds, E.; van der Schoot, E.; Roording-Ragetlie, S.; Klip, H.; Rommelse, N. Neurocognitive functioning of children with mild to borderline intellectual disabilities and psychiatric disorders: Profile characteristics and predictors of behavioural problems. J. Intellect. Disabil. Res. 2022, 66, 162–177. [Google Scholar] [CrossRef]
  45. López-Olmedo, N.; Carriquiry, A.L.; Rodríguez-Ramírez, S.; Espinosa-Montero, J.; Hernández-Barrera, L.; Campirano, F.; Martínez-Tapia, B.; Rivera, J.A. Usual Intake of Added Sugars and Saturated Fats Is High while Dietary Fiber Is Low in the Mexican Population. J. Nutr. 2016, 146, 1856S–1865S. [Google Scholar] [CrossRef] [PubMed]
  46. van der Wurff, I.S.M.; Meyer, B.J.; de Groot, R.H.M. Effect of Omega-3 Long Chain Polyunsaturated Fatty Acids (n-3 LCPUFA) Supplementation on Cognition in Children and Adolescents: A Systematic Literature Review with a Focus on n-3 LCPUFA Blood Values and Dose of DHA and EPA. Nutrients 2020, 12, 3115. [Google Scholar] [CrossRef] [PubMed]
  47. Khan, N.A.; Cannavale, C.; Iwinski, S.; Liu, R.; McLoughlin, G.M.; Steinberg, L.G.; Walk, A.M. Visceral Adiposity and Diet Quality Are Differentially Associated with Cognitive Abilities and Early Academic Skills Among Preschool-Age Children. Front. Pediatr. 2020, 7, 548. [Google Scholar] [CrossRef]
  48. Nistal, M.T.F.; Bertrán, A.M.T.; de la Paz Ross Argüelles, G. Un Estudio Normativo de los Ítems Evolutivos del Test del Dibujo de la Figura Humana en Niñs Indígenas Yaquis. Rev. Iberoam. Diagnóstico. Y Evaluación Psicológica 2015, 39, 77–90. [Google Scholar]
  49. Ortiz-Andrellucchi, A.; Peña-Quintana, L.; Saavedra-Santana, P.; Albino-Beñacar, A.; Monckeberg-Barros, F.; Serra-Majem, L. Facing malnutrition and poverty: Evaluating the CONIN experience. Nutr. Rev. 2009, 67 (Suppl. S1), S47–S55. [Google Scholar] [CrossRef]
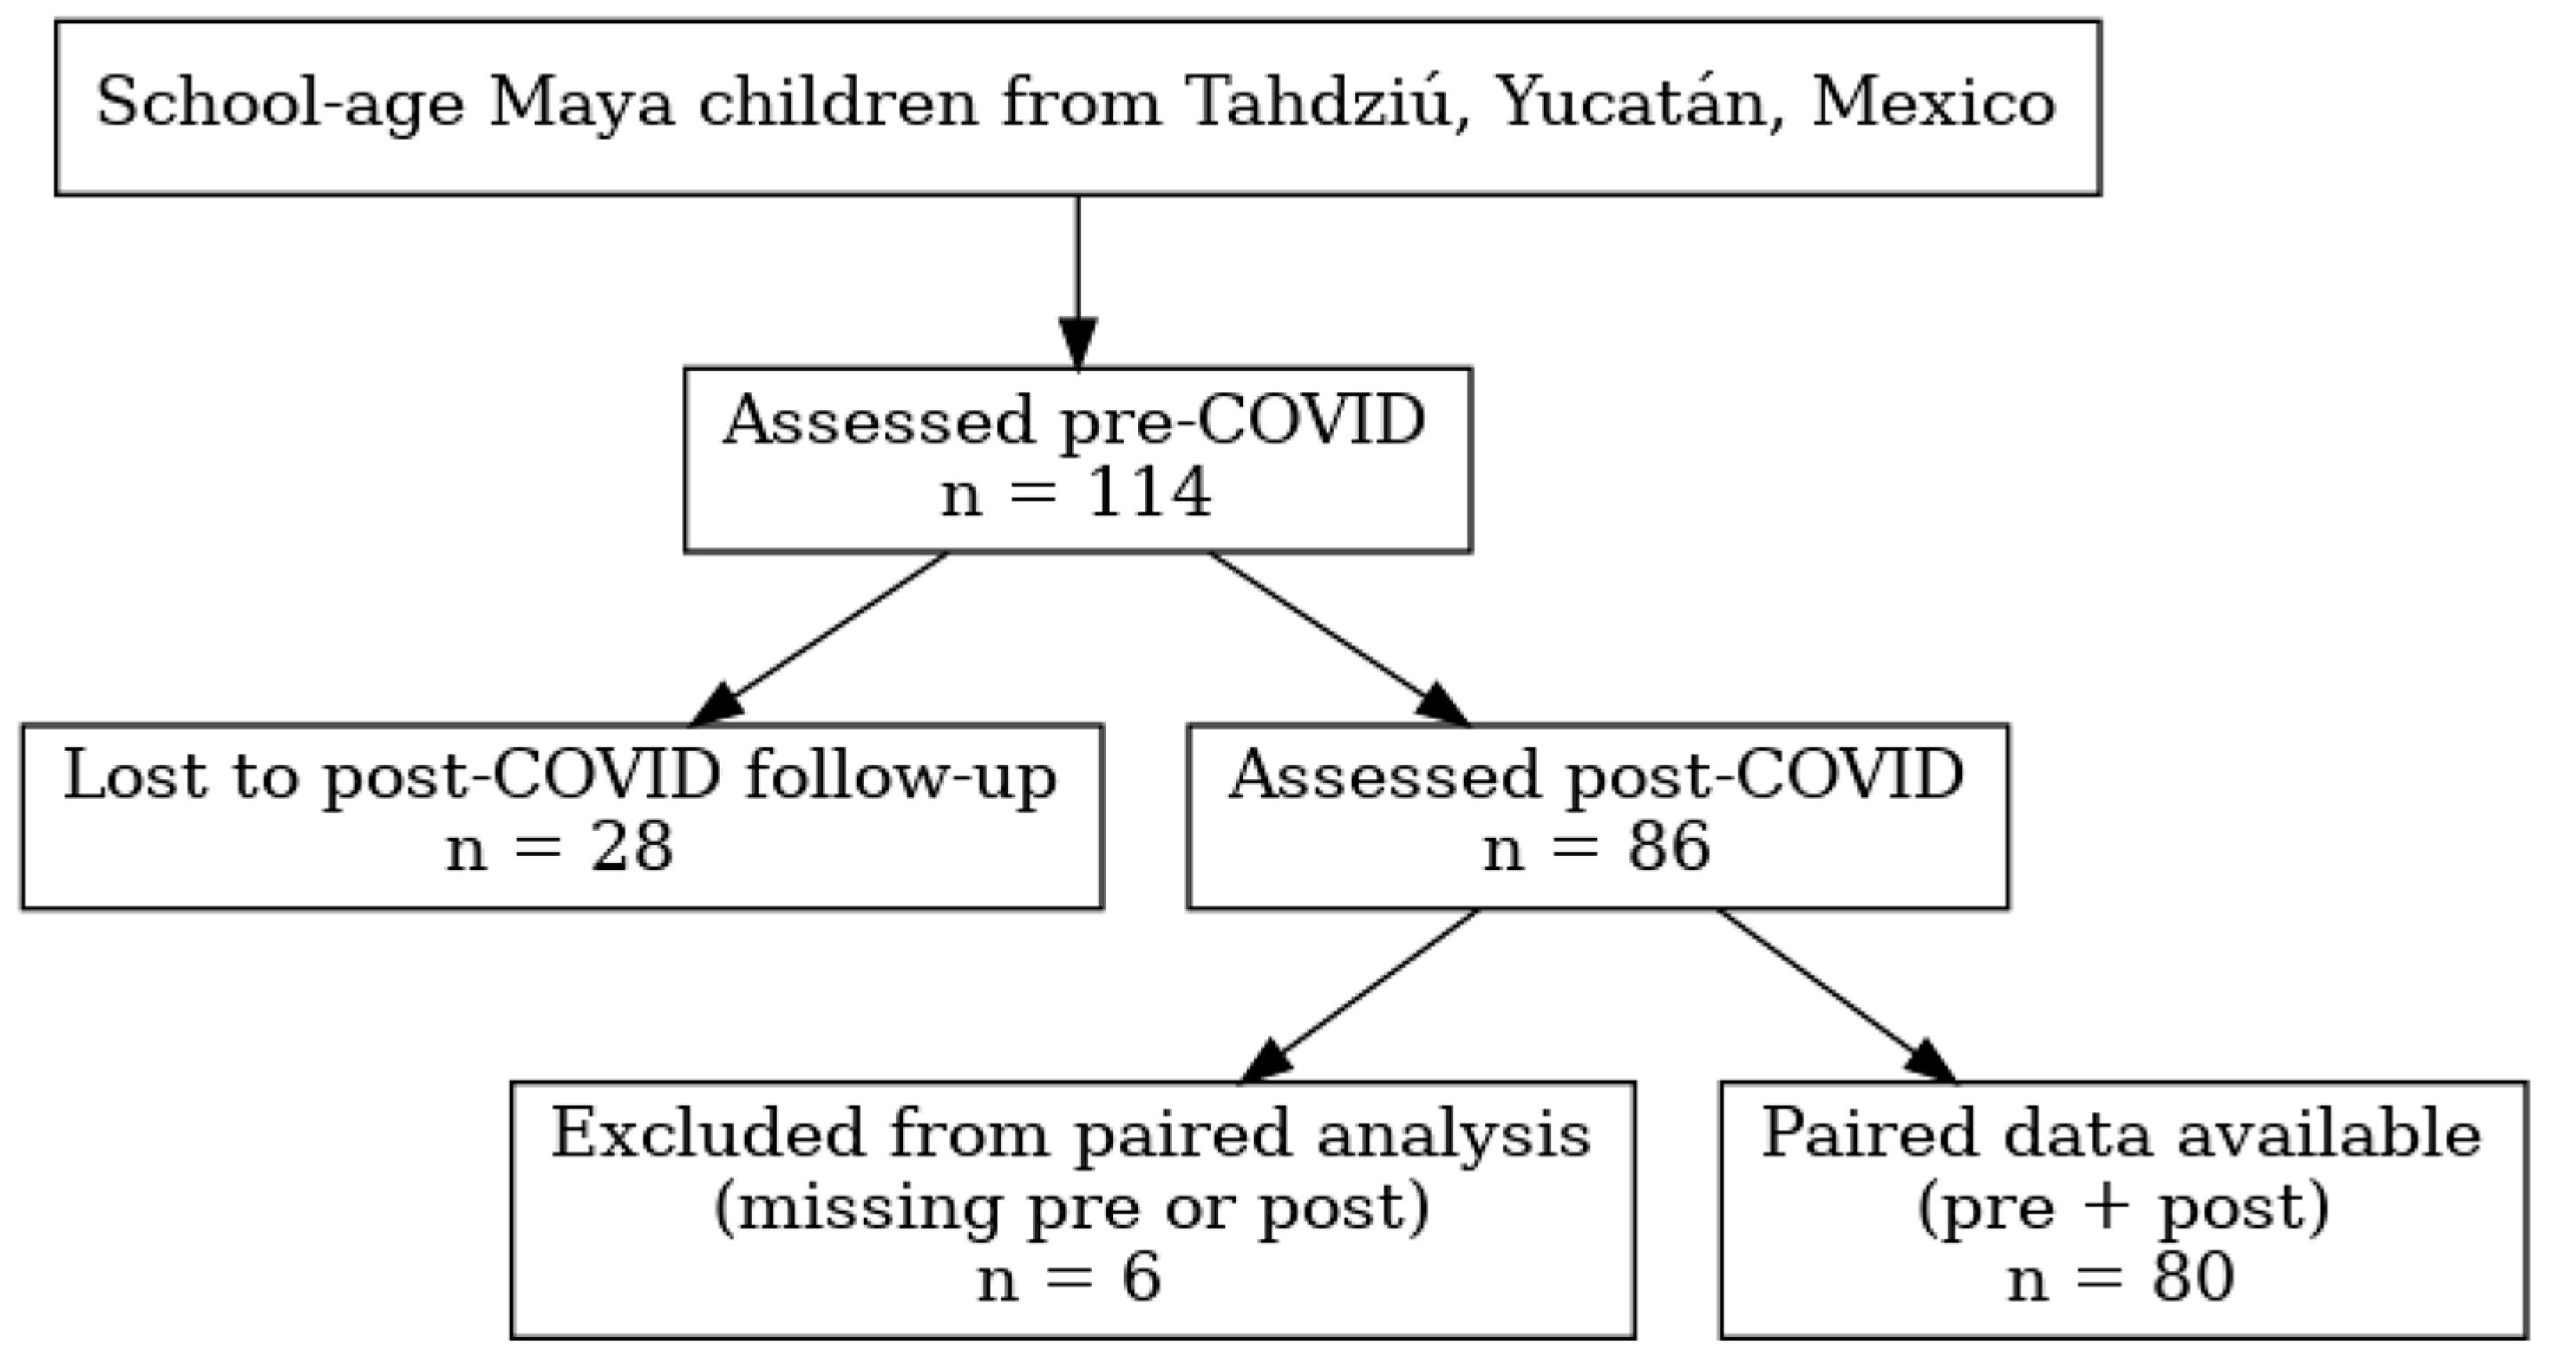
Scheme 1. Flowchart of the selection process of the study population.
Covid 05 00164 sch001
Figure 1. This is a figure of HEI total scores: (a) pre-COVID; (b) post-COVID. The dark gray line represents the estimated scores in our Maya children, and the light gray line shows the expected scores based on the HEI components according to the international reference.
Covid 05 00164 g001
Figure 2. Dietetic alterations (%) during inter-pandemic period. The vitamin A and iron were calculated by sex and age. % TE: Percentage of total energy. * p < 0.05.
Covid 05 00164 g002
Table 1. Description of Maya children restricted to those with somatometric and clinical alterations.
IndicatorsCut-Off PointMeasurement Date
3 March 2020
(%)
26 April 2022
(Mean ± SD)
3 March 2020
(%)
26 April 2022
(Mean ± SD)
p
Anthropometric
LGD (cm)Height-for-age (HAZ-Score ≤ −1)35.0−1.60 ± 0.2638.8−1.52 ± 0.310.660
Stunting (cm)Height-for-age (Z-Score ≤ −2)43.8−2.95 ± 2.8137.5−2.67 ± 0.740.472
Undernutrition (cm)LGD + Stunting78.8−2.35 ± 2.2176.3−2.10 ± 0.800.733
Excess of body weight (kg/m2)BMI-for–age (percentile)24.193.0 ± 5.2031.194.0 ± 4.600.342
DBM (cm + kg/m2)HAZ ≤ −2 SD +
BMI-for–age (≥85th percentile)
7.50−2.29 ± 0.27
89.40 ± 4.80
3.75−2.21 ± 0.24
93.70 ± 5.6
0.371
Adiposity markers
Body fat mass (%)Body fat mass (boys > 20);
(girls > 25)
2.5024.10 ± 9.05
NA
16.324.62 ± 6.53
27.14 ± 3.49
0.001
Central obesity (cm)Waist circumference (≥75th percentile)16.585.20 ± 7.5026.387.30 ± 6.700.168
Excess of adiposity (mm/mm2)Tricipital skinfold (≥85th percentile)7.6090.11 ± 4.3011.390.16 ± 4.600.629
Arm fat area (>85th percentile)7.6093.40 ± 4.8820.093.03 ± 4.600.024
Excess of fat mass (kg/m2)Fat Mass Index (according to sex and age)5.105.42 ± 2.6616.36.60 ± 2.870.011
Cardiometabolic risk factors
High blood pressure (mmHg)Systolic blood pressure
(≥90th percentile)
22.594.40 ± 3.2016.393.90 ± 3.000.284
Waist-to-height ratioWaist-to-height ratio (≥0.5)24.10.54 ± 0.0532.50.56 ± 0.060.210
Cognitive abilityCognitive score (<80)13.860.00 ± 20.0021.358.00 ± 22.000.264
Data compares the alteration frequencies pre- and post-COVID. Chi2 test with Yates correction. Values statistically significant at p < 0.05. The means ± standard deviation described the children with somatometric and clinical alterations. Clinical Abbreviations: LGD: linear growth deficiency. DBM: double burden of malnutrition. HAZ: height-for-age Z-score + BMI: body mass index percentile. NA: there are no girls with body fat mass >25%.
Table 2. Sex difference in somatometric and clinical parameters.
IndicatorsBoys Girls
3 March 2020
(n = 39)
26 April 2022
(n = 39)
p3 March 2020
(n = 41)
26 April 2022
(n = 41)
p
Height-for-age
(Z-score)
−1.87 ± 0.89−1.78 ± 0.931 × 10⁻⁴−1.63 ± 0.76−1.52 ± 0.921 × 10⁻⁴
BMI-for-age
(kg/m2)
17.30 ± 2.9118.70 ± 3.711 × 10−417.50 ± 2.2419.60 ± 3.651 × 10⁻⁴
Body fat mass
(%)
8.15 ± 5.1513.30 ± 7.041 × 10−414.83 ± 2.6016.60 ± 4.911 × 10⁻⁴
Waist circumference (cm)57.80 ± 7.7865.60 ± 9.01 × 10−458.60 ± 9.8067.40 ± 8.801 × 10⁻⁴
Tricipital skinfold
(mm)
9.30 ± 4.1911.52 ± 7.151 × 10−411.36 ± 3.3013.30 ± 5.503 × 10⁻³
Arm fat area
(mm3)
8.52 ± 5.2112.26 ± 10.02 × 10−310.39 ± 4.0314.18 ± 8.081 × 10⁻⁴
Fat Mass Index
(kg/m2)
1.53 ± 1.502.70 ± 2.371 × 10−42.63 ± 0.773.40 ± 1.771 × 10⁻⁴
Systolic blood pressure (mmHg)100 ± 9102 ± 80.3298 ± 12102 ± 90.01
Waist-to-height
(ratio)
0.47 ± 0.070.49 ± 0.061 × 10−40.47 ± 0.080.49 ± 0.061 × 10⁻³
Cognitive ability
(score)
83.00 ± 4.0079.00 ± 14.001 × 10−477.00 ± 15.0076.00 ± 15.000.01
Values are presented in mean and standard deviation. The t-Student paired test was used. Values statistically significant at p < 0.05.
Disclaimer/Publisher’s Note: The statements, opinions and data contained in all publications are solely those of the individual author(s) and contributor(s) and not of MDPI and/or the editor(s). MDPI and/or the editor(s) disclaim responsibility for any injury to people or property resulting from any ideas, methods, instructions or products referred to in the content.