Article

Haematological Profile and ACE2 Levels of COVID-19 Patients in a Metropolis in Ghana

by
Ezekiel B. Ackah
1,
Michael Owusu
1,2,*,
Benedict Sackey
1,
Justice K. Boamah
3,
Japhet S. Kamasah
4,
Albert A. Aduboffour
5,
Debora Akortia
6,
Gifty Nkrumah
6,
Andrews Amaniampong
6,
Nicholas Klevor
5,
Lawrence D. Agyemang
1,7,
Nana K. Ayisi-Boateng
8,
Augustina Sylverken
2,9,
Richard O. Phillips
2 and
Ellis Owusu-Dabo
10
1
Department of Medical Diagnostics, Faculty of Allied Health Sciences, Kwame Nkrumah University of Science and Technology, University Post Office, Private Mail Bag, Kumasi 00233, Ghana
2
Kumasi Centre for Collaborative Research in Tropical Medicine, Kwame Nkrumah University of Science and Technology, University Post Office, Private Mail Bag, Kumasi 00233, Ghana
3
Department of Microbiology, Agogo Presbyterian Hospital, Agogo Asante–Akim P.O. Box 27, Ghana
4
Department of Molecular Medicine, School of Medicine and Dentistry, Kwame Nkrumah University of Science and Technology, University Post Office, Private Mail Bag, Kumasi 00233, Ghana
5
Infectious Disease Unit, Laboratory Services Directorate, Komfo Anokye Teaching Hospital, Adum–Kumasi P.O. Box 1934, Ghana
6
Department of Clinical Microbiology, School of Medicine and Dentistry, Kwame Nkrumah University of Science and Technology, University Post Office, Private Mail Bag, Kumasi 00233, Ghana
7
Department of Clinical Microbiology, Laboratory Services Directorate, Komfo Anokye Teaching Hospital, Adum–Kumasi P.O. Box 1934, Ghana
8
Department of Medicine, School of Medicine and Dentistry, Kwame Nkrumah University of Science and Technology, University Post Office, Private Mail Bag, Kumasi 00233, Ghana
9
Department of Theoretical and Applied Biology, Faculty of Biosciences, Kwame Nkrumah University of Science and Technology, University Post Office, Private Mail Bag, Kumasi 00233, Ghana
10
Department of Global and International Health, School of Public Health, Kwame Nkrumah University of Science and Technology, University Post Office, Private Mail Bag, Kumasi 00233, Ghana
*
Author to whom correspondence should be addressed.
COVID 2024, 4(2), 117-129; https://doi.org/10.3390/covid4020011
Submission received: 30 November 2023 / Revised: 15 January 2024 / Accepted: 18 January 2024 / Published: 23 January 2024

Abstract

:
Background: Several studies have linked coronavirus disease 2019 (COVID-19) risk to age and ABO blood groups. Variations in plasma angiotensin-converting enzyme 2 (ACE2) levels and blood counts have been reported, suggesting an association between disease severity and low lymphocyte levels. Aim: this study aimed to understand how these factors relate to COVID-19 in Ghanaian patients, considering geographical and demographic differences. Methods: Participants were recruited from six hospitals in Kumasi, Ghana, between June 2020 and July 2021. Nasopharyngeal swabs were taken to test for severe acute respiratory syndrome coronavirus 2 (SARS-CoV-2), and blood samples were collected for complete blood count testing, ABO/Rhesus typing, and assessment of plasma ACE2 levels. Demographic and COVID-19 severity data were gathered, and IBM SPSS version 25.0 was used for analysis. Results: Overall, 515 patients were enrolled, out of which 55.9% (n = 288/515) were males and 50.3% (n = 259/515) tested positive for SARS-CoV-2. The median age was 37 years (IQR = 26–53). Age was significantly associated with SARS-CoV-2 infection (p = 0.002). The severe COVID-19 group was the oldest (70 years, IQR = 35–80) and presented with anaemia (haemoglobin, g/dL: 9.55, IQR = 7.85–11.93), leukocytosis (WBC × 103/μL: 15.87, IQR = 6.68–19.80), neutrophilia (NEUT × 106/μL: 14.69, IQR = 5.70–18.96) and lymphocytopenia (LYMPH × 106/μL: 0.47, IQR = 0.22–0.66). No association was found between SARS-CoV-2 positivity and ABO (p = 0.711) or Rh (p = 0.805) blood groups; no association was also found between plasma ACE2 levels and SARS-CoV-2 status (p = 0.079). However, among COVID-19 participants, plasma ACE2 levels were significantly reduced in the moderate illness group (40.68 ng/mL, IQR = 34.09–48.10) compared with the asymptomatic group (50.61 ng/mL, IQR = 43.90–58.61, p = 0.015). Conclusions: While there may be no real association between the ABO blood group, as well as plasma ACE2 levels, and SARS-CoV-2 infection in Ghanaian patients, older individuals are at a higher risk of severe disease. Anaemia, and leukocytosis with lymphocytopenia may be indicators of poor disease progression.

1. Introduction

Wuhan, a city in central China, was the centre of an outbreak of pneumonia of unknown cause in December 2019 that became coronavirus disease 2019 (COVID-19), caused by severe acute respiratory syndrome coronavirus 2 (SARS-CoV-2) [1]. COVID-19 became a global pandemic, and by 12 June 2023, there had been over 767 million confirmed cases globally, with nearly 7 million deaths [2]. In Ghana, at the same time, there were over 171,000 confirmed cases, with a little over 1400 deaths [3]. The high numbers of COVID-19 cases worldwide were contributed to by the various SARS-CoV-2 variants of concern that emerged, both globally and locally in Ghana [4,5]. However, owing to the downward trends in cases worldwide, the World Health Organization (WHO) announced in early May 2023 that COVID-19 was no longer an emergency in global health [6].
The SARS-CoV-2 virus is a Betacoronavirus and uses the angiotensin-converting enzyme 2 (ACE2) receptor for cell entry and transmission [7,8]. These ACE2 receptors (ACE2Rs), or simply ACE2 tissue molecules, are abundant in the lungs and kidneys, with variable distributions in other tissues [9,10]. It is reported that the levels of circulating ACE2 are elevated in individuals with active COVID-19 disease and in the short time after infection [11,12]. Moreover, increased plasma ACE2 levels are seen in individuals with high-risk factors for severe COVID-19 disease, such as men and those with chronic comorbidities [13,14,15,16,17].
The ABO and Rhesus (Rh) blood groups are the two most important blood groups in humans. The ABO and Rh antigens are innate and can easily be determined [18]. There have been several studies that have found that the ABO blood groups are statistically or biologically related to diseases: group B is associated with a lower risk of infection with hepatitis B virus (HBV) [19]; group O is associated with increased susceptibility to the Norwalk virus [20] and significantly high prevalence of Helicobacter pylori [21]; and group A is associated with a higher risk of breast cancer and pancreatic cancer [22]. Furthermore, some studies have reported that blood group O is associated with reduced susceptibility to infection with SARS-CoV and SARS-CoV-2, while individuals belonging to group A are at higher risk of infection with the viruses [23,24,25].
On complete blood count parameters, there are reports with variations in patterns of change for the various parameters, although lymphocytopenia is commonly reported to be associated with increased severity of COVID-19 [26,27]. Furthermore, studies have revealed that older people, males and individuals with comorbidities are at an increased risk of severe forms of SARS-CoV-2 infection [28,29].
Despite the outcomes of these tremendous and seminal works on linking SARS-CoV-2 infection and COVID-19 disease to age, blood group, haematological parameters and ACE2 levels, these reports are limited to the Asian, American and European regions. Meanwhile, individuals in these regions differ significantly owing to demographic and geographical variations. To illustrate, Africa has a largely youthful population, while Europe and other continents have largely an adult or older population [30,31]. Also, the distributions of the ABO blood groups significantly vary from one continent to the other; blood group A is dominant in Asia, whereas blood group O is dominant in Africa [32,33]. It is thus a challenge to extrapolate this same understanding of the risks of SARS-CoV-2 infection in other regions and/or countries such as Ghana. We thus report here on the haematological profile (complete blood count test parameters, and ABO and Rh blood groups) and plasma ACE2 levels in COVID-19 patients in a major cosmopolitan city in Ghana.

2. Materials and Methods

2.1. Study Sites and Design

This was a cross-sectional study that was conducted between June 2020 and July 2021 at six hospitals, namely, Komfo Anokye Teaching Hospital (KATH), Seventh Day Adventist (SDA) Hospital (Kwadaso), Suntreso Government Hospital (SGH), Kumasi South Hospital (KSH), Maternal and Child Health Hospital (MCHH) and the University Hospital (UH) of the Kwame Nkrumah University of Science and Technology (KNUST), all in the Kumasi Metropolis of the Ashanti Region of Ghana. During the study period, these six hospitals were among the Ghana Health Service/Ministry of Health-accredited hospitals in the Kumasi Metropolis and in the Ashanti Region for screening, testing and managing patients with SARS-CoV-2 infection. The Kumasi Metropolitan Assembly (KMA) is the local governing body responsible for the administration and development of the Kumasi Metropolis (or Kumasi metropolitan area) in Ghana. The capital of the KMA and the Ashanti Region is Kumasi. The metropolis has a population of nearly five hundred thousand [34]. Participants were individuals suspected of having COVID-19 at the isolation centres of the various hospitals who (or their legal caretakers) agreed to partake in this study.

2.2. Study Population and Data Collection

Individuals of all ages suspected of having COVID-19 and presenting to the various hospitals who agreed (or their legal caretakers agreed) were approached to participate. Those who were not at any of the six hospitals or who failed to give consent were excluded. Clinical–demographic data collected included presenting signs and symptoms, reporting facility/hospital, disease severity, age and gender. The severity of COVID-19 was classified as asymptomatic, mild, moderate and severe illness based on the United States National Institutes of Health (NIH) treatment guidelines for classifying the clinical spectrum of SARS-CoV-2 infection [35].

2.3. Laboratory Investigations

For each participant, a nasopharyngeal swab for testing for COVID-19 was collected into a viral transport media (VTM), appropriately labelled and stored at 4 °C in a cold box for transportation. Using standard procedures, 1–3 mL of blood was collected into a tube containing the ethylenediaminetetraacetic acid (EDTA) anticoagulant, appropriately labelled and placed in the cold box for transportation. Samples were transported to the Kumasi Centre for Collaborative Research in Tropical Medicine (KCCR) at KNUST and the Public Health Laboratory (PHL) of the School of Public Health, KNUST, for various laboratory investigations. COVID-19 testing was performed at KCCR, while complete blood count (CBC) test, blood group analysis and plasma ACE2 testing were performed at PHL.
Testing for SARS-CoV-2 was performed by reverse transcription real-time polymerase chain reaction (RT-qPCR) on the nasopharyngeal swabs. Prior to the RT-qPCR, viral RNA was extracted from the swabs using QIAamp viral RNA mini kit (Qiagen, Kobe, Japan), following the manufacturer’s protocol. The DaAnGene (Guandong, China) commercial PCR kit which detects the open reading frame 1 a and b (ORF1ab) and N genes was used for the RT-qPCR assay. The reaction was set up following a modified manufacturer’s protocol, with these cycling conditions: 55 °C for 10 min (reverse transcription), 94 °C for 3 min (initial denaturation), then 45 cycles of 94 °C for 15 s (denaturation) and 54 °C for 30 s (annealing) with the C1000 Touch Thermal Cycler and CFX 96 Real-Time System (Bio-Rad Laboratories, Inc., Cape Town, South Africa). A threshold cycle (Ct value) greater than 40 indicated a negative sample. In each RT-qPCR run, known positive and negative controls, as well as internal controls, were added.
The Sysmex XN 350 haematology auto-analyser (Sysmex Corporation, Kobe, Japan) was used for the CBC test at the PHL. A small volume of the well-mixed EDTA sample was aspirated using the suction probe of the analyser. Following auto-analysis, the results were displayed on the analyser and subsequently printed on paper. Quality control was performed daily prior to analyses of the study samples. The instrument generated 28 CBC test parameters including the red cell indices, platelet indices and 5-part white blood cell differentials.
The ABO and Rh blood group analyses were carried out by using the tube grouping method using anti-A, anti-B and anti-D monoclonal antibody kits (Bio Lab Diagnostics, Mumbai, India). Generally, a sample of each homogenous EDTA whole blood was saline washed and a final cell suspension of 2–5% was prepared. Two volumes of anti-A, anti-B or anti-D antisera were added to a volume of 2–5% red cell suspension. The mixture was incubated at room temperature (20–24 °C) for 5 min, centrifuged at 1000 rpm for 1 min and checked for agglutination against a well-lit background. Agglutination, seen in 1 min, indicated the presence of the corresponding antigen in the sample. Prior to each batch analysis, internal quality controls were performed using known cells. The results were interpreted according to the manufacturer’s protocol.
Following the CBC test and blood grouping, the remaining blood sample in the EDTA tube was centrifuged at 2500× g for 10 min to separate the plasma from the blood cells. Plasma aliquots were made and were stored at −20 °C prior to batch analysis. Plasma ACE2 was quantitatively determined by sandwich enzyme-linked immunosorbent assay (ELISA) using Biomatik human ACE2 ELISA kits (#EKF5832, Biomatik, Kitchener, ON, Canada). Each frozen plasma was allowed to thaw and equilibrate to room temperature before ACE2 levels were estimated according to the manufacturer’s protocol. Each batch of analysis included a blank to account for background absorbance and seven (7) standards generated through serial dilution, which were also used to generate the standard curve and to derive the concentrations of ACE2 in the plasma samples of the participants. For the acceptability of a run, no more than three overall and/or two consecutive deletions was allowed in the standard curve.

2.4. Data Analysis

Analyses were run using IBM SPSS Statistics for Macintosh, version 25.0 (IBM Corp., Armonk, NY, USA). A one-sample Kolmogorov–Smirnov test and the Shapiro–Wilk normality test were used to assess the distributions of the data. Descriptive statistics were computed for continuous and categorical variables. Descriptive data are presented as frequencies with corresponding percentages for categorical variables. Quantitative non-parametric data are presented in median (1st–3rd quartiles or interquartile range, IQR). For various comparisons, participants were grouped based on SARS-CoV-2 status, COVID-19 disease severity, gender, predefined age groups, and ABO and Rh blood types; Kruskal–Wallis tests or, where necessary, Chi square/Fisher’s tests were performed to assess differences between these groups. Statistical analyses were performed only on participants with complete data for the variables analysed; variables with incomplete/no data were excluded from analyses that related to them. Statistical significance based on a two-sided hypothesis was set at p < 0.05.

3. Results

3.1. General Description of Study Participants

In total, 515 participants were included in this study. Males constituted the majority of the patients screened for infection with SARS-CoV-2 (n = 288/515, 55.9%). The overall median age of the study participants was 37 years (IQR = 26–53). The majority (n = 190/515, 36.9%) of the participants were enrolled at the Komfo Anokye Teaching Hospital (KATH). Blood group O (n = 260/490, 53.1%) was the commonest ABO blood type, and 89.2% (n = 437/490) of the participants were positive for the Rh ‘D’ antigen. Overall, a little over half of the study participants (n = 259/515, 50.3%) tested positive for SARS-CoV-2. However, only 1.5% (n = 4/259) of the positive cases presented with the severe form of COVID-19 illness (Table 1), and this group made up 0.8% (n = 4/515) of the total participants.

3.2. Relationship between COVID-19, Participant Demographics and Selected Laboratory Parameters

The SARS-CoV-2-negative participants were significantly (p = 0.002) younger (36 years, IQR = 24–50) than the SARS-CoV-2-positive (39 years, IQR = 29–57) participants. There was no statistical difference between the SARS-CoV-2-positive and SARS-CoV-2-negative groups in terms of gender (p = 0.496), ABO blood group (p = 0.711) or Rh ‘D’ factor (p = 0.805). Still, there were more participants with blood group O who tested positive (n = 139) than those in group O who tested negative (n = 121) (Table 2).

3.3. Complete Blood Count Parameters, Plasma ACE2 Levels and COVID-19 Status

The SARS-CoV-2-positive participants had significantly lower MCV (83.4 fL, IQR = 78.9–89.0, p < 0.001) associated with significantly reduced HCT (38.3%, IQR = 32.7–42.4, p = 0.023) and high MCHC (33.1 g/dL, IQR = 31.80–34.40, p < 0.001) compared to their SARS-CoV-2-negative counterparts; however, these variations did not significantly affect the haemoglobin (HGB) concentration (p = 0.630) and the red cell (RBC) count (p = 0.929) between the two groups. Also, platelet (PLT) count was significantly increased (230 ×103/μL, IQR = 159–305, p = 0.046), with a decreased mean platelet volume (MPV) (11 fL, IQR = 10.30–11.60, p < 0.001) in SARS-CoV-2-positive participants compared to SARS-CoV-2-negative participants. Additionally, SARS-CoV-2-positive participants presented with significantly elevated total WBC count (p = 0.006), with an associated significant increase in neutrophil (p = 0.002) and with reduced basophil (p < 0.001) fractions compared to SARS-CoV-2-negative counterparts. To explore the association between ACE2 levels and susceptibility to SARS-CoV-2, 112 and 56 participants with complete demographic and other laboratory data, and who were, respectively, positive and negative for SARS-CoV-2 RT-qPCR, were randomly selected. Plasma ACE2 levels were not found to be significantly different (p = 0.079) between SARS-CoV-2-negative and SARS-CoV-2-positive participants, although the levels were higher in the latter group (45.37 ng/mL, IQR = 37.68–55.88) than in the former group (41.55 ng/mL, IQR = 34.97–51.63) (Table 3).

3.4. Levels of Full Blood Count Parameters with Severity of SARS-CoV-2 Infection

Table 4 shows the age and blood cell indices stratified by COVID-19 severity, namely, asymptomatic, mild, moderate and severe. There were significant variations among the groups with respect to age (p < 0.001), RBC count (p = 0.014), haemoglobin concentration, HGB (p = 0.003), haematocrit, HCT (p = 0.001), platelet (PLT) count (p = 0.023), thrombocrit, PCT (0.042), white blood cell (WBC) count (p < 0.001), neutrophil (NEUT) count (p < 0.001), lymphocyte (LYMPH) count (p < 0.001) and eosinophil (EO) count (p = 0.001). Generally, among these CBC parameters, from asymptomatic to mild to moderate to severe COVID-19 illness, a downward trend was observed in the levels of each of RBC, HGB, HCT, PLT, PCT, LYMPH and EO, as opposed to an upward trend in the same order of COVID-19 severity in the WBC and NEUT counts.

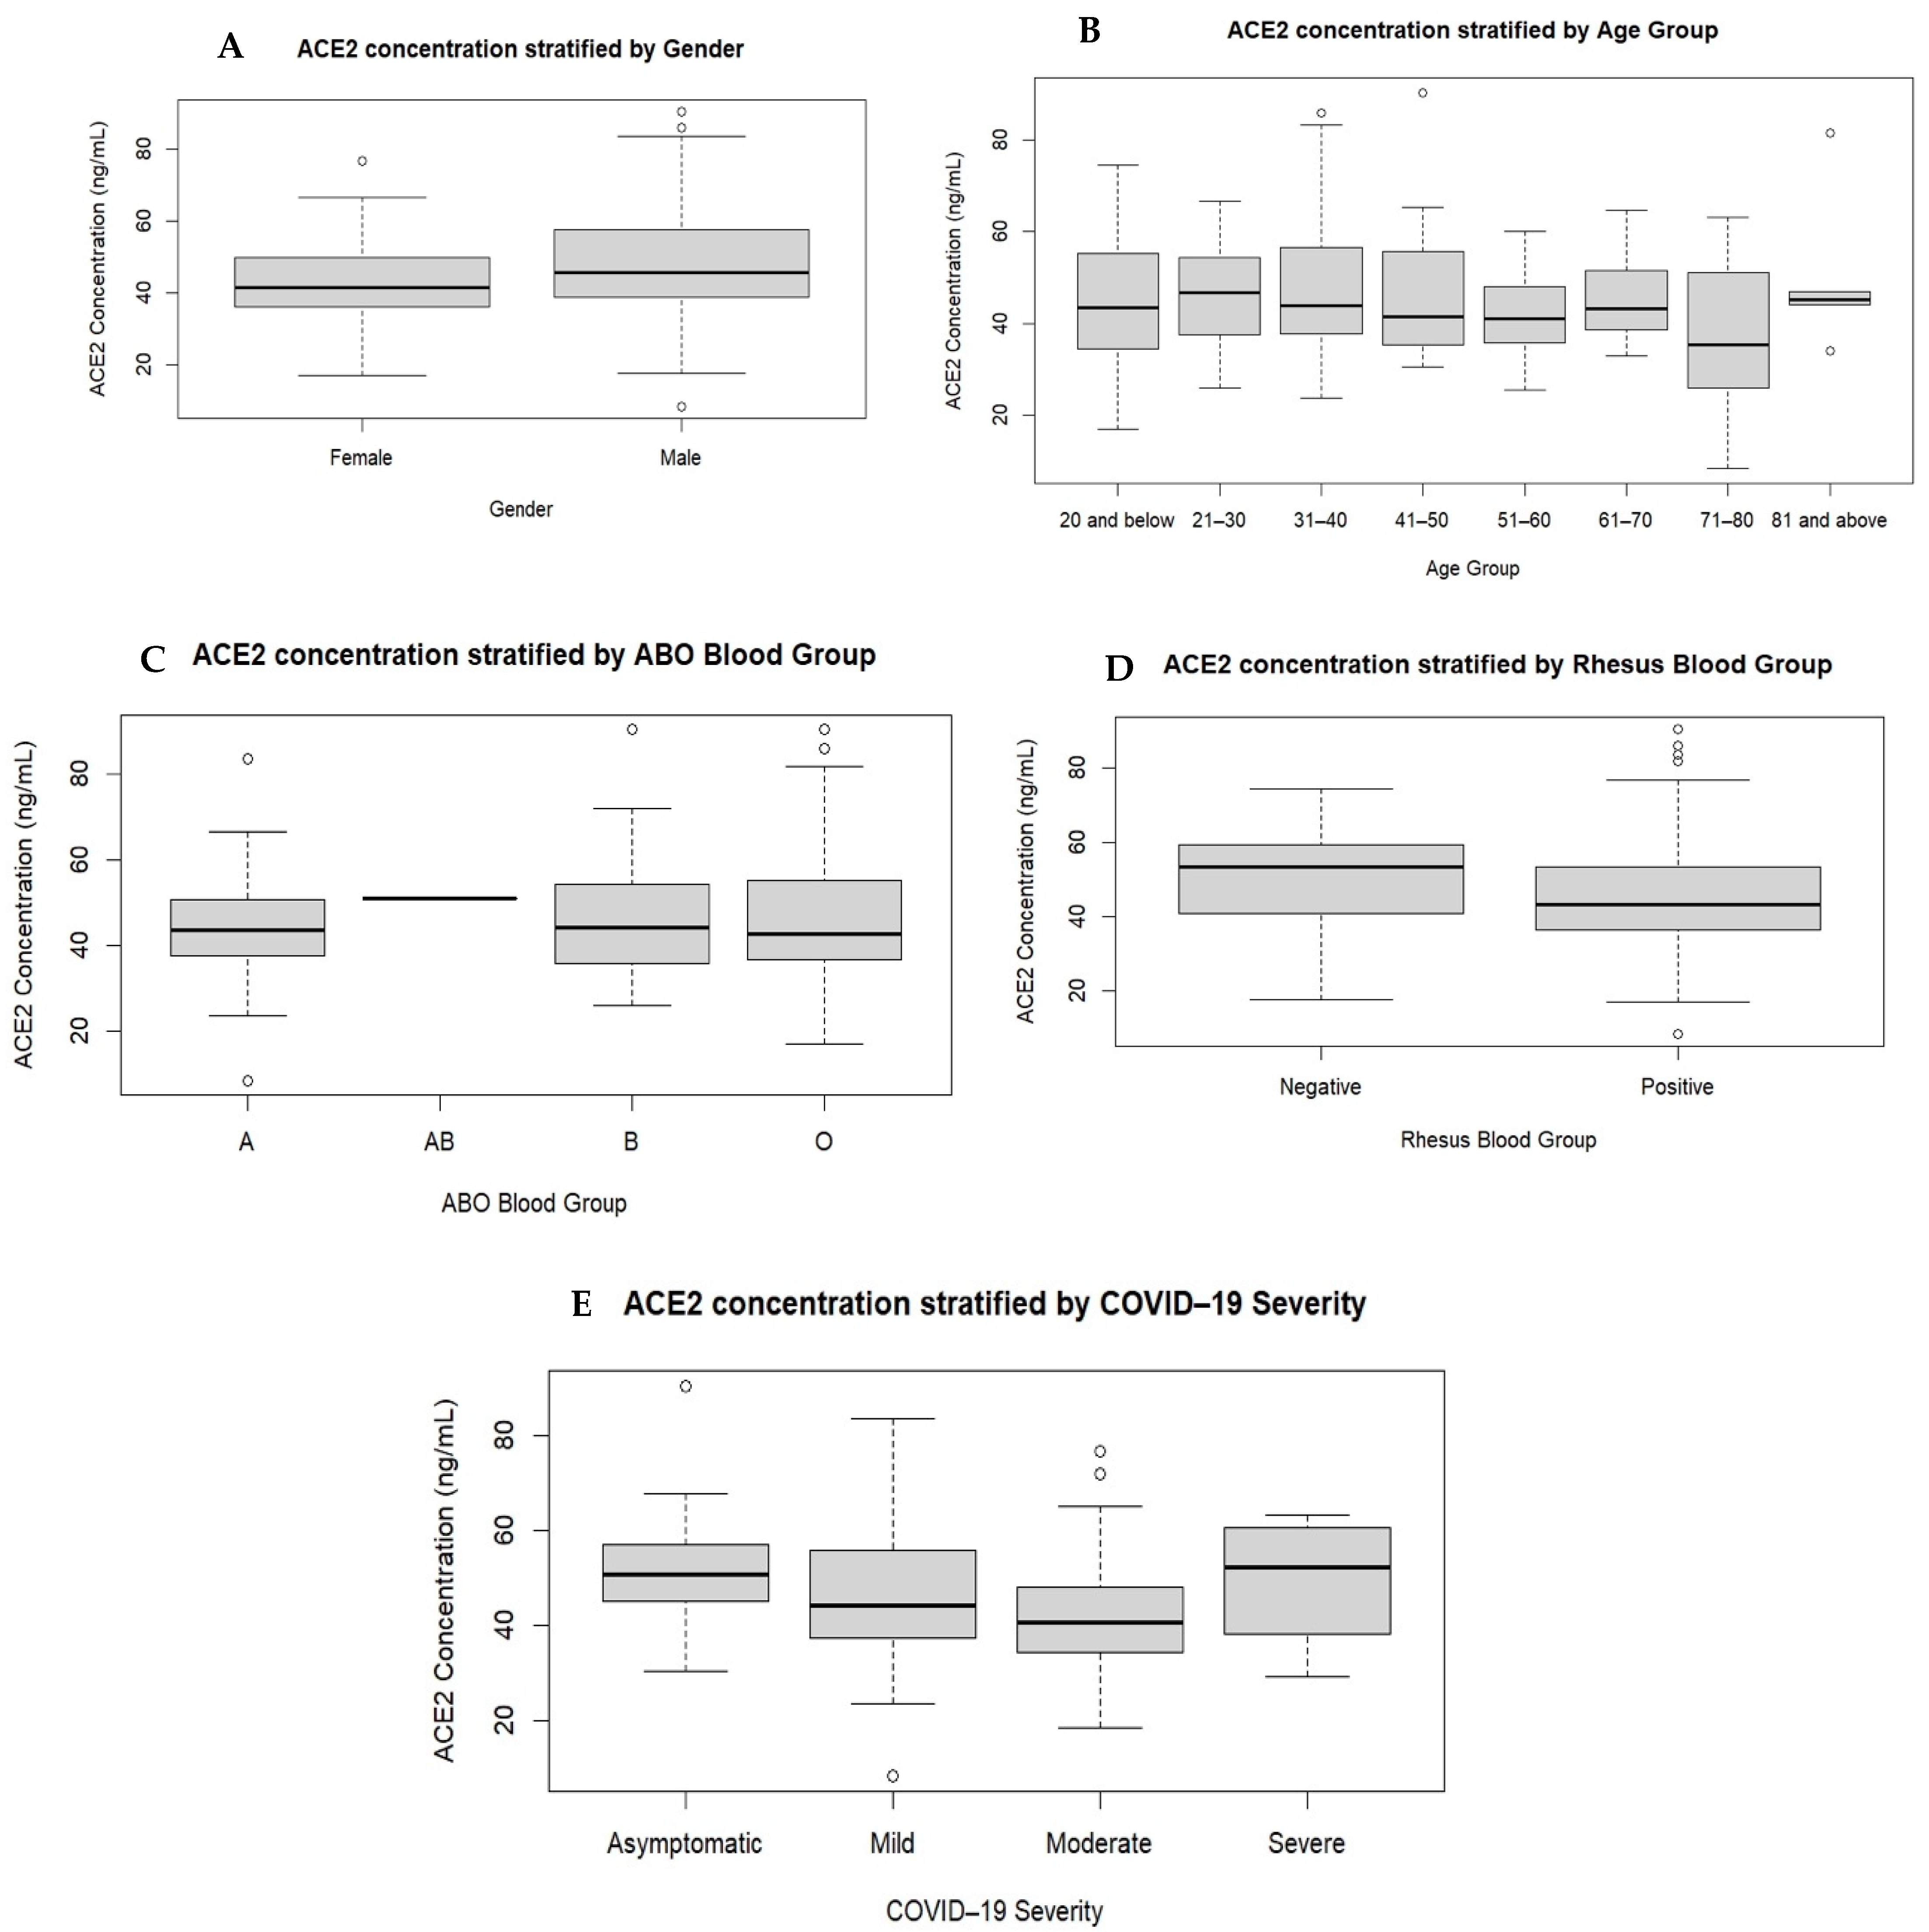
3.5. Plasma ACE2 Levels by Gender, Age, Blood Type and COVID-19 Infection Severity Level

To determine the relationship between ACE2 levels and the severity of COVID-19 illness, gender, age or blood group, plasma levels of ACE2 were stratified by the aforementioned parameters. Comparing the median (IQR) among the participants based on the selected groups showed no variations in plasma ACE2 levels for age (p = 0.726), ABO blood type (p = 0.887) or Rhesus blood type (p = 0.073). However, plasma ACE2 levels were significantly (p = 0.032) higher in males (45.53 ng/mL, IQR = 38.61–57.59) than in females (41.43 ng/mL, IQR = 35.93–50.26). Although plasma ACE2 levels also significantly varied (p = 0.024) among participants based on COVID-19 severity, a Bonferroni post hoc analysis revealed that the significant variation (p = 0.015) lay only between those showing asymptomatic illness (50.61 ng/mL, IQR = 43.90–58.61) and those showing moderate illness (40.68 ng/mL, IQR = 34.09–48.10), and this latter group had the least concentration of plasma ACE2.

4. Discussion

This study showed significant differences with respect to age between those infected and those not infected with SARS-CoV-2. Participants with the infection were older than those who tested negative. It is worthy of note that more than a third of the participants who were SARS-CoV-2 positive were at least 51 years old. Consistent with other studies, we have shown that older individuals are more susceptible to COVID-19 [29,36,37,38,39]. A reason for such a susceptibility in these older age groups may be attributed to the increased expression in respiratory tissues of the angiotensin-converting enzyme 2 receptor (ACE2R) [7,8]. The virus invades host cells using the ACE2R [36,39], and as such, their increased tissue expression during old age may explain why older people are significantly more likely to have COVID-19 than younger people. Furthermore, immunosuppression resulting from senescence/aging especially in the geriatric age group of 81 years and above may also explain the susceptibility to infection with SARS-CoV-2 [29,39]. Although there were more males than females, gender was not associated with infection with the SARS-CoV-2 virus, as has been reported in other studies [1,40,41].
Several other studies suggest that ABO blood type may contribute to disease susceptibility, with group O showing less susceptibility and group A more susceptibility to COVID-19 [24,42,43]. Furthermore, the severity of COVID-19 has also been associated with the same ABO blood group susceptibility, where group A is a risk factor for severe disease [42]. These notwithstanding, the findings of this study show that blood group O may not be protective against SARS-CoV-2 infection, and blood group A may not be a risk factor for COVID-19. There was no significant association between ABO blood group and positive COVID-19 status. The contrast between the findings of this study and those previously reported by other investigators may be due to variations in geographical locations of the study and their associated different predominant ABO blood type in the local populations [36,39]. As an example, studies that reported group A as a risk factor for COVID-19 and its severity were from Asia, where blood group A is predominant [18,24,42]. Meanwhile, O is the predominant blood group among the participants in the present study and in the country Ghana [32,39]. Some studies have reported an association between the Rh factor and COVID-19 [37,44]. However, we did not find such association between the Rh factor and COVID-19. This adds to the already published data [36,38] that show such an outcome when the link between the Rh factor and susceptibility to COVID-19 was investigated.
Among the common haematological parameters associated with SARS-CoV-2 infection and COVID-19 disease severity are anaemia [45,46], leukocytosis [47,48], lymphocytopenia [49,50] and neutrophilia [47]. We found anaemia, leukocytosis, lymphocytopenia and neutrophilia to similarly change with increasing disease severity, consistent with the other named reports. The occurrence of lymphocytopenia could be explained by the virus attaching to this WBC subtype or by sequestration of the lymphocytes to sites of inflammation in the tissues [48,49,51,52]. Still, the exact mechanism of lymphocytopenia or anaemia in the participants is not known and may require further studies.
The plasma ACE2 levels were measured using ELISA techniques. While plasma ACE2 concentration was not affected by ABO or Rh blood group, or the age of participants, there were significant correlations associated with ACE2 levels and gender, and disease severity (Table 3 and Figure 1), similar to other reports [53,54]. The reasons for higher plasma ACE2 levels in males than in females include sex hormones, such as androgens (e.g., testosterone) and oestrogens, that are known to influence the expression of ACE2. Androgens upregulate ACE2 expression, potentially contributing to higher levels of ACE2 in males. Conversely, oestrogens downregulate ACE2 expression. These hormonal differences play a role in the observed sex differences in plasma ACE2 levels [54,55]. Genetic differences between males and females influence ACE2 expression. The ACE2 gene is expressed on the X chromosome, and thus, the protein is much more translated from the single X chromosome in males than in females [56]. While plasma ACE2 levels do not vary significantly between SARS-CoV-2-positive and SARS-CoV-2-negative individuals (Table 3), here, in the SARS-CoV-2-positive participants, plasma ACE2 levels were significantly different only between the asymptomatic illness group and the moderate group. The patterns of plasma ACE2 seen in these participants suggest that plasma ACE2 levels may not be a good marker to predict worsening illness. The present study could not provide data on the comorbidities of the participants. Also, this study could not measure plasma ACE2 levels for all participants owing to financial constraint. Future studies may look into this to provide additional information on the influence of ACE2 levels on COVID-19 in comorbid patients using large study data. These studies may focus on the levels of plasma and/or tissue ACE2 or ACE2Rs.

5. Conclusions

We established an association between age and COVID-19. However, there was no statistically significant association between ABO or Rh blood groups and COVID-19 infection, as well as plasma ACE2 levels and susceptibility to SARS-CoV-2 infection. Lymphocytopenia was associated with disease severity and may be a good biomarker to monitor disease severity.
Further studies are required to help understand the exact contributions of ABO and Rh antigens and the anti-A and anti-B antibodies towards COVID-19 infection.

Author Contributions

Conceptualisation, E.B.A., M.O. and E.O.-D.; methodology, E.B.A., J.K.B., M.O. and E.O.-D.; validation, M.O. and E.O.-D.; formal analysis, E.B.A. and M.O.; investigation, E.B.A., J.K.B., J.S.K., A.A.A., D.A., G.N., A.A., N.K., L.D.A. and N.K.A.-B.; resources, E.O.-D., M.O., A.S., R.O.P. and N.K.A.-B.; data curation, E.B.A., J.K.B., J.S.K., A.A.A., D.A., G.N., A.A. and M.O.; writing—original draft preparation, E.B.A. and M.O.; writing—review and editing, E.B.A., M.O., B.S., N.K.A.-B., A.S., R.O.P. and E.O.-D.; visualisation, E.B.A., M.O., B.S., N.K.A.-B., A.S., R.O.P. and E.O.-D.; supervision, M.O., B.S., N.K.A.-B., A.S., R.O.P. and E.O.-D.; project administration, M.O. and E.O.-D.; funding acquisition, M.O. and E.O.-D. All authors have read and agreed to the published version of the manuscript.

Funding

This project received no external funding.

Institutional Review Board Statement

This study was conducted according to the guidelines of the Declaration of Helsinki and approved by the Institutional Review Board of the Komfo Anokye Teaching Hospital (protocol number KATH IRB/AP/012/21) and the Committee on Human Research, Publication and Ethics of the Kwame Nkrumah University of Science and Technology (protocol number CHRPE/AP/189/21, and amended protocol number CHRPE/AP/012/22).

Informed Consent Statement

Informed consent was obtained from all participants involved in this study.

Data Availability Statement

Source data are available on request.

Acknowledgments

The excellent supporting work of the Ashanti Regional COVID-19 Response Team is gratefully acknowledged.

Conflicts of Interest

The authors declare no conflicts of interest.

References

  1. Huang, C.; Wang, Y.; Li, X.; Ren, L.; Zhao, J.; Hu, Y.; Zhang, L.; Fan, G.; Xu, J.; Gu, X. Clinical features of patients infected with 2019 novel coronavirus in Wuhan, China. Lancet 2020, 395, 497–506. [Google Scholar] [CrossRef]
  2. WHO. World Health Organization Coronavirus Disease (COVID-19) Dashboard for Ghana. Available online: https://covid19.who.int/ (accessed on 12 June 2023).
  3. GHS. Ghana Health Service—COVID-19 Dashboard. Available online: https://www.ghs.gov.gh/covid19/archive.php# (accessed on 16 June 2023).
  4. Carabelli, A.M.; Peacock, T.P.; Thorne, L.G.; Harvey, W.T.; Hughes, J.; COVID-19 Genomics UK Consortium; Peacock, S.J.; Barclay, W.S.; de Silva, T.I.; Towers, G.J. SARS-CoV-2 variant biology: Immune escape, transmission and fitness. Nat. Rev. Microbiol. 2023, 21, 162–177. [Google Scholar] [CrossRef] [PubMed]
  5. Morang’a, C.M.; Ngoi, J.M.; Gyamfi, J.; Amuzu, D.S.; Nuertey, B.D.; Soglo, P.M.; Appiah, V.; Asante, I.A.; Owusu-Oduro, P.; Armoo, S. Genetic diversity of SARS-CoV-2 infections in Ghana from 2020–2021. Nat. Commun. 2022, 13, 2494. [Google Scholar] [CrossRef] [PubMed]
  6. WHO. Statement on the Fifteenth Meeting of the IHR (2005) Emergency Committee on the COVID-19 Pandemic. Available online: https://www.who.int/news/item/05-05-2023-statement-on-the-fifteenth-meeting-of-the-international-health-regulations-(2005)-emergency-committee-regarding-the-coronavirus-disease-(covid-19)-pandemic (accessed on 12 June 2023).
  7. Chen, J.; Jiang, Q.; Xia, X.; Liu, K.; Yu, Z.; Tao, W.; Gong, W.; Han, J.D.J. Individual variation of the SARS-CoV-2 receptor ACE2 gene expression and regulation. Aging Cell 2020, 19, e13168. [Google Scholar] [CrossRef] [PubMed]
  8. Xudong, X.; Junzhu, C.; Xingxiang, W.; Furong, Z.; Yanrong, L. Age-and gender-related difference of ACE2 expression in rat lung. Life Sci. 2006, 78, 2166–2171. [Google Scholar] [CrossRef] [PubMed]
  9. Atlas, S.A. The renin-angiotensin aldosterone system: Pathophysiological role and pharmacologic inhibition. J. Manag. Care Pharm. 2007, 13, 9–20. [Google Scholar] [CrossRef]
  10. Flack, J.M.; Atlas, S.A.; Pool, J.L.; White, W.B. Renin-angiotensin aldosterone system and hypertension: Current approaches and future directions. J. Manag. Care Pharm. 2007, 13, 1–39. [Google Scholar] [CrossRef]
  11. Patel, S.K.; Juno, J.A.; Lee, W.S.; Wragg, K.M.; Hogarth, P.M.; Kent, S.J.; Burrell, L.M. Plasma ACE2 activity is persistently elevated following SARS-CoV-2 infection: Implications for COVID-19 pathogenesis and consequences. Eur. Respir. J. 2021, 57, 2003730. [Google Scholar] [CrossRef]
  12. van Lier, D.; Kox, M.; Santos, K.; van der Hoeven, H.; Pillay, J.; Pickkers, P. Increased blood angiotensin converting enzyme 2 activity in critically ill COVID-19 patients. ERJ Open Res. 2021, 7, 00848–2020. [Google Scholar] [CrossRef]
  13. Emilsson, V.; Gudmundsson, E.F.; Aspelund, T.; Jonsson, B.G.; Gudjonsson, A.; Launer, L.J.; Lamb, J.R.; Gudmundsdottir, V.; Jennings, L.L.; Gudnason, V. ACE2 levels are altered in comorbidities linked to severe outcome in COVID-19. MedRxiv 2020. [Google Scholar] [CrossRef]
  14. Emilsson, V.; Gudmundsson, E.F.; Aspelund, T.; Jonsson, B.G.; Gudjonsson, A.; Launer, L.J.; Lamb, J.R.; Gudmundsdottir, V.; Jennings, L.L.; Gudnason, V. Serum levels of ACE2 are higher in patients with obesity and diabetes. Obes. Sci. Pract. 2021, 7, 239–243. [Google Scholar] [CrossRef] [PubMed]
  15. Fagyas, M.; Kertész, A.; Siket, I.M.; Bánhegyi, V.; Kracskó, B.; Szegedi, A.; Szokol, M.; Vajda, G.; Rácz, I.; Gulyás, H. Level of the SARS-CoV-2 receptor ACE2 activity is highly elevated in old-aged patients with aortic stenosis: Implications for ACE2 as a biomarker for the severity of COVID-19. Geroscience 2021, 43, 19–29. [Google Scholar] [CrossRef] [PubMed]
  16. Narula, S.; Yusuf, S.; Chong, M.; Ramasundarahettige, C.; Rangarajan, S.; Bangdiwala, S.I.; van Eikels, M.; Leineweber, K.; Wu, A.; Pigeyre, M. Plasma ACE2 and risk of death or cardiometabolic diseases: A case-cohort analysis. Lancet 2020, 396, 968–976. [Google Scholar] [CrossRef] [PubMed]
  17. Sama, I.E.; Ravera, A.; Santema, B.T.; Van Goor, H.; Ter Maaten, J.M.; Cleland, J.G.; Rienstra, M.; Friedrich, A.W.; Samani, N.J.; Ng, L.L. Circulating plasma concentrations of angiotensin-converting enzyme 2 in men and women with heart failure and effects of renin–angiotensin–aldosterone inhibitors. Eur. Heart J. 2020, 41, 1810–1817. [Google Scholar] [CrossRef] [PubMed]
  18. Liu, N.; Zhang, T.; Ma, L.; Zhang, H.; Wang, H.; Wei, W.; Pei, H.; Li, H. The impact of ABO blood group on COVID-19 infection risk and mortality: A systematic review and meta-analysis. Blood Rev. 2021, 48, 100785. [Google Scholar] [CrossRef]
  19. Jing, W.; Zhao, S.; Liu, J.; Liu, M. ABO blood groups and hepatitis B virus infection: A systematic review and meta-analysis. BMJ Open 2020, 10, e034114. [Google Scholar] [CrossRef]
  20. Lindesmith, L.; Moe, C.; Marionneau, S.; Ruvoen, N.; Jiang, X.; Lindblad, L.; Stewart, P.; LePendu, J.; Baric, R. Human susceptibility and resistance to Norwalk virus infection. Nat. Med. 2003, 9, 548–553. [Google Scholar] [CrossRef]
  21. Boren, T.; Falk, P.; Roth, K.A.; Larson, G.; Normark, S. Attachment of Helicobacter pylori to human gastric epithelium mediated by blood group antigens. Science 1993, 262, 1892–1895. [Google Scholar] [CrossRef]
  22. Wang, D.S.; Chen, D.L.; Ren, C.; Wang, Z.Q.; Qiu, M.Z.; Luo, H.Y.; Zhang, D.S.; Wang, F.H.; Li, Y.H.; Xu, R.H. ABO blood group, hepatitis B viral infection and risk of pancreatic cancer. Int. J. Cancer 2012, 131, 461–468. [Google Scholar] [CrossRef]
  23. Cheng, Y.; Cheng, G.; Chui, C.; Lau, F.; Chan, P.K.; Ng, M.H.; Sung, J.J.; Wong, R.S. ABO blood group and susceptibility to severe acute respiratory syndrome. JAMA 2005, 293, 1447–1451. [Google Scholar] [CrossRef]
  24. Wu, Y.; Feng, Z.; Li, P.; Yu, Q. Relationship between ABO blood group distribution and clinical characteristics in patients with COVID-19. Clin. Chim. Acta 2020, 509, 220–223. [Google Scholar] [CrossRef]
  25. Chakkour, M.; Salami, A.; Olleik, D.; Kamal, I.; Noureddine, F.Y.; El Roz, A.; Ghssein, G. Risk Markers of COVID-19, a Study from South-Lebanon. Covid 2022, 2, 867–876. [Google Scholar] [CrossRef]
  26. Abdullah, I.; Cornelissen, H.M.; Musekwa, E.; Zemlin, A.; Jalavu, T.; Mashigo, N.; Chetty, C.; Nkosi, N.; Chapanduka, Z.C. Hematological findings in adult patients with SARS CoV-2 infection at Tygerberg Hospital Cape Town South Africa. Health Sci. Rep. 2022, 5, e550. [Google Scholar] [CrossRef] [PubMed]
  27. Terpos, E.; Ntanasis-Stathopoulos, I.; Elalamy, I.; Kastritis, E.; Sergentanis, T.N.; Politou, M.; Psaltopoulou, T.; Gerotziafas, G.; Dimopoulos, M.A. Hematological findings and complications of COVID-19. Am. J. Hematol. 2020, 95, 834–847. [Google Scholar] [CrossRef] [PubMed]
  28. Lovato, A.; de Filippis, C. Clinical presentation of COVID-19: A systematic review focusing on upper airway symptoms. Ear Nose Throat J. 2020, 99, 569–576. [Google Scholar] [CrossRef]
  29. Lansbury, L.; Lim, B.; Baskaran, V.; Lim, W.S. Co-infections in people with COVID-19: A systematic review and meta-analysis. J. Infect. 2020, 81, 266–275. [Google Scholar] [CrossRef]
  30. Bamgboye, E.L.; Omiye, J.A.; Afolaranmi, O.J.; Davids, M.R.; Tannor, E.K.; Wadee, S.; Niang, A.; Were, A.; Naicker, S. COVID-19 pandemic: Is Africa different? J. Natl. Med. Assoc. 2021, 113, 324–335. [Google Scholar] [CrossRef]
  31. Adams, J.; MacKenzie, M.J.; Amegah, A.K.; Ezeh, A.; Gadanya, M.A.; Omigbodun, A.; Sarki, A.M.; Thistle, P.; Ziraba, A.K.; Stranges, S. The conundrum of low COVID-19 mortality burden in sub-Saharan Africa: Myth or reality? Glob. Health Sci. Pract. 2021, 9, 433–443. [Google Scholar] [CrossRef]
  32. Doku, G.N.; Agbozo, W.K.; Annor, R.A.; Kisseh, G.D.; Owusu, M.A. Frequency of ABO/Rhesus (D) blood groupings and ethnic distribution in the Greater-Accra region of Ghana, towards effective blood bank inventory. Int. J. Immunogenet. 2019, 46, 67–73. [Google Scholar] [CrossRef]
  33. Apecu, R.O.; Mulogo, E.M.; Bagenda, F.; Byamungu, A. ABO and Rhesus (D) blood group distribution among blood donors in rural south western Uganda: A retrospective study. BMC Res. Notes 2016, 9, 513. [Google Scholar] [CrossRef]
  34. GSS. 2021 Population and Housing Census—Press Release on Provisional Results. Available online: https://statsghana.gov.gh/gssmain/fileUpload/pressrelease/2021%20PHC%20Provisional%20Results%20Press%20Release.pdf (accessed on 22 May 2023).
  35. WHO. Clinical Management of COVID-19: Living Guideline. Available online: https://app.magicapp.org/#/guideline/j1WBYn (accessed on 12 June 2023).
  36. Goel, R.; Bloch, E.M.; Pirenne, F.; Al-Riyami, A.Z.; Crowe, E.; Dau, L.; Land, K.; Townsend, M.; Jecko, T.; Rahimi-Levene, N. ABO blood group and COVID-19: A review on behalf of the ISBT COVID-19 working group. Vox Sang. 2021, 116, 849–861. [Google Scholar] [CrossRef] [PubMed]
  37. Latz, C.A.; DeCarlo, C.; Boitano, L.; Png, C.M.; Patell, R.; Conrad, M.F.; Eagleton, M.; Dua, A. Blood type and outcomes in patients with COVID-19. Ann. Hematol. 2020, 99, 2113–2118. [Google Scholar] [CrossRef] [PubMed]
  38. Nalbant, A.; Aydın, A.; Yaylacı, S.; Kaya, T.; Wermeulen, C.L.; Cinemre, H. Association of ABO blood group and age with COVID-19 positive test. Rev. Assoc. Médica Bras. 2021, 67, 46–50. [Google Scholar] [CrossRef] [PubMed]
  39. Udoakang, A.; Oboh, M.; Henry-Ajala, A.; Anyigba, C.; Omoleke, S.; Amambua-Ngwa, A.; Paemka, L.; Awandare, G.; Quashie, P. Low COVID-19 impact in Africa: The multifactorial Nexus. AAS Open Res. 2021, 4, 47. [Google Scholar] [CrossRef]
  40. Gebhard, C.; Regitz-Zagrosek, V.; Neuhauser, H.K.; Morgan, R.; Klein, S.L. Impact of sex and gender on COVID-19 outcomes in Europe. Biol. Sex Differ. 2020, 11, 29. [Google Scholar] [CrossRef]
  41. Ali, H.N.; Ali, K.M.; Rostam, H.M.; Ali, A.M.; Tawfeeq, H.M.; Fatah, M.H.; Figueredo, G.P. Clinical laboratory parameters and comorbidities associated with severity of coronavirus disease 2019 (COVID-19) in Kurdistan Region of Iraq. Pract. Lab. Med. 2022, 31, e00294. [Google Scholar] [CrossRef]
  42. Dai, X. ABO blood group predisposes to COVID-19 severity and cardiovascular diseases. Eur. J. Prev. Cardiol. 2020, 27, 1436–1437. [Google Scholar] [CrossRef]
  43. Zhou, F.; Yu, T.; Du, R.; Fan, G.; Liu, Y.; Liu, Z.; Xiang, J.; Wang, Y.; Song, B.; Gu, X. Clinical course and risk factors for mortality of adult inpatients with COVID-19 in Wuhan, China: A retrospective cohort study. Lancet 2020, 395, 1054–1062. [Google Scholar] [CrossRef]
  44. Zietz, M.; Zucker, J.; Tatonetti, N.P. Associations between blood type and COVID-19 infection, intubation, and death. Nat. Commun. 2020, 11, 5761. [Google Scholar] [CrossRef]
  45. Wang, L.; Duan, Y.; Zhang, W.; Liang, J.; Xu, J.; Zhang, Y.; Wu, C.; Xu, Y.; Li, H. Epidemiologic and clinical characteristics of 26 cases of COVID-19 arising from patient-to-patient transmission in Liaocheng, China. Clin. Epidemiol. 2020, 12, 387–391. [Google Scholar] [CrossRef]
  46. Cen, Y.; Chen, X.; Shen, Y.; Zhang, X.-H.; Lei, Y.; Xu, C.; Jiang, W.-R.; Xu, H.-T.; Chen, Y.; Zhu, J. Risk factors for disease progression in patients with mild to moderate coronavirus disease 2019—A multi-centre observational study. Clin. Microbiol. Infect. 2020, 26, 1242–1247. [Google Scholar] [CrossRef] [PubMed]
  47. Diao, B.; Wang, C.; Tan, Y.; Chen, X.; Liu, Y.; Ning, L.; Chen, L.; Li, M.; Liu, Y.; Wang, G. Reduction and functional exhaustion of T cells in patients with coronavirus disease 2019 (COVID-19). Front. Immunol. 2020, 11, 827. [Google Scholar] [CrossRef] [PubMed]
  48. Huang, W.; Berube, J.; McNamara, M.; Saksena, S.; Hartman, M.; Arshad, T.; Bornheimer, S.J.; O’Gorman, M. Lymphocyte subset counts in COVID-19 patients: A meta-analysis. Cytom. Part A 2020, 97, 772–776. [Google Scholar] [CrossRef] [PubMed]
  49. Huang, I.; Pranata, R. Lymphopenia in severe coronavirus disease-2019 (COVID-19): Systematic review and meta-analysis. J. Intensive Care 2020, 8, 36. [Google Scholar] [CrossRef] [PubMed]
  50. Qin, C.; Zhou, L.; Hu, Z.; Zhang, S.; Yang, S.; Tao, Y.; Xie, C.; Ma, K.; Shang, K.; Wang, W.; et al. Dysregulation of immune response in patients with COVID-19 in Wuhan, China; clinical infectious diseases; Oxford academic. Clin. Infect. Dis. 2020, 71, 762–768. [Google Scholar] [CrossRef]
  51. Chen, J.; Pan, Y.; Li, G.; Xu, W.; Zhang, L.; Yuan, S.; Xia, Y.; Lu, P.; Zhang, J. Distinguishing between COVID-19 and influenza during the early stages by measurement of peripheral blood parameters. J. Med. Virol. 2021, 93, 1029–1037. [Google Scholar] [CrossRef]
  52. Palladino, M. Complete blood count alterations in COVID-19 patients: A narrative review. Biochem. Medica 2021, 31, 030501. [Google Scholar] [CrossRef]
  53. Reindl-Schwaighofer, R.; Hödlmoser, S.; Eskandary, F.; Poglitsch, M.; Bonderman, D.; Strassl, R.; Aberle, J.H.; Oberbauer, R.; Zoufaly, A.; Hecking, M. ACE2 elevation in severe COVID-19. Am. J. Respir. Crit. Care Med. 2021, 203, 1191–1196. [Google Scholar] [CrossRef]
  54. Swärd, P.; Edsfeldt, A.; Reepalu, A.; Jehpsson, L.; Rosengren, B.E.; Karlsson, M.K. Age and sex differences in soluble ACE2 may give insights for COVID-19. Crit. Care 2020, 24, 221. [Google Scholar] [CrossRef]
  55. Viveiros, A.; Gheblawi, M.; Aujla, P.K.; Sosnowski, D.K.; Seubert, J.M.; Kassiri, Z.; Oudit, G.Y. Sex-and age-specific regulation of ACE2: Insights into severe COVID-19 susceptibility. J. Mol. Cell. Cardiol. 2022, 164, 13–16. [Google Scholar] [CrossRef]
  56. Viveiros, A.; Rasmuson, J.; Vu, J.; Mulvagh, S.L.; Yip, C.Y.; Norris, C.M.; Oudit, G.Y. Sex differences in COVID-19: Candidate pathways, genetics of ACE2, and sex hormones. Am. J. Physiol.-Heart Circ. Physiol. 2021, 320, H296–H304. [Google Scholar] [CrossRef] [PubMed]
Figure 1. Comparison of ACE2 levels stratified by gender, age, and ABO and Rhesus blood groups. The participants were grouped according to gender (A), age groups (B), ABO (C) and Rhesus (D) blood types, and severity of COVID-19 (E). There were no significant variations in the plasma ACE2 levels based on age group (p = 0.726), and ABO (p = 0.887) and Rhesus (p = 0.073) blood types. The plasma ACE2 levels showed significant variations among the participants based on gender (p = 0.032) and COVID-19 disease severity (p = 0.011).
Covid 04 00011 g001
Table 1. Demographic characteristics, blood group and COVID-19 status of participants.
VariableFrequencyPercentage (%)Total
GenderMale28855.9515
Female22744.1
Age (years)Median (IQR) = 37 (26–53)497 *
20 and below7314.7
21–309318.7
31–4011723.5
41–507515.1
51–60499.9
61–70438.7
71–80306.0
81 and above173.4
Recruiting HospitalUniversity Hospital387.4515
KATH19036.9
KSH234.5
MCHH71.4
SDA Hospital14227.6
SGH11522.3
ABO Blood GroupA11122.7490 *
B10621.6
AB132.7
O26053.1
Rhesus Blood GroupPositive43789.2490 *
Negative5310.8
SARS-CoV-2 StatusPositive25950.3515
Negative25649.7
COVID-19 SeverityAsymptomatic6826.3259
Mild11042.5
Moderate7729.7
Severe41.5
* Records were only available for those with complete data. Missing data were removed. COVID-19, coronavirus disease 2019; SARS-CoV, severe acute respiratory syndrome coronavirus 2; IQR, interquartile range.
Table 2. Comparison of demographic and selected laboratory data stratified by SARS-CoV-2 status of participants.
VariableSARS-CoV-2 NegativeSARS-CoV-2 Positivep-Value
FrequencyPercentage (%)FrequencyPercentage (%)
Age (in years)N = 245 N = 252
Median (IQR)36 (24–50)39 (29–57)
20 and below5221.2218.30.002
21–304116.75220.6
31–405522.46224.6
41–503915.93614.3
51–60218.62811.1
61–70218.6228.7
71–80114.5197.5
81 and above52.0124.8
GenderN = 256 N = 259
Male14757.414154.40.496
Female10942.611845.6
ABO Blood GroupN = 239 N = 251
A5523.05622.30.403
B5623.45019.9
AB72.962.4
O12150.613955.4
Rh StatusN = 239 N = 251
Positive21489.522388.80.805
Negative2510.52811.2
COVID-19, coronavirus disease 2019; IQR, interquartile range; KATH, Komfo Anokye Teaching Hospital; KSH, Kumasi South Hospital; SDA, Seventh Day Adventist; MCHH, Maternal and Child Health Hospital; SGH, Suntreso Government Hospital; Rh, Rhesus. p-values were determined using either Chi-square or Fisher’s exact test where appropriate.
Table 3. Haematological parameters and ACE2 levels stratified by SARS-CoV-2 status of participants.
VariableTotalSARS-CoV-2 PositiveSARS-CoV-2 Negativep-Value
NMedian (IQR)NMedian (IQR)NMedian (IQR)
Red Cell Count and Red Cell Indices
RBC (×106/μL)5154.54 (4.04–5.09)2594.59 (4.00–5.10)2564.50 (4.07–5.07)0.929
HGB (g/dL)51512.60 (11.05–14.10)25912.60 (11.10–13.90)25612.60 (10.83–14.20)0.630
HCT (%)51538.80 (32.80–43.55)25938.30 (32.70–42.40)25639.35 (32.75–45.38)0.023
MCV (fL)51584.50 (78.90–90.00)25983.40 (78.90–89.00)25686.50 (78.95–91.90)<0.001
MCH (pg)51527.80 (26.10–29.40)25927.80 (26.10–29.10)25627.80 (26.10–29.60)0.457
MCHC (g/dL)51532.80 (31.00–34.40)25933.10 (31.80–34.40)25632.10 (30.30–34.30)<0.001
Platelet Count and Platelet Indices
PLT (×103/μL)515213.00
(156.50–291.00)
259230.00
(159.00–305.00)
256208.00
(153.25–270.25)
0.046
MPV (fL)46211.20 (10.40–12.00)23111.00 (10.30–11.60)23111.60 (10.60–12.30)<0.001
PCT (%)4620.25 (0.19–0.32)2310.26 (0.20–0.33)2310.24 (0.19–0.31)0.128
WBC Count and DIFF
WBC (×103/μL)5155.94 (4.13–9.31)2596.36 (4.44–10.09)2565.655 (3.78–8.38)0.006
NEUT (×103/μL)5153.09 (1.71–6.31)2593.54 (1.87–7.43)2562.93 (1.25–5.71)0.002
LYMPH (×103/μL)5151.80 (1.31–2.37)2591.80 (1.25–2.37)2561.81 (1.36–2.38)0.488
MONO (×103/μL)5150.48 (0.35–0.72)2590.51 (0.36–0.72)2560.45 (0.33–0.73)0.210
EO (×103/μL)5150.05 (0.02–0.13)2590.05 (0.01–0.12)2560.06 (0.02–0.14)0.208
BASO (×103/μL)5150.04 (0.02–0.06)2590.03 (0.02–0.05)2560.05 (0.03–0.09)<0.001
ELISA Test
Plasma ACE2 (ng/mL)16843.65 (36.79–54.57)11245.37 (37.68–55.88)5641.55 (34.97–51.63)0.079
N, frequency; IQR, interquartile range; RBC, red blood cell; HGB, haemoglobin; HCT, haematocrit; MCH, mean cell haemoglobin; MCV, mean cell volume; MCHC, mean cell haemoglobin concentration; PLT, platelet; MPV, mean platelet volume; PCT, thrombocrit; WBC, white blood cell; DIFF, differential; NEUT, neutrophils; LYMPH, lymphocytes; MONO, monocytes; EO, eosinophils; BASO, basophils; ELISA, enzyme-linked immunosorbent assay; ACE2, angiotensin-converting enzyme 2.
Table 4. Age and haematological parameters stratified by COVID-19 disease severity of participants.
VariableAsymptomaticMildModerateSeverep-Value
NMedian (IQR)NMedian (IQR)NMedian (IQR)NMedian (IQR)
Demographics
Age (years)6135.00
(28.50–42.50)
11035.50
(26.00–50.25)
7755.00
(38.50–69.50)
470.00
(35.25–80.00)
<0.001
Red Cell Count and Red Cell Indices
RBC
(×106/μL)
684.82
(4.25–5.23)
1104.60
(3.97–5.03)
774.31
(3.58–5.08)
43.75
(2.64–4.79)
0.014
HGB (g/dL)6813.10
(11.93–14.48)
11012.65
(11.05–13.90)
7712.20
(9.65–13.60)
49.55
(7.85–11.93)
0.003
HCT (%)6839.25
(36.20–43.73)
11038.85
(32.45–43.13)
7735.80
(29.80–40.45)
428.55
(24.28–37.93)
0.001
MCV (fL)6883.70
(80.03–87.13)
11083.85
(80.60–90.23)
7781.90
(76.90–88.50)
480.70
(74.70–93.08)
0.149
MCH (pg)6827.95
(26.50–29.10)
11027.80
(26.18–29.33)
7727.70
(25.55–29.10)
427.25
(23.40–29.90)
0.933
MCHC (g/dL)6833.30
(32.45–34.20)
11032.60
(31.38–34.33)
7733.70
(31.95–35.10)
431.25
(31.10–34.93)
0.082
Platelet Count and Platelet Indices
PLT
(×103/μL)
68260.00
(197.25–307.50)
110227.00
(157.50–304.25)
77190.00
(134.50–296.00)
4207.00
(183.50–355.75)
0.023
MPV (fL)6310.70
(10.20–11.40)
9711.10
(10.30–11.80)
6711.00
(10.40–11.80)
410.00
(9.23–11.15)
0.118
PCT (%)630.29
(0.23–0.34)
970.26
(0.20–0.33)
670.23
(0.16–0.31)
40.21
(0.20–0.35)
0.042
WBC Count and DIFF
WBC
(×103/μL)
685.23
(4.15–6.53)
1106.06
(4.06–8.68)
778.49
(6.15–12.64)
415.87
(6.68–19.80)
<0.001
NEUT
(×103/μL)
682.33
(1.70–3.39)
1102.91
(1.34–6.10)
776.06
(3.63–10.61)
414.69
(5.70–18.96)
<0.001
LYMPH
(×103/μL)
682.17
(1.70–2.56)
1101.83
(1.23–2.26)
771.41
(1.08–2.17)
40.47
(0.22–0.66)
<0.001
MONO
(×103/μL)
680.455
(0.35–0.62)
1100.52
(0.36–0.69)
770.55
(0.39–0.84)
40.35
(0.29–0.94)
0.161
EO
(×103/μL)
680.08
(0.03–0.15)
1100.05
(0.02–0.12)
770.03
(0.00–0.10)
40.00
(0.00–0.03)
0.001
BASO
(×103/μL)
680.03
(0.02–0.05)
1100.03
(0.02–0.04)
770.02
(0.01–0.05)
40.015
(0.00–0.05)
0.343
ELISA Test
Plasma ACE2 (ng/mL)2950.61
(43.90–58.61)
3944.19
(36.75–55.88)
4040.68
(34.09–48.10)
452.34
(33.59–61.79)
0.024
N, frequency; IQR, interquartile range; RBC, red blood cell; HGB, haemoglobin; HCT, haematocrit; MCH, mean cell haemoglobin; MCV, mean cell volume; MCHC, mean cell haemoglobin concentration; PLT, platelet; MPV, mean platelet volume; PCT, thrombocrit; WBC, white blood cell; DIFF, differential; NEUT, neutrophil; LYMPH, lymphocytes; MONO, monocytes; EO, eosinophil; BASO, basophil; ACE2, angiotensin-converting enzyme 2.
Disclaimer/Publisher’s Note: The statements, opinions and data contained in all publications are solely those of the individual author(s) and contributor(s) and not of MDPI and/or the editor(s). MDPI and/or the editor(s) disclaim responsibility for any injury to people or property resulting from any ideas, methods, instructions or products referred to in the content.

