Article

Development and Validation of a Methodology to Measure Exhaled Carbon Dioxide (CO2) and Control Indoor Air Renewal

by
Marta Baselga
1,
Juan J. Alba
1,2 and
Alberto J. Schuhmacher
1,3,*
1
Institute for Health Research Aragón (IIS Aragón), 50009 Zaragoza, Spain
2
Department of Mechanical Engineering, University of Zaragoza, 50018 Zaragoza, Spain
3
Aragonese Foundation for Research & Development (ARAID), 50018 Zaragoza, Spain
*
Author to whom correspondence should be addressed.
COVID 2023, 3(12), 1797-1817; https://doi.org/10.3390/covid3120124
Submission received: 10 November 2023 / Revised: 14 December 2023 / Accepted: 15 December 2023 / Published: 18 December 2023
(This article belongs to the Special Issue Airborne Transmission of Diseases in Outdoors and Indoors)

Abstract

:
The measurement of carbon dioxide (CO2) has emerged as a cost-effective and straightforward technique for indirectly managing indoor air quality, aiding in the reduction of the potentially pathogen-laden aerosol concentrations to which we are exposed. Unfortunately, inadequate practices often limit the interpretation of CO2 levels and neglect methodologies that ensure proper air renewal. This study presents a novel methodology for measuring and controlling indoor CO2 levels in shared spaces, comprising four stages: analysis, diagnosis, correction protocols, and monitoring/control/surveillance (MCS). This methodology underwent validation in practical settings, including a cultural center (representing spaces with uniform activities) and 40 commercial spaces (with diverse activities) in Zaragoza, Spain. The results indicate the feasibility of swiftly implementing measures to enhance shared air renewal, with the immediate opening of doors and windows being the most direct solution. The proposed methodology is practical and has the potential to mitigate the risk of the aerosol transmission of respiratory diseases. Consequently, we anticipate that this work will contribute to establishing methodological foundations for CO2 measurement as a valuable, standardized, and reliable tool.

1. Introduction

Since the global recognition of COVID-19 transmission via aerosols [1], various strategies have emerged to mitigate air quality deterioration. These strategies can be categorized into air renewal and air purification techniques. Air renewal focuses on optimizing air exchange in enclosed spaces, while air purification employs physical or chemical methods to combat airborne pathogens. Despite sharing the goal of reducing respiratory disease spread, air purification, particularly against bioaerosols, lacks robust testing [2,3,4]. Affordable and high-performance options like high-efficiency portable air cleaners, such as HEPA filters, have shown promise by filtering up to 99.9% of submicron particles and reducing SARS-CoV-2 aerial viral load by 80% [5,6]. However, achieving optimal performance requires careful consideration of equipment workflow and placement in actual conditions.
Ideally, measuring aerosols would enable the assessment of air quality and the estimation of contagion risk. However, direct aerosol measurement is inherently complex and costly, necessitating specialized equipment. To address these challenges, carbon dioxide (CO2) measurement has been proposed as an indirect indicator of the risk of transmission of respiratory infectious diseases [7]. The measurement of metabolic CO2 (CO2 produced by human respiratory activity) was proposed prior to the COVID-19 pandemic to control the airborne spread of diseases, as it signifies a higher likelihood of breathing air previously exhaled by others [8]. Consequently, in the absence of other CO2 sources, measuring indoor metabolic CO2 is suggested as a reasonable ventilation proxy. The percentage of air exhaled by an individual (y) can be determined using the expression y = C e   x + C a 1 x , where C e represents the concentration of CO2 in exhaled air (estimated at 40,000 ppm), C a is the ambient CO2 concentration, and x is the fraction of exhaled air. For example, assuming a baseline value of 440 ppm for fresh outdoor air, which increases indoors to 2000 ppm, the approximate percentage of air that individuals have already breathed will be 3.9%.
One of the significant limitations of CO2 level measurement is that it cannot be directly correlated with the concentration of aerosols in the environment, as the generation of bioaerosols depends on the type of respiratory activity [9]. For instance, aerosols produced during sustained vocalization (e.g., singing) are not comparable to those generated during silent breathing [10,11,12,13]. Nonetheless, CO2 concentration thresholds have been proposed to reduce COVID-19 airborne transmission (without considering other contagion routes), typically ranging between 700 and 1000 ppm, irrespective of the activity. This is equivalent to an increase (metabolic CO2) of 300 to 600 ppm compared to fresh air [14,15].
SARS-CoV-2 is highly efficient in airborne transmission, covering long distances and durations. An average of 3.1 ± 2.9 copies/L of viral RNA in the air is inferred from a total of 313 samples [16,17,18,19,20,21,22,23,24,25,26,27,28,29,30]. Close-contact transmission is established as predominant, with fomites and aerosols explaining specific propagation events, as per CDC guidelines [31,32]. Superspreading events, linked to massive infections, present a challenge for complex epidemiological management, and to date, they have been exclusively reported indoors [17,33,34,35,36,37,38,39,40,41,42,43,44,45,46,47,48,49,50,51]. The distinction between superspreaders and non-spreaders remains challenging due to the unknown propagation capacity of individuals [17,52]. Therefore, it is imperative to enhance air quality in public and shared spaces. Implementing appropriate measures can potentially reduce respiratory disease cases in the community and mitigate the risk of future pandemics with devastating effects.
Many countries have adopted CO2 measurement as a standard practice in various settings, including collective transport [53,54,55,56], or university and school classrooms [57,58,59,60,61,62]. In the U.K., the government distributed over 300,000 CO2 meters in schools to enhance air renewal during classes [63]. Similarly, in Germany, a comprehensive approach was undertaken, with an investment exceeding EUR 17 million to ensure the availability of meters in schools [64]. Recent reports indicate a substantial investment of $350 billion for state and local governments and $122 billion for schools, specifically directed towards supporting upgrades in ventilation and air filtration [65].
This article introduces a methodology for the effective measurement and control of indoor CO2 levels in shared spaces. The approach enables the interpretation of air renewal patterns, providing an estimation of whether the renewal is suitable for the specific activity and type of space. Furthermore, the method has undergone validation as a pilot project in a three-story building with multiple teaching rooms and cultural activities, along with a subset of 40 local businesses in Zaragoza, Spain.

2. Materials and Methods

2.1. Measurement of Metabolic CO2

Aranet 4 Home (Aranet Wireless Solutions, Mallorca, Spain) and Signos (Signos.io, Barcelona, Spain) CO2 meters were utilized for measuring CO2 levels, temperature and humidity. The technical specifications of these measuring devices are detailed in Table 1.

2.2. General Description of the Methodology

A methodology based on four standard stages with specific goals has been developed, outlined as follows:

2.2.1. Analysis Phase

The initial step involves establishing an acceptable CO2 threshold based on the characteristics of a given space and the indoor activity performed (see Figure 1). Estimating this value requires knowledge of various factors, including the number of occupants, building characteristics (volume, doors, windows), room conditions (temperature, relative humidity, and CO2 levels or ACH), and the nature of the activity (number of occupants, type of activity, mask usage, and exposure time). With these variables, it becomes possible to estimate the personalized relative risk of infection parameter (Hr) using the Wells–Riley model, adapted in web app format (COVID RiskAirborne) to facilitate its calculation [66]. By using this tool (or following the calculation proposed by Wells–Riley [67] and adapted by Peng and Jiménez [7] and Buonano et al. [68]), it is feasible to determine CO2 threshold levels (or air changes per hour, ACH) to reduce the probability of aerosol transmission to an acceptable limit [8]. It is important to note that this mathematical approximation simplifies the real problem, and as such, it should be considered an estimate and interpreted within the context of the specific scenario.
The Hr parameter represents the overall risk of airborne transmission to be analyzed in terms of size of outbreak. Hr, measured in h2·m−3, is defined by Equation (1). Where r s s is a multiplicative factor applicable if under no presence of infectious quanta at the beginning of the event (especially in short events to reach steady state), r E is the relative increase of the emission with activity, r B is the relative breathing rate enhancement factor, f e is the penetration efficiency of particles through masks for exhalation, f i is the penetration efficiency of particles through masks for inhalation, D is the exposure time, V is the volume of the space, and λ is the rate of removal of quanta [69].
H r = r s s · r E · r B · f e · f i · D λ · V
According to Peng et al. [69], in terms of attack rate, the relative risk considering the wild-type variant could be established as follows: Hr < 0.001 h2·pax/m3 (low risk), Hr < 0.01 h2·pax/m3 (medium risk), and Hr > 0.01 h2·pax/m3 (high risk). Nevertheless, considering the SARS-CoV-2 Alpha (B.1.1.7) variant, an adjustment is suggested to Hr < 0.0007 h2·pax/m3 (low risk), Hr < 0.0064 h2·pax/m3 (medium risk), and Hr ≥ 0.0064 h2·pax/m3 (high risk). At this point, a target should be selected to achieve a space with a higher or lower risk of contagion, depending on the current epidemiological situation. For instance, if the goal is to set a space with a moderate risk of airborne transmission, the limit of Hr < 0.0064 h2·pax/m3 will be selected for the Alpha variant.
Another parameter of interest is the risk of infection parameter (H), which is an indicator of the absolute probability of infection based on the amount of potentially infectious aerosols inhaled. H determination can be carried out following Equation (2), where L is equivalent to the ventilation plus air cleaning rate per person present in the space (L·s−1·occup−1). Peng et al. [69] established acceptable thresholds for H < 0.05 (low airborne risk), H < 0.5 (medium risk), and H ≥ 0.5 (high risk). Nevertheless, for the Alpha (B.1.1.7) variant, this parameter is readjusted to H < 0.035 (low airborne risk), H < 0.32 (medium risk), and H ≥ 0.32 (high risk).
H = r s s · r E · r B · f e · f i · D L
Finally, the AR attack rate parameter represents the probability of infection per individual in percentage, and is defined as follows (Equation (3)) [69]. Where, C is the number of infection cases, S is the number of exposed susceptible individuals, and n is the infectious dose inhaled by a susceptible individual during the exposure time. Ideally, the determination of the CO2 threshold to minimize the risk of contagion by SARS-CoV-2 will be adjusted to achieve an AR lower than 0.01%, as proposed by Peng and Jiménez [7].
A R = C S = ( 1 e n )
If, on the other hand, a homogeneous activity is not conducted in the indoor space, and the climate/building/event parameters are unknown, two alternative options are available. On one hand, if the parameters can be estimated, it is possible to establish an adjusted CO2 threshold to achieve a minimum Hr in the most unfavorable scenario. Conversely, if the activity is heterogeneous and it is not possible to estimate the parameters, the alternative is to set a CO2 level that ensures reasonable ventilation. This CO2 level must be tailored to the type and intensity of the activity taking place. For instance, the aerosol emission from an individual in a gym (intense activity) is not comparable to that of an individual in a library (sedentary with calm breathing). Therefore, a stricter CO2 limit should be established as the intensity of the activity increases.
First case: Cultural building. Scheduled and regular activities (homogeneous) take place in this space, ensuring that the variables related to climate/building/event are known. Consequently, desirable CO2 thresholds were established to achieve an Hr < 0.0064 h2·pax/m3, taking into account the pandemic status. In the event of a high cumulative incidence and poor immunity, it would be preferable to set Hr < 0.0007 h2·pax/m3. In this case, as an illustration, the CO2 threshold was calculated considering both scenarios.
Considering one infected person in the classroom (this could be adjusted if the number of infected is known). Note that this simulation may be more unfavorable than using the cumulative incidence. In the example, given that teaching activity is carried out in all cases, four different scenarios were considered, as proposed by Rodríguez et al. [70]:
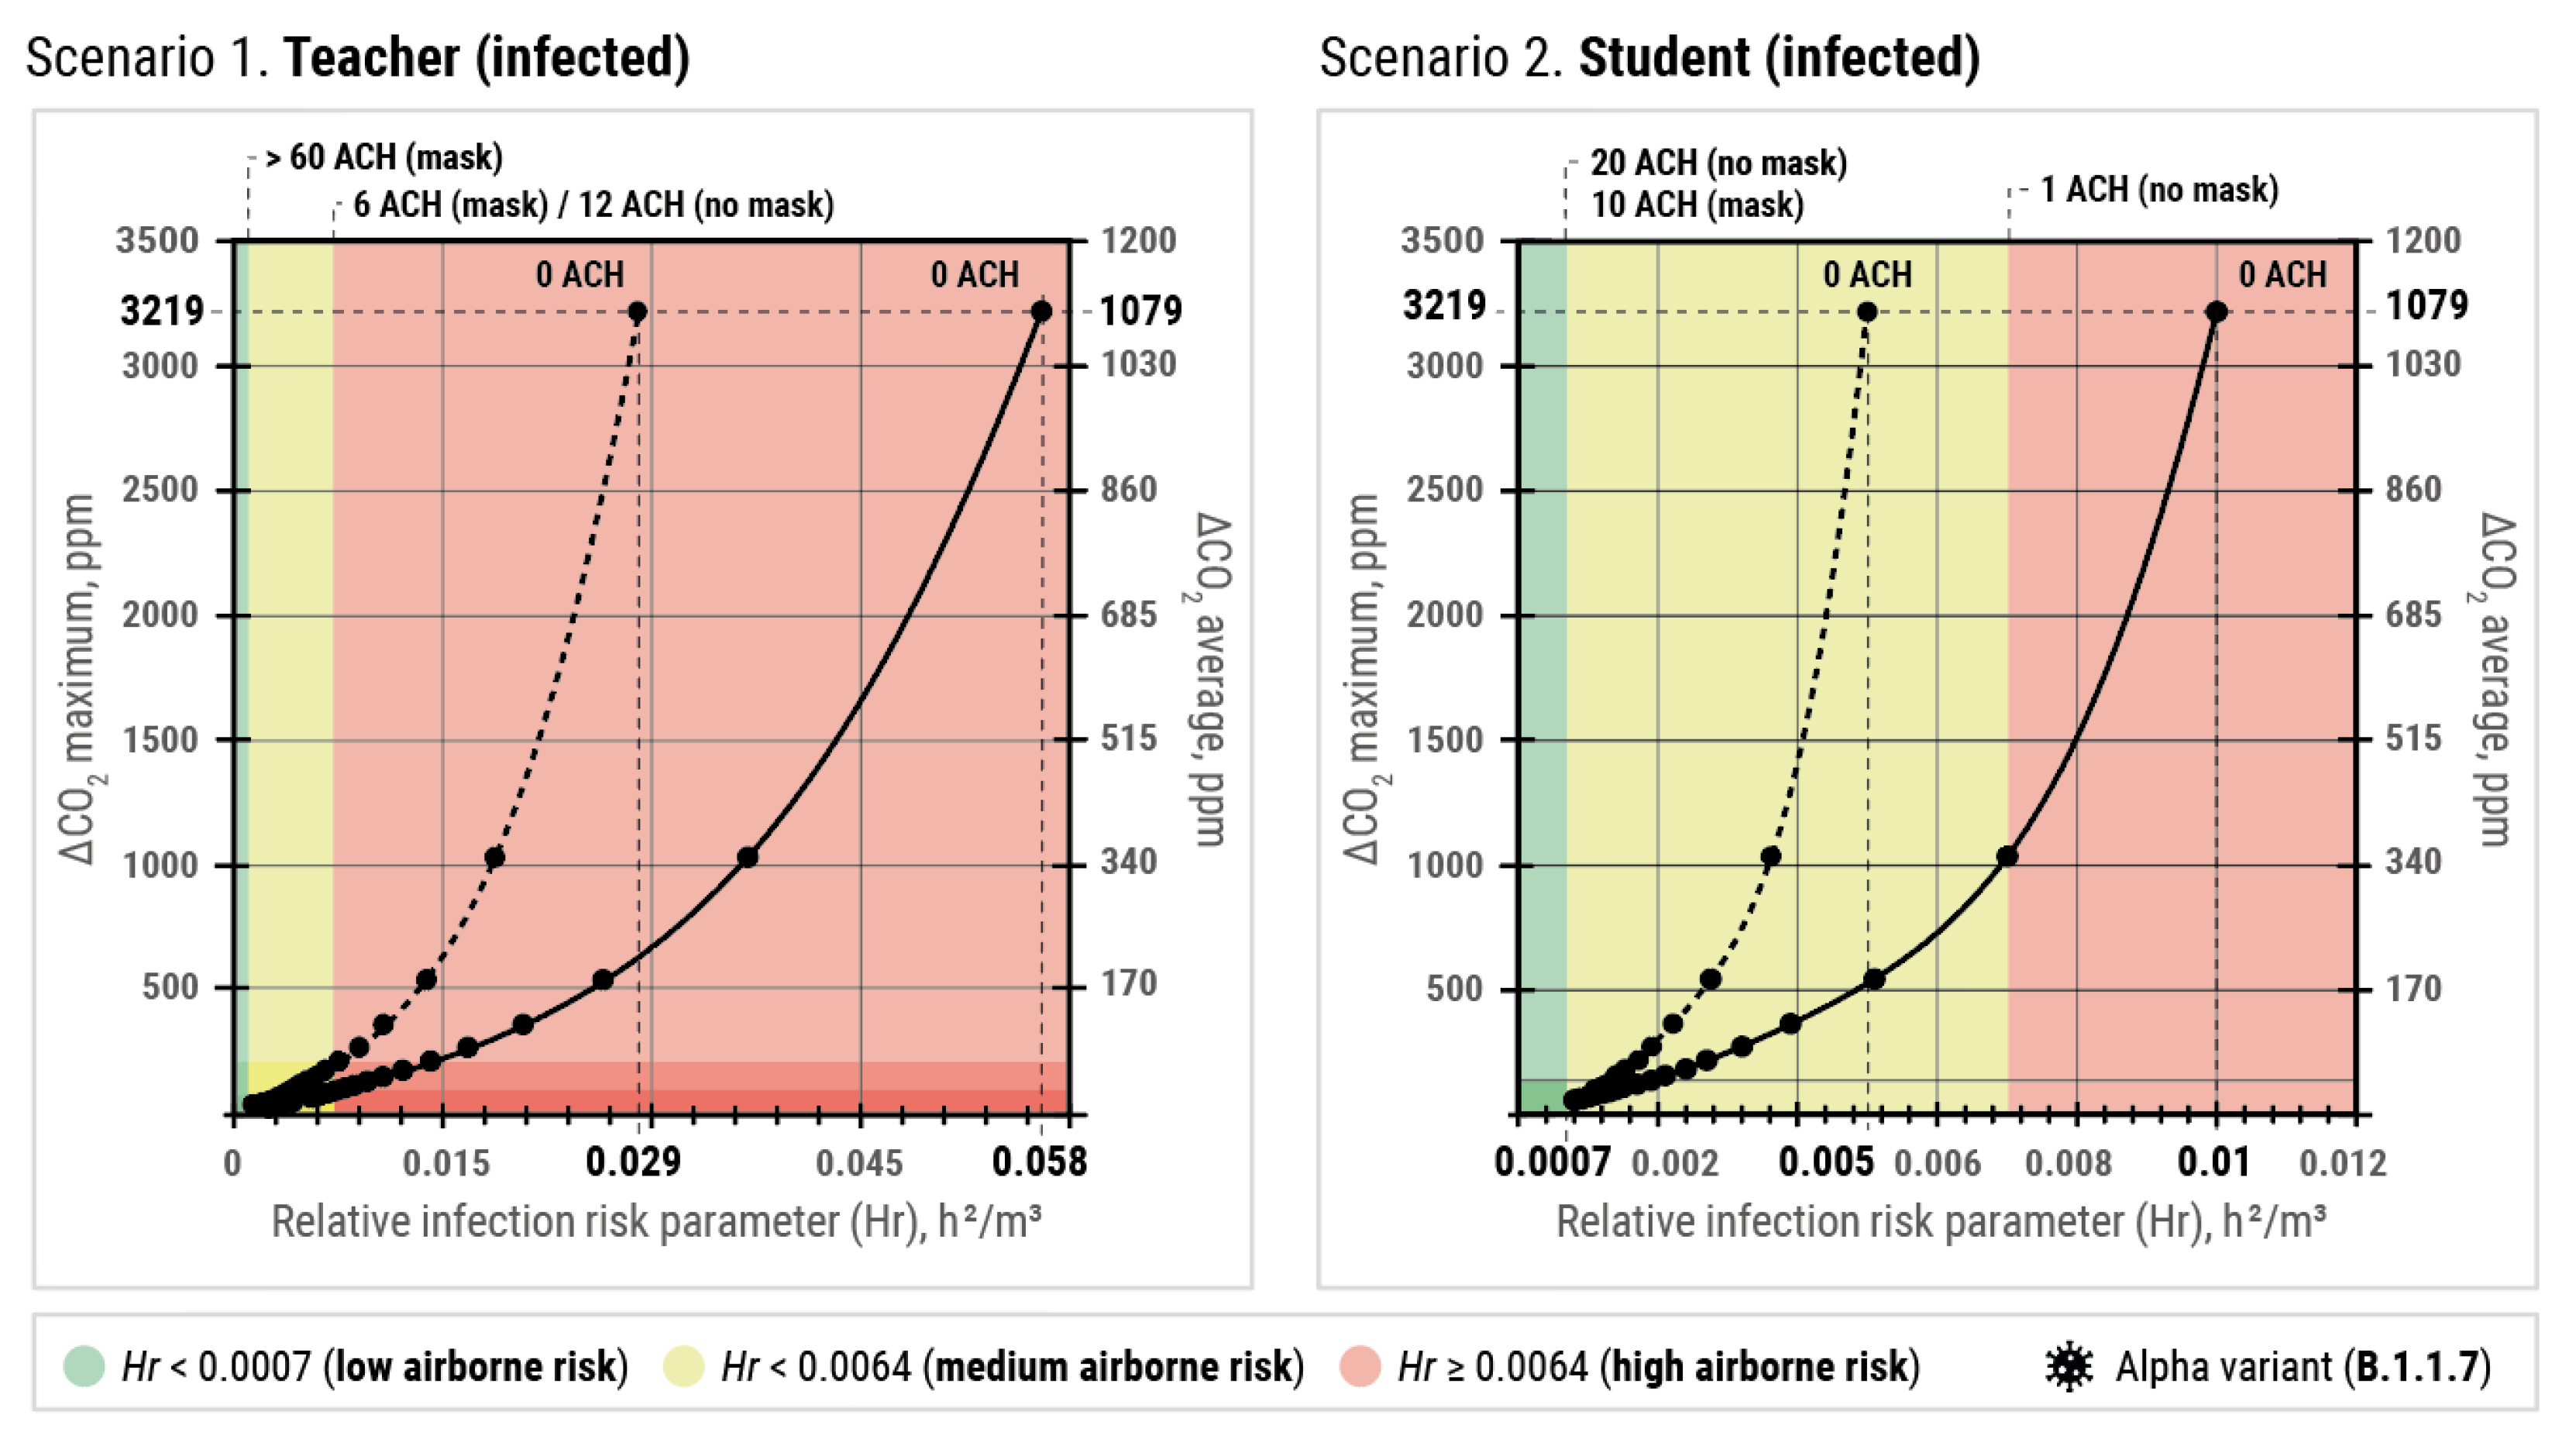
  • Scenario 1a. The infected person is the teacher (40 years old) and everyone wears a surgical mask.
  • Scenario 1b. The infected person is the teacher (40 years old) and no one wears a mask.
  • Scenario 2a. The infected person is a student (18 years old) and everyone wears a surgical mask.
  • Scenario 2b. The infected person is a student (18 years old) and no one wears a mask.
  • To carry out the statistical estimation, Alpha (B.1.1.7) has been considered the predominant variant. In scenario 1, it has been assumed that the teacher performs a sedentary activity, speaking and emitting aerosols in the 75% percentile of viral exhalation rate from the mean value of 2.0 q·h−1 (~259 quanta/h). In scenario 2, the student performs a sedentary activity, with oral breathing and emitting aerosols in the 75% percentile of viral exhalation rate from the mean value of 2.0 q·h−1 (~49 quanta/h). In both scenarios, the efficiency of surgical masks against aerosol retention has been close to 32.5% (in the exhalation of the infected individual) and 25% (in the inhalation of susceptible individuals).
Considering the cumulative incidence of the moment it is important to note that the calculation of the parameters was conducted using retrospective information from the study period: predominance of the Alpha variant (B.1.1.7), assuming a cumulative incidence in Aragón (Spain) of 434 per 100,000 cases, and an immunity of 80% (with an individual acquired immunity of 40%).
Second case: Commercial retail. In the second case, 40 commercial spaces with various activities were included, as described in Section 2.4. The activity and the number of people varied depending on the day and time in each commercial space, rendering the establishment of personalized CO2 thresholds impractical.

2.2.2. Diagnosis

The aim is to gain detailed knowledge of how CO2 concentration levels evolve during events and how they adapt to the threshold established in the previous phase. The initial diagnosis encompasses a description of the space, indicating the measures of the shared space (e.g., size, volume, and architectural geometry), other CO2 sources (e.g., gas stove, combustion processes), the presence and location of windows and doors, as well as the availability of heating, ventilation, and air conditioning (HVAC) systems and hoods. Analyzing the regular operation of the HVAC system is crucial in designing ventilation patterns, as this can be an effective ventilation strategy. Conversely, if the HVAC system cannot be modulated, it will be necessary to invest more significant efforts in other ventilation strategies. During this process, it is also advisable to identify the “person in charge” and provide minimal instruction about the project and concepts such as air renewal, ventilation, metabolic CO2, and how to measure it.
First case: Cultural building. Selected spaces were analyzed for four days (24–27 February 2021) by placing 10 CO2 meters (Aranet 4) in strategic locations, as shown in Figure 2a. A CO2 meter was placed outdoors so that it was possible to calculate the increase in CO2 ( C O 2 ) associated with human activity according to Equation (4); where (CO2)ext corresponds to CO2 outside and (CO2)ind to CO2 indoors.
C O 2 = C O 2 i n d C O 2 o u t
In the initial approach, the data revealed frequent high CO2 concentration levels, likely associated with specific activities. Subsequently, the shared spaces underwent careful monitoring for an additional six days (from 27 February to 5 March 2021) to validate the hypotheses generated during the initial analysis. This process allows for the characterization of air renewal patterns in each space based on activity and capacity. For measurement consistency, at least one CO2 meter was positioned every 20 m² at a minimum height of 1.5 m and a maximum height of 2.5 m, ensuring they were more than 2 m away from occupants to avoid direct exhalation. Ideally, meters were placed near exhaust fans (to measure a representative air sample) and/or in locations with poor air turnover (e.g., corners), far from windows and doors.
Second case: Commercial retail. One, two, or three CO2 meters (Aranet 4) were strategically placed at specific points (following the criteria established in the first case section) for 2 or 3 days in each business (October–November 2021). These meters were selected for their ability to record the CO2 level every minute. The CO2 curves were analyzed during the business hours of each establishment. This phase enabled us to determine if the sensors captured representative measurements of the entire space and provided a comprehensive overview of air quality within the volume area.

2.2.3. Correction

Based on the knowledge acquired in the diagnosis stage, customized protocols and procedures were designed to enhance air renovation, leading to variations in CO2 concentration. Continuous monitoring of CO2 levels with a meter was implemented to prevent surpassing a defined threshold for an acceptable risk of an airborne outbreak, as proposed in the Analysis phase.
First case: Cultural building. In one of the classrooms in the basement (Classroom 1) exhibiting inefficient ventilation patterns, dry ice was utilized to saturate the room with CO2, enabling the identification of effective strategies to enhance air renewal. As shown in Figure 2b, 10 CO2 meters (Aranet 4) were placed in the classroom to analyze the impact of changes in HVAC and natural ventilation (through doors and windows opening or closing).
Second case: Commercial retail. A correction phase was implemented in spaces where necessary, and preventive measures were introduced to improve indoor air renewal. In most instances, this phase coincided with monitoring to assess the advantages gained. In our case, a measurement >30 min was defined by the meter’s sampling rate (11 min) (see Section 3). If three consecutive measurements exceeded 800 ppm, it was considered potentially risky during the pandemic. Additionally, as our methodology includes notices or alerts to commercial spaces, real-time knowledge of the establishment’s ventilation was essential. Another effective strategy could involve defining the risk based on the percentage of time that the established threshold is exceeded, providing a comprehensive assessment over a specific period.

2.2.4. Monitoring, Control, and Surveillance (MCS)

Continuous monitoring of CO2 concentration was conducted to ensure that the shared space consistently maintains low-risk levels. If CO2 concentrations reach the maximum level, an alert is triggered, prompting the individuals responsible for the shared space to activate the protocols and procedures defined in the previous stage to address the situation.
First case: Cultural building. This monitoring stage was executed until 15 May 2022 using 10 CO2 meters (Signos). Whenever the cultural center surpasses the established CO2 levels, it receives a telematic alert or phone call, prompting the “person in charge” to rectify the situation.
Second case: Commercial retail. The monitoring stage took place during January and February 2022. For this stage, CO2 meters (Signos) were installed in each establishment. These CO2 meters incorporate IoT technology, enabling remote access to streaming data.

2.3. Description of First Case Space (Cultural Building)

As a case study, the methodology for improving air quality was implemented in a cultural center. The building spans 1200 m2 and is divided into three floors (Figure 2a). A 132 m2 room situated in the basement (Classroom 1) was chosen as the study case. To analyze ventilation patterns and the effectiveness of corrective measures, we deployed the 10 m in Classroom 1, as depicted in Figure 2b.

2.4. Description of Second Case Spaces (Commercial Spaces)

Subsequently, the method was applied to 40 commercial spaces located in the city center of Zaragoza (Spain). These spaces included: one optician, twelve clothing stores, two childrens’ clothing stores, five shoe stores, two jewelry stores, four food stores, two restaurants, five home stores, two consultancies, two dietary and health centers, and two florists. The selection of commercial spaces was made to cover different typologies. For example, customers spend long periods in restaurants, while their exposure to indoor air in flower retailers is minimal. CO2 meters (one, two or three) were placed in each establishment, totaling 85 CO2 meters.

3. Results

3.1. First Case: Cultural Building

3.1.1. Analysis: Determining Personalized CO2 Thresholds

The CO2 threshold considering the presence of an individual infected with the Alpha variant (B.1.1.7) in the classroom, has been calculated for various classroom scenarios. In cases where the use of masks is unknown, it is advisable to employ the most unfavorable values. The values in scenarios with an infected student are less restrictive due to the reduced generation of aerosols from respiratory activity. However, incorporating this information can be beneficial to obtain a comprehensive understanding of the scenario.
Considering an Hr < 0.0064 h2·pax/m3 for an acceptable risk in terms of outbreak size, the CO2 threshold is defined in Table 2. Specifically, the CO2 threshold is observed to decrease as time increases to align with the concentration of bioaerosols at the end of the event. Conversely, as the number of occupants increases, the CO2 threshold rises. This is because a single infectious individual has been assumed and, therefore, the metabolic CO2 of the other occupants is not potentially dangerous for the same attack rate.
In the scenario without masks, the CO2 threshold is lower to account for the retention of aerosols during inhalation/exhalation of individuals. For instance, in a scenario where the teacher is infected in Classroom 1 (with 15 occupants, 180 min), and no one is wearing a mask, the desirable metabolic CO2 threshold would be 52 ppm on average (452 ppm in absolute terms) and 80 ppm at maximum (480 ppm). This threshold increases to an average of 114 ppm on increment (514 ppm) and 181 ppm at maximum (581 ppm) if occupants wear masks.
Note that the CO2 range considering that one occupant is infected (Table 2a) and in a cumulative incidence scenario (Table 2b) is the same. In the Hr calculation (see Equation (1) for more information), the risk is estimated considering a person exhaling bio-charged aerosols and another person inhaling those aerosols. It remains independent of the potential number of infected people within the space. Therefore, for the same volume and exposure time, the ACH rate will be equivalent if Hr is taken as a fixed parameter, and the CO2 threshold will not vary because the quanta removal rate will be higher as ACH increases. Figure 3 represents the relative infection risk parameter Hr vs. the CO2 level (ACH), considering the four possible scenarios in Classroom 1.
Contrastingly, the attack rate is defined as the ratio between infected individuals and susceptible individuals (Equation (3)), so this index is reduced in the case of the calculation with the accumulated incidence. To determine individual risk, this value is more informative. Considering the cumulative incidence scenario, it is observed that all ARs are between <0.1 and 0.2%. An AR < 0.01% has been established to consider a low risk, although not under any circumstance [7,69]. However, this should be modulated depending on the vulnerability of the people in the event. The estimated AR in case reviews calculated by Peng et al., the lowest value for reported outbreaks was 6%. Therefore, to consider individual risk, in this case we will take 5% as the AR threshold.
Figure 4 shows the attack risk rate vs. the CO2 level (simulating the ventilation rate) for the studied case of Classroom 1. In the case of the infected Teacher, ACHs of 3 to 7 are required, in case of carrying or no mask, respectively. In a mask, the minimum ACH is 0, while with masks a minimum ACH of 2 is required. In terms of CO2 threshold, in the case of the infected student, with the professor infected, a maximum increase of 162 ppm on average and 103 ppm (without a mask) and a maximum of 418 ppm on average and 243 ppm (with a mask) would be established.

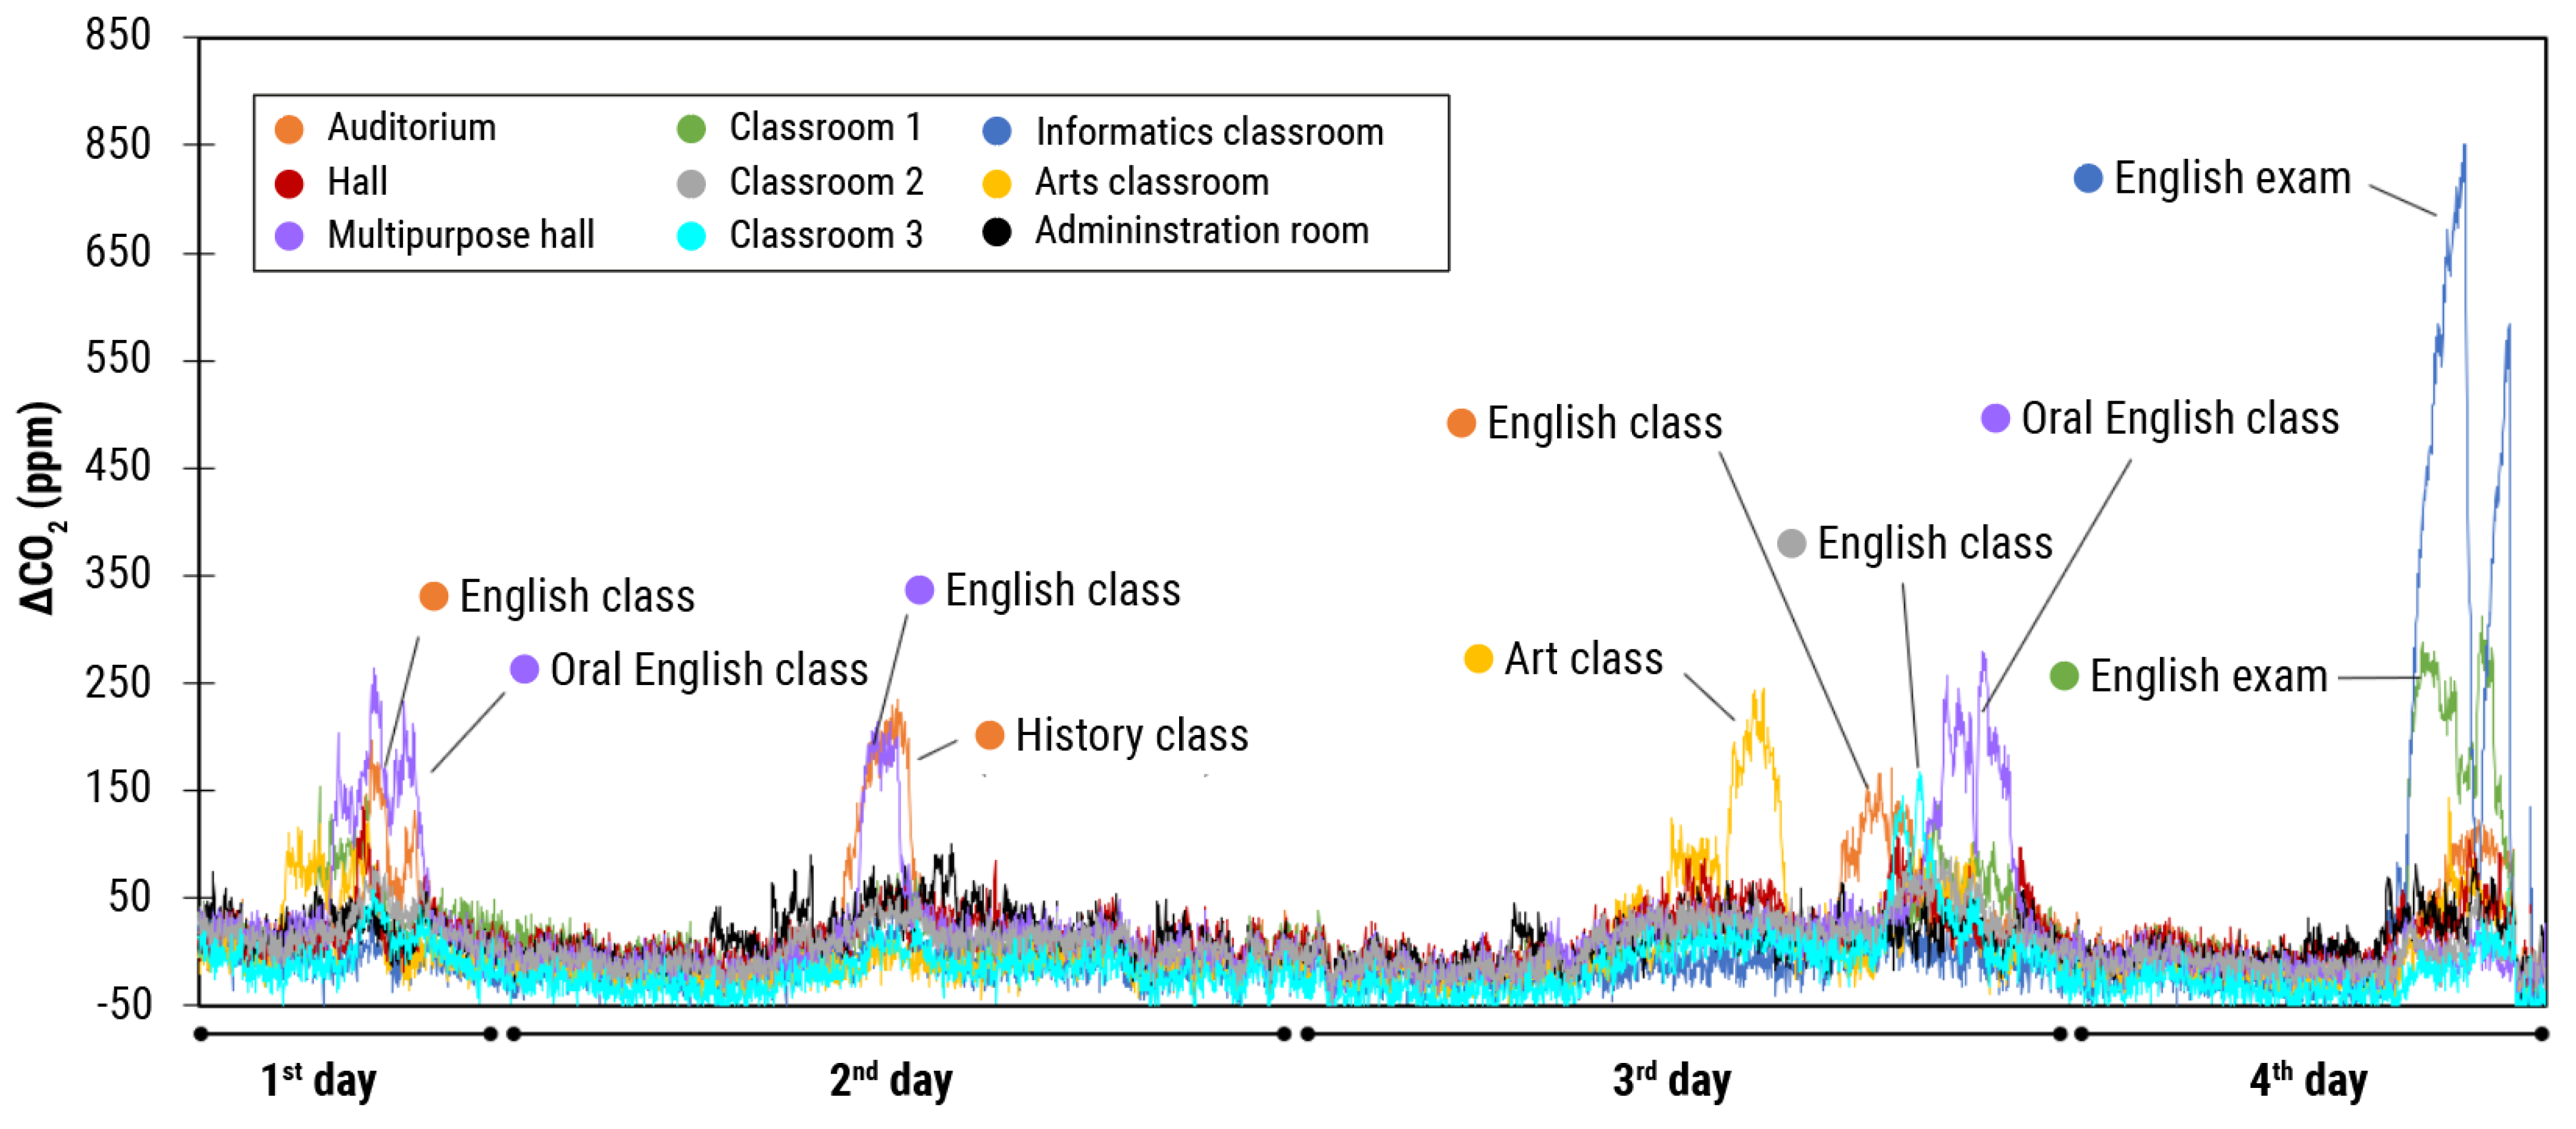
3.1.2. Diagnostic Phase of the Space

The diagnosis should be conducted over a sufficiently long time interval to capture the specific and regular occurrences of the establishment. For example, in the cultural center, the classrooms are typically occupied for daily classes. Therefore, selecting days when the classrooms are in use is adequate. In this case, four days were chosen for the space diagnosis. A general overview is depicted in Figure 5, showing peaks in the CO2 increment associated with the activity of each room.
Table 3 presents the data collected and calculated from Classroom 1, following the example of previous sections. In the first class (10 occupants, 90 min), maximum CO2 increases of 153 ppm (553 ppm absolute) were recorded. Since the individuals were wearing masks, for an Hr < 0.0064, the threshold should not exceed an increase of 393 ppm (793 ppm in absolute) and 181 ppm (581 ppm) on average. Therefore, during this class, the established CO2 thresholds were not exceeded, and the Hr could approach 0.0006–0.0036 h2·pax/m3 considering that the student/teacher are infected (with masks), respectively.
In the second case, an approximation has been used following the previously mentioned boundary conditions. If the teacher had been infected and everyone wore a mask, the CO2 increase threshold would be 99 ppm on average and 175 ppm at maximum (Hr = 0.0063 h2·pax/m3). During this class, average increases of 76 ± 22 ppm and maximums of 140 ppm were recorded, which reached an Hr of 0.0009–0.0049 h2·pax/m3.
In the third case, for an Hr of 0.0064 h2·pax/m3, the CO2 increase threshold would be 239 ppm (average) and 623 ppm (maximum). The recorded increment values were lower; 219 ppm (at average level) and 312 ppm (as maximum level). Hr parameters ranged from 0.0014 to 0.0073 h2·pax/m3, exceeding the Hr value for considering a low risk of size outbreaks.
Note that certain gaps may go unnoticed during the diagnostic phase. Due to atmospheric conditions or activity during the diagnosis, the CO2 levels may decrease. Although we recommend analyzing 3–4 critical days, subsequent days (e.g., 5–6 days) should be closely monitored to ensure representative results.

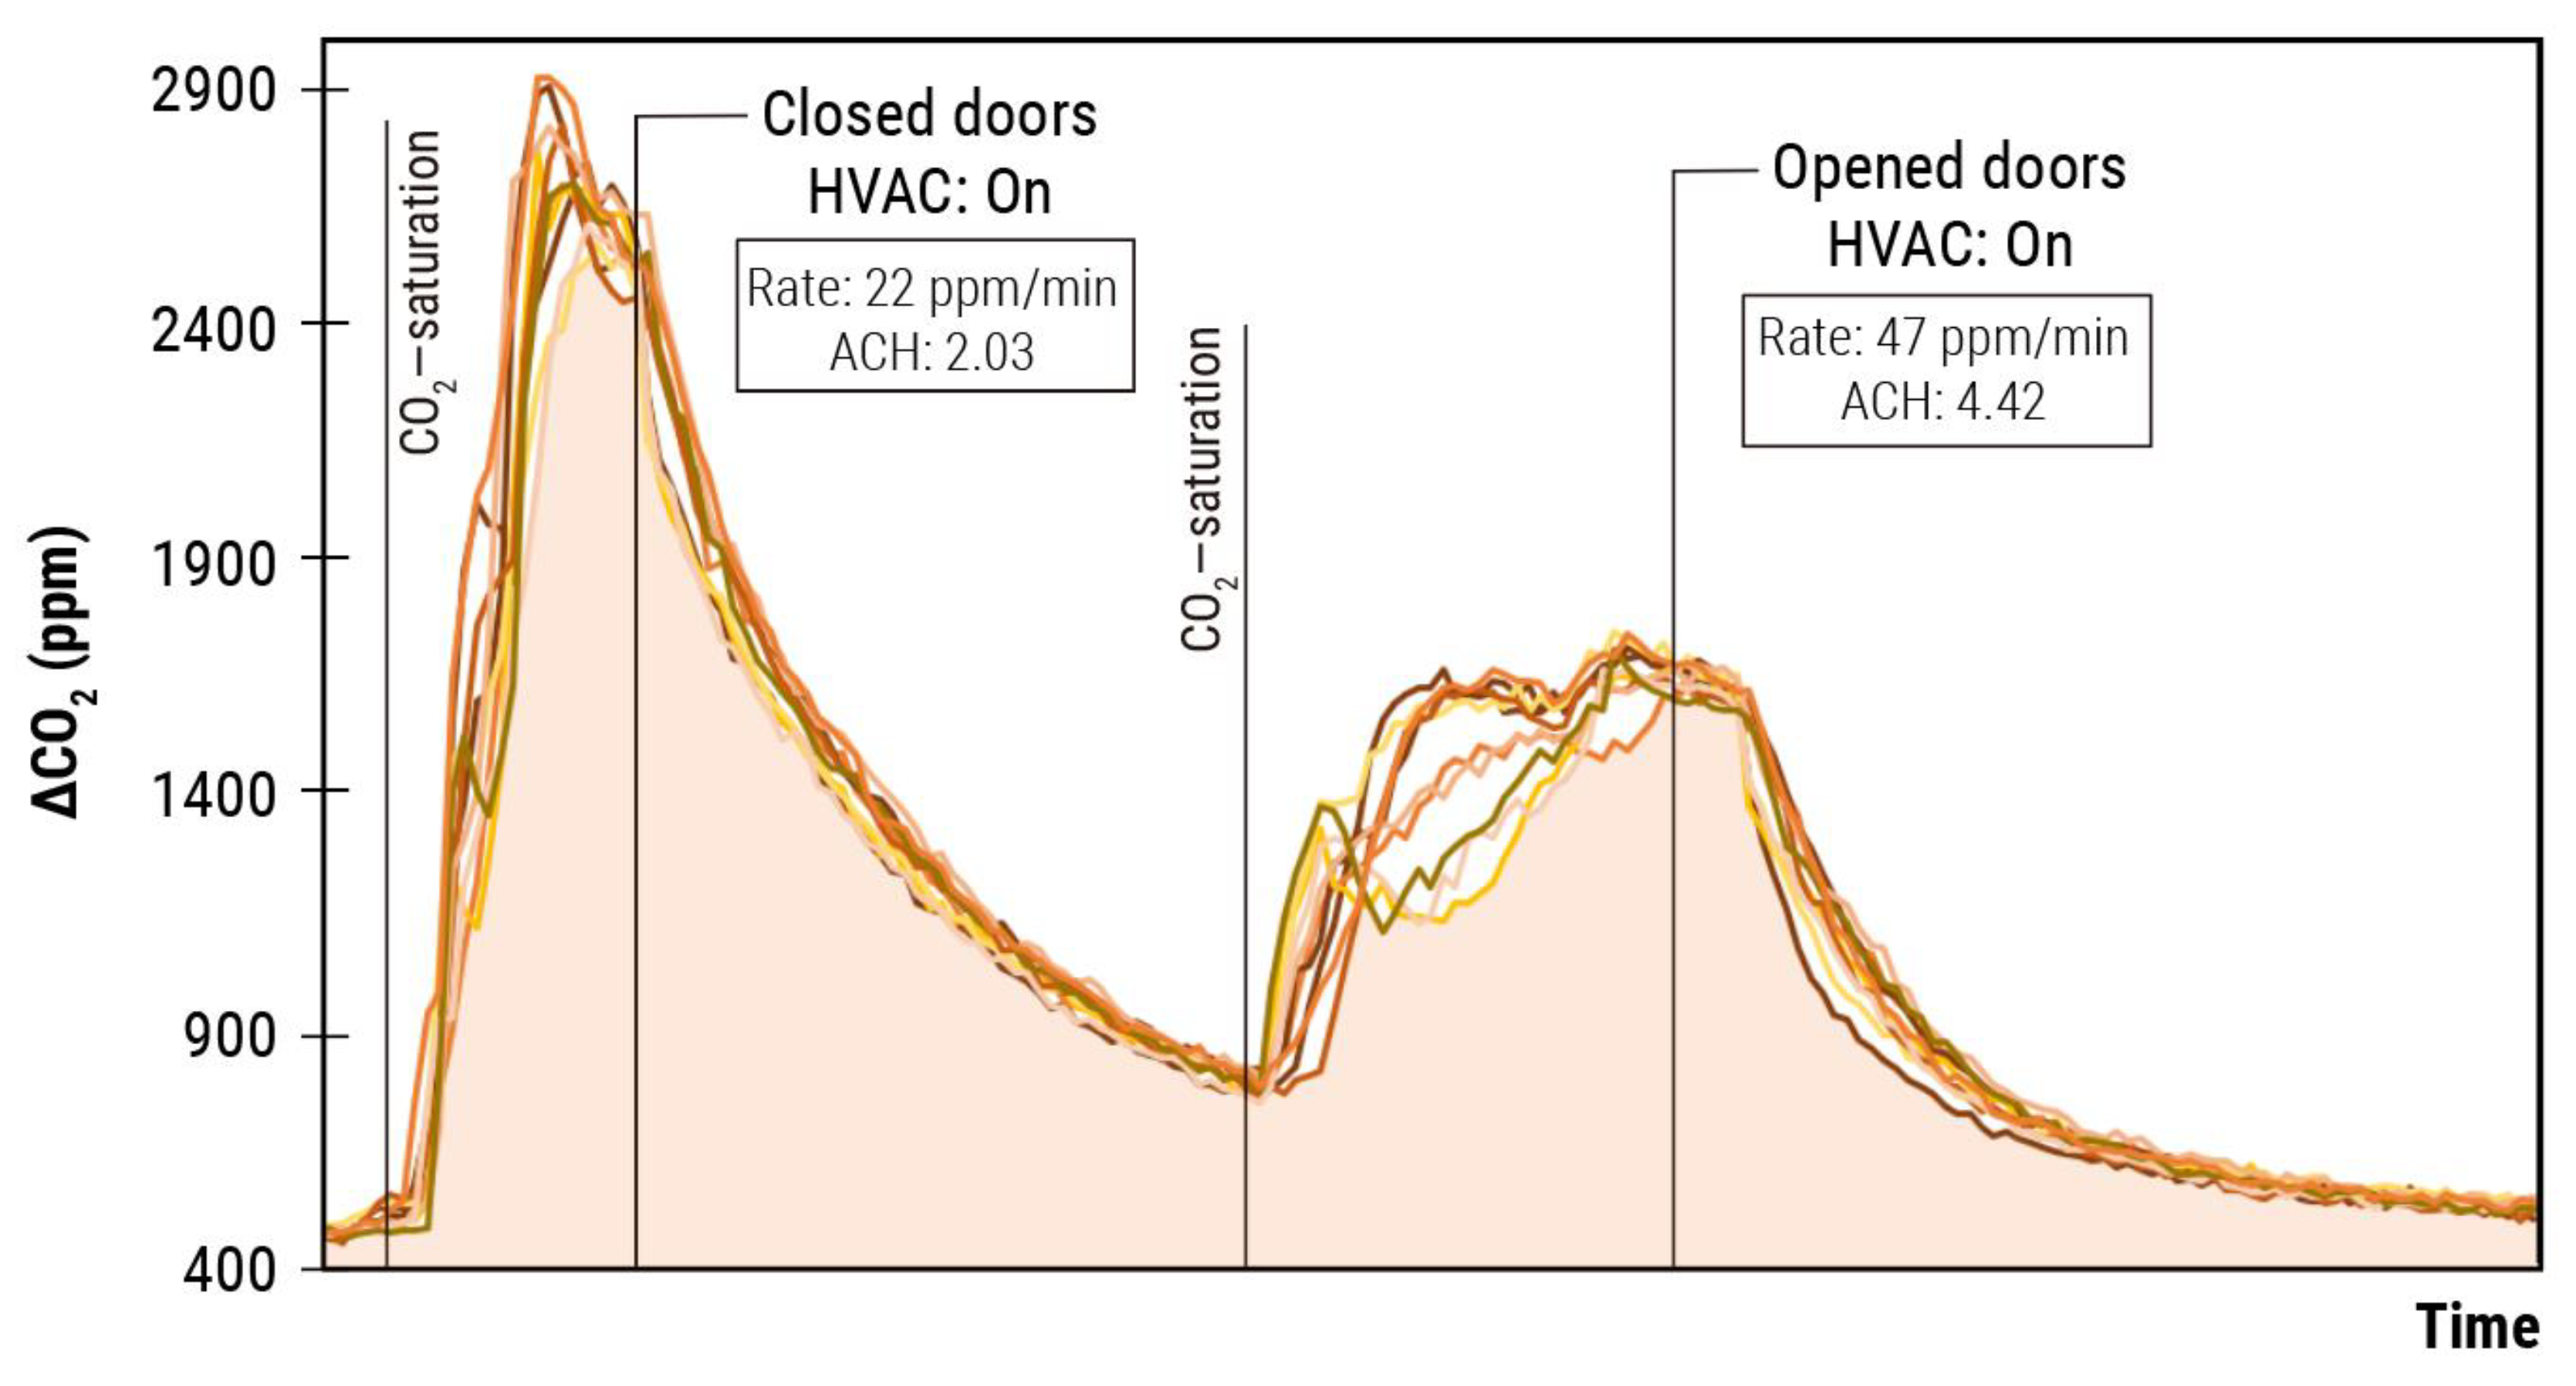
3.1.3. Correction Phase: Improving Ventilation Patterns

Faced with the conditions established during a state of the COVID-19 pandemic, the diagnostic phase indicates that the space does not pose a risk space for the airborne transmission of SARS-CoV-2. However, considering that Classroom 1 should be prepared for a post-pandemic environment (where masks are not mandatory), it is advisable to characterize the ventilation patterns of the space to identify effective strategies. Based on the results in Table 3, when individuals do not wear masks, Hr > 0.0064 h2·pax/m3 in 2/3 scenarios where the Teacher is infected. Additionally, the AR is increased in these cases, especially in the class of 150 min and 18 occupants.
After identifying that the ventilation patterns in Classroom 1 could be improved, it is advisable to analyze the effectiveness of corrective measures to ensure adequate air renewal. An experiment was conducted by saturating the space with CO2 using dry ice, and the concentration stabilized as a function of the amount that evaporated. Two scenarios were evaluated with an activated HVAC system: one with the doors closed and the other with the doors open. Figure 6 shows the results obtained. With closed doors, it takes approximately 37 min to reduce the CO2 concentration from ~1600 ppm to ~800 ppm, at a rate of 22 ppm/minute. Meanwhile, with open doors, the reduction from ~1600 ppm to ~800 ppm occurs in approximately 17 min, at a rate of 47 ppm/min. Opening doors with the HVAC system active represents a significant improvement in ventilation in this classroom.
Additionally, this method helps calculate the actual ACH in the space. The HVAC flow in Classroom 1 is 750 m3/s. For a volume of 363 m3 corresponding to the space, a theoretical ACH of 2.06 (door closed) is estimated. An ACH of 4.42 (with opened doors) and 2.03 (closed doors) has been determined by dry ice tests. It suggests that the tests have been carried out correctly and that the opening of the doors represents a considerable improvement in air renewal compared to the closed space. As a conclusion, it has been found that the ACH when the doors are open with the HVAC activated is twice as effective as when the doors are closed. This information could be very useful in a post-pandemic scenario or as a corrective measure if excessive CO2 values are detected during the monitoring phase.

3.1.4. MCS: Monitoring, Control, and Surveillance

From May to July 2021, 13 excess CO2 alerts were recorded (an increase of more than 320 ppm), as depicted in Figure 7. Given the high number of incidents, it was considered to reinforce the ventilation measures. In the case of Classroom 1, the following hypotheses were prepared:
Hypothesis 1. 
The activities studied in the initial diagnosis were not representative, and the high activity in the classroom resulted in more CO2 being exhaled. To test this, the following 12 English classes in Classroom 1, comprising the months of April to June, were analyzed. In the studied activities, there was no significant increase in CO2 except for the classes held in June, where an increase of 522 ppm was reached. Figure 8 shows the evolution of average CO2 from April to June, indicating an increase in concentration in the latter month. However, CO2 exhalation in the records studied is similar, so this hypothesis was ruled out.
Hypothesis 2. 
The weather conditions during the initial diagnosis were favorable for air renewal ratios. The impact of weather on ventilation ratios was assessed by analyzing the incidents recorded from April to July (regardless of the activity carried out). Of the 13 incidents found, 46% (6) occurred in July, while 31% (4) occurred in June, and the remaining 23% (3) occurred in May. Climatic variations have influenced the ventilation performance of the space.
Therefore, it was decided to mandate the opening of doors and the activation of the HVAC system during class hours. Sometimes, the subsequent monitoring phase can be used to assess the benefit of the corrective actions imposed. In the base case, opening the doors in Classroom 1 was sufficient to achieve adequate air renewal, even during the summer months, with no incidents registered between August and September 2021. Ideally, during monitoring, it would be necessary to implement a system that alerts those responsible for the space if the established CO2 limits are exceeded. This strategy allows for preventing potential incidents and correcting CO2 levels exceeded in real-time, thus guaranteeing adequate air quality.

3.2. Second Case: Commercial Spaces

3.2.1. Analysis: Determining Standard CO2 Thresholds

To conduct a more extensive application of the methodology for analyzing, diagnosing, correcting, and monitoring CO2, a study was carried out in 40 commercial spaces. In this case, absolute CO2 concentrations were measured instead of the outdoor-indoor CO2 increase, as it was not feasible to install additional CO2 meters outside due to the considerable distance between the shops.
The activity is heterogeneous within the same commercial space and among different spaces. Since it was not possible to estimate the necessary parameters to simulate an acceptable CO2 threshold, the same range was established for all shopping centers. Generally, all the spaces exhibited light activity and low exposure times, unlike the case of the cultural center. However, determining a representative number of occupants was not feasible.
The acceptable CO2 threshold was established based on the standards set in Zaragoza (Spain) [14]. Given that these are small commercial establishments (low-occupancy zone), the value of 800 ppm was taken as the reference value, aligning with Spanish RITE regulations (regulation of thermal installations in buildings) applicable in Zaragoza (Spain), in no case should never exceed the CO2 level of 1200 ppm. Specifically, RITE establishes four categories based on the type of space and its Indoor Air Quality (IDA), in absolute values: IDA 1 (average: 350 ppm; maximum: 750 ppm), IDA 2 (500–950 ppm), IDA 3 (800–1200 ppm), and IDA 4 (1200 ppm on average). While IDA 1 should be applicable in hospitals, laboratories or nurseries, IDA 2 is reserved for offices, residences, museums or classrooms, IDA 3 for commercial buildings, theaters, restaurants or gyms and IDA 4 should not be applicable. Following this standard, the selected commercial spaces should exhibit CO2 levels up to 800–1200 ppm. However, for the pandemic, it is recommended to reach an optimal air level (IDA 1). This CO2 thresholds also align different standards worldwide [71].

3.2.2. Analysis: Determining Standard CO2 Thresholds

Initially, a preliminary characterization (diagnosis) of the participating businesses was conducted. Twenty-three businesses with CO2 values above the maximum recommended threshold (800 ppm) were identified. Eight of them did not require specific follow-up interventions as the increases were minimal and discrete. The other 15 participants underwent a thorough evaluation, leading to the design and implementation of a series of preventive measures aimed at improving air recirculation in the commercial spaces.

3.2.3. Corrective Measure Implementation

The implementation of corrective measures was modified from the original approach. Instead of experimenting in situ, it was decided to assess the improvement of the proposed measures throughout the MCS stages. Thus, we evaluated the air renewal patterns from week to week. In our case, it was sufficient to agree on the terms with each person in charge through fortnight reports and phone calls. This strategy allowed us to reduce the costs of the project and evaluate several stores simultaneously.

3.2.4. MCS Phase and Corrective Measure Validation

In the period studied (January–February 2022), the average CO2 levels across all businesses were 547 ± 87 ppm in the first fortnight of January, 559 ± 86 ppm in the second fortnight of January, 531 ± 82 ppm in the first fortnight of February, and 529 ± 89 in the second half of January (Figure 9a). Substantial differences were observed based on the type of store, as depicted in Figure 9b. Specifically, the highest CO2 peaks were observed in childrens’ clothing stores (691 ± 209 ppm with maximums of 2297 ppm). This could be associated with limited opening of doors or windows to maintain the thermal comfort of the children. In contrast, florists reported the lowest CO2 levels (mean of 466 ± 47 ppm with a maximum of 874 ppm), possibly due to reduced customer dwell time during service.
A total of 15 businesses were selected for exhaustive monitoring. Among them, only five agreed to implement the corrective measures. The following sections describe the evolution of 3 establishments under the three typical scenarios:
  • Retail stores with good starting air quality. Initially, 17 shops showed a renewal of the air appropriate to the architecture of the space and the type of activity carried out. Three cases are shown below as an example.
    • (Example 1) In a shoe store, the limit of 800 ppm was not exceeded during the recorded period (Figure 10a). Specifically, it obtained an average CO2 value of 441 ± 42 ppm, reaching a maximum value of 776 ppm.
    • (Example 2) A food store was kept below 800 ppm (Figure 10b). Despite the large influx of customers, the levels maintained an average of 454 ± 39 ppm, reaching a maximum value of 782 ppm
    • (Example 3) In one of the clothing stores, the maximum established by the scientific community of 800 ppm was not exceeded (Figure 10c). On average, it reached a value of 469 ± 33 ppm, reaching a maximum value of 783 ppm.
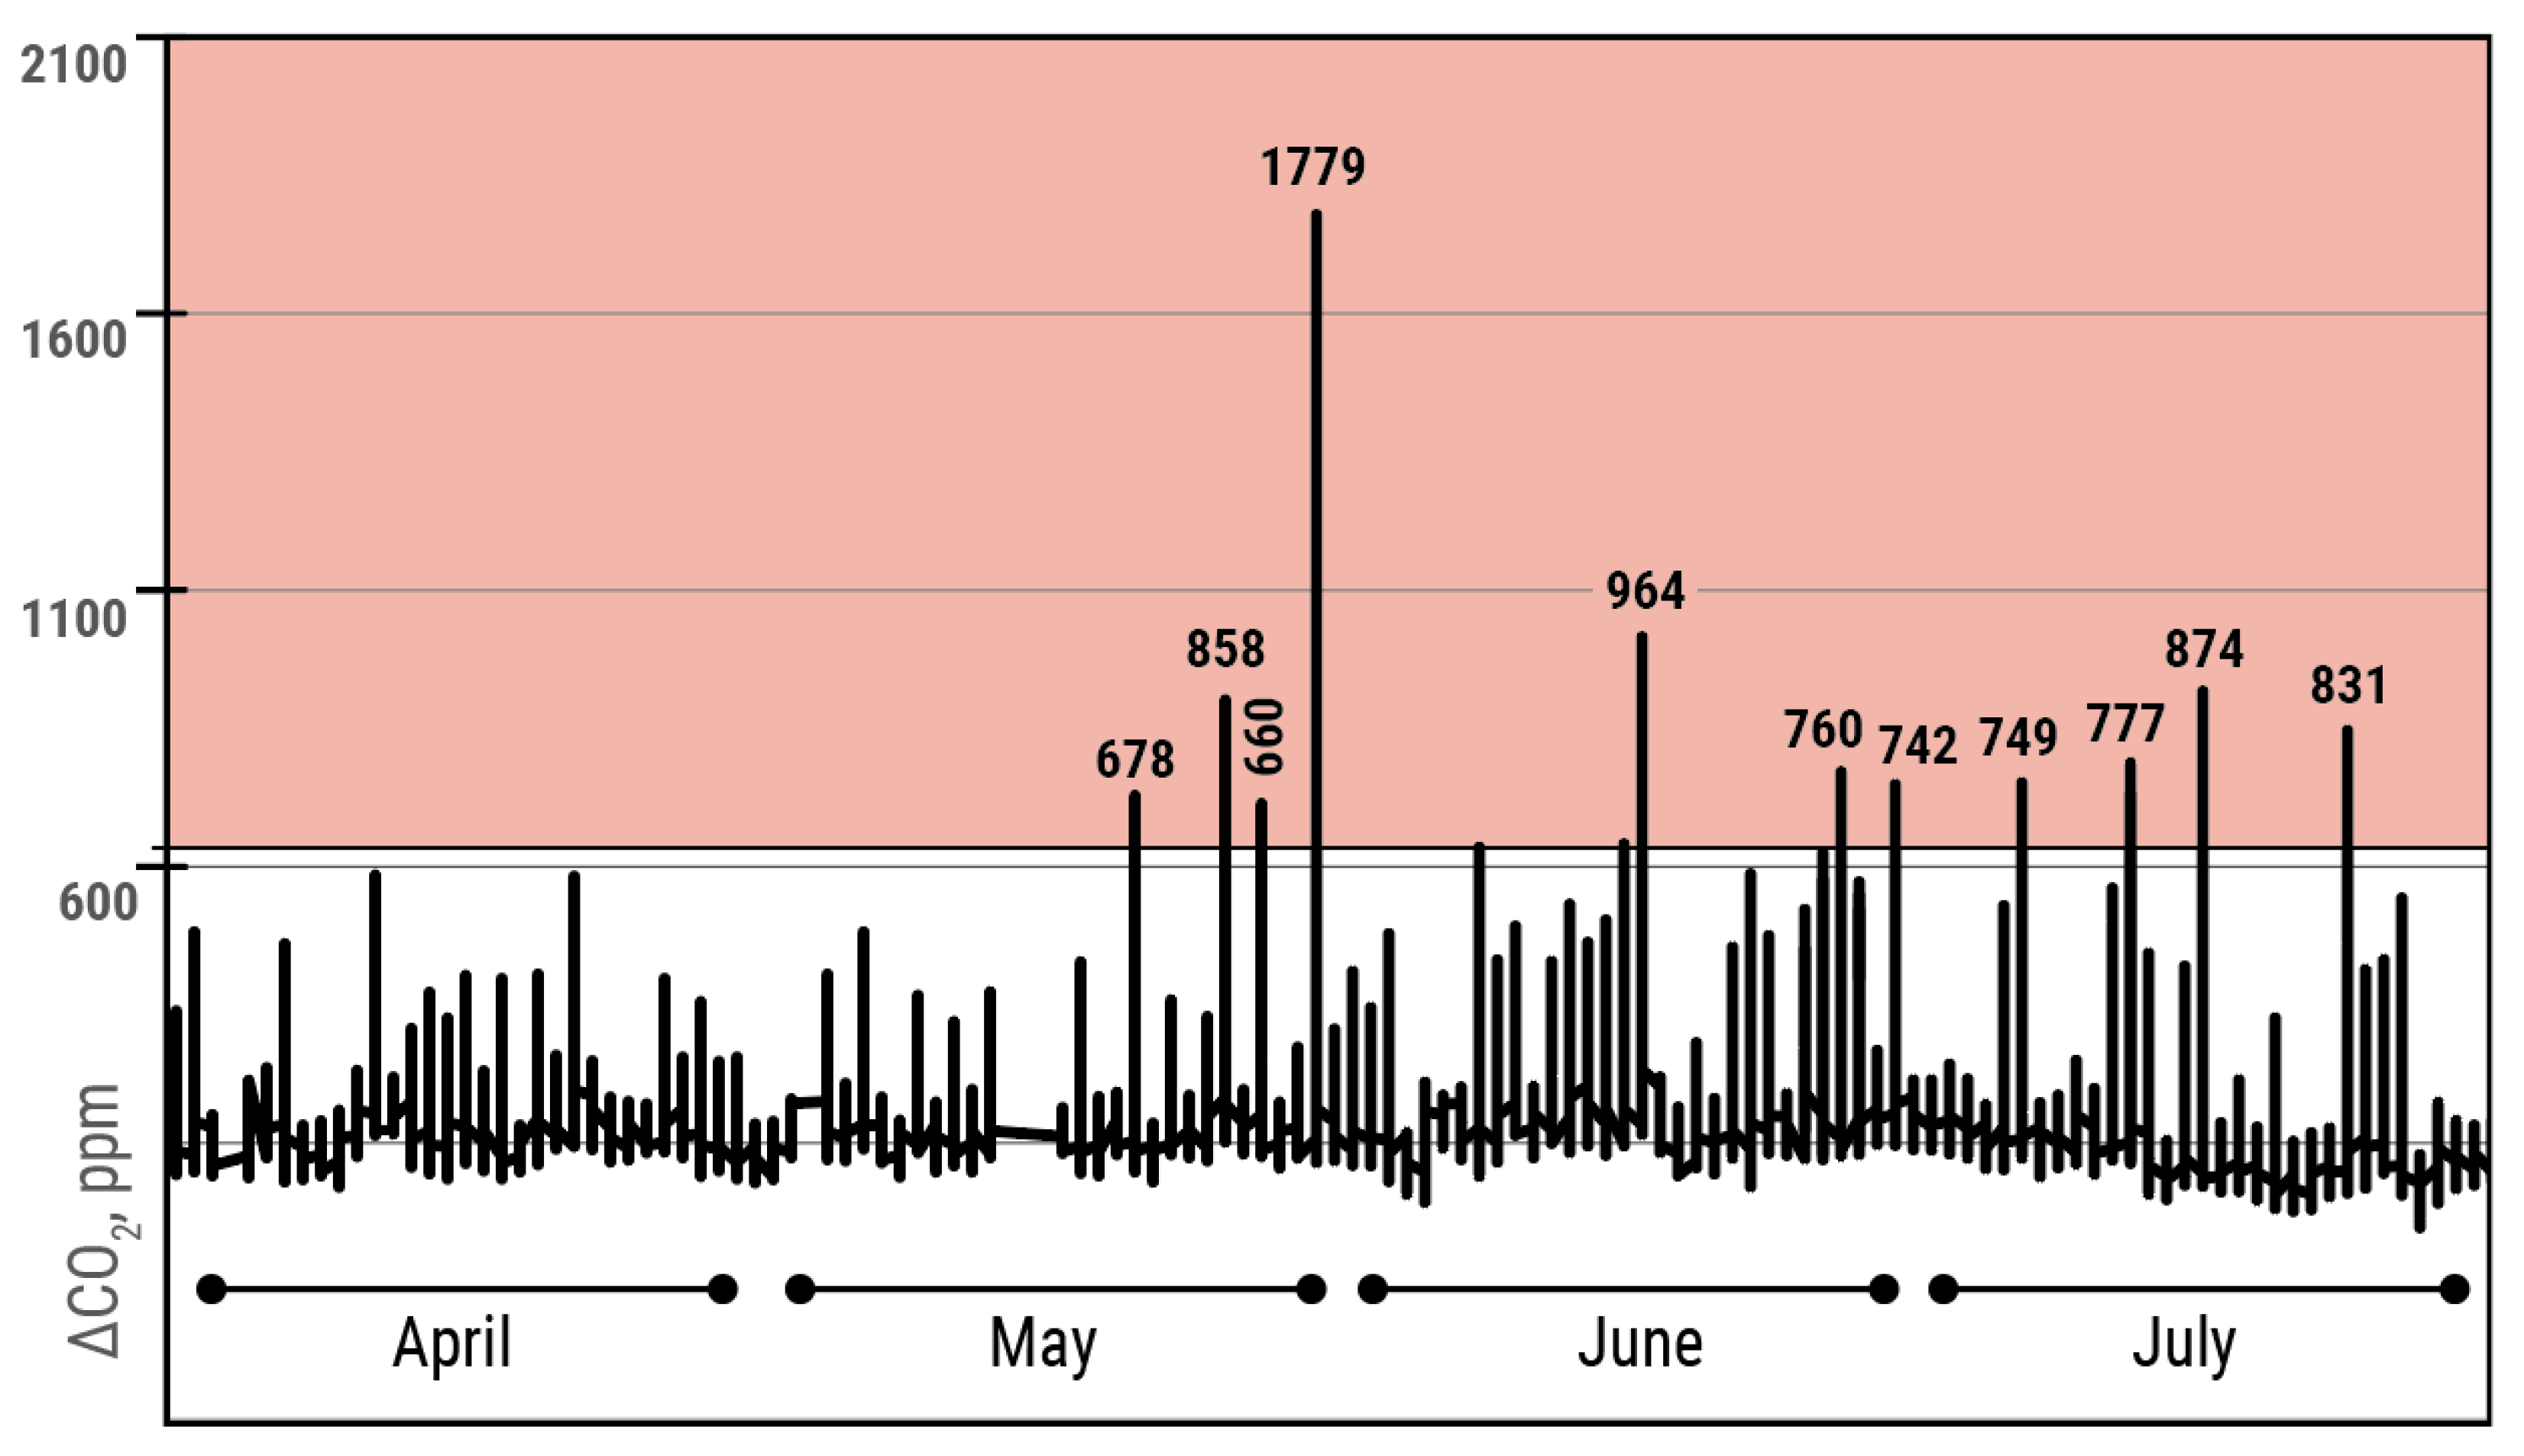
  • Businesses with improvable air quality that did not implement corrective actions. Of the 23 stores that showed levels above 800 ppm during the first week, only 15 of them did so continuously and with values above 900 ppm. The remaining eight stores were recommended to maximize the frequency of opening doors and windows. This section shows the evolution of CO2 in a business that refused to establish the proposed corrective measures.
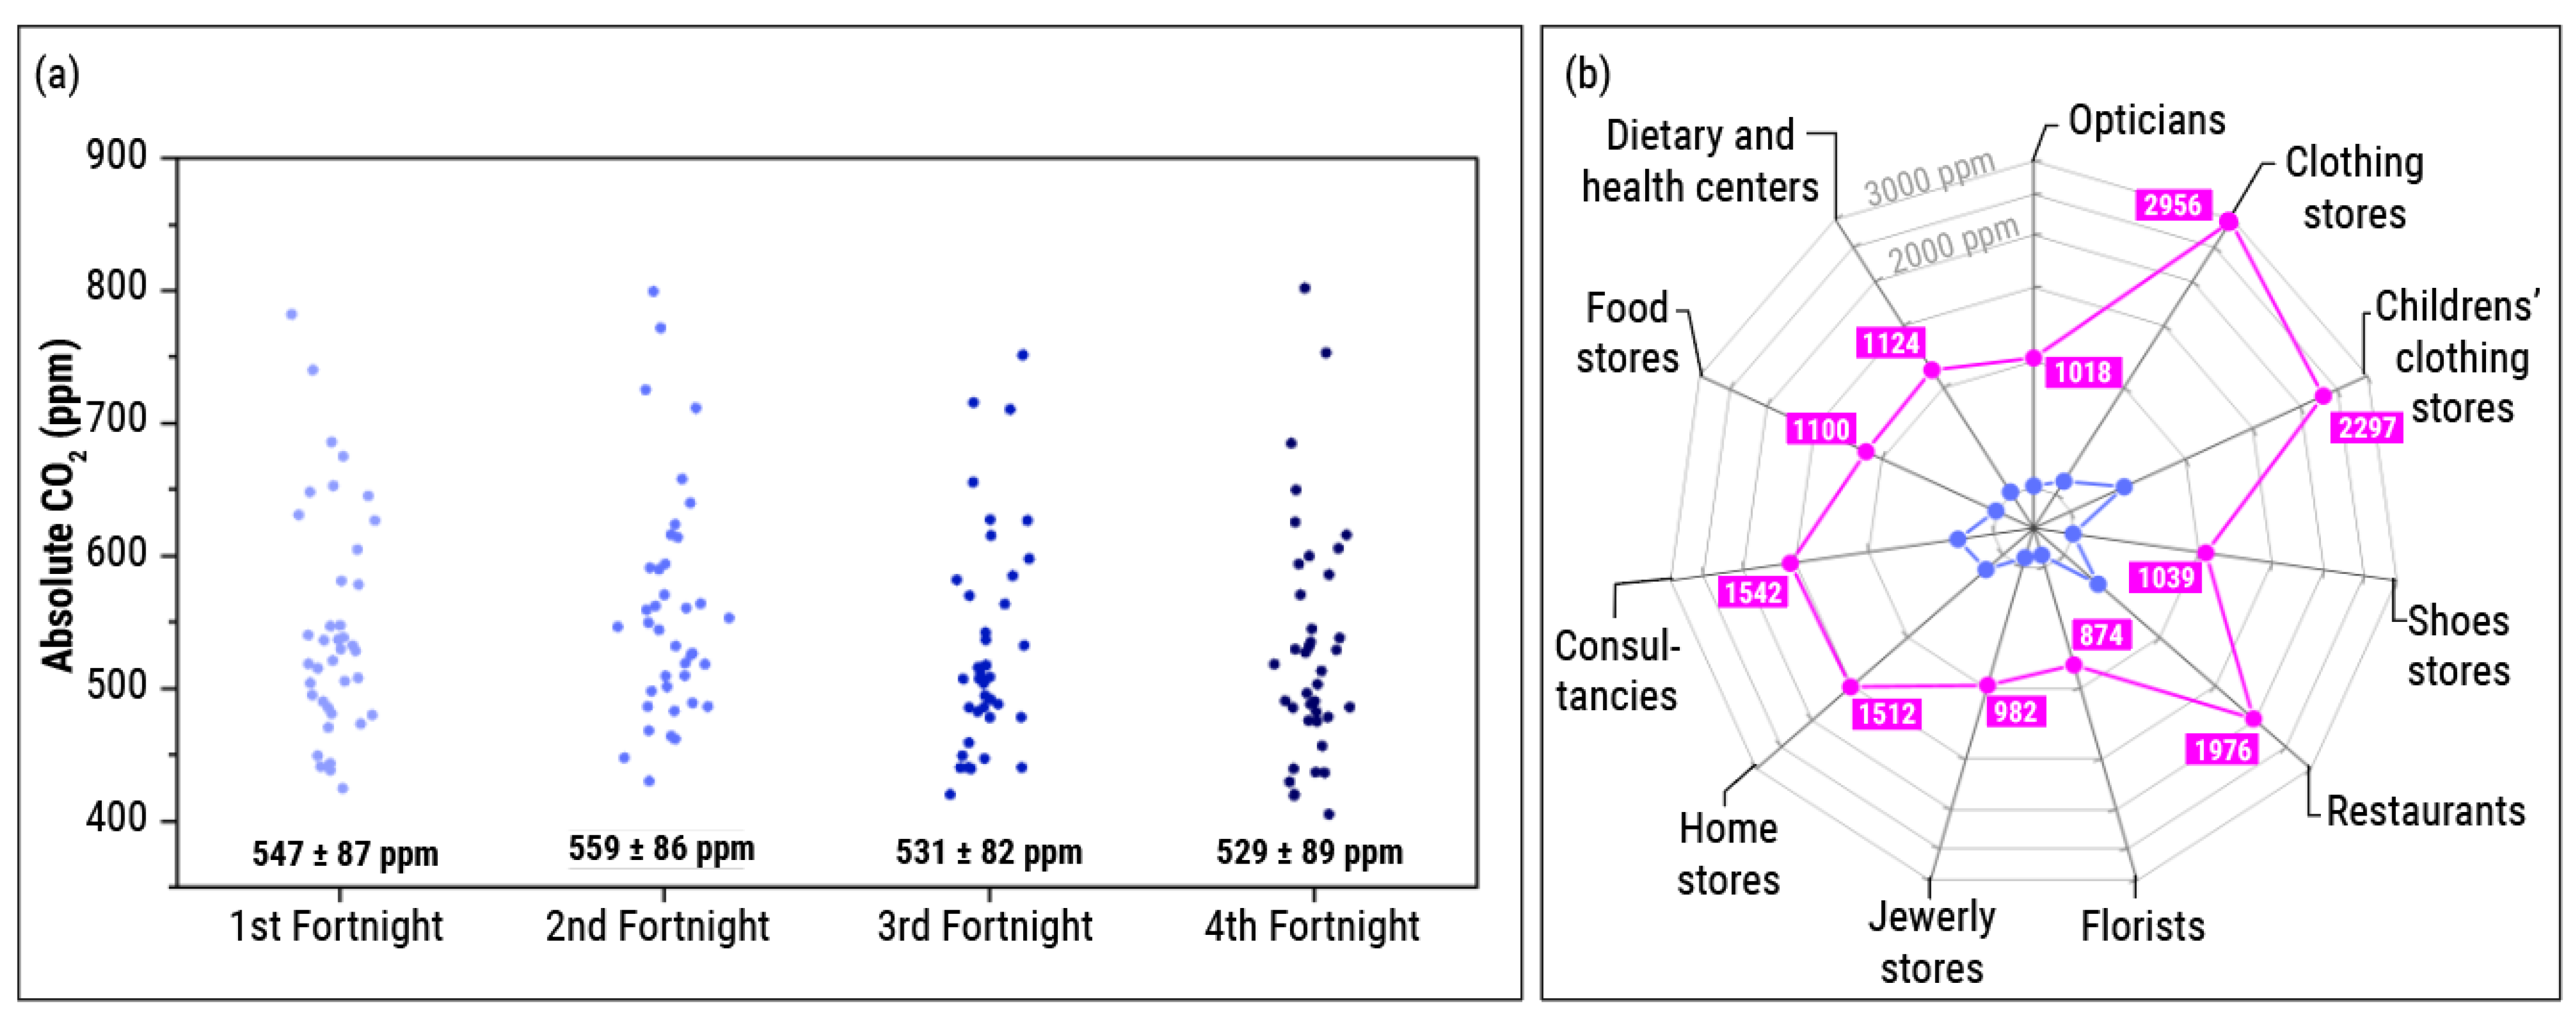
    • (Example 1) On average, a clothing store reached a value of 709 ± 295 ppm, reaching a maximum of 2956 ppm (Figure 10d).
    • (Example 2) A restaurant establishment reached an average value of 589 ± 139 ppm, reaching a maximum value of 1976 ppm (Figure 10e).
    • (Example 3) The mean of CO2 in a children’s clothing store was 762 ± 229 ppm, reaching a maximum of 2297 ppm (Figure 10f).
  • Spaces with improvable air quality that implemented corrective actions. After implementing the prevention measures (especially the reinforcement of natural ventilation), the reduction of CO2 in the establishments was substantial. Three cases are described below. The values of the first weeks concerning the final weeks are comparable, given that similar trends and averages are observed in the previous section.
    • (Example 1) In a clothing shop, the mean of CO2 was reduced from 605 ± 78 ppm (maximum of 1100 ppm) to 529 ± 78 ppm (745 ppm) after trying different measures. The increase in the frequency of door opening (Figure 10g) was more effective in the fourth fortnight. In this period, no values over 800 ppm were registered.
    • (Example 2) CO2 levels on average were reduced from 536 ± 89 ppm (maximum of 1001 ppm) to 485 ± 51 ppm (714 ppm) from the third fortnight in a food store, as shown in Figure 10h.
    • (Example 3) In a shoe store, the mean of CO2 was reduced from 528 ± 67 ppm (maximum of 946 ppm) to 473 ± 45 ppm (764 ppm). Although, at one point, 800 ppm was exceeded (Figure 10i).

4. Discussion

Despite the relentless monitoring of ‘foodborne’ and ‘waterborne’ disease transmission and the high standards on which it is based [72], there is still no regulation of airborne disease transmission. The measurement of metabolic CO2 has been an efficient an efficient measure for monitoring indoor air quality since its measurement acts as an indirect indicator of the presence of potentially pathogenic aerosols [7,8].
During the pandemic, the installation of meters in shopping malls [73], in public transportation [53,54,55], in offices [57], and in educational institutions [57,58,59,60,61,62] allowed spaces to be ventilated judiciously and more efficiently, thereby reducing the potentially risk of infectious disease transmission [74]. At this time, international initiatives appeared, such as Aireamos [66,75], a group of scientists that joined forces to promote the efficient measurement and interpretation of CO2 levels. However, airborne transmission cannot be forgotten after the pandemic period. COVID-19 stressed the importance of airborne transmission of pathogens, and airborne control is necessary to prevent future outbreaks of this and other respiratory diseases.
This work presents and discusses a new methodology for measuring CO2 in shared spaces based on analysis, diagnosis, correction, and MCS (monitoring, control, and surveillance phases). Briefly, the methodology can be sequenced in four stages:
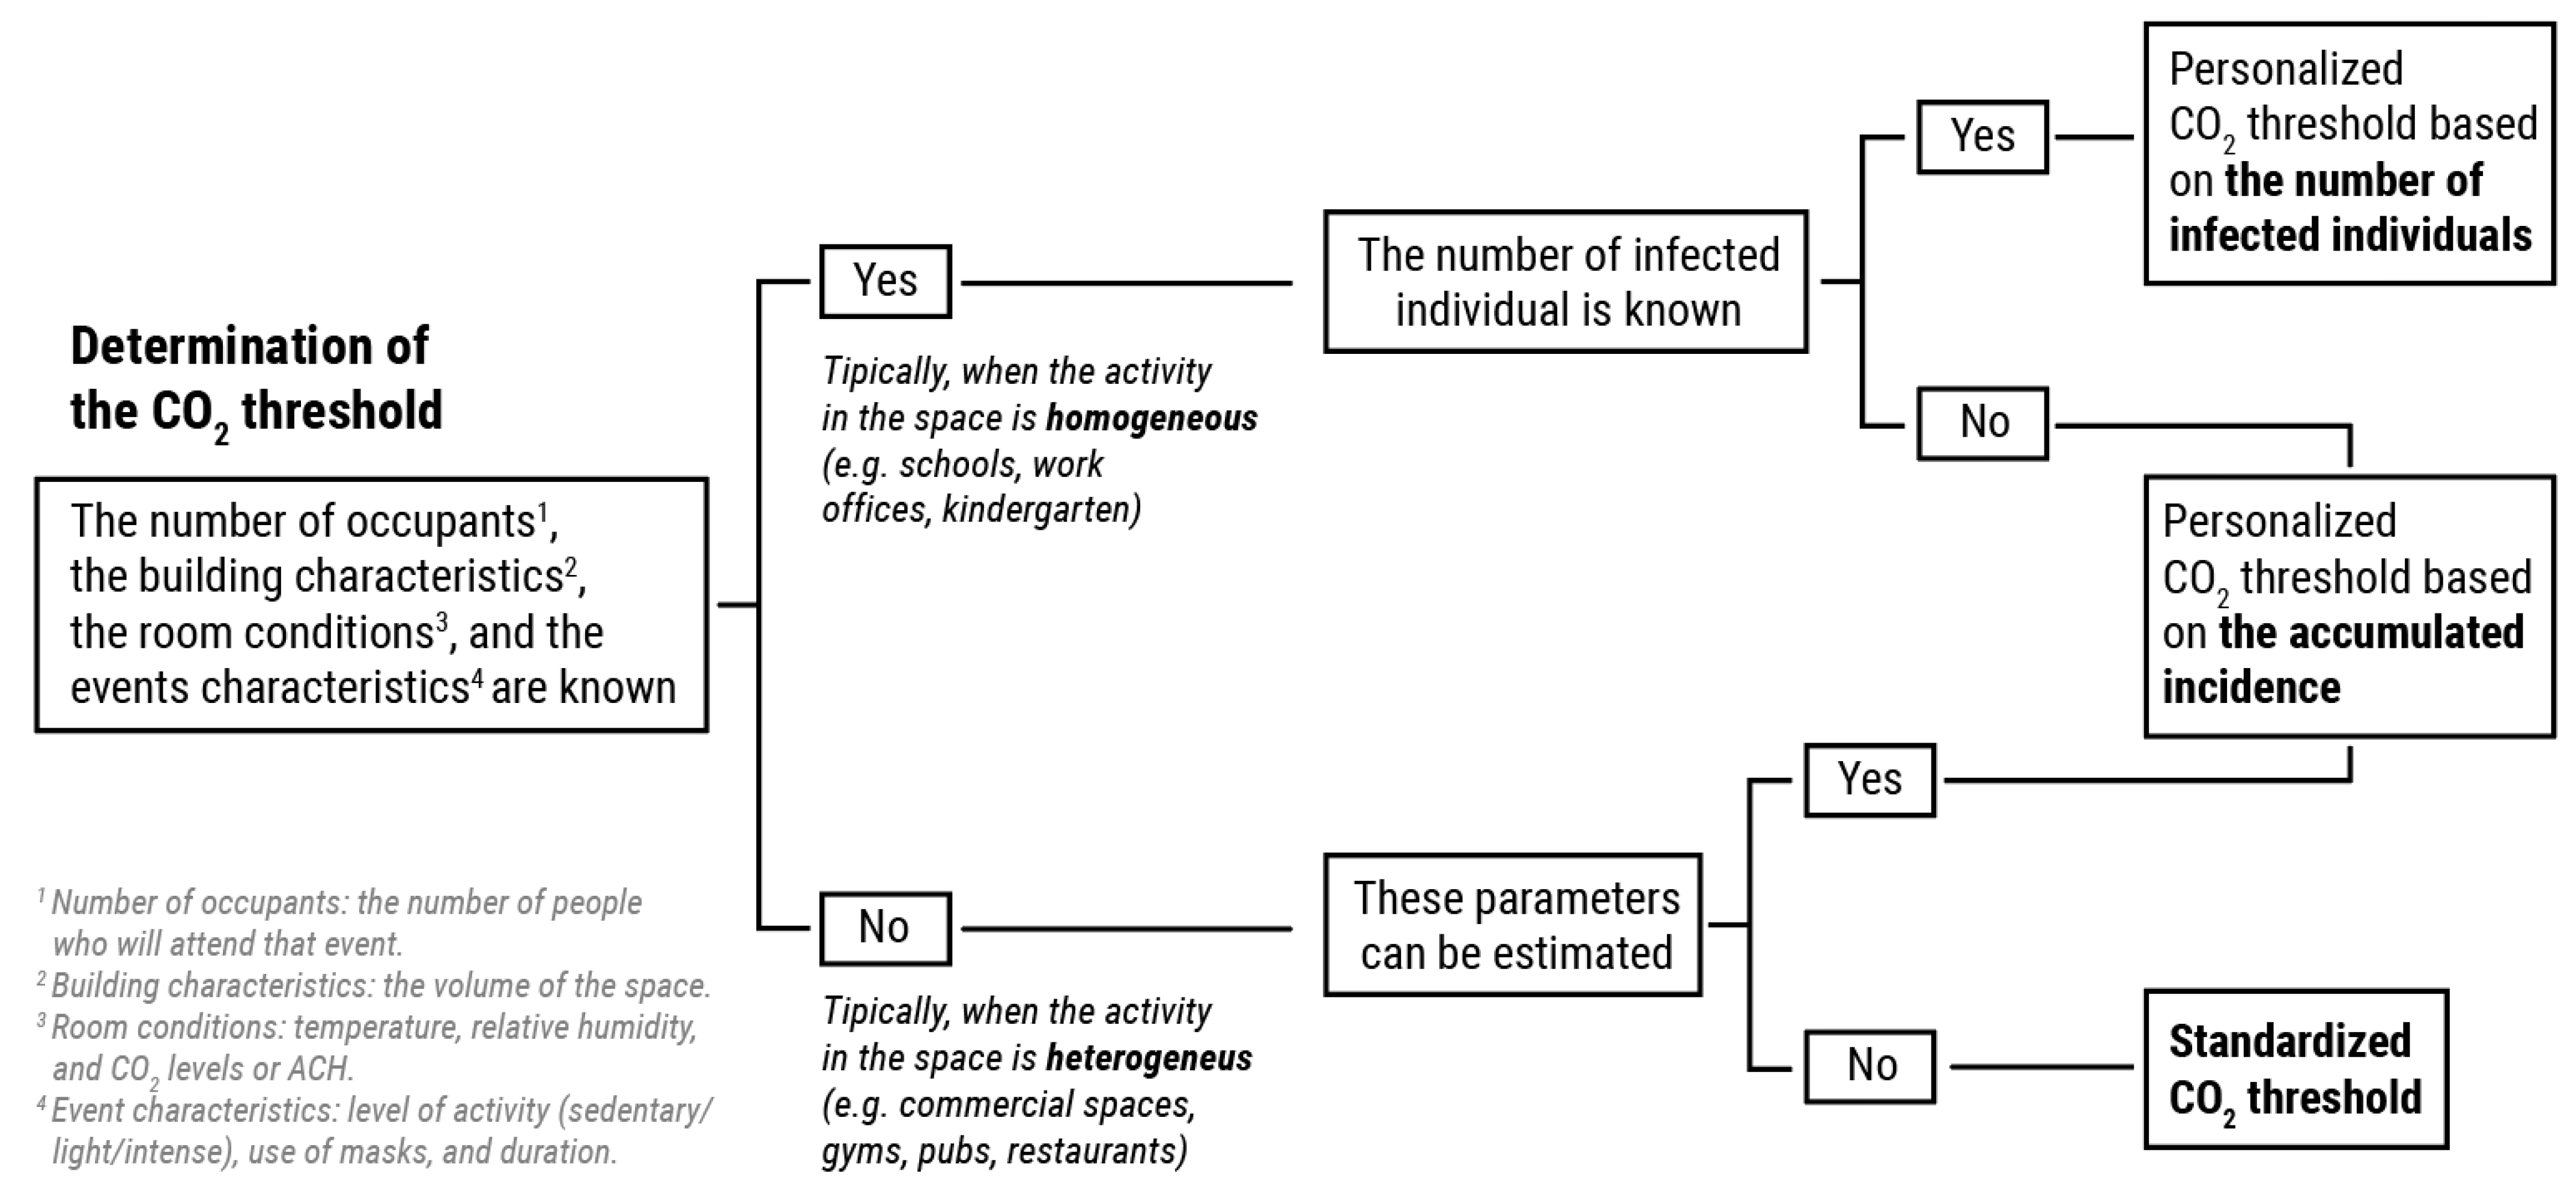
  • Analyzing. In this phase, acceptable CO2 thresholds will be established to reach areas of low risk of transmission. If the activity is homogeneous and the fundamental variables are known, it is possible to approximate the CO2 threshold following the Wells–Riley model [67] modified by Peng and Jimenez [7] to determine the risk of the space. In spaces with heterogeneous activities and/or unknown variables, it will be necessary to apply threshold values that could guarantee reasonable air renewal. Typically, CO2 thresholds have been established in a standard manner, without considering the variables related to the outbreak, the airborne pathogen, the parameters of the event, and the building [71]. However, as proposed in this methodology, the detailed study of the CO2 results can be crucial to interpret the event and the risk of transmission [62,70,76].
  • Diagnosing. After training the responsible person, the diagnostic phase was carried out. A first assessment of the shared space is made by placing CO2 meters for a time interval long enough to address the maximum possible casuistry. Usually, 3 or 4 activity days are enough. Ideally, placing more than one CO2 meter will let us know if the measurement represents the space. Additionally, it will bring preliminary, but not definitive, information about how the air renewal occurs in the shared space. After an in-depth analysis of the evolution of CO2 levels in the diagnosis phase, it is necessary to follow up in subsequent days (typically 6 or 7 days) to ensure that the diagnosis is representative of the space. Analyzing ventilation patterns under different boundary conditions can be key to establishing effective measures [56,77,78,79].
  • Correcting. Poor air renewal must be identified once an exhaustive analysis of the space has been carried out. After detecting these incidences (CO2 levels exceeding the established threshold), it is necessary to look for the cause of the problem. It is helpful to raise possible hypotheses and try to rule them out to propose efficient corrective measures. Ideally, these proposed measures can be validated by conducting experiments (e.g., saturating with CO2 and analyzing the advantage of each one) or carrying out a detailed follow-up in the monitoring phase. Note that this phase can be performed linearly (e.g., after diagnosis), or it can also be implemented during monitoring if necessary. The results obtained from the validation in 40 retail stores in the center of Zaragoza (Spain) suggest that it is possible to quickly implement measures that favor the renewal of shared air. In this work, opening doors and windows was one of the most straightforward and immediate methods applied in almost any situation, according to previous reports [80,81]. In this sense, other authors suggest that continuous and cross-ventilation is effective to maintain an adequate ventilation in school classrooms [77]. Considering the ease of adopting these measures, it is necessary to start establishing definitive strategies to improve ventilation in indoor spaces.
  • MCS. A monitoring and follow-up phase is crucial to warn of any incident where the CO2 limit is exceeded. It is the only strategy that ensures good indoor air quality. It is possible that, in spaces where natural ventilation influences the space air renewal, the CO2 concentration fluctuates depending on the weather. In these cases, it may be necessary to re-implement the correction phase to maintain adequate air renewal. Ideally, an alert system can be valuable for the monitored center, allowing it to prevent the accumulation of CO2 or modulate the capacity and, ultimately, correct the situation.
This methodology was validated in a subset of 40 local businesses in Zaragoza (Spain). As previously mentioned, the COVID-19 pandemic has underscored the necessity to reconsider epidemiological control strategies. Specifically, the growing understanding of airborne disease transmission makes it imperative to implement new public health strategies that ensure air quality adheres to specific standards.

5. Conclusions

Strategies based on the measurement of metabolic CO2 present a simple and effective alternative for controlling air quality and air renewal. This methodology is structured into three phases: diagnosis, correction, and monitoring, control, and follow-up. The protocol was successfully validated in local businesses in Zaragoza, Spain, where the proper implementation of each phase resulted in a significant improvement in air quality and air renewal. We have demonstrated that the methodology is practical and can reduce the risk of aerosol-transmitted respiratory diseases by enhancing air circulation. We hope this work contributes to establishing the methodological foundations for CO2 measurement to become a valuable, standardized, and reliable tool.

Author Contributions

Conceptualization, M.B., J.J.A. and A.J.S.; methodology, M.B., J.J.A. and A.J.S.; investigation, M.B. and A.J.S.; writing—original draft preparation, M.B.; writing—review and editing, J.J.A. and A.J.S.; supervision, J.J.A. and A.J.S.; project administration, J.J.A. and A.J.S.; funding acquisition, J.J.A. and A.J.S. All authors have read and agreed to the published version of the manuscript.

Funding

This research was funded by the Instituto de Investigación Sanitaria Aragón: Campaña Investiga COVID-19 (CoviBlock).

Institutional Review Board Statement

Not applicable.

Informed Consent Statement

Not applicable.

Data Availability Statement

The data presented in this study are available on request from the corresponding author.

Acknowledgments

We want to express our gratitude to “Fundación Ibercaja” and “Federación de Empresarios de Comercio y Servicios de Zaragoza (ECOS Zaragoza)” for supporting this research and their invaluable collaboration. We thank Signos.io for their help and support with the CO2 meters. We also would like to thank “Ayuntamiento de Zaragoza” and “Instituto de Investigación Sanitaria Aragón” for the received support.

Conflicts of Interest

The authors (M.B., J.J.A. and A.J.S.) are founders and shareholders of Great Air S.L.

References

  1. Lewis, B.D. Why the WHO Took Two Years to Say COVID Is Airborne. Nature 2022, 604, 26–31. [Google Scholar] [CrossRef] [PubMed]
  2. Ruiz de Adana, M.; Jiménez, E.; Jiménez, J.L.; Cruz Minguillon, M.; Ballester, J.; Querol, X.; Grupo de Trabajo Multidisciplinar. Informe Del GTM: Equipos Autónomos Para La Limpieza Del Aire y Sensores Para El Control de La Transmisión de SARS-CoV-2 Por Aerosoles; Ministerio de Ciencia e Innovación: Madrid, Spain, 2021; Available online: https://digital.csic.es/handle/10261/242479 (accessed on 16 December 2022).
  3. Baselga, M.; Alba, J.J.; Schuhmacher, A.J. Impact of Needle-Point Bipolar Ionization System in the Reduction of Bioaerosols in Collective Transport. Sci. Total Environ. 2023, 855, 158965. [Google Scholar] [CrossRef] [PubMed]
  4. Licht, S.; Hehir, A.; Trent, S.; Dunlap, D.; Borumand, K.; Wilson, M.; Smith, K. Use of Bipolar Ionization for Disinfection within Airplanes; Boeing: Chicago, IL, USA, 2021. [Google Scholar]
  5. Liu, D.T.; Philips, K.M.; Speth, M.M.; Besser, G.; Mueller, C.A.; Sedaghat, A.R. Portable HEPA Purifiers to Eliminate Airborne SARS-CoV-2: A Systematic Review. Otolaryngol. Head Neck Surg. 2021, 166, 615–622. [Google Scholar] [CrossRef] [PubMed]
  6. Rodríguez, M.; Palop, M.L.; Seseña, S.; Rodríguez, A. Are the Portable Air Cleaners (PAC) Really Effective to Terminate Airborne SARS-CoV-2? Sci. Total Environ. 2021, 785, 147300. [Google Scholar] [CrossRef] [PubMed]
  7. Peng, Z.; Jimenez, J.L. Exhaled CO2 as a COVID-19 Infection Risk Proxy for Different Indoor Environments and Activities. Environ. Sci. Technol. Lett. 2021, 8, 392–397. [Google Scholar] [CrossRef] [PubMed]
  8. Rudnick, S.; Milton, D. Risk of Indoor Airborne Infection Transmission Estimated from Carbon Dioxide Concentration. Indoor Air 2003, 13, 237–245. [Google Scholar] [CrossRef] [PubMed]
  9. Kappelt, N.; Russell, H.S.; Kwiatkowski, S.; Afshari, A.; Johnson, M.S. Correlation of Respiratory Aerosols and Metabolic Carbon Dioxide. Sustainability 2021, 13, 12203. [Google Scholar] [CrossRef]
  10. Shao, S.; Zhou, D.; He, R.; Li, J.; Zou, S.; Mallery, K.; Kumar, S.; Yang, S.; Hong, J. Risk Assessment of Airborne Transmission of COVID-19 by Asymptomatic Individuals under Different Practical Settings. J. Aerosol Sci. 2021, 151, 105661. [Google Scholar] [CrossRef]
  11. Fabian, P.; Brain, J.; Houseman, E.; Gern, J.; Milton, D. Origin of Exhaled Breath Particles from Healthy and Human Rhinovirus-Infected Subjects. J. Aerosol Med. Pulm. Drug Deliv. 2011, 24, 137–147. [Google Scholar] [CrossRef]
  12. Wang, C.C.; Prather, K.A.; Sznitman, J.; Jimenez, J.L.; Lakdawala, S.S.; Tufekci, Z.; Marr, L.C. Airborne Transmission of Respiratory Viruses. Science 2021, 373, eabd9149. [Google Scholar] [CrossRef]
  13. Johnson, G.R.; Morawska, L.; Ristovski, Z.D.; Hargreaves, M.; Mengersen, K.; Chao, C.Y.H.; Wan, M.P.; Li, Y.; Xie, X.; Katoshevski, D.; et al. Modality of Human Expired Aerosol Size Distributions. J. Aerosol Sci. 2011, 42, 839–851. [Google Scholar] [CrossRef]
  14. Colegio Ingenieros Industriales de Aragón y la Rioja; Ayuntamiento de Zaragoza. Guía de Referencia COVID. 2021. Available online: https://www.zaragoza.es/contenidos/coronavirus/guia-referencia-covid.pdf (accessed on 13 December 2022).
  15. Cheng, S.Y.; Wang, C.J.; Shen, A.C.T.; Chang, S.C. How to Safely Reopen Colleges and Universities During COVID-19: Experiences From Taiwan. Ann. Intern. Med. 2020, 173, 638–641. [Google Scholar] [CrossRef] [PubMed]
  16. Barbieri, P.; Zupin, L.; Licen, S.; Torboli, V.; Semeraro, S.; Cozzutto, S.; Palmisani, J.; Di Gilio, A.; de Gennaro, G.; Fontana, F.; et al. Molecular Detection of SARS-CoV-2 from Indoor Air Samples in Environmental Monitoring Needs Adequate Temporal Coverage and Infectivity Assessment. Environ. Res. 2021, 198, 111200. [Google Scholar] [CrossRef] [PubMed]
  17. Baselga, M.; Güemes, A.; Alba, J.J.; Schuhmacher, A.J. SARS-CoV-2 Droplet and Airborne Transmission Heterogeneity. J. Clin. Med. 2022, 11, 2607. [Google Scholar] [CrossRef] [PubMed]
  18. Chan, V.W.M.; So, S.Y.C.; Chen, J.H.K.; Yip, C.C.Y.; Chan, K.H.; Chu, H.; Chung, T.W.H.; Sridhar, S.; To, K.K.W.; Chan, J.F.W.; et al. Air and Environmental Sampling for SARS-CoV-2 around Hospitalized Patients with Coronavirus Disease 2019 (COVID-19). Infect. Control. Hosp. Epidemiol. 2020, 41, 1258–1265. [Google Scholar]
  19. Chia, P.Y.; Coleman, K.K.; Tan, Y.K.; Ong, S.W.X.; Gum, M.; Lau, S.K.; Lim, X.F.; Lim, A.S.; Sutjipto, S.; Lee, P.H.; et al. Detection of Air and Surface Contamination by SARS-CoV-2 in Hospital Rooms of Infected Patients. Nat. Commun. 2020, 11, 2800. [Google Scholar] [CrossRef]
  20. Department of Infectious Disease, Imperial College London (London, UK). Evaluation of Sars-Cov-2 Air Contamination in Hospitals with Coriolis Air Sampler. 2020. Available online: https://www.bertin-instruments.com/wp-content/uploads/2020/08/CORM-026-039-B-SARS-CoV-2-in-hospitals-1.pdf (accessed on 13 December 2023).
  21. Ding, Z.; Qian, H.; Xu, B.; Huang, Y.; Miao, T.; Yen, H.L.; Xiao, S.; Cui, L.; Wu, X.; Shao, W.; et al. Toilets Dominate Environmental Detection of Severe Acute Respiratory Syndrome Coronavirus 2 in a Hospital. Sci. Total Environ. 2021, 753, 141710. [Google Scholar] [CrossRef]
  22. Dumont-Leblond, N.; Veillette, M.; Mubareka, S.; Yip, L.; Longtin, Y.; Jouvet, P.; Paquet Bolduc, B.; Godbout, S.; Kobinger, G.; McGeer, A.; et al. Low Incidence of Airborne SARS-CoV-2 in Acute Care Hospital Rooms with Optimized Ventilation. Emerg. Microbes Infect. 2020, 9, 2597–2605. [Google Scholar] [CrossRef]
  23. Gomes, P.; Gonçalves, J.; Isabel, A.; Lopes, B.; Esteves, N.A.; Emanuel, G.; Bamba, E.; Maria, S.; Branco, P.T.B.S.; Soares, R.R.G.; et al. Evidence of Air and Surface Contamination with SARS-CoV-2 in a Major Hospital in Portugal. Int. J. Environ. Res. Public Health 2022, 19, 525. [Google Scholar]
  24. Kenarkoohi, A.; Noorimotlagh, Z.; Falahi, S.; Amarloei, A.; Abbas, S. Hospital Indoor Air Quality Monitoring for the Detection of SARS-CoV-2 (COVID-19) Virus. Sci. Total Envion. 2020, 748, 141324. [Google Scholar] [CrossRef]
  25. Lednicky, J.A.; Shankar, S.N.; Elbadry, M.A.; Gibson, J.C.; Alam, M.M.; Stephenson, C.J.; Eiguren-Fernandez, A.; Glenn Morris, J.; Mavian, C.N.; Salemi, M.; et al. Collection of SARS-CoV-2 Virus from the Air of a Clinic within a University Student Health Care Center and Analyses of the Viral Genomic Sequence. Aerosol Air Qual. Res. 2020, 20, 1167–1171. [Google Scholar] [CrossRef] [PubMed]
  26. Mallach, G.; Kasloff, S.B.; Kovesi, T.; Kumar, A.; Kulka, R.; Krishnan, J.; Robert, B.; McGuinty, M.; den Otter-Moore, S.; Yazji, B.; et al. Aerosol SARS-CoV-2 in Hospitals and Long-Term Care Homes during the COVID-19 Pandemic. PLoS ONE 2021, 16, e0258151. [Google Scholar] [CrossRef] [PubMed]
  27. Moore, G.; Rickard, H.; Stevenson, D.; Aranega-Bou, P.; Pitman, J.; Crook, A.; Davies, K.; Spencer, A.; Burton, C.; Easterbrook, L.; et al. Detection of SARS-CoV-2 within the Healthcare Environment: A Multi-Centre Study Conducted during the First Wave of the COVID-19 Outbreak in England. J. Hosp. Infect. 2021, 108, 189–196. [Google Scholar] [CrossRef] [PubMed]
  28. Nissen, K.; Krambrich, J.; Akaberi, D.; Hoffman, T.; Ling, J.; Lundkvist, Å.; Svensson, L.; Salaneck, E. Long-Distance Airborne Dispersal of SARS-CoV-2 in COVID-19 Wards. Sci. Rep. 2020, 10, 19589. [Google Scholar] [CrossRef] [PubMed]
  29. Santarpia, J.L.; Rivera, D.N.; Herrera, V.L.; Morwitzer, M.J.; Creager, H.M.; Santarpia, G.W.; Crown, K.K.; Brett-Major, D.M.; Schnaubelt, E.R.; Broadhurst, M.J.; et al. Aerosol and Surface Contamination of SARS-CoV-2 Observed in Quarantine and Isolation Care. Sci. Rep. 2020, 10, 12732. [Google Scholar] [CrossRef] [PubMed]
  30. Winslow, R.L.; Zhou, J.; Windle, E.F.; Nur, I.; Lall, R.; Ji, C.; Millar, J.E.; Dark, P.; Naisbitt, J.; Simonds, A.; et al. SARS-CoV-2 Environmental Contamination from Hospitalised COVID-19 Patients Receiving Aerosol Generating Procedures. Thorax 2021, 77, 259–267. [Google Scholar] [CrossRef] [PubMed]
  31. Liu, Y.; Ning, Z.; Chen, Y.; Guo, M.; Liu, Y.; Gali, N.K.; Sun, L.; Duan, Y.; Cai, J.; Westerdahl, D.; et al. Aerodynamic Analysis of SARS-CoV-2 in Two Wuhan Hospitals. Nature 2020, 582, 557–560. [Google Scholar] [CrossRef]
  32. Stern, R.A.; Koutrakis, P.; Martins, M.A.G.; Lemos, B.; Dowd, S.E.; Sunderland, E.M.; Garshick, E. Characterization of Hospital Airborne SARS-CoV-2. Respir. Res. 2021, 22, 1–8. [Google Scholar] [CrossRef]
  33. Ma, J.; Qi, X.; Chen, H.; Li, X.; Zhang, Z.; Wang, H.; Sun, L.; Zhang, L.; Guo, J.; Morawska, L.; et al. Exhaled Breath Is a Significant Source of SARS-CoV-2 Emission. medRxiv 2020, arXiv:2020.05.31.20115154. [Google Scholar] [CrossRef]
  34. Styczynski, A.; Hemlock, C.; Hoque, K.I.; Verma, R.; LeBoa, C.; Bhuiyan, M.O.F.; Nag, A.; Harun, M.G.D.; Amin, M.B.; Andrews, J.R. Ventilation and Detection of Airborne SARS-CoV-2: Elucidating High-Risk Spaces in Naturally Ventilated Healthcare Settings. medRxiv 2021, arXiv:2021.06.30.21258984. [Google Scholar]
  35. Song, Z.G.; Chen, Y.M.; Wu, F.; Xu, L.; Wang, B.F.; Shi, L.; Chen, X.; Dai, F.H.; She, J.L.; Chen, J.M.; et al. Identifying the Risk of SARS-CoV-2 Infection and Environmental Monitoring in Airborne Infectious Isolation Rooms (AIIRs). Virol. Sin. 2020, 35, 785–792. [Google Scholar] [CrossRef] [PubMed]
  36. Moreno, T.; Pintó, R.M.; Bosch, A.; Moreno, N.; Alastuey, A.; Minguillón, M.C.; Anfruns-Estrada, E.; Guix, S.; Fuentes, C.; Buonanno, G.; et al. Tracing Surface and Airborne SARS-CoV-2 RNA inside Public Buses and Subway Trains. Environ. Int. 2021, 147, 106326. [Google Scholar] [CrossRef] [PubMed]
  37. Silva, P.G.; Branco, P.T.B.S.; Soares, R.R.G.; Mesquita, J.R.; Sousa, S.I.V. SARS-CoV-2 air sampling: A systematic review on the methodologies for detection and infectivity. Indoor Air 2022, 32, e13083. [Google Scholar] [CrossRef] [PubMed]
  38. Chen, G.M.; Ji, J.J.; Jiang, S.; Xiao, Y.Q.; Zhang, R.L.; Huang, D.N.; Liu, H.; Yu, S.Y. Detecting Environmental Contamination of Acute Respiratory Syndrome Coronavirus 2 (SARS-CoV-2) in Isolation Wards and Fever Clinics*. Biomed. Environ. Sci. 2020, 33, 943–947. [Google Scholar] [CrossRef] [PubMed]
  39. Zhou, A.J.; Otter, J.A.; Price, J.R.; Cimpeanu, C.; Garcia, M.; Kinross, J.; Boshier, P.R.; Mason, S.; Bolt, F.; Alison, H.; et al. Investigating SARS-CoV-2 Surface and Air Contamination in an Acute Healthcare 2 Setting during the Peak of the COVID-19 Pandemic in London. medRxiv 2020, arXiv:2020.05. 24.20110346. [Google Scholar]
  40. Lei, H.; Ye, F.; Liu, X.; Huang, Z.; Ling, S.; Jiang, Z.; Cheng, J.; Huang, X.; Wu, Q.; Wu, S.; et al. SARS-CoV-2 Environmental Contamination Associated with Persistently Infected COVID-19 Patients. Influenza Other Respir. Viruses 2020, 14, 688–699. [Google Scholar] [CrossRef] [PubMed]
  41. Centers for Disease Control and Prevention. Scientific Brief: SARS-CoV-2 Transmission. Available online: https://stacks.cdc.gov/view/cdc/105949 (accessed on 13 December 2022).
  42. Shim, E.; Tariq, A.; Choi, W.; Lee, Y.; Chowell, G. Transmission Potential and Severity of COVID-19 in South Korea. Int. J. Infect. Dis. 2020, 93, 339–344. [Google Scholar] [CrossRef] [PubMed]
  43. Park, S.Y.; Kim, Y.M.; Yi, S.; Lee, S.; Na, B.J.; Kim, C.B.; Kim, J.; Kim, H.S.; Kim, Y.B.; Park, Y.; et al. Coronavirus Disease Outbreak in Call Center, South Korea. Emerg. Infect. Dis. 2020, 26, 1666–1670. [Google Scholar] [CrossRef]
  44. Fontanet, A.; Tondeur, L.; Madec, Y.; Grant, R.; Besombes, C.; Jolly, N.; Pellerin, S.F.; Ungeheuer, M.-N.; Cailleau, I.; Kuhmel, L.; et al. Cluster of COVID-19 in Northern France: A Retrospective Closed Cohort Study. SSRN Electron. J. 2020, 1–22. [Google Scholar] [CrossRef]
  45. MOH News Highlights. 2020. Available online: http://web.archive.org/web/20200420074230/https://www.moh.gov.sg/news-highlights/details/16-more-cases-discharged-35-new-cases-of-covid-19-infection-confirmed (accessed on 13 December 2023).
  46. Cai, J.; Sun, W.; Huang, J.; Gamber, M.; Wu, J.; He, G. Indirect Virus Transmission in Cluster of COVID-19 Cases, Wenzhou, China, 2020. Emerg. Infect. Dis. 2020, 26, 1343–1345. [Google Scholar] [CrossRef]
  47. Chu, J.; Yang, N.; Wei, Y.; Yue, H.; Zhang, F.; Zhao, J.; He, L.; Sheng, G.; Chen, P.; Li, G.; et al. Clinical Characteristics of 54 Medical Staff with COVID-19: A Retrospective Study in a Single Center in Wuhan, China. J. Med. Virol. 2020, 92, 807–813. [Google Scholar] [CrossRef] [PubMed]
  48. Sim, W. The Straits Times. Japan Identifies 15 Clusters as COVID-19 Cases. 2020. Available online: http://web.archive.org/web/20200420073241/https://www.straitstimes.com/asia/east-asia/japan-identifies-15-clusters-as-covid-19-cases-mount (accessed on 13 December 2023).
  49. Aljazeera after One Infected 16 at Berlin Nightclub, Coronavirus Fears Grow. 2020. Available online: http://web.archive.org/web/20200420071353/https://www.aljazeera.com/news/2020/03/infected-16-berlin-nightclub-coronavirus-fears-grow-200310132859234.html (accessed on 13 December 2023).
  50. Marcelo, P.; O’brien, M. Cluster of Coronavirus Cases Tied to U.S. Biotech Meeting. 2020. Available online: http://web.archive.org/web/20200401222019/https://time.com/5801554/coronavirus-cluster-biotech-biogen-boston-mbridge/ (accessed on 13 December 2023).
  51. Orban, A. 26 Passengers Tested Positive for COVID-19 on an Emirates Flight to Hong Kong. Aviation 24 Website. 2020. Available online: https://www.aviation24.be/airlines/emirates-airline/26-passengers-tested-positive-on-an-emirates-flight-to-hong-kong/ (accessed on 13 December 2023).
  52. Shen, Y.; Li, C.; Dong, H.; Wang, Z.; Martinez, L.; Sun, Z.; Handel, A.; Chen, Z.; Chen, E.; Ebell, M.H.; et al. Community Outbreak Investigation of SARS-CoV-2 Transmission among Bus Riders in Eastern China. JAMA Intern. Med. 2020, 180, 1665–1671. [Google Scholar] [CrossRef] [PubMed]
  53. Zauzmer, J. ‘Take It Very Seriously’: Pastor at Arkansas Church Where 34 People Came down with Coronavirus Sends a Warning. The Washington Pos. 2020. Available online: http://web.archive.org/web/20200420073657/https://www.washingtonpost.com/religion/2020/03/24/pastor-arkansas-church-coronavirus-warning-greers-ferry/ (accessed on 13 December 2023).
  54. McKie, R. Did Singing Together Spread Coronavirus to Four Choirs? The Observer. 2020. Available online: https://www.theguardian.com/world/2020/may/17/did-singing-together-spread-coronavirus-to-four-choirs (accessed on 13 December 2023).
  55. Singapore Upcode Academy. Dashboard of the COVID-19 Virus Outbreak in Singapore. 2021. Available online: http://web.archive.org/web/20200420073524/https://www.againstcovid19.com/singapore?start=21-01-2020&end=20-04-2020 (accessed on 13 December 2023).
  56. Adam, D.C.; Wu, P.; Wong, J.Y.; Lau, E.H.Y.; Tsang, T.K.; Cauchemez, S.; Leung, G.M.; Cowling, B.J. Clustering and Superspreading Potential of SARS-CoV-2 Infections in Hong Kong. Nat. Med. 2020, 26, 1714–1719. [Google Scholar] [CrossRef] [PubMed]
  57. DW News. Coronavirus: German Slaughterhouse Outbreak Crosses. 2020. Available online: https://www.dw.com/en/coronavirus-german-slaughterhouse-outbreak-crosses-1000/a-53883372 (accessed on 13 December 2023).
  58. Cannon, A. Spike in COVID-19 Cases in Iowa Packing Plants a Big Part of 389 New Cases, State’s Largest Single-Day Increase. Des Moines Register. 2020. Available online: https://eu.desmoinesregister.com/story/news/2020/04/19/coronavirus-iowa-largest-single-day-increase-iowa-covid-19-cases-tied-meatpacking-plants/5162127002/ (accessed on 13 December 2023).
  59. Adebayo, B. A Worker Infected 533 Others with Coronavirus at a Factory in Ghana, President Says. 2020. Available online: https://edition.cnn.com/2020/05/11/africa/ghana-factory-coronavirus-infection-intl/index.html (accessed on 13 December 2023).
  60. Halliday, J. Over 450 COVID-19 Cases Reported at Food Factories in England and Wales. The Guardian. 2020. Available online: https://www.theguardian.com/uk-news/2020/jun/25/over-450-covid-19-cases-reported-at-food-factories-in-england-and-wales (accessed on 13 December 2023).
  61. Sneppen, K.; Taylor, R.J.; Simonsen, L. Impact of Superspreaders on Dissemination and Mitigation of COVID-19. medRxiv 2020, arXiv:2020.05.17.2010474. [Google Scholar]
  62. Querol, X.; Alastuey, A.; Moreno, N.; Minguillón, M.C.; Moreno, T.; Karanasiou, A.; Jimenez, J.L.; Li, Y.; Morguí, J.A.; Felisi, J.M. How Can Ventilation Be Improved on Public Transportation Buses? Insights from CO2 Measurements. Environ. Res. 2022, 205, 112451. [Google Scholar] [CrossRef]
  63. Woodward, H.; Fan, S.; Bhagat, R.K.; Dadonau, M.; Wykes, M.D.; Martin, E.; Hama, S.; Tiwari, A.; Dalziel, S.B.; Jones, R.L.; et al. Air Flow Experiments on a Train Carriage—Towards Understanding the Risk of Airborne Transmission. Atmosphere 2021, 12, 1267. [Google Scholar] [CrossRef]
  64. Salthammer, T.; Fauck, C.; Omelan, A.; Wientzek, S.; Uhde, E. Time and Spatially Resolved Tracking of the Air Quality in Local Public Transport. Sci. Rep. 2022, 12, 3262. [Google Scholar] [CrossRef]
  65. Baselga, M.; Alba, J.J.; Schuhmacher, A.J. The Control of Metabolic CO2 in Public Transport as a Strategy to Reduce the Transmission of Respiratory Infectious Diseases. Int. J. Environ. Res. Public Health 2022, 19, 6605. [Google Scholar] [CrossRef]
  66. Bazant, M.Z.; Kodio, O.; Cohen, A.E.; Khan, K.; Gu, Z.; Bush, J.W.M. Monitoring Carbon Dioxide to Quantify the Risk of Indoor Airborne Transmission of COVID-19. Flow 2021, 1, E10. [Google Scholar] [CrossRef]
  67. Chillon, S.A.; Millan, M.; Aramendia, I.; Fernandez-Gamiz, U.; Zulueta, E.; Mendaza-Sagastizabal, X. Natural Ventilation Characterization in a Classroom under Different Scenarios. Int. J. Environ. Res. Public Health 2021, 18, 5425. [Google Scholar] [CrossRef]
  68. Zhang, D.; Ding, E.; Bluyssen, P.M. Guidance to Assess Ventilation Performance of a Classroom Based on CO2 Monitoring. Indoor Built Environ. 2022, 31, 1107–1126. [Google Scholar] [CrossRef]
  69. McNeill, V.F.; Corsi, R.; Huffman, J.A.; King, C.; Klein, R.; Lamore, M.; Maeng, D.Y.; Miller, S.L.; Lee Ng, N.; Olsiewski, P.; et al. Room-Level Ventilation in Schools and Universities. Atmos. Environ. X 2022, 13, 100152. [Google Scholar] [CrossRef] [PubMed]
  70. Avella, F.; Gupta, A.; Peretti, C.; Fulici, G.; Verdi, L.; Belleri, A.; Babich, F. Low-Invasive CO2-Based Visual Alerting Systems to Manage Natural Ventilation and Improve IAQ in Historic School Buildings. Heritage 2021, 4, 3442–3468. [Google Scholar] [CrossRef]
  71. Zivelonghi, A.; Lai, M. Mitigating Aerosol Infection Risk in School Buildings: The Role of Natural Ventilation, Volume, Occupancy and CO2 Monitoring. Build. Environ. 2021, 204, 108139. [Google Scholar] [CrossRef]
  72. GOV.UK. All Schools to Receive Carbon Dioxide Monitors. Available online: https://www.gov.uk/government/news/allschools-to-receive-carbon-dioxide-monitors (accessed on 13 December 2023).
  73. Dutch News. All Classrooms to Get a CO2 Meter as Part of Ventilation Package. 2022. Available online: https://www.dutchnews.nl/news/2022/02/all-classrooms-to-get-aco2-meter-as-part-of-ventilation-package/ (accessed on 13 December 2023).
  74. The White House. Biden Administration Launches Effort to Improve Ventilation and Reduce the Spread of COVID-19 in Buildings. Available online: https://www.whitehouse.gov/briefing-room/statements-releases/2022/03/17/fact-sheet-biden-administration-launches-effort-to-improve-ventilation-and-reduce-the-spread-of-covid-19-in-buildings/#:~:text=Today%20the%20Administration%20is%20launching,their%20buildings%20and%20reduce%20the (accessed on 13 December 2023).
  75. Aireamos. Aireamos. Available online: https://www.aireamos.org/ (accessed on 13 December 2023).
  76. Campano-Laborda, M.A.; Domínguez-Amarillo, D.; Acosta-García, J.; Fernández-Agüera, J.; Bustamante-Rojas, P.; Sendra-Salas, J.; Jiménez-Palacios, J.L.; Velarde-Rodríguez, I.; Acosta-García, I.; Bustamante-Rojas, P. COVID Risk Airborne; Universidad de Sevilla: Sevilla, Spain, 2021. [Google Scholar]
  77. Wells, W.F. Airborne Contagion and Air Hygiene: An Ecological Study of Droplet Infections; Commonwealth Fund: New York, NY, USA, 1955. [Google Scholar]
  78. Buonanno, G.; Morawska, L.; Stabile, L. Quantitative Assessment of the Risk of Airborne Transmission of SARS-CoV-2 Infection: Prospective and Retrospective Applications. Environ. Int. 2020, 145, 106112. [Google Scholar] [CrossRef] [PubMed]
  79. Peng, Z.; Rojas, A.L.P.; Kropff, E.; Bahnfleth, W.; Buonanno, G.; Dancer, S.J.; Kurnitski, J.; Li, Y.; Loomans, M.G.L.C.; Marr, L.C.; et al. Practical Indicators for Risk of Airborne Transmission in Shared Indoor Environments and Their Application to COVID-19 Outbreaks. Environ. Sci. Technol. 2022, 56, 1125–1137. [Google Scholar] [CrossRef]
  80. Rodríguez, D.; Urbieta, I.R.; Velasco, Á.; Campano-Laborda, M.Á.; Jiménez, E. Assessment of Indoor Air Quality and Risk of COVID-19 Infection in Spanish Secondary School and University Classrooms. Build. Environ. 2022, 226, 109717. [Google Scholar] [CrossRef]
  81. Ahmed Abdul–Wahab, S.A.; En, S.C.F.; Elkamel, A.; Ahmadi, L.; Yetilmezsoy, K. A Review of Standards and Guidelines Set by International Bodies for the Parameters of Indoor Air Quality. Atmos. Pollut. Res. 2015, 6, 751–767. [Google Scholar] [CrossRef]
Figure 1. Decision tree to establish the acceptable CO2 threshold depending on the event and space characteristics.
Covid 03 00124 g001
Figure 2. (a) General distribution of CO2 meters in the educational building and (b) classroom 1 in detail. CO2 meter #10 was placed outside the building to determine the increase in CO2 ( C O 2 ) relative to the outside air measurement.
Covid 03 00124 g002
Figure 3. Hr values vs. metabolic CO2 levels in one studied case (15 occupants, 180 min). As an example, the CO2 threshold proposed for Classroom 1 is labeled.
Covid 03 00124 g003
Figure 4. AR values vs. metabolic CO2 levels in one studied case (15 occupants, 180 min).
Covid 03 00124 g004
Figure 5. General overview of CO2 patterns in the cultural center. Increment of CO2 values recorded in the diagnostic period.
Covid 03 00124 g005
Figure 6. Results of the experiment with dry ice in Classroom 1, with and without open doors.
Covid 03 00124 g006
Figure 7. Incidences (CO2 excess) in Classroom 1 from April to July 2021. 13 excess CO2 alerts were registered.
Covid 03 00124 g007
Figure 8. Evolution of average ∆CO2 in English classes from April to June.
Covid 03 00124 g008
Figure 9. (a) Mean of CO2 value (inbox) of all businesses based on the fortnight and (b) mean of CO2 and maximum measurement depending on the type of business where the mean value (blue) and the maximum values (pink label) are shown.
Covid 03 00124 g009
Figure 10. Evolution of CO2 levels in the monitoring period (January–February 2022) in (ac) businesses with good starting air quality, (df) businesses with improvable air quality that did not implement corrective measures, and (gi) businesses with improvable air quality that implemented corrective actions. The pink dots indicate the CO2 curves of stores with poor air renewal, while the blue dots represent CO2 curves of establishments with good air renewal.
Covid 03 00124 g010
Table 1. Technical specifications of Aranet and Signos SIO2 CO2 meters.
CharacteristicsAranet 4 ProSignos (SiO2)
CO2 measurement<9999 ppm (±50 ppm)<5000 ppm (±50 ppm)
Temperature measurement0–50 °C (±0.3 °C)−60–80 °C (±0.2 °C)
Humidity measurement0–85% (±3%)0–95% (±2%)
Atmospheric pressure0.3–1.1 atm (±0.003 atm)0.3–1.1 atm (±0.003 atm)
SensorN-DIRN-DIR
Sampling frequency1 min11 min
TransmissionBluetooth (−12–4 dBm)LoRa
Dimensions/weight70 × 70 × 24 mm/104 g100 × 100 × 23 mm/170 g
Table 2. Example of the CO2 threshold determination, considering that there is an infected person and the cumulative incidence in the classroom for an Hr < 0.0064. The temperature (Ta) has been established at 22 °C, the relative humidity (RH) at 40% for all cases, and a CO2 outdoors of 400 ppm.
(a) Estimation Considering that One Occupant is Infected
FixedvariablesHypothetical VariablesCalculated Variables
Scenario 1: Teacher (Infected)Scenario 2: Student (Infected)
LocationOccupants, paxDuration minScenario∆CO2 mean -max., ppmAR, %H, h2·pax/m3Hr, h2/m3∆CO2 mean -max., ppmAR, %H, h2·pax/m3Hr, h2/m3
Classroom 1
(330 m3)
590(a) Surgical masks90–1962.80.01750.0064180–5400.90.00550.006
(b) No masks38–652.80.01740.0064180–5401.80.01100.0064
5180(a) Surgical masks38–602.80.01740.0063359–10734.40.01520.0055
(b) No masks17–262.80.01720.0064105–2734.90.01720.0063
1090(a) Surgical masks181–3932.80.03950.0064361–10810.90.01240.002
(b) No masks77–1312.80.03900.0064361–10811.80.02480.004
10180(a) Surgical masks76–1212.80.03920.0063719–21462.80.03420.0055
(b) No masks36–552.80.04020.0064294–5882.80.04000.0065
1590(a) Surgical masks272–5902.80.06140.0064542–16210.90.01930.002
(b) No masks119–2052.80.06280.0065542–16211.80.03860.004
15180(a) Surgical masks114–1812.80.06100.00641079 -32191.00.05320.0055
(b) No masks52–802.80.06000.0063241–8821.90.06230.0065
(b) Estimation Considering the Cumulative Incidence (434 Persons per 100,000 Citizens)
Fixed variablesHypothetical VariablesCalculated Variables
Scenario 1: Teacher (Infected)Scenario 2: Student (Infected)
LocationOccupants, paxDuration minScenario∆CO2 mean -max., ppmAR, %H, h2·pax/m3Hr, h2/m3∆CO2 mean -max., ppmAR, %H, h2·pax/m3Hr, h2/m3
Classroom 1
(330 m3)
590(a) Surgical masks90–1960.10.02180.0064180–5400.10.00690.0064
(b) No masks38–660.10.02180.0064180–5400.10.01370.0064
5180(a) Surgical masks38–600.10.02180.0064359–10730.10.01890.0064
(b) No masks18–270.10.03350.0064105–2730.10.02140.0063
1090(a) Surgical masks181–3930.10.04370.0064361–10810.10.01380.0002
(b) No masks77–1310.10.04280.0064361–10810.10.02750.0004
10180(a) Surgical masks76–1210.10.04330.0064719–21460.10.03790.0055
(b) No masks36–550.10.04400.0064294–5880.10.04430.0064
1590(a) Surgical masks272–5900.20.06550.0064114–1810.20.06500.0064
(b) No masks119–2010.20.06610.006554–830.20.06670.0063
15180(a) Surgical masks114–1810.20.02060.00201079–32190.20.05680.0055
(b) No masks54–830.20.04120.0040418–8200.20.06420.0063
Table 3. Determination of H, Hr and the attack rate from records during three classes in Classroom 1. Where Ta refers to temperature, and RH to relative humidity.
Known VariablesCalculated Variables
Scenario 1: Teacher (Infected)Scenario 2: Student (Infected)
LocationOccupants, paxDuration, minMean ∆CO2, ppmMax.
∆CO2, ppm
Ta, °CRH, %ScenarioAR, %H, h2·pax/m3Hr, h2/m3AR, %H, h2·pax/m3Hr, h2/m3
Classroom 1
(330 m3)
109089 ± 1815323.9 ± 0.742 ± 2(a) Surgical masks1.60.02210.00360.30.00420.0006
(b) No masks3.10.04370.00710.60.00830.0013
812076 ± 2214024.0 ± 0.844 ± 2(a) Surgical masks2.20.02360.00490.40.00450.0009
(b) No masks4.30.04670.00980.80.00890.0018
18150219 ± 52 31223.0 ± 1.343 ± 4(a) Surgical masks3.20.08510.00730.60.01620.0014
(b) No masks6.20.16820.01451.20.0320.0027
Disclaimer/Publisher’s Note: The statements, opinions and data contained in all publications are solely those of the individual author(s) and contributor(s) and not of MDPI and/or the editor(s). MDPI and/or the editor(s) disclaim responsibility for any injury to people or property resulting from any ideas, methods, instructions or products referred to in the content.

