Article

The Effect of Movement Control Order for Various Population Mobility Phases during COVID-19 in Malaysia

1
Environmental Health Research Centre, Institute for Medical Research, National Institutes of Health, Ministry of Health Malaysia, Shah Alam 40170, Malaysia
2
Special Resource Centre, Institute for Medical Research, National Institutes of Health, Ministry of Health Malaysia, Shah Alam 40170, Malaysia
3
Director’s Office, Institute for Medical Research, National Institutes of Health, Ministry of Health Malaysia, Shah Alam 40170, Malaysia
4
Surveillance Unit, Johor State Health Department, Ministry of Health Malaysia, Johor Bahru 80590, Malaysia
*
Author to whom correspondence should be addressed.
COVID 2021, 1(3), 590-601; https://doi.org/10.3390/covid1030049
Submission received: 23 September 2021 / Revised: 19 October 2021 / Accepted: 20 October 2021 / Published: 10 November 2021

Abstract

:
Background: COVID-19 was declared a pandemic by the World Health Organization on 11 March 2020. From the beginning of the pandemic, there was no effective pharmaceutical intervention to halt or hold up the spread of this novel disease. Therefore, most countries, including Malaysia, resorted to break the chain of transmission by restricting population mobility through the implementation of the Movement Control Order (MCO). We aim to determine the population mobility trend across the various phases of the MCO during the COVID-19 pandemic in Malaysia by studying the confirmed COVID-19 cases with the Google mobility data. Methodology: The average mobility percentage changes in Retail and Recreation, Grocery and Pharmacy, Parks, Transit Stations, and Workplaces were the components studied in relation to the various MCO phases and daily COVID-19 confirmed cases. The percentage difference was calculated by subtracting the average percentage changes for each MCO phases from the pre-MCO level. Additionally, the percentage difference was also calculated for inter-MCO phases as well. Results: The average mobility percentage changes reduced most drastically during the MCO phases across all the mobility components as compared to the other phases. The average mobility percentage changes in comparison to the pre-MCO levels across Retail and Recreation, Grocery and Pharmacy, Parks, Transit Stations, and Workplaces was −45.8%, −10.6%, −27.7%, −60%, and −34.3%, respectively. In addition, the average mobility percentage changes increased the most during CMCO as compared to MCO. Discussions: Malaysia implemented multiple measures to contain the COVID-19 pandemic since January 2020, culminating in the execution of the MCO. Though doubts on the effectiveness of the MCO were raised at the early stage of its implementation as mass movements persisted, strict enforcement and improved awareness of the impacts of COVID-19 brought significant improvement in compliance, which has been deemed the main reason behind the decrease in new COVID-19 cases since mid-April of 2020. Conclusion: Based on the downtrends of new and active COVID-19 cases, it can be concluded that the MCO has been effective, provided that compliance to the MCO is maintained. This study could serve to a certain degree to governments and policy makers as a tool to consider the relaxation of the lockdown conditions.

1. Introduction

The novel coronavirus disease 2019 (COVID-19) poses serious threats to many countries globally since it was first discovered in China in late December 2019. Owing to the potentially life-threatening illnesses associated with this virus, the World Health Organization (WHO) declared the COVID-19 outbreak a global pandemic on 11 March 2020 [1]. As of 22 March 2021, a total of 1238 people had died from this infection in Malaysia. The first wave of the pandemic was from 24 January 2020 to 26 February 2020 with a total of 22 cases. The second wave began on 27 February 2020 and ended on 7 September 2020 with a total of 9436 cases registered. Furthermore, the third wave of the pandemic began on 8 September 2020 and is still ongoing. As of 4 April 2021, the cumulative cases were 350,095 [2].
COVID-19 is a novel disease and there is much needing to be understood regarding the disease and its transmission. Restricting population mobility is one of the strategies to control the spreading of the disease, and is being used by many countries including Malaysia as many studies have shown the association between population mobility and COVID-19 transmission [3,4]. This is because COVID-19 spreads primarily by means of respiratory droplets, close contact, and also possibly by airborne transmission [5]. The ability of airborne pathogens to spread from person to person is closely linked to population mobility. The mobility can facilitate airborne pathogen transmission [6]. This is in line with other studies that reported on the mobility and human-to-human transmission as the effective factors in the COVID-19 transmission [7].
Methods of measuring population mobility include the transportation systems analysis, the assessment of city’s functional areas, and may involve the development of mobile applications [8,9,10]. Google, a multinational technological company that specializes in internet related services and products, provided data on population mobility for several countries including Malaysia. Google reported mobility percentage changes in Malaysia to measure the population mobility during the pandemic. Retail and Recreation, as well as Grocery and Pharmacies, are among the mobility trend components, along with Parks, Transit Stations, and Workplaces. Google mobility data provides GPS-derived indices of how visits and length of stay at different locations change over time in comparison to a pre-pandemic baseline, indicating a behavioral shift toward social restriction policies, which are becoming more prevalent. It is measured in percentage changes from normal (baseline) mobility patterns. The baseline value is made of seven individual values which represent a normal value for the day of the week. Baseline day is the median value from 3 January to 6 February 2020 [11].
Population real-time mobility data was used in a study by Kraemer in Wuhan, which indicated a rapid drop in COVID-19 spread after China implemented travel restrictions and social distancing. This proved that the control measures, among other approaches, substantially lowered the number of confirmed cases of COVID-19, because a lower number of confirmed cases were reported traveling into Wuhan a week after its lockdown intervention [12,13].
Malaysia has a series of Movement Control Orders (MCO) with varying conditions that were implemented throughout the pandemic, in general to restrict movement in breaking the chain of transmission. The different Movement Control Order phases in chronological order of implementation are detailed in Table 1.
Pre-MCO, which was characterized by localized gathering at markets and vacation locations prior to stricter enforcement during the MCO, raised the risk of COVID-19 transmission. The MCO comprised of travel restrictions, closing of non-essential sectors, not allowing events or gatherings, and many others [14]. In other words, to control the COVID-19 pandemic, the Malaysian government implemented the MCO on 18 March 2020 during the second wave. Following that, the MCO experienced more strict enforcement, with roadblocks being set up across the country and military troops being sent to help with MCO enforcement [15]. Throughout the effective period of the MCO, the official media has been important in disseminating updates on the MCO and advising all individuals nationally to stay at home, reduce needless travel, exercise personal cleanliness, and maintain social distance. During the MCO’s second and third phases, strict enforcement resulted in better compliance [16]. The full restriction order was enforced up to 3 May 2020 and then was relaxed to Conditional MCO (CMCO) on 4 May 2020 [17,18]. The movement restrictions were further relaxed to Recovery MCO (RMCO) on 10 June 2020. As the cases were found to be rising in October 2020, the government decided to have a stricter restriction of mobility, therefore the Extended CMCO was implemented from 14 October 2020 in six states, namely Penang, Selangor, Melaka, Johor, Sabah and the Federal Territory (Kuala Lumpur, Putrajaya and Labuan). Sarawak and Perlis were in Recovery MCO, meanwhile the rest were in CMCO. As the cases were found to be increasing the government implemented MCO 2.0 on 13 January 2021. To date there are limited studies on the Malaysian MCO on the effects of population mobility and the trend of COVID-19 cases. Hence, this study aims to determine the case and mobility trend across the various phases of the Movement Control Order during the COVID-19 pandemic in Malaysia.

2. Methods

2.1. Data Sources

The mobility data used in this study were collected from open-access Google Mobility accessed at https://www.google.com/covid19/mobility/ (accessed on 20 March 2021). Google collected this data by aggregating and anonymizing data from mobile phone users who have turned on “location history” voluntarily. The mobility data consisted of Retail and Recreation, as well as Pharmacy and Grocery, with Parks, Transit Stations, and Workplaces making up the rest. These data were recorded by Google from mobile devices to quantify the pandemic’s influence on the amount of movement on people’s activity. The COVID-19 case data were sourced from the Malaysian Ministry of Health at http://covid-19.moh.gov.my/ (accessed on 20 March 2021). Data was collected from 15 February 2020 until 31 December 2020.

2.2. Population Mobility

Population mobility was categorized into six main categories, namely Retail and Recreation, Grocery and Pharmacy, Parks, Transit Stations, and Workplaces. These categories represented mobility data from various subcategories which were aggregated to form an overall population movement for each category. The population mobility data was calculated as percentage of change from each corresponding baseline [11]. For example, the Retail and Recreation category consists of mobility data from the values that presented percentage changes to normal (baseline) mobility patterns. The first variable is based on the movement in Retail and Recreation. Mobility trend for the aggregated population movements within this category were restaurants, cafés, shopping centers, theme parks, museums, libraries, and cinemas. The Grocery and Pharmacy category represent mobility data from places such as groceries, food warehouses, farmer’s markets, food shops and pharmacies. In addition, the Park category accounts for population mobility data from national parks, public beaches, marinas, dog parks, plazas and public gardens. Additionally, the Transit Stations category factors in mobility data from places like public transport hubs, such as underground, bus and train stations. Finally, mobility data from places of work were categorized in the Workplace category accordingly. The percentage of change was calculated based on the changes compared to the baseline days. The baseline is the median value for the corresponding day of the week for the 5-week period from 3 January 2020 till 6 February 2020.

2.3. Descriptive Analysis

A descriptive trend analysis was carried out to explain the mobility and case trends. Range and average values were reported. In a previous study changes in mobility were determined by calculating the difference between the maximum and minimum percentage of change in each mobility component across the various MCO phases. The average values for percentage of change were calculated by dividing the sum of each day’s percentage change with the number of days for a specific MCO phase. The overall trendline function in Excel was used to observe the trend pattern. This is a novel methodology employed in this study, as compared to earlier studies which only looked at correlation analysis [19,20].

2.4. Comparative Analysis

2.4.1. Comparison with Pre-MCO Levels

Mobility percentage differences were calculated for each phase by using the average value of mobility percentage change during a specific MCO phase minus the average value of mobility percentage change during the pre-MCO divided by the average value of mobility percentage change during a specific MCO phase and converted to percentage using the formula below:
P e r c e n t a g e   d i f f e r e n c e = A v e r a g e   M o b i l i t y   P e r c e n t a g e   c h a n g e   M C O   p h a s e A v e r a g e   M o b i l i t y   P e r c e n t a g e   c h a n g e   p r e M C O   p h a s e   A v e r a g e   M o b i l i t y   P e r c e n t a g e   c h a n g e   M C O   p h a s e × 100

2.4.2. Comparison within Each MCO Levels

Mobility percentage differences were calculated for each phase by using the average value of mobility percentage change during the MCO phase minus the average value of mobility percentage change during the previous MCO divided by the average value of mobility percentage change during the MCO phase and converted to percentage using the formula below:
P e r c e n t a g e   d i f f e r e n c e = A v e r a g e   M o b i l i t y   P e r c e n t a g e   c h a n g e   M C O   p h a s e A v e r a g e   M o b i l i t y   P e r c e n t a g e   c h a n g e   p r e p r e v i o u s   M C O   p h a s e   A v e r a g e   M o b i l i t y   P e r c e n t a g e   c h a n g e   M C O   p h a s e × 100

3. Results

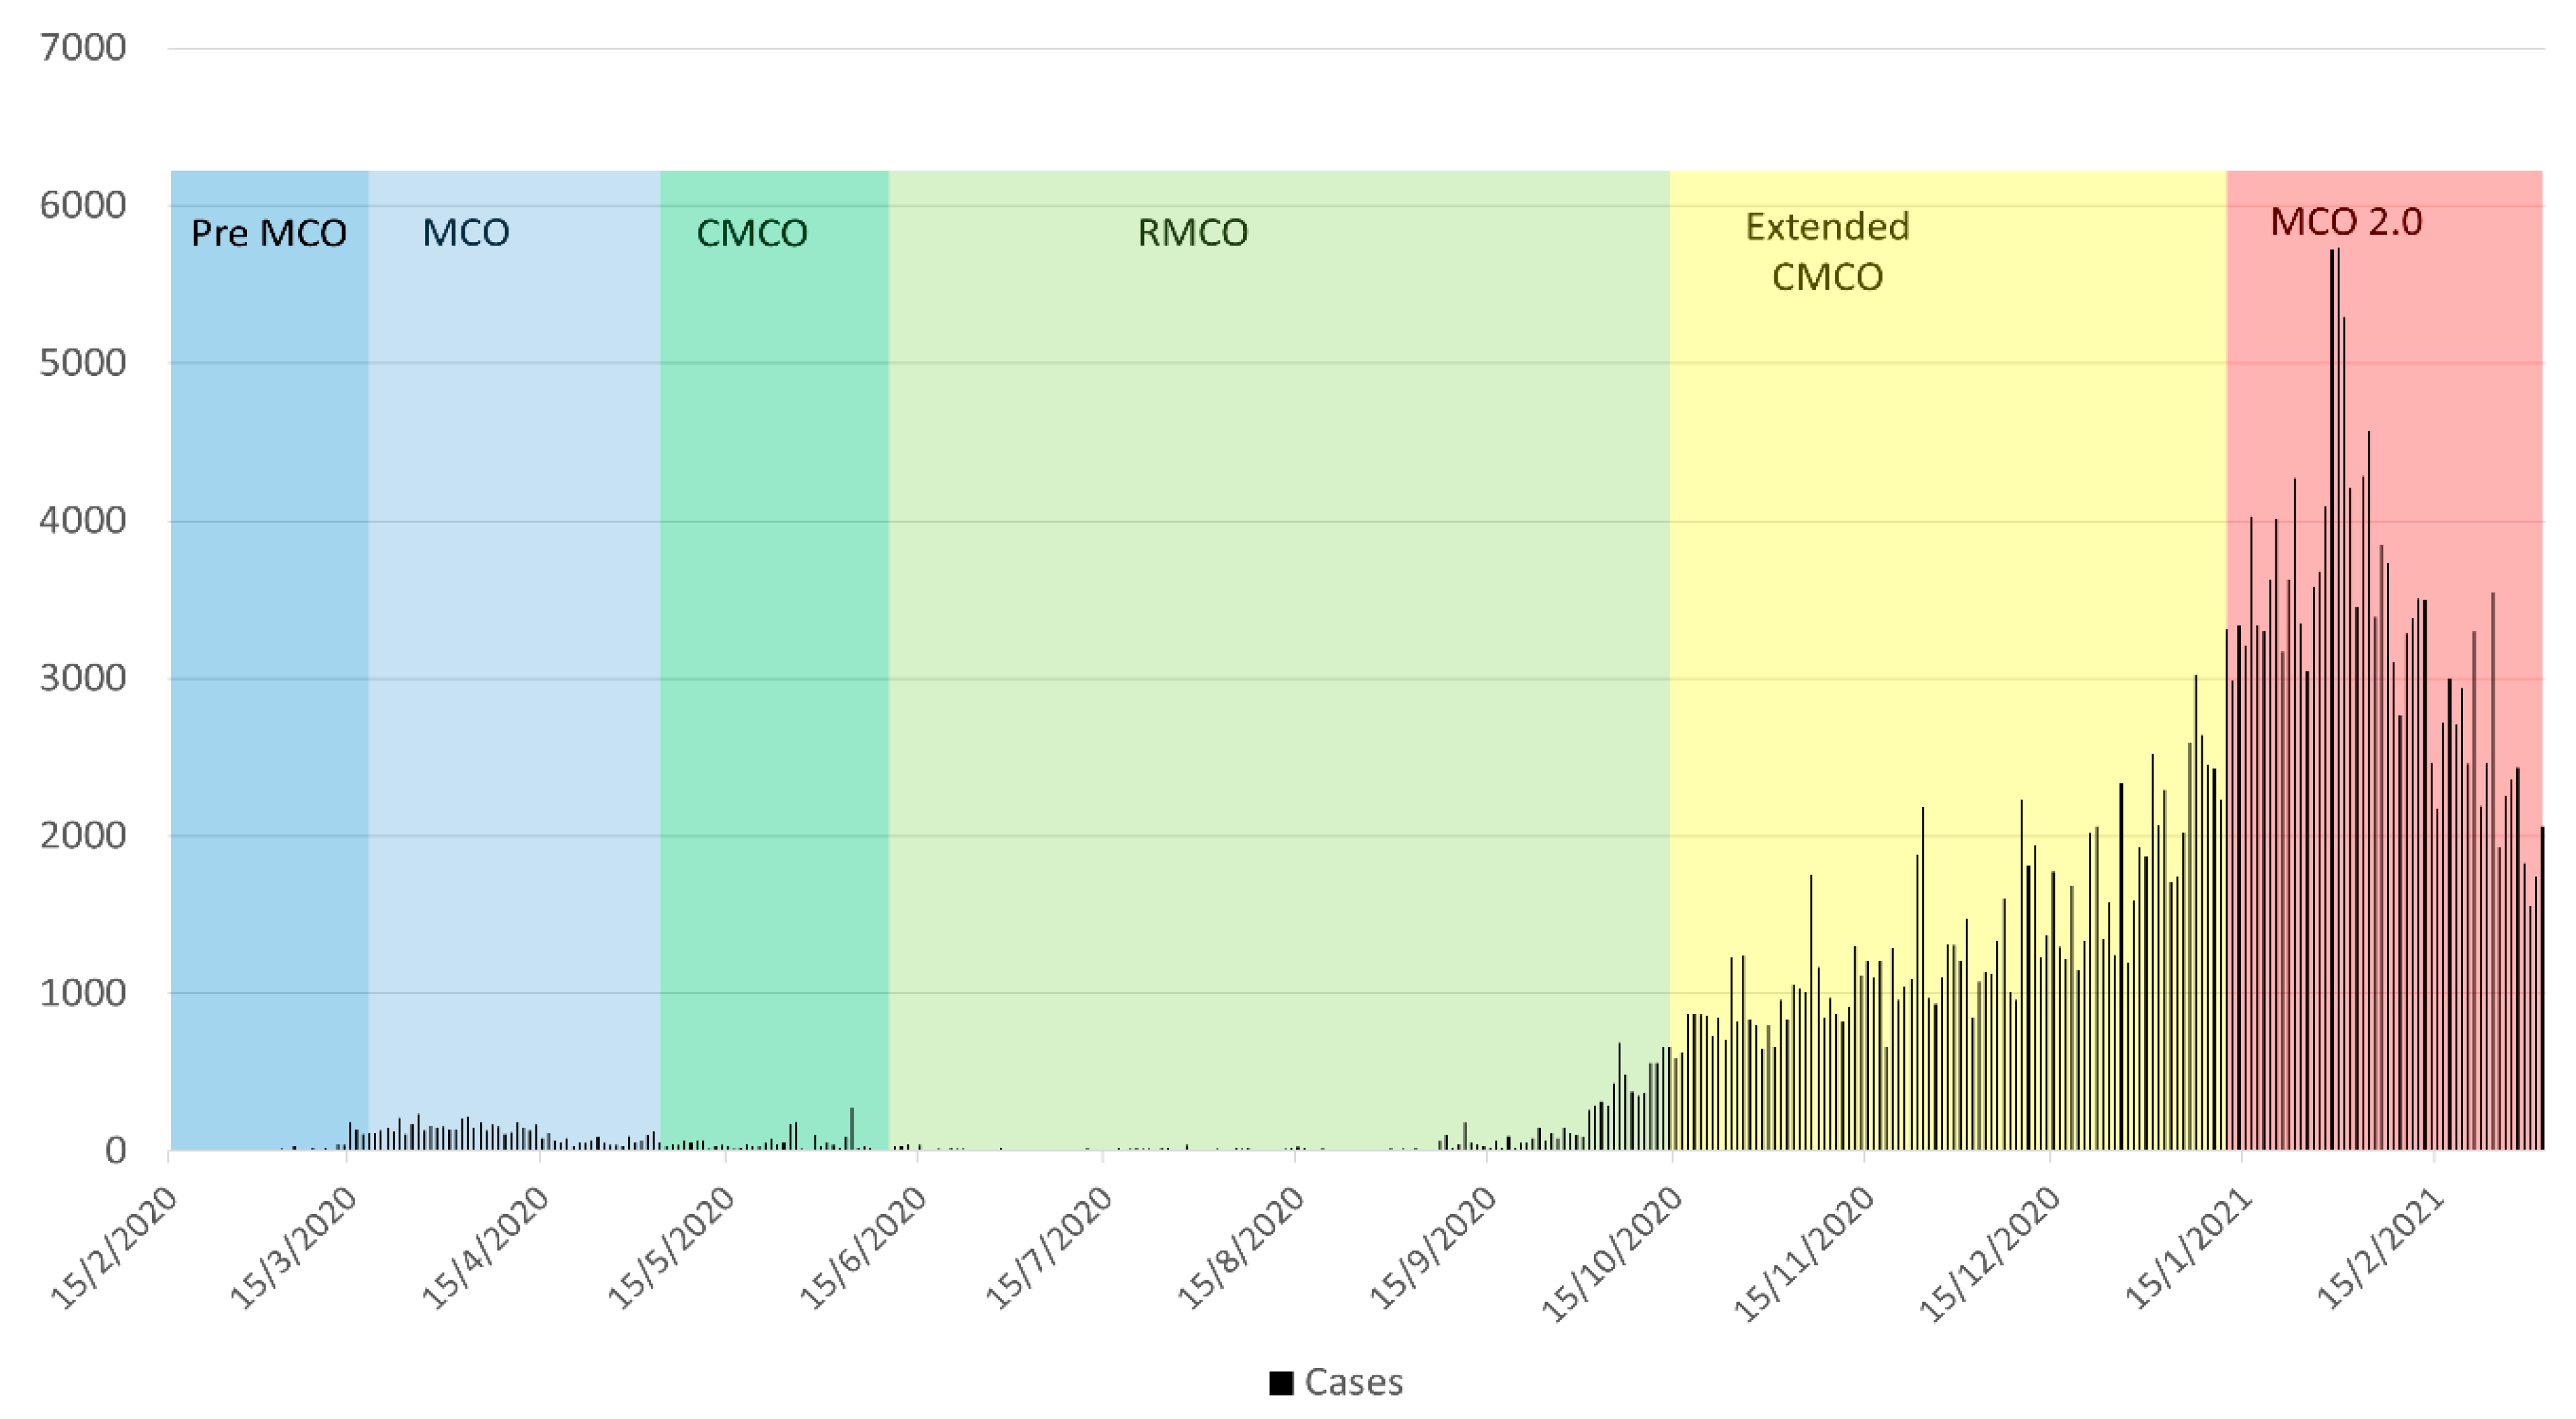
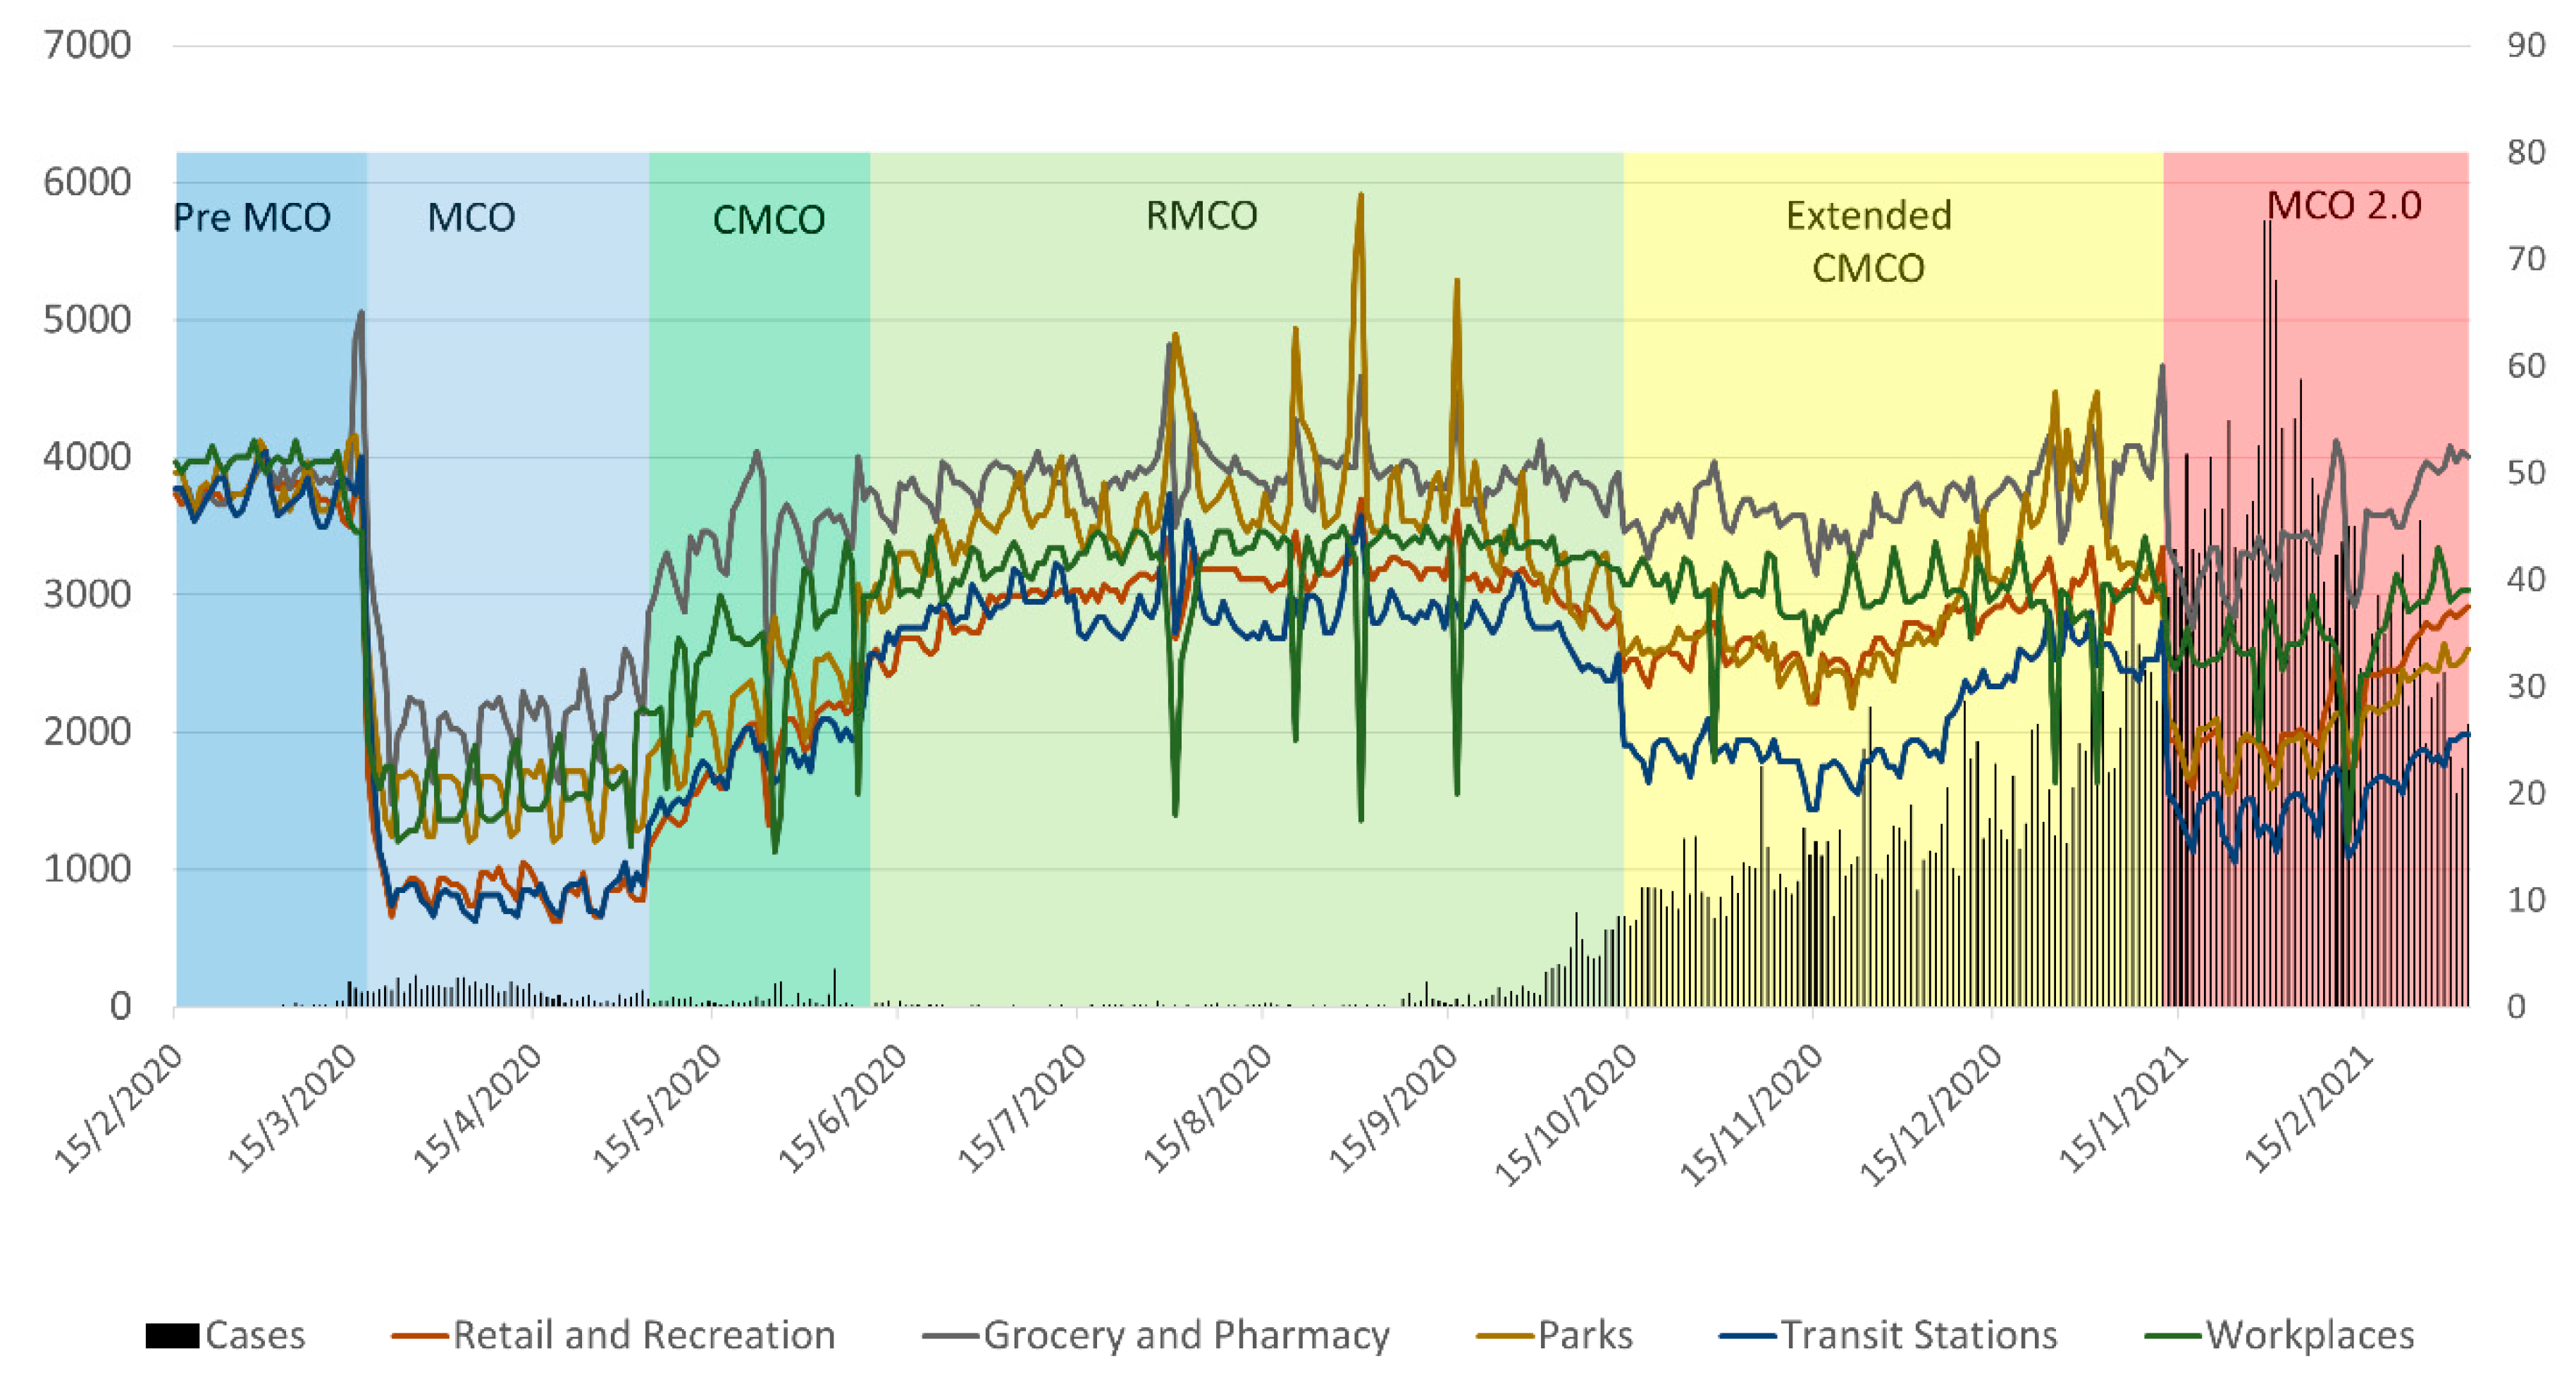
3.1. Characteristics of the COVID-19 Case Trends

The maximum number of cases during pre-MCO was 190, which was reported on 15 February 2020. Since then, there was a steady increase in the number of cases, hence the implementation of the first phase of the MCO (18 March 2020). The number of daily cases during the first MCO ranged from 31 to 235. Furthermore, towards the end of the MCO, cases reduced to double digits as seen in Figure 1. Therefore, the MCO was relaxed and CMCO was implemented. The average number of cases during CMCO was 55. In addition, during the initial phase of RMCO, cases gradually decreased until it reached only one case at one point. However, after 16 September 2020, the reported COVID-19 cases increased again until it reached 660 cases by the end of RMCO. The increasing trends resulted in the implementation of the next phase of Extended CMCO, with the reported cases ranging from 589 to 3027. The cases were also noted to be increasing despite control efforts during the MCO 2.0 with an average of 3267 cases.

3.2. MCO Effects on Average Mobility Trends—Descriptive Analysis

The average mobility percentage change across all of the components ranged from 48.0 and 50.5 during the pre-MCO phase as noted in Table 2. The highest average mobility during the pre-MCO phase was observed in the workplace component. The Grocery and Pharmacy component had the highest average mobility percentage change during the MCO phase. Furthermore, during the CMCO the average mobility percentage change increased across all of the components, with the Grocery and Pharmacy component recording the highest average mobility percentage change of 43.3. The average mobility percentage change also increased further across all of the components during the RMCO with the Grocery and Pharmacy component still recording the highest change of 49.7. In addition, the average mobility percentage trend reduced across all of the components during the Extended CMCO with the Transit Stations recording the lowest change of 27.7 as per Table 2. The trends continued to decrease across all of the components during the MCO 2.0, whereby the average mobility percentage trend in Transit Stations recorded the lowest change of 19.7 and Grocery and Pharmacy recorded the highest change of 44.5.

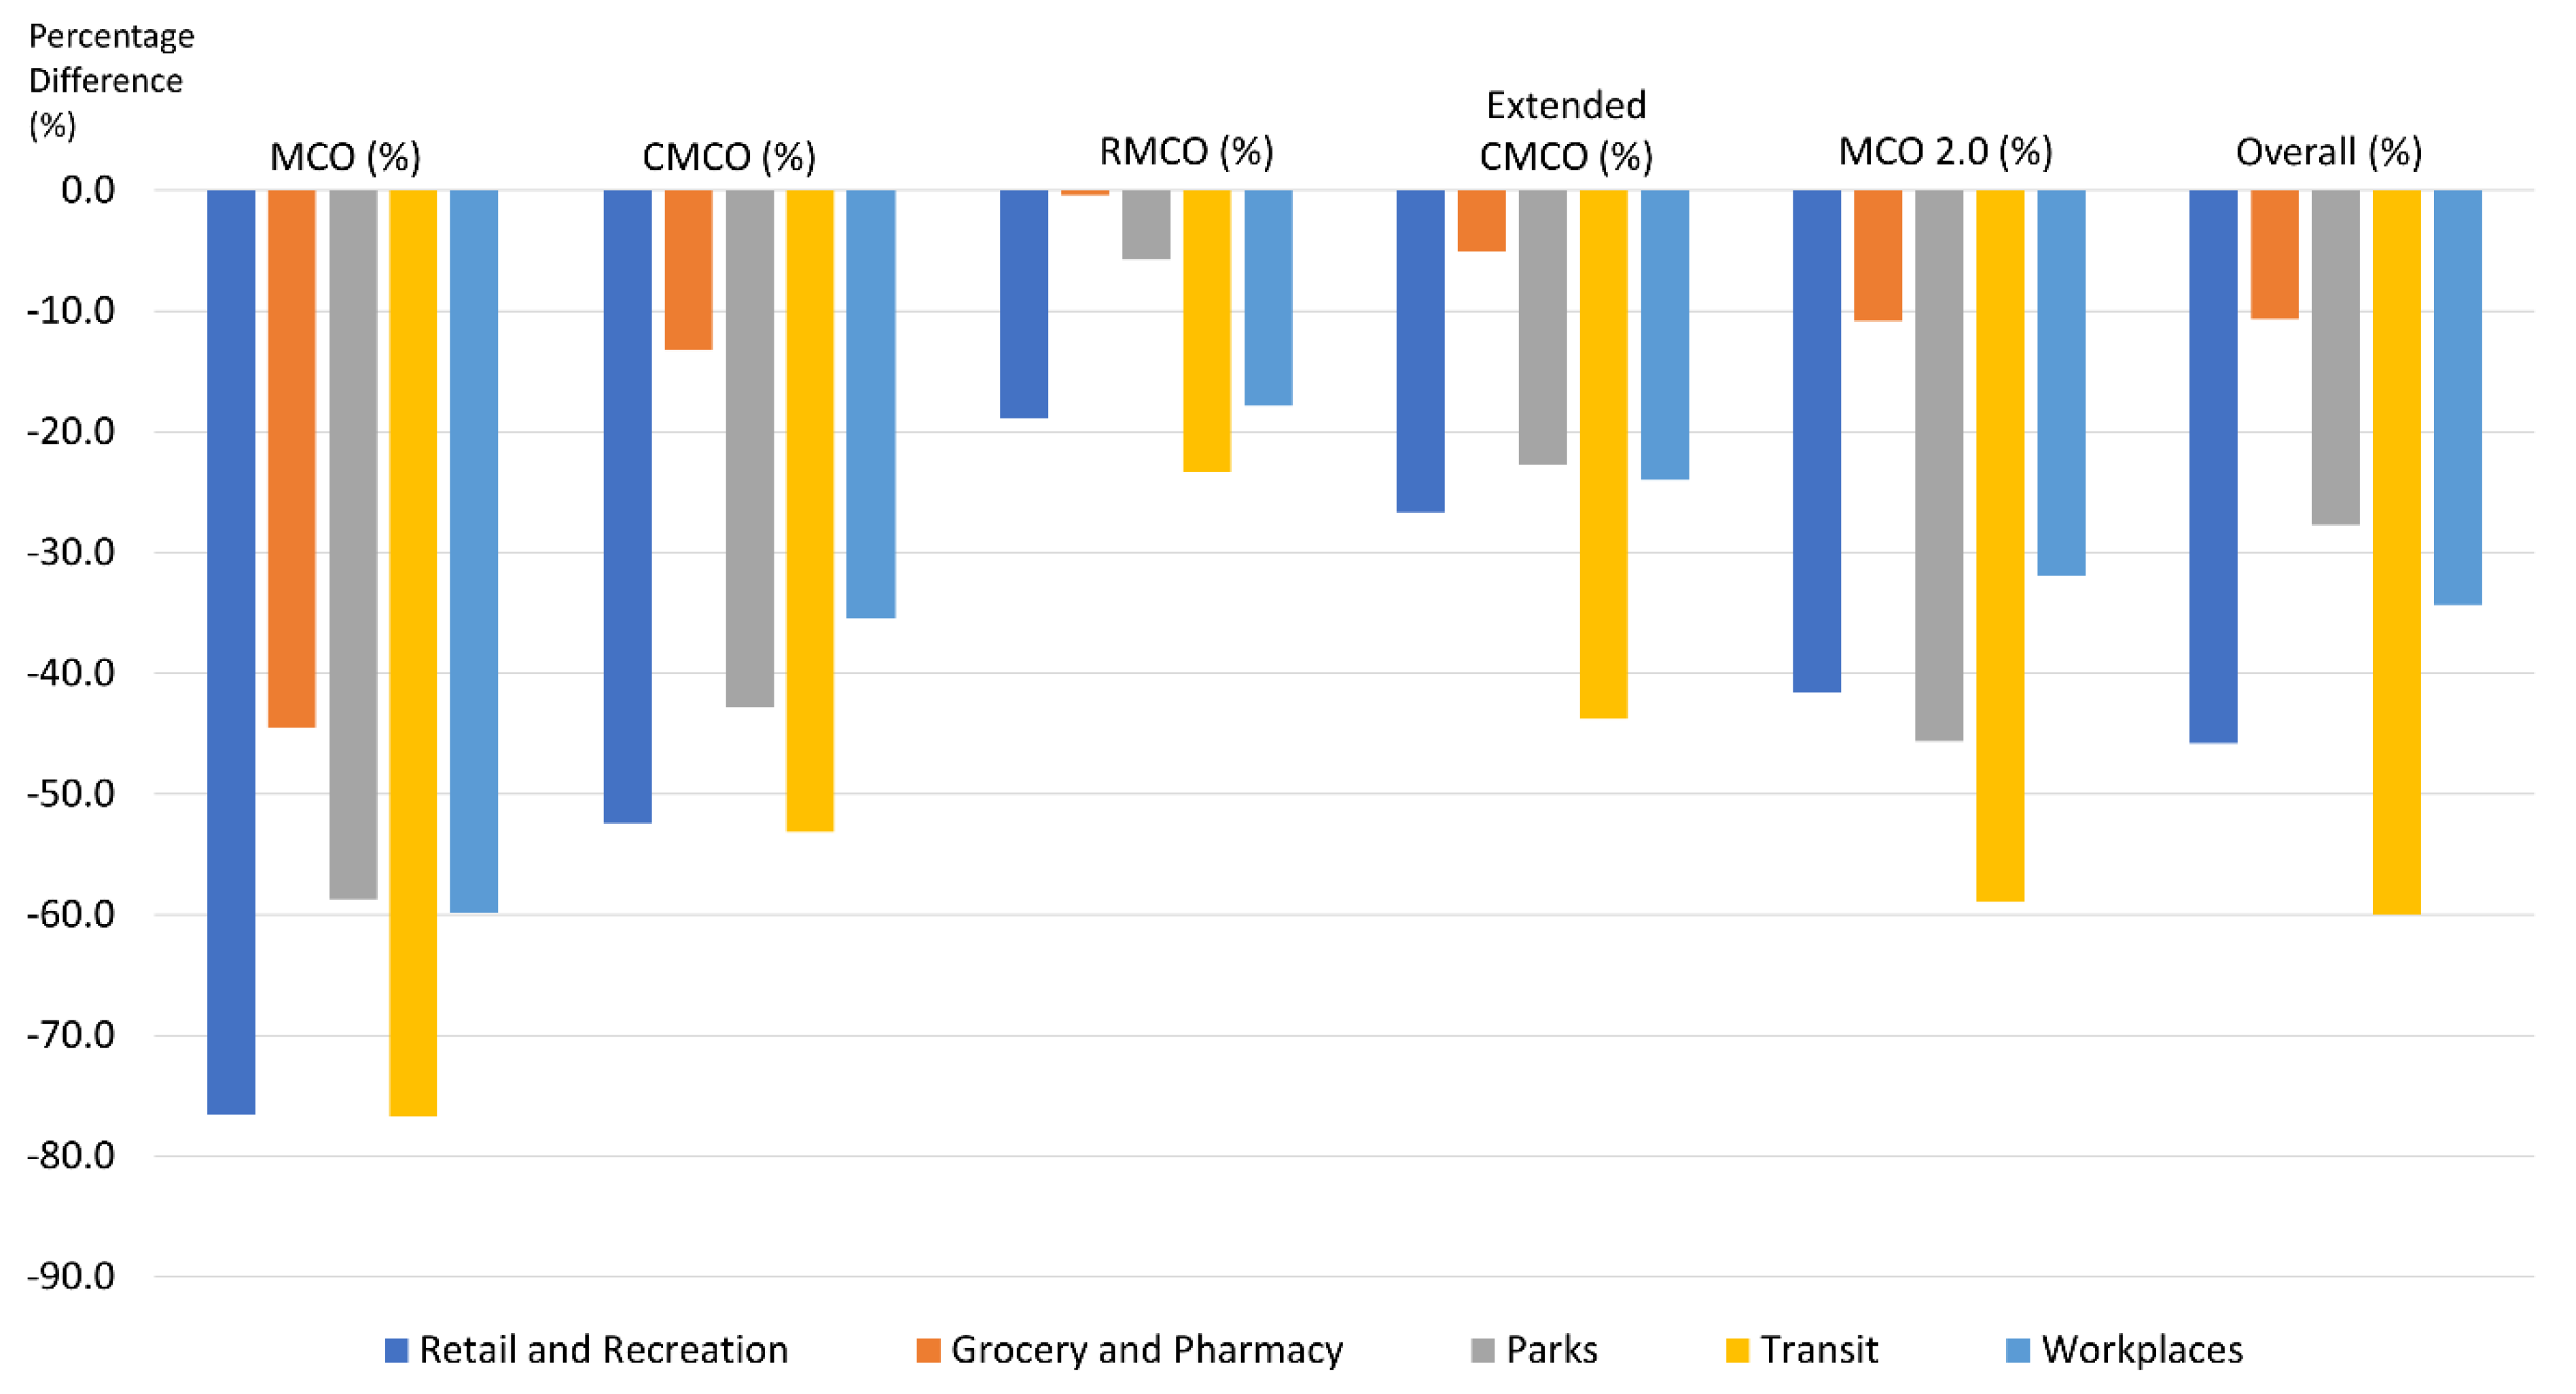
3.3. MCO Effects on Average Mobility Trends—Comparative Analysis with Pre-MCO Levels

The largest reduction of average mobility percentage was observed in the Retail and Recreation component during the MCO phase whereby there was a reduction of 76.5% in comparison to the pre-MCO phase, as seen in Figure 2. During the CMCO, the percentage difference of mobility reduced further, approaching pre-MCO levels. The Grocery and Pharmacy component reached the closest level to pre-MCO levels, whereby the percentage difference was 13.2% lower than the pre-MCO phase. The percentage difference continued to reduce during the RMCO phase in comparison to the pre-MCO phase. The mobility levels during the RMCO phase were encroaching close to the pre-MCO levels. However, the percentage difference increased again during the Extended CMCO phase compared to the pre-MCO phase. The largest percentage difference was observed in the Transit Stations during the Extended CMCO phase compared to pre-MCO levels. In addition, the Transit Stations were also observed to have the largest percentage difference during the MCO 2.0 compared to the pre-MCO phase.

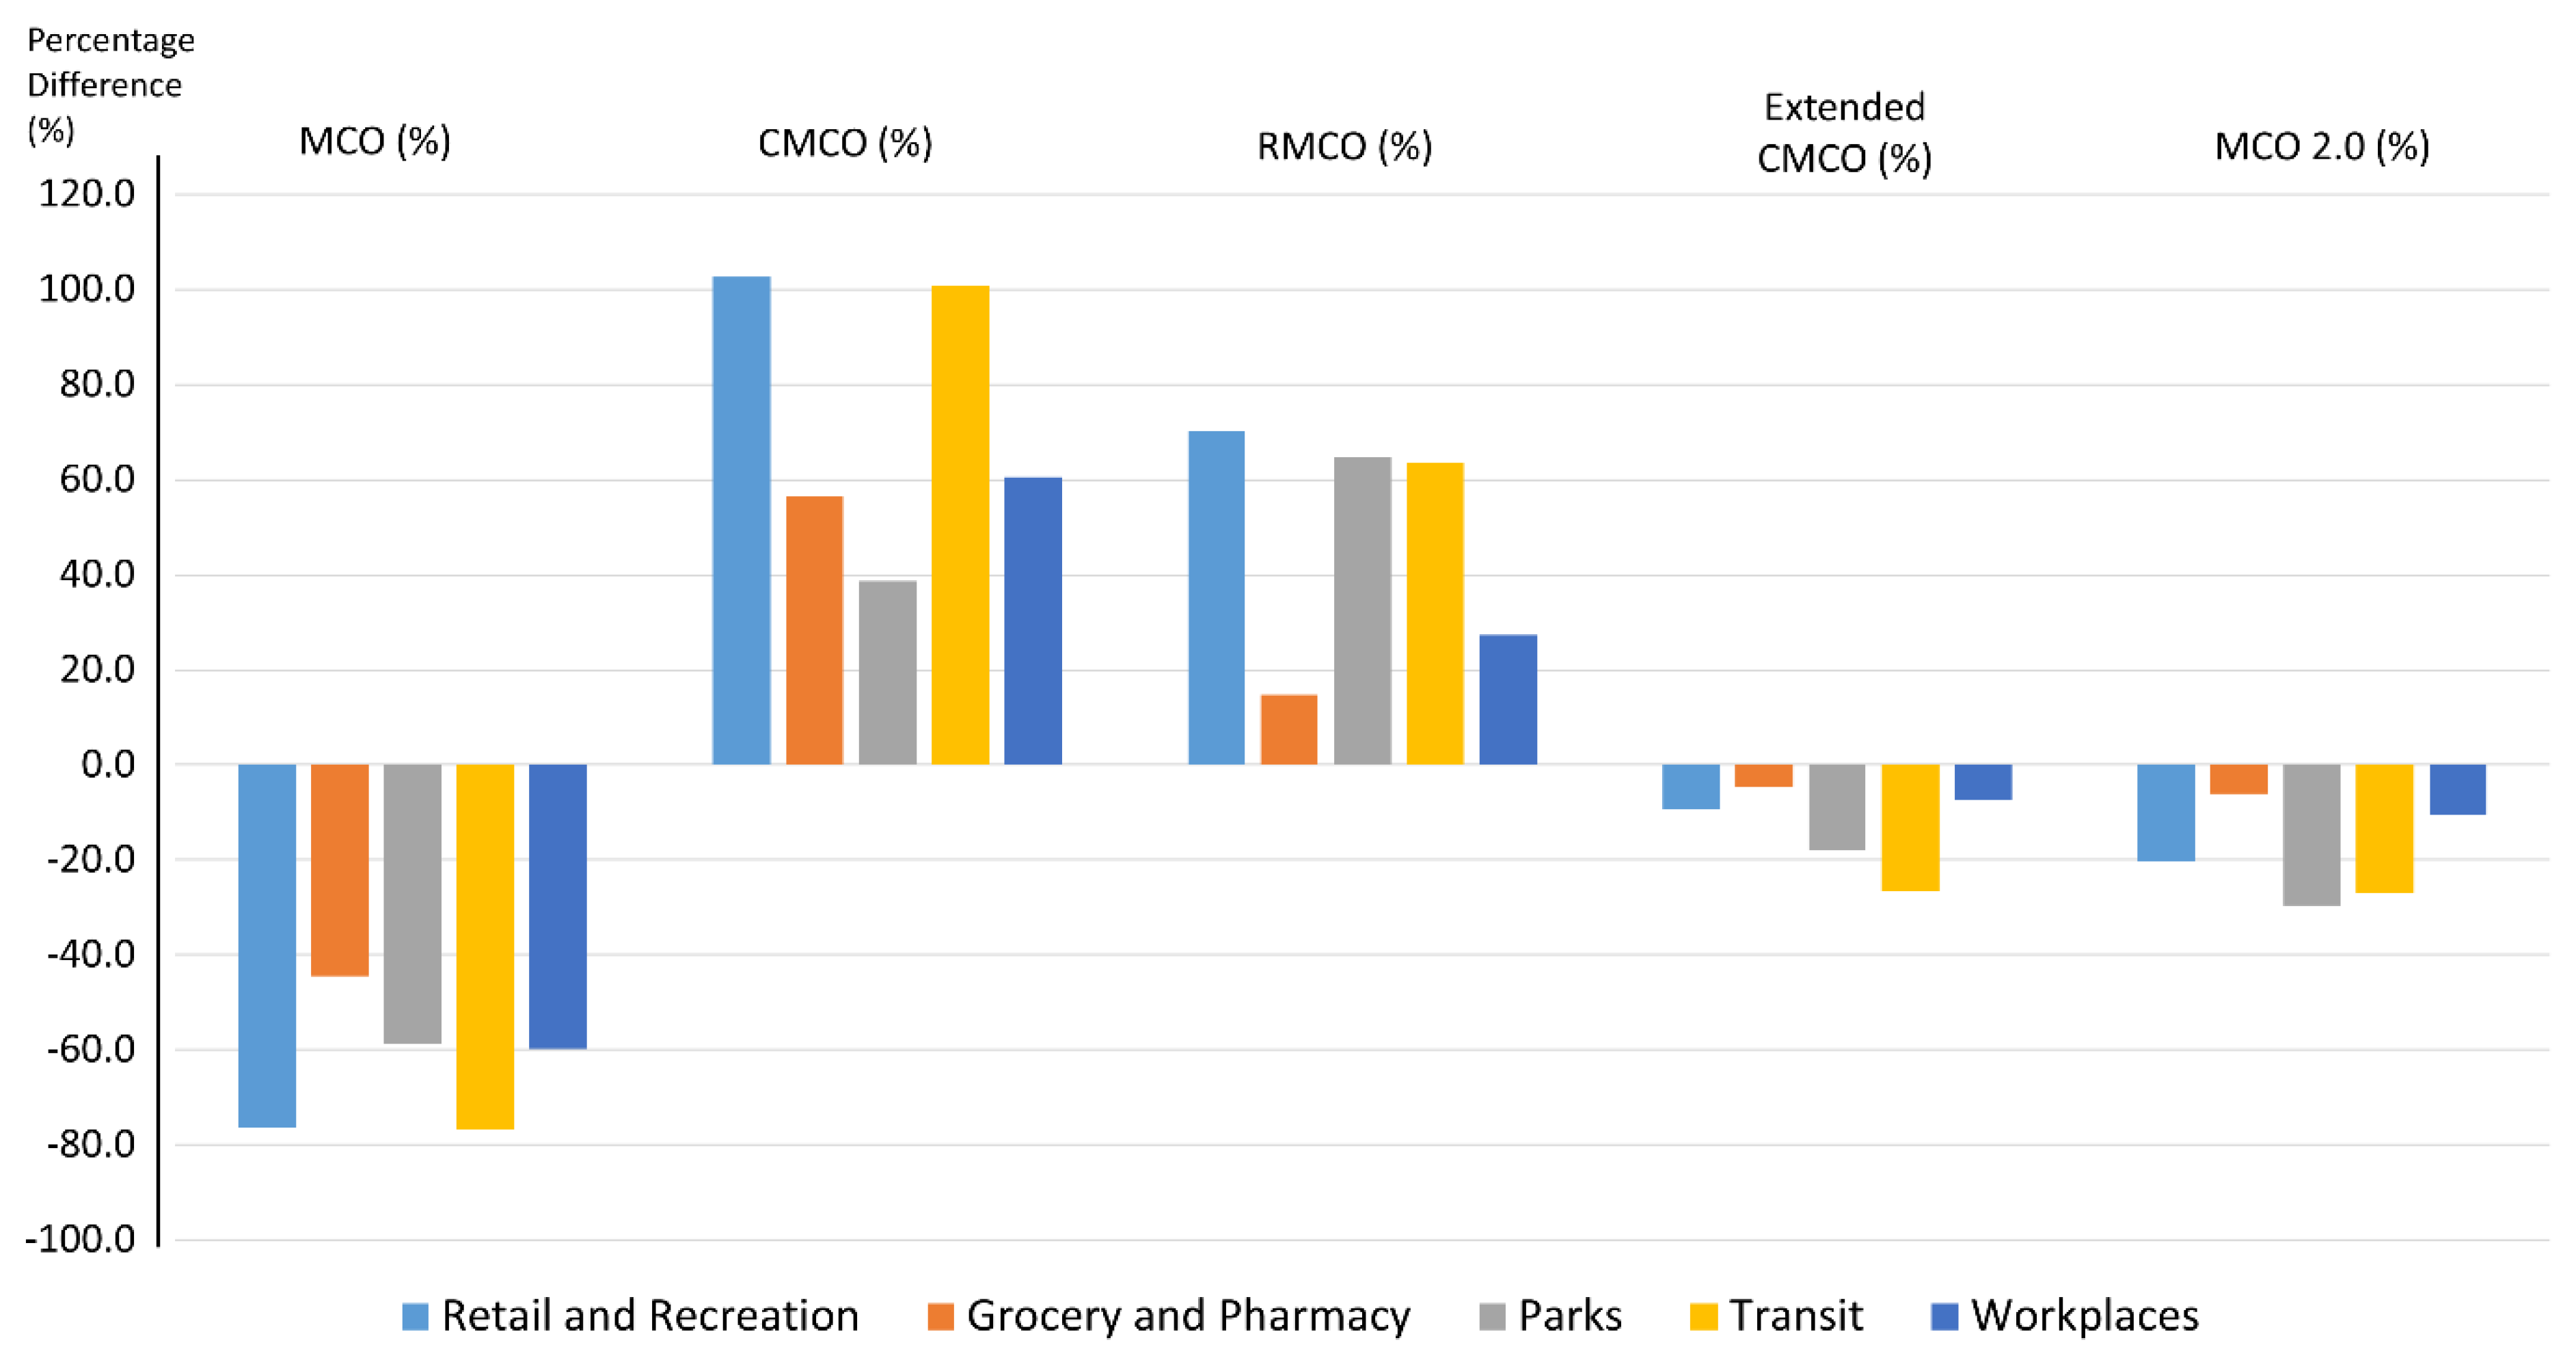
3.4. MCO Effects on Average Mobility Trends—Comparative Analysis within Each MCO Phases

Average mobility percentage for Transit Stations during the MCO phase reduced the most, by 76.7% in comparison to pre-MCO phase, as seen in Figure 3. The average mobility percentage change increased the most in the Retail and Recreation component by 102.7% during the CMCO phase compared to the MCO phase. In addition, the percentage difference of the mobility ranged from 14.8 to 70.3 across all the components in the RMCO phase compared to the CMCO phase. The Retail and Recreation component recorded the highest percentage difference of 70.3 during the RMCO phase compared to the CMCO phase. However, the mobility levels reduced during the Extended CMCO phase compared to the RMCO levels. The largest percentage difference was observed in the Transit Stations during the Extended CMCO phase compared to the RMCO phase. In addition, there were further reductions of mobility across all of the components during the MCO 2.0 compared to the Extended CMCO phase. The Parks component was observed to have the largest percentage difference during the MCO 2.0 compared to the Extended CMCO phase.

3.5. Case Trends and the Average Mobility Percentage Change during the MCO Phases

As noted in Figure 4, during the initial phase of MCO, mobility in Retail and Recreation was following the case trend. However, after 13 April 2020, the trend of mobility in Retail and Recreation remained fairly the same as their initial trend but not in accordance with the case trend, which was decreasing. Despite having stagnation of Retail and Recreation mobility trend at the end of the phase, the case number continued to rise. Meanwhile, in the Grocery and Pharmacy category, the mobility pattern remained unchanged at the same level, averaging at 55 points. As of 22 April 2020, the mobility point remained on the same level; however, the case number continued to rise despite the initial decreasing trends. For the Parks category, the mobility point remained at a stagnant trend. In addition to that, the Transit Stations category also observed the same pattern despite minimal mobility point changes seen. Workplace, which is the last category, observed reducing mobility trends since 29 April 2020, whereas the case numbers were noted to be rising. In summary, the initial Retail and Recreation mobility trend was in accordance with case trends, however the other component mobility trends were not able to explain the case trends.
Malaysia then moved on to the CMCO period after MCO by cautiously opening some of the sectors that previously were closed. The Retail and Recreation sector mobility points remained fairly the same throughout this period. However, the cases continued to rise despite the mobility trend remaining static. The Grocery and Pharmacy were the highest component of mobility percentage change due to the daily requirements of people. Furthermore, towards the end of CMCO the Grocery and Pharmacy trend started to plateau, not in accordance with the case trends. In addition to that, the Parks category mobility remained relatively unchanged during the CMCO period.
The cases remained at low levels even though the mobility percentage change was increasing in all the components during the initial period of the RMCO. However, it was noted after 7 September 2020 that cases were increasing in accordance with average mobility percentage change trends of all the components. Furthermore, the cases continued to increase despite that there was a reduction in the average mobility percentage change of all the components during the extended CMCO phase. Furthermore, the average mobility percentage change also showed a decreasing trend across the components during the MCO 2.0 except for Parks and Transit, which remained at static low levels. In contrast, despite that the average mobility percentage change continued to decrease for all of the components, the cases continued to increase, reaching a maximum of 5728 on 31 January 2021, whereby after which the cases were decreasing in numbers.

4. Discussion

We looked at the results of the COVID-19 and Google mobility studies to generate information regarding social restriction measures and COVID-19 in Malaysia and on how they relate to human sociological population movement. During the first MCO with strict movement restrictions, there was a considerable decrease in human mobility coupled with a rapid fall in COVID-19 prevalence due to increasingly effective social restrictions by the Malaysian government. It is entirely possible that the relationship between virus spread in the initial stages with movement restrictions caused a drastic decrease in the growth rates of the cases [13]. People found it was easier to move around by May 2020 as the restrictions were relaxed across the various MCOs. In addition, the overall mobility was still limited after the countrywide restrictions were relaxed; however, the state did not return to pre-pandemic level. Furthermore, this was also observed in other countries such as the United States and South Korea, even though there was some form of freedom in the mobility [13].
The movement restriction interventions had large differences in the various mobilities. The subsequent trends of mobility were more random, instead of showing only highly positive results as during the initial lockdown. The Grocery, Pharmacy and Transit Stations mobility were predominant as these places were allowed to operate over the various phases of the MCOs. In addition to that, places such as Retail and Recreation were low as many people tended to stay at home and away from those areas. Mobilities among the workplace component were also low as most people tended to work from home during the various phases of the MCOs. A similar finding was found in a study by Lina in Hong Kong whereby people commuted less and tended to work from home during the COVID-19 pandemic [21]. The variability of the relation of mobility to COVID-19 case trends across the various phases of the MCO shows that there are other forms of preventative behaviors and perceptions, whether voluntary or government enforced [22]. While social distancing policies can have a direct effect on mobility, there are also influences of indirect impact due to change in people’s lifestyle practices such as mask wearing, regular washing of hands and other measures which had the ability to delay viral spread [3,14].
Furthermore, despite the movement relaxation during the RMCO period, it was noted that starting October 2020, most components of the mobility were reducing in trend. During this period, it was also seen that the reported daily cases were increasing. The surge of COVID-19 cases was possibly due to certain events, such as interstate movement during a state election and detention center cluster [23,24]. Subsequently, it was observed that the mobility was reduced even though the restrictions were relaxed. These could be related with the government’s effort in providing COVID-19 risk communication that helped in increasing the awareness of the importance of reducing mobility [24]. Hence, the voluntary movement restriction caused the mobility percentage changes to reduce in all components.
Nevertheless, the cases then showed an increasing trend and further increased even though the mobilities restrictions were more restricted during the Extended CMCO and MCO 2.0 phases. This was also partially due to the increase in the rate of the COVID-19 testing [24]. This caused increased detection of the cases which may have previously been in the community but were not tested for. In addition to that, people were still conducting interstate travel during the Extended CMCO and MCO 2.0, probably due to business and occupational reasons. There was also increased mobility especially during the festive seasons. Furthermore, although the government has been providing good risk communication by avoiding panic among the people, the compliance at the individual and industry levels were at question. A full-fledged strict adherence to the SOPs set by the government was not attained. This was observed as Workplace clusters especially in factories increased during the MCO 2.0.
However, the restriction in mobility during the various phases did not seem to have the expected impact, especially after the first MCO. This could be attributed to many factors. Nevertheless, we are still in the midst of the COVID-19 pandemic. People should be constantly reminded to follow the SOPs, such as to maintain physical distance, wear a facemask, regularly wash their hands, and others. We should also look into the change of attitude, not looking out for oneself but for the nation’s prosperity [25]. We should step in as a nation for the betterment and accomplishment of overcoming this pandemic in the country together.
In addition, this study is an initial attempt to determine the relationship between social mobility and the case trends in Malaysia. However, this study was limited to the availability of open-source data which can be addressed by standardizing the data to each country to avoid this bias. Secondly, the delay between the date of the real-time mobility measurement by Google data and the reported date of confirmed cases can lead to biases which needs to be addressed with caution. In addition to that, causal relationships between mobility control and disease spread could not be ascertained.

5. Conclusions

The study findings show the importance of adherence to the Movement Control Orders. However, there were varying conditions in the different MCO phases and with the strict conditions imposed on the first MCO, there was a good reduction of COVID-19 cases. The consecutive phases had less strict conditions with the need to balance between movement restriction and to allow economic and social interactions, as people chose to be more mobile during the relaxation and vice versa.
It is clear to all that mobility systems have been drastically affected by the COVID-19 pandemic. As a result of MCOs, social distancing and hygiene requirements, demand for personal mobility has plummeted, while operational complexity has increased. Concurrently, demand for e-commerce and doorstep delivery has exploded. As we write, many states and towns in Malaysia are gradually reopening after the MCO, but the duration and trajectory of the recovery is still uncertain. As well as a major economic downturn, most observers agree that at least some of the changes in behaviors we have seen during the crisis will endure in the medium- to long-term [25].
Diseases shape cities. Malaysia may need to adopt appropriate strategic responses for mobility policy makers and service providers in the post-COVID-19 era in which opportunities exist to leverage the disruption caused by COVID-19 to make steps to move toward goals of more sustainable, resilient and human-centric mobility systems. Among the key stakeholders that can have the greatest impact are the city governments and transport authorities. For those authorities that are committed to effecting significant change, two broad types of action can be undertaken, which are framing or regulating the mobility system and its components, and enabling other mobility system players.
Framing involves urban space reallocation, mobility mode planning, “new mobility” re-regulation, new data regulation, and new enforcement measures. By enabling other mobility system players, new governance arrangements for better collaboration across the system, reassessment of investments in mobility infrastructure (e.g., favoring lower-cost and healthier mobility modes), accelerated investment in digital infrastructure for mobility-based services, new mobility demand management measures (e.g., promoting e-bikes/scooters, shared mobility, peak flattening), and collaborative innovation platforms can be obtained.
Based on our empirical results, we do propose the following directions of policies to enhance the mobility management under the COVID-19 era in Malaysia. Digital infrastructure such as Mobility-as-a-Service (MaaS) can be adopted by Malaysia. MaaS can contribute to increased system resilience through providing more choice of mobility options and ease of use. Trust can also be rebuilt by providing real-time multimodal information. MaaS certainly has the potential to positively influence mobility patterns and behaviors in a way that will align much better with the uncertain post-COVID-19 environment. The development of MaaS business offerings could be an accelerator for further penetration, as the openness of companies to adopt flexible working hours and engage with transit operators has been increased as a result of COVID-19 [22].
One of the most important policy changes now available, in contrast to pre-COVID- 19, is the effectiveness and growing acceptance of Work from Home (WFH). Even Malaysia may face the possibility of a noticeable shift to WFH and consequent changes in commuting (and non-commuting) travel demand. WFH will be encouraged, as offices are required to practice social distancing and hence have to stagger working hours for staff, including the possibility of less days in the main office balanced with WFH. Many sectors already support WFH pre-COVID-19, such as the technology sector. WFH is a new norm which can be used to benefit the transport network. In summary, we do not want to return to where we have excessive road congestion and public transport crowding. The benefits may well outweigh the additional costs to society of a return to congestion and crowding.
A robust, secure and transparent data infrastructure under an integrated mobility management system would be required to handle real-time mobility-related data, involving privately- or publicly-operated systems. Mobility solution providers have faced collapsing demand with increased operating costs during the crisis. By adopting short-term cost cutting measures and improvements to staff and asset productivity, Malaysia can encourage mobility service providers to improve on their overall customer experience to support regaining trust, and to drive customer preferences and loyalty.
New agile crisis management processes, new technologies for contactless accessibility, passenger identification and tracing, flexible staff schedules and tasks, new cleaning and sanitation approaches, asset repurposing and accelerated digitalization can be some measures taken by Malaysia to adapt to post-COVID-19 scenarios. It is also pertinent to evolve and establish crisis management approaches to better anticipate future risks and improvement of operational resilience. Artificial intelligence and machine learning methods can be supporting technological tools for crisis management to develop rapid-response schemes and ultimately foster healthy business continuity plans.
We hope this study can serve to a certain degree as a tool for governments and policy makers in Malaysia to consider the relaxation of or more stringent lockdown conditions, as critical insights and recommendations have been proposed here for future policy decisions.

Author Contributions

Conceptualization, B.M.S., K.R. and N.A.; methodology, K.R., B.M.S., S.S.; software, Microsoft Excel 2019; validation, L.-C.H.; formal analysis, K.R., B.M.S., N.A., L.-C.H.; investigation L.-C.H.; resources, B.M.S., K.R. and N.A.; data curation L.-C.H.; writing—original draft preparation K.R., B.M.S. and N.A.; writing—review and editing, K.R., R.I., R.S., B.M.S.; visualization, L.-C.H.; supervision, T.A.; project administration, K.R.; funding acquisition, T.A. All authors have read and agreed to the published version of the manuscript.

Funding

This research received no external funding.

Institutional Review Board Statement

Not applicable.

Informed Consent Statement

Not applicable.

Data Availability Statement

Not applicable.

Acknowledgments

We would like to thank the Director General of Health Malaysia for his permission to publish this paper and the Director of the Institute for Medical Research for all the support given towards this paper.

Conflicts of Interest

The authors declare that they have no competing interests.

References

  1. Cucinotta, D.; Vanelli, M. WHO Declares COVID-19 a Pandemic. Acta Biomed. 2020, 91, 157–160. [Google Scholar] [CrossRef] [PubMed]
  2. Ministry of Health Malaysia. MOH. 2021. Available online: https://www.moh.gov.my/ (accessed on 27 January 2021).
  3. Bergman, N.K.; Fishman, R.; Mobility Levels and COVID-19 Transmission Rates. MedRxiv. 2020. Available online: https://www.medrxiv.org/content/10.1101/2020.05.06.20093039v2.full.pdf (accessed on 10 March 2021).
  4. Cartenì, A.; Di Francesco, L.; Martino, M. How mobility habits influenced the spread of the COVID-19 pandemic: Results from the Italian case study. Sci. Total Environ. 2020, 741, 140489. [Google Scholar] [CrossRef] [PubMed]
  5. CDC. How 2019-nCoV Spreads. 2020. Available online: https://www.cdc.gov/%0Acoronavirus/2019-ncov/about/transmission.html (accessed on 10 March 2021).
  6. Hao, C.; Zou, X.; Lv, G.; McLaughlin, M.; Li, X.; Ling, L. The influence of migration on the burden of and response to infectious disease threats in China: A theoretically informed review. J. Public Adm. 2014, 4, 4–28. [Google Scholar]
  7. Phan, L.; Nguyen, T.; Luong, Q.; Nguyen, T.; Nguyen, H.; Le, H.; Nguyen, T.; Cao, T.; Pham, Q.D. Importation and Human-to-Human Transmission of a Novel Coronavirus in Vietnam. N. Engl. J. Med. 2020, 382, 872–874. [Google Scholar] [CrossRef] [PubMed] [Green Version]
  8. Wang, P.; Hunter, T.; Bayen, A.M.; Schechtner, K.; González, M.C. Understanding road usage patterns in urban areas. Sci. Rep. 2013, 2, 1–6. [Google Scholar] [CrossRef] [PubMed] [Green Version]
  9. Zhang, D.; Huang, J.; Li, Y.; Zhang, F.; Xu, C.; He, T. Exploring human mobility with multi-source data at extremely large metropolitanscales. ACM 2014, 201–212. [Google Scholar]
  10. Yuan, J.; Zheng, Y.; Xie, X. Discovering regions of different functions in a city using human mobility and pois. In Proceedings of the 12th ACM SIGKDD International Conference on Knowledge Discoveryand Data Mining, Beijing, China, 12–16 August 2012. [Google Scholar]
  11. Google LLC. Google COVID-19 Community Mobility Reports. 2020. Available online: https://www.google.com/%0Acovid19/mobility/ (accessed on 5 February 2021).
  12. Kraemer, M.; Yang, C.-H.; Gutierrez, B.; Wu, C.-H.; Klein, B.; Pigott, D. The effect of human mobility and control measures on the COVID-19 epidemic. China Sci. 2020, 368, 493–497. [Google Scholar] [CrossRef] [PubMed] [Green Version]
  13. Pan, A.; Liu, L.; Wang, C.; Guo, H.; Hao, X.; Wang, Q. Association of public health interventions with the epidemiology of the COVID-19 outbreak in Wuhan, China. JAMA: J. Am. Med. Assoc. 2020, 323, 1915–1923. [Google Scholar] [CrossRef] [PubMed] [Green Version]
  14. Institute for Health Systems Research, Ministry of Health Malaysia. Malaysia Health Sector Response to COVID-19 Pandemic, 1st ed.; Institute for Health Systems Research, Ministry of Health Malaysia: Putrajaya, Malaysia, 2020. Available online: http://library.nih.gov.my/e-doc/Flip-Book/Malaysian-Health-Sector-Response-to-COVID-19-Pandemic/index.html (accessed on 10 March 2021).
  15. Bernama. MCO: Travel Now Restricted to 10-km Radius. 2020. Available online: https://www.bernama.com/en/general/news.php?id=1827627 (accessed on 1 October 2021).
  16. Zolkepli, F.; Sivanandam, H. MCO Compliance at 97% but 482 Arrests over 26–27 March 2020. Available online: https://www.thestar.com.my/news/nation/2020/03/28/mco-compliance-at-97-but-482-arrests-over-march-26-27 (accessed on 10 March 2021).
  17. Disease Control Division Malaysia. Responding to COVID-19 Pandemic [Powerpoint Slides]; Disease Control Division Malaysia: Kuala Lumpur, Malaysia, 2020. [Google Scholar]
  18. World Health Organization. Current Situation and Key Insights. 27 December 2020. Available online: https://www.who.int/docs/default-source/coronaviruse/covid-strategy-update-14april2020.pdf (accessed on 10 March 2021).
  19. Kurian, S.J.; Bhatti, A.; Alvi, M.A.; Ting, H.H.; Storlie, C.; Wilson, P.M.; Shah, N.D.; Liu, H.; Bydon, M. Correlations Between COVID-19 Cases and Google Trends Data in the United States: A State-by-State Analysis. Mayo Clin. Proc. 2020, 95, 2370–2381. [Google Scholar] [CrossRef] [PubMed]
  20. Rovetta, A. Reliability of Google Trends: Analysis of the Limits and Potential of Web Infoveillance during COVID-19 Pandemic and for Future Research. Front. Res. Metr. Anal. 2021, 6, 670226. [Google Scholar] [CrossRef] [PubMed]
  21. Vyas, L.; Nantapong, B. The impact of working from home during COVID-19 on work and life domains: An exploratory study on Hong Kong. Policy Des. Pract. 2020, 4, 59–76. [Google Scholar] [CrossRef]
  22. Siqin, W.; Yan, L.; Tao, H. Examining the Change of Human Mobility Adherent to Social Restriction Policies and Its Effect on COVID-19 Cases in Australia. Int. J. Environ. Res. Public Health 2020, 17, 7930. [Google Scholar] [CrossRef]
  23. Tashny, S. Coronavirus Malaysia: PM Blames Sabah Election as among Causes of Huge Infection Surge; The Coronavirus Pandemic. 2020. Available online: https://www.scmp.com/week-asia/health-environment/article/3104421/coronavirus-malaysia-pm-blames-sabah-election-among (accessed on 18 March 2021).
  24. Rampal, L.; Liew, B.S. Malaysia’s third COVID-19 wave—A paradigm shift required. Med. J. Malays. 2021, 76, 1–4. [Google Scholar]
  25. UITP. The Future of Mobility Post-COVID. Available online: https://cms.uitp.org/wp/wp-content/uploads/2020/10/2020-ADL-FoM-Lab-UITP_Future-of-Mobility-post-COVID-study.pdf (accessed on 20 September 2021).
Figure 1. Trends of COVID-19 cases in Malaysia.
Covid 01 00049 g001
Figure 2. Percentage difference of mobility components of all phases in comparison with pre-MCO phase in Malaysia–categorized by the MCO phases.
Covid 01 00049 g002
Figure 3. Percentage difference of mobility components of all MCO phases in comparison with the previous phases in Malaysia–categorized by the MCO phases.
Covid 01 00049 g003
Figure 4. Case trends and the average mobility percentage change during the MCO phases in Malaysia.
Covid 01 00049 g004
Table 1. Characteristics of different phases of the MCO (Source: Institute for Health Systems Research Ministry of Health Malaysia, 2020; MOH, 2020).
PhasesDates of EnforcementCharacteristics
Pre-MCOPrior to 18 March 2020
  • Pre-pandemic state
  • All sectors were fully operational
  • No restriction in movements
MCO18 March2020–3 May2020
  • Full lockdown state
  • All sectors were non-operational except for the important sectors such as health and essential sectors (food supply, banks, health, logistics and others)
  • No interstate travel and no gatherings allowed
Conditional MCO (CMCO)4 May 2020–9 June2020
  • All sectors were operational in accordance with Standard Operating Protocol
  • No interstate travel and no gatherings allowed
Recovery MCO (RMCO)10 June 2020–13 October 2020
  • All sectors were operational in accordance with Standard Operating Protocol
  • Interstate travel permitted except in states of extended CMCO and religious activities were allowed in accordance with Standard Operating Protocol
Extended CMCO 14 October 2020–12 January 2021
  • All sectors were operational in accordance with Standard Operating Protocol
  • No interstate travel and no gatherings allowed
MCO 2.013 January 2021–4 March2021
  • Only five essential economic sectors allowed to operate: manufacturing, construction, services (including supermarkets, banks and health services), trade, and distribution and plantations
  • No interstate travel and no gatherings allowed
Table 2. The average mobility percentage change and the characteristics within a specific MCO phase in Malaysia.
PeriodCategoryRetail and RecreationGrocery and PharmacyParksTransit StationsWorkplaces
Pre-MCO
15 February 2020–17 March 2020
Average Mobility48.149.948.948.050.5
Range45.0–51.547.0–65.046.0–53.545.0–52.044.5–53.0
MCO
18 March 2020–3 May 2020
Average Mobility11.327.720.211.220.3
Range8–2219–4315.5–348–3215–27.5
CMCO
4 May 2020–9 June 2020
Average Mobility22.943.328.022.532.6
Range10–3226.5–4817–39.511.5–2714.5–43.5
RMCO
10 June 2020–13 October 2020
Average Mobility39.049.746.136.841.5
Range31–47.544.5–6235.5–7630.5–4817.5–45
Extended CMCO
14 October 2020–12 January 2021
Average Mobility35.347.437.827.038.4
Range28.5–4340.5–6028–57.518.5–3721–44
MCO 2.0
13 January 2021– 4 March 2021
Average Mobility28.144.526.619.734.4
Range20.5–37.535.5–5320–3413.5–25.515.5–43
Publisher’s Note: MDPI stays neutral with regard to jurisdictional claims in published maps and institutional affiliations.

