1. Introduction
Over the past several years, the role of data analytics in human resources has evolved into a crucial tool for addressing key challenges in talent management and enhancing institutional effectiveness [
1]. When supported by technological advancements and innovative methodologies, strategic talent management can serve as a sustainable competitive advantage for organisations [
2].
Research has demonstrated that predictive analytics transforms human capital management [
3] and that algorithmic approaches can optimise processes and enhance efficiency [
4]. However, the successful adoption of People Analytics (PA) relies on overcoming essential structural and strategic challenges, such as integrating data infrastructure with decision-making processes [
5] and addressing key implementation factors in human resource management [
6].
One of the earliest adopters of PA was Google, pioneering data-driven strategies in workforce management [
7]. Talent retention has since emerged as a priority in PA research [
8], with studies demonstrating that advanced human resource (HR) analytics techniques improve employee retention [
9]. The application of HR analytics enables organisations to make informed decisions that enhance employee well-being, thereby strengthening institutional reputation and fostering loyalty [
10]. Organisations that effectively implement HR analytics can pinpoint key factors affecting employee satisfaction and engagement, ultimately reducing turnover rates [
11]. The use of predictive analytics, when built on robust, high-quality databases, represents a powerful tool for strategic decision-making in talent retention [
12].
In the higher education sector, academic staff play a pivotal role in institutional success. Their commitment is essential for maintaining excellence, fostering stability, and driving long-term development. The Spanish higher education landscape has experienced significant transformations in recent years, marked by increased faculty mobility due to talent scarcity and the necessity to comply with evolving regulatory frameworks. Unlike traditional corporate structures, universities operate under hierarchical systems with distinct career trajectories, necessitating a nuanced, data-driven approach to understanding the factors influencing faculty loyalty.
The scientific career in Spain is defined by a highly regulated and hierarchical structure. It is built around a sequence of temporary contracts, competitive calls, and stabilisation processes that rely heavily on external evaluation criteria and the availability of public funding. Access to and progression within the national research and academic system are determined by programmes promoted by national and regional government bodies. This career path—particularly during the postdoctoral stage—is marked by extended periods of contractual precariousness, during which researchers are expected to simultaneously manage teaching responsibilities, produce high-impact scientific work, and continuously apply for funding through highly competitive calls [
13]. Securing a permanent position within the university system can take a long time, even for candidates with internationally competitive research profiles and strong scientific credentials.
These structural characteristics have a profound impact on researchers’ professional experiences [
14], influencing their sense of job security, institutional recognition, and long-term career prospects. Consequently, any attempt to understand the factors that drive academic talent engagement and loyalty in the Spanish context must begin with a critical examination of this regulatory and organisational framework, which differs significantly from other higher education and research systems across Europe.
Given this dynamic and complex environment, talent retention has become a strategic priority for universities. ML techniques offer a sophisticated approach to analysing and predicting faculty commitment, identifying key factors that influence long-term engagement. However, the widespread adoption of PA in Human Resource Management (HRM) faces challenges, including the lack of analytical expertise among HR professionals and ethical concerns surrounding data privacy [
1].
The application of predictive analytics in HR has been instrumental in anticipating employee turnover. Studies have shown that HR databases can be leveraged to predict voluntary departures by identifying behavioural patterns indicative of attrition risk [
15]. Various ML models have been explored in retention analysis, with logistic regression being one of the most widely applied techniques [
16]. More recent research suggests that deep learning techniques further enhance predictive accuracy by capturing complex, non-linear relationships among retention factors [
17]. Feature selection methods have also been employed to refine classification models, improving both interpretability and efficiency [
18].
Unsupervised ML techniques in PA facilitate the systematic identification of hidden patterns that may not be evident through traditional HR analysis. Feature selection methods streamline predictive models while maintaining high accuracy [
19]. Critical factors influencing retention, such as job dissatisfaction, lack of professional growth, and misalignment with organisational culture, have been extensively studied [
20,
21]. Additionally, research highlights the impact of job satisfaction on performance, with engagement acting as a mediator and employee health as a moderator [
22].
Beyond financial compensation, employee satisfaction and engagement are strongly influenced by non-monetary benefits, collectively termed emotional salary. Rooted in classical motivation theories [
23,
24], emotional salary encompasses factors such as recognition, professional development, autonomy, and work–life balance. Studies underscore its direct impact on employee well-being and retention [
25,
26].
The “happy and productive worker” model suggests that workplace well-being correlates with job performance, reinforcing the importance of non-monetary incentives in reducing turnover and fostering organisational commitment [
27]. In academia, these factors are particularly significant, as they contribute to an environment that nurtures long-term engagement among faculty and researchers.
Recent findings demonstrate that emotional salary has a positive influence on job satisfaction and performance, as it enhances employee motivation and engagement [
28]. As a result, this concept has gained prominence in talent management, particularly within higher education institutions.
This study provides a comprehensive framework for identifying key quantitative factors influencing talent commitment in academia through the application of unsupervised ML techniques.
Within the framework of this scientific research, the quantitative emotional salary (QES) sub-dataset refers to a specific set of quantitative variables that capture the non-monetary yet measurable aspects of the work experience that directly influence the satisfaction, motivation, and loyalty of university faculty. The QES sub-dataset serves as an empirical representation of the broader concept of emotional salary, which is traditionally associated with qualitative factors such as recognition, work–life balance, or professional development. However, by focusing exclusively on its quantifiable dimensions, this sub-dataset enables an aim, data-driven analysis that can support strategic decision-making in academic talent management.
By isolating and analysing such variables independently from direct salary measures, the QES subset allows for a deeper understanding of the hidden factors that influence academic talent commitment. Its application makes it possible to go beyond traditional financial incentives and to optimise retention strategies through a more holistic and evidence-based approach.
The objective is to extract a set of interrelated quantitative variables—referred to as quantitative emotional salary (QES)—whose behaviour closely resembles that of economic compensation (EC). This systematic approach aims to pinpoint the most influential retention factors for university faculty, ultimately strengthening the institution’s intellectual capital.
By integrating machine learning methods, this research offers a data-driven perspective on talent commitment in higher education. It highlights the transformative potential of combining innovative technologies with HR analytics to enhance institutional outcomes and faculty engagement.
The following sections outline the methodology employed, present the results obtained, and discuss the implications of these findings for the future of HR analytics in academia.
2. Materials and Methods
This research follows a structured and reproducible approach to ensure the validity and replicability of results. The methodology consists of multiple stages, each employing specialised computational tools and machine learning techniques for data integration, preprocessing, analysis, and modelling.
The data collection and integration process was carried out and is detailed below. The first step is data collection, which is critical for determining the success of a predictive model [
29]. Human resources data is often dispersed across multiple systems, making it necessary to standardise and integrate diverse data sources into a unified structure to ensure consistency and comparability.
The primary datasets for this study were sourced from the University CEU Cardenal Herrera, following compliance with the General Data Protection Regulation (GDPR). The dataset spans a historical record of five academic years (2018–2022) and includes information on university academic staff. The data sources are as follows:
Workday (Workday, Inc. (Pleasanton, CA, USA)) and A3 (Wolters Kluwer (Alphen aan den Rijn, The Netherlands)): Administrative and compensation-related data.
Cornerstone (Cornerstone OnDemand Inc. (Santa Monica, CA, USA)): Employee training, performance, and talent management data.
Own University IT Systems: Organisational structure and faculty employment records.
To ensure semantic coherence, integration required format transformation and standardisation, aligning different fields despite originating from separate platforms. The Extract, Transform, Load (ETL) methodology was applied to clean, transform, and load the data into a unified dataset, allowing for seamless analysis.
The process of data preprocessing and feature engineering was conducted, as outlined below. Given the considerable number of records in the dataset, an initial exploratory analysis was conducted to:
Identify and handle outliers, redundancies, and null values.
Correct typographical errors and standardise variable formats.
Following this, feature engineering was performed to enhance data quality. The final dataset included 1144 individuals and 103 features, of which 72 were quantitative. After filtering the dataset to focus on tenure-track faculty, adjunct professors were excluded, resulting in a refined dataset of 599 individuals. A key qualitative variable within the dataset is “commitment,” which indicates whether a faculty member was actively employed at the university as of 31 August 2023.
Then, Data Normalisation and Correlation Analysis were performed. Since machine learning techniques based on distance measures require data normalisation, the 72 numerical features were standardised to a common scale without distorting their relative differences. To explore relationships between variables, a correlation matrix was computed using Kendall’s correlation coefficient, which measures monotonic associations between quantitative variables. Based on the correlation structure, sub-datasets were constructed, preserving only significantly correlated variables.
Moreover, dimensionality reduction using Principal Component Analysis (PCA) was used to reduce the dataset dimensionality while preserving key information. This method, introduced by [
30] and further developed by [
31], transforms correlated variables into uncorrelated principal components ranked by importance. The following considerations guided the PCA application:
Eigenvalues: Used to rank components in terms of information retention. Components with the highest eigenvalues were prioritised.
Eigenvectors: Define the direction of principal components, ensuring they remain orthogonal.
Projection Principles: The first principal component maximises data variance, while subsequent components are perpendicular, forming an orthogonal coordinate system.
Goodness-of-Fit Measure: The elbow method was applied to determine the optimal number of components by explaining at least 70% of the variance [
32].
Following dimensionality reduction, unsupervised machine learning techniques were applied, specifically the K-Means clustering algorithm. This technique groups data points based on similarity, minimizing intra-cluster variance while maximizing inter-cluster separation.
Several studies indicate that applying K-Means in PCA-transformed subspaces enhances computational efficiency [
33,
34]. Despite its simplicity, K-Means has been shown to perform competitively against more complex clustering methods [
35]. Additionally, research by [
36] suggests that there is no universal solution for K-Means, reinforcing the importance of empirical validation.
Key Steps in K-Means Implementation:
Step 1. Setting a Random Seed (Ensures reproducibility).
Step 2. Centroid Initialisation (Centroids are randomly assigned as initial cluster representatives).
Step 3. Cluster Assignment (Each data point is assigned to the nearest centroid based on Euclidean distance).
Step 4. Centroid Update (New centroids are recalculated as the arithmetic mean of points within each cluster).
Step 5: Iteration Until Convergence (Steps 3 and 4 are repeated until centroids stabilise, or a predefined iteration limit is reached).
The optimal number of clusters (k) was determined using the elbow method, which evaluates intra-cluster variance (Within-Cluster Sum of Squares, WCSS) as a function of k. The optimal k is selected at the inflexion point where adding more clusters does not significantly improve compactness.
After clustering, the composition of each group was examined based on the qualitative variables from the initial dataset. This analysis provided valuable insights into the characteristics of faculty members with lower commitment, helping to identify key retention factors and patterns that influence long-term faculty engagement.
3. Results
The primary findings of this research are outlined below. The initial dataset, after applying the preprocessing methodologies described earlier, consisted of 103 variables encompassing both qualitative and quantitative attributes. This study focuses exclusively on the 72 quantitative variables, as the analytical techniques employed—such as principal component analysis and correlation analysis—require numerical input to yield meaningful results. Thus, quantitative variables were analysed to identify significant interrelationships. To examine such relationships, a correlation matrix was computed using Kendall’s coefficient. Variables demonstrating a statistically significant correlation with at least one other variable in the dataset were selected for further analysis. A significance threshold of α = 0.05 was established, ensuring that only correlations with a p-value below this threshold were considered meaningful.
To enhance the interpretability and reduce the redundancy, a filtering process was implemented to retain only variables with statistically significant correlations relevant to our research objectives. As a result, multiple sub-datasets were constructed from the initial dataset based on thematic coherence, enabling a more structured and detailed analysis. Two main sub-datasets were defined, reflecting the two primary dimensions of employee retention—non-monetary and monetary factors, respectively. The list of variables included in the different sub-datasets can be found in
Appendix A,
Table A1.
Within the QES sub-dataset, dimensionality reduction was performed using PCA.
The results indicate that five principal components optimally encapsulate over 70% of the total variance in the data. And this was sufficient to explain the variability that exists in the data.
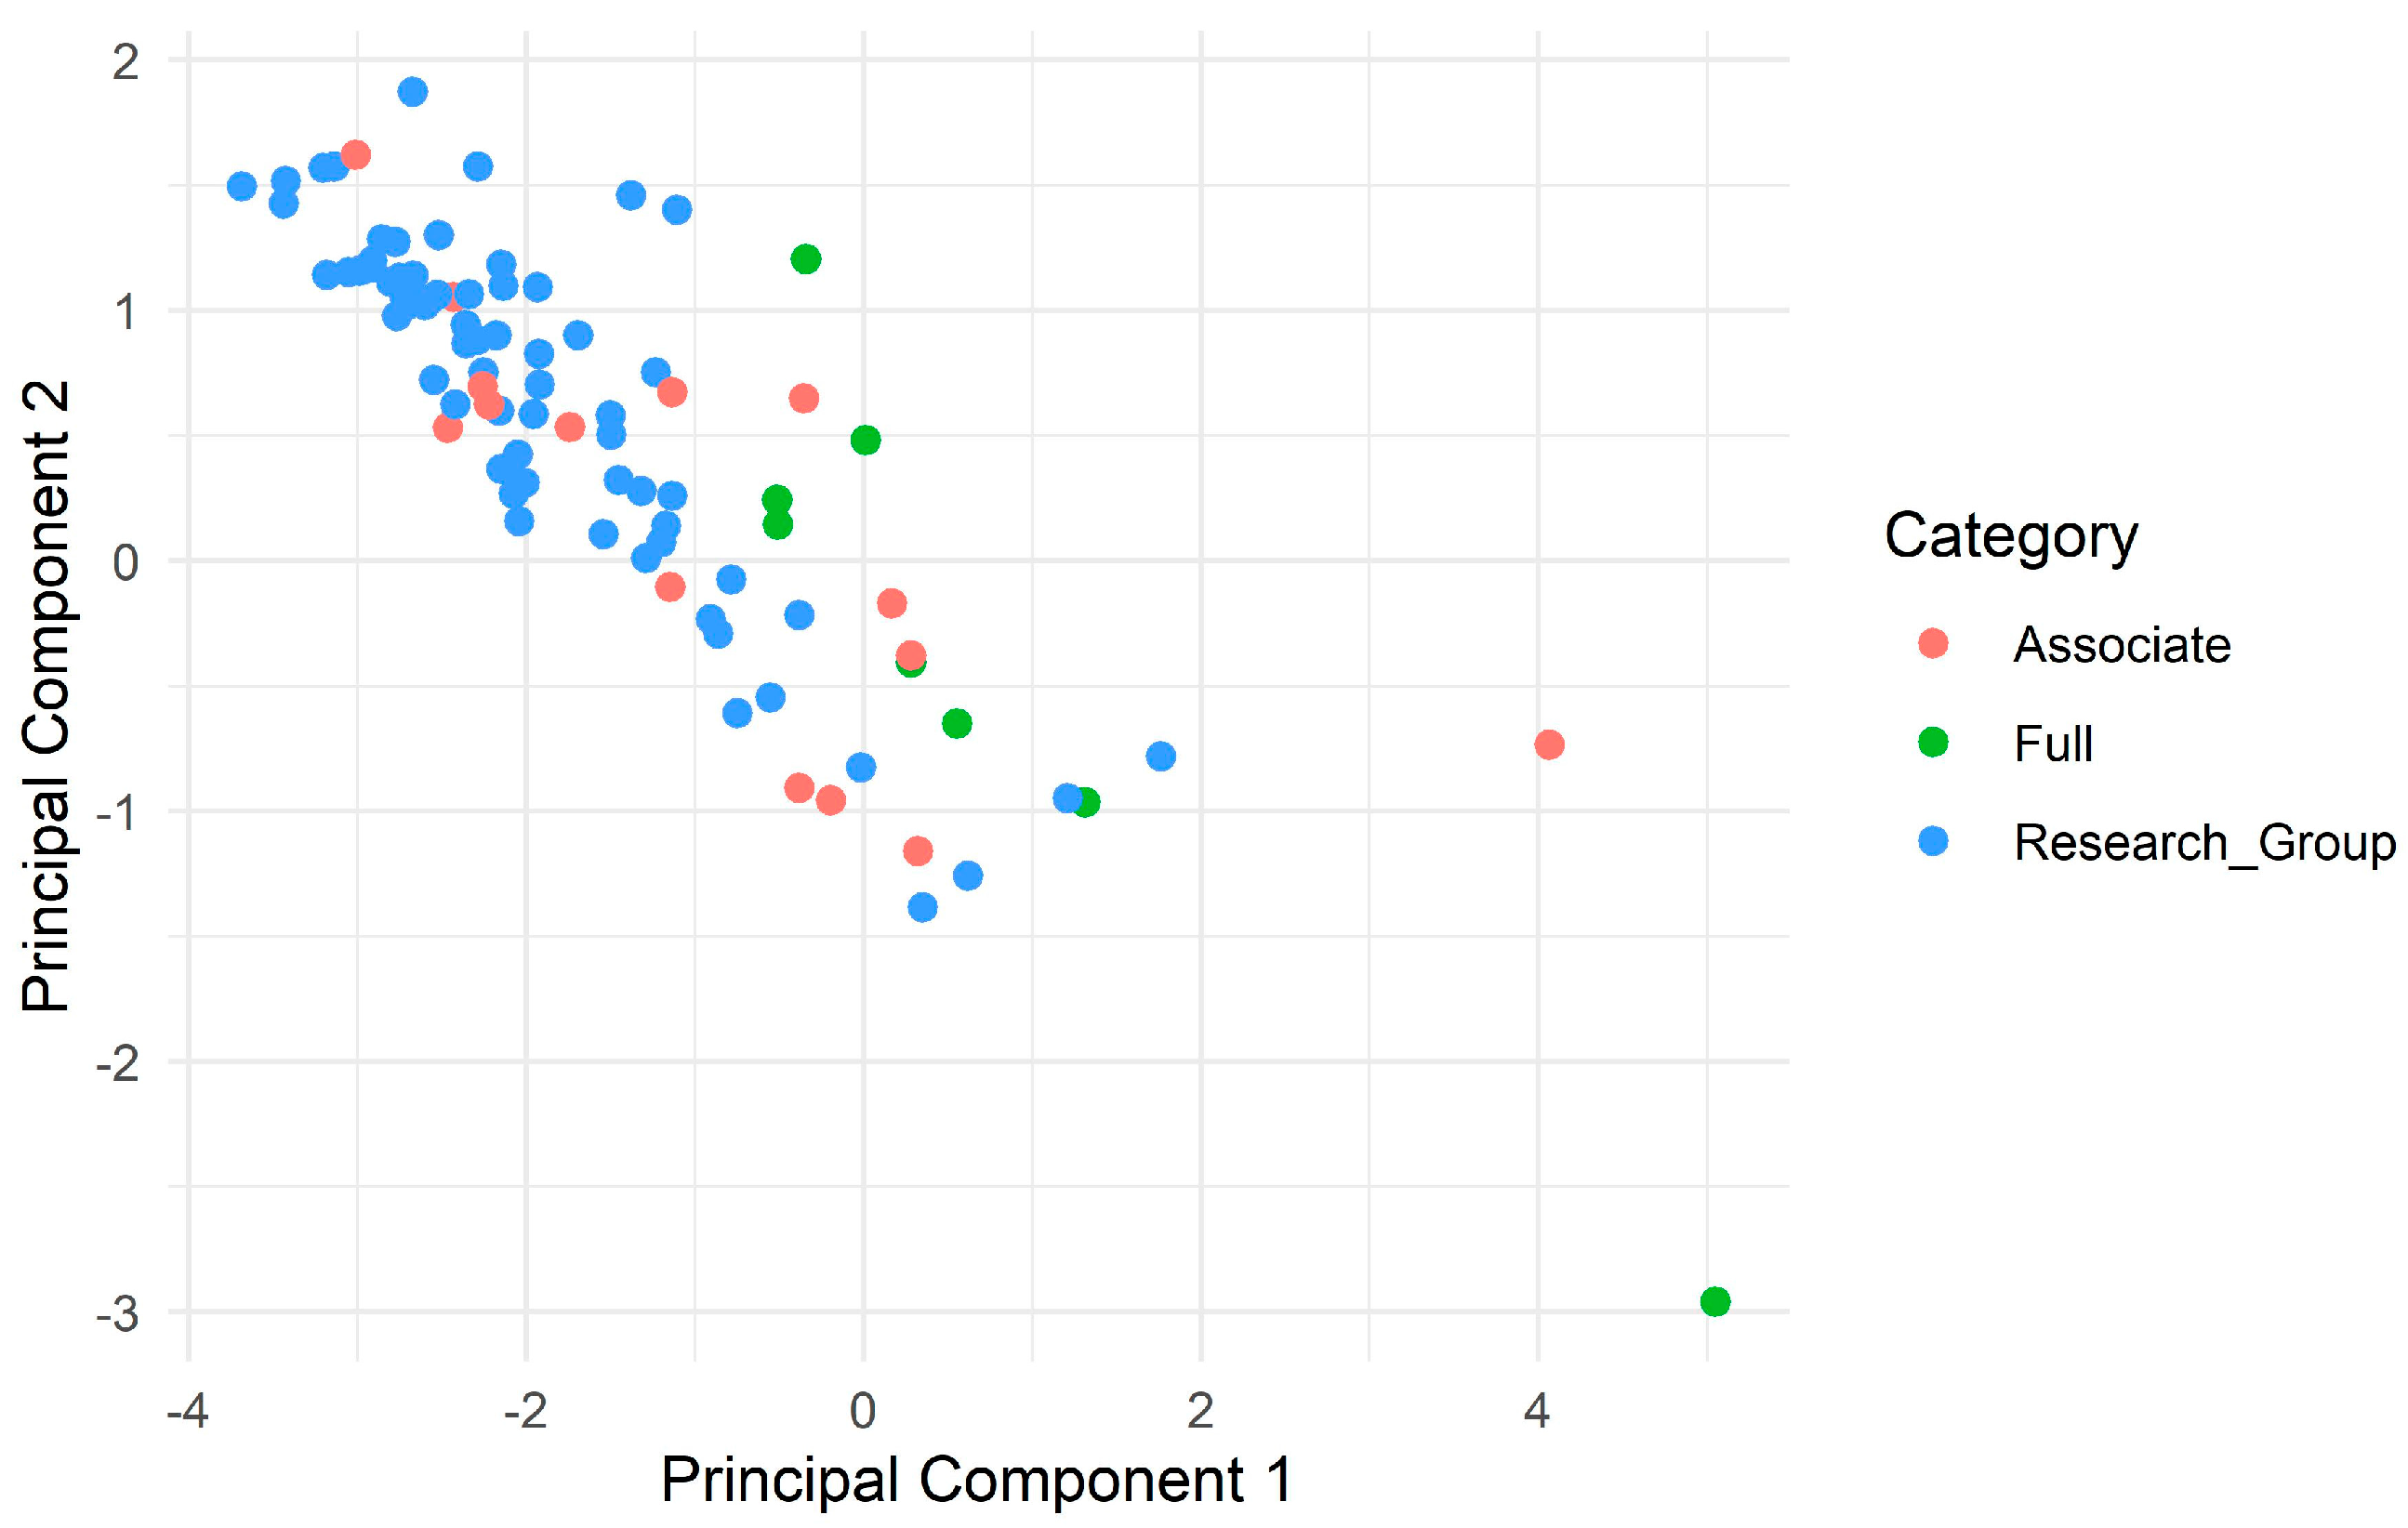
Table 1 presents the percentage contribution of each original variable to these components, allowing for the identification of the most influential factors within the QES construct. It shows Dimension 1 is characterised by educational support between 2018–2020, while Dimension 2 highlights continuous training. Dimension 3 is defined by time in position and training, whereas Dimension 4 is associated with seniority and training, and Dimension 5 with time in position and professional development.
Figure 1 below presents a graphical representation, which was constructed using the first two principal components, where each point represents an individual who was not retained, i.e., a person who left the organisation. Although the analysis focuses on quantitative variables, one qualitative variable from the original set of 103 is incorporated: the academic category at the time of turnover. This variable is used for colour coding in the visualisations, offering additional insights into potential patterns. The variable categories are listed in
Appendix A,
Table A2.
Figure 1 shows the distribution of non-retained individuals from the QES sub-dataset in the plane defined by the first two principal components of the PCA. In this plot, non-retained individuals are grouped according to their academic category. This type of visualisation helps identify clustering patterns by observing how the observations are positioned based on the indicated variables.
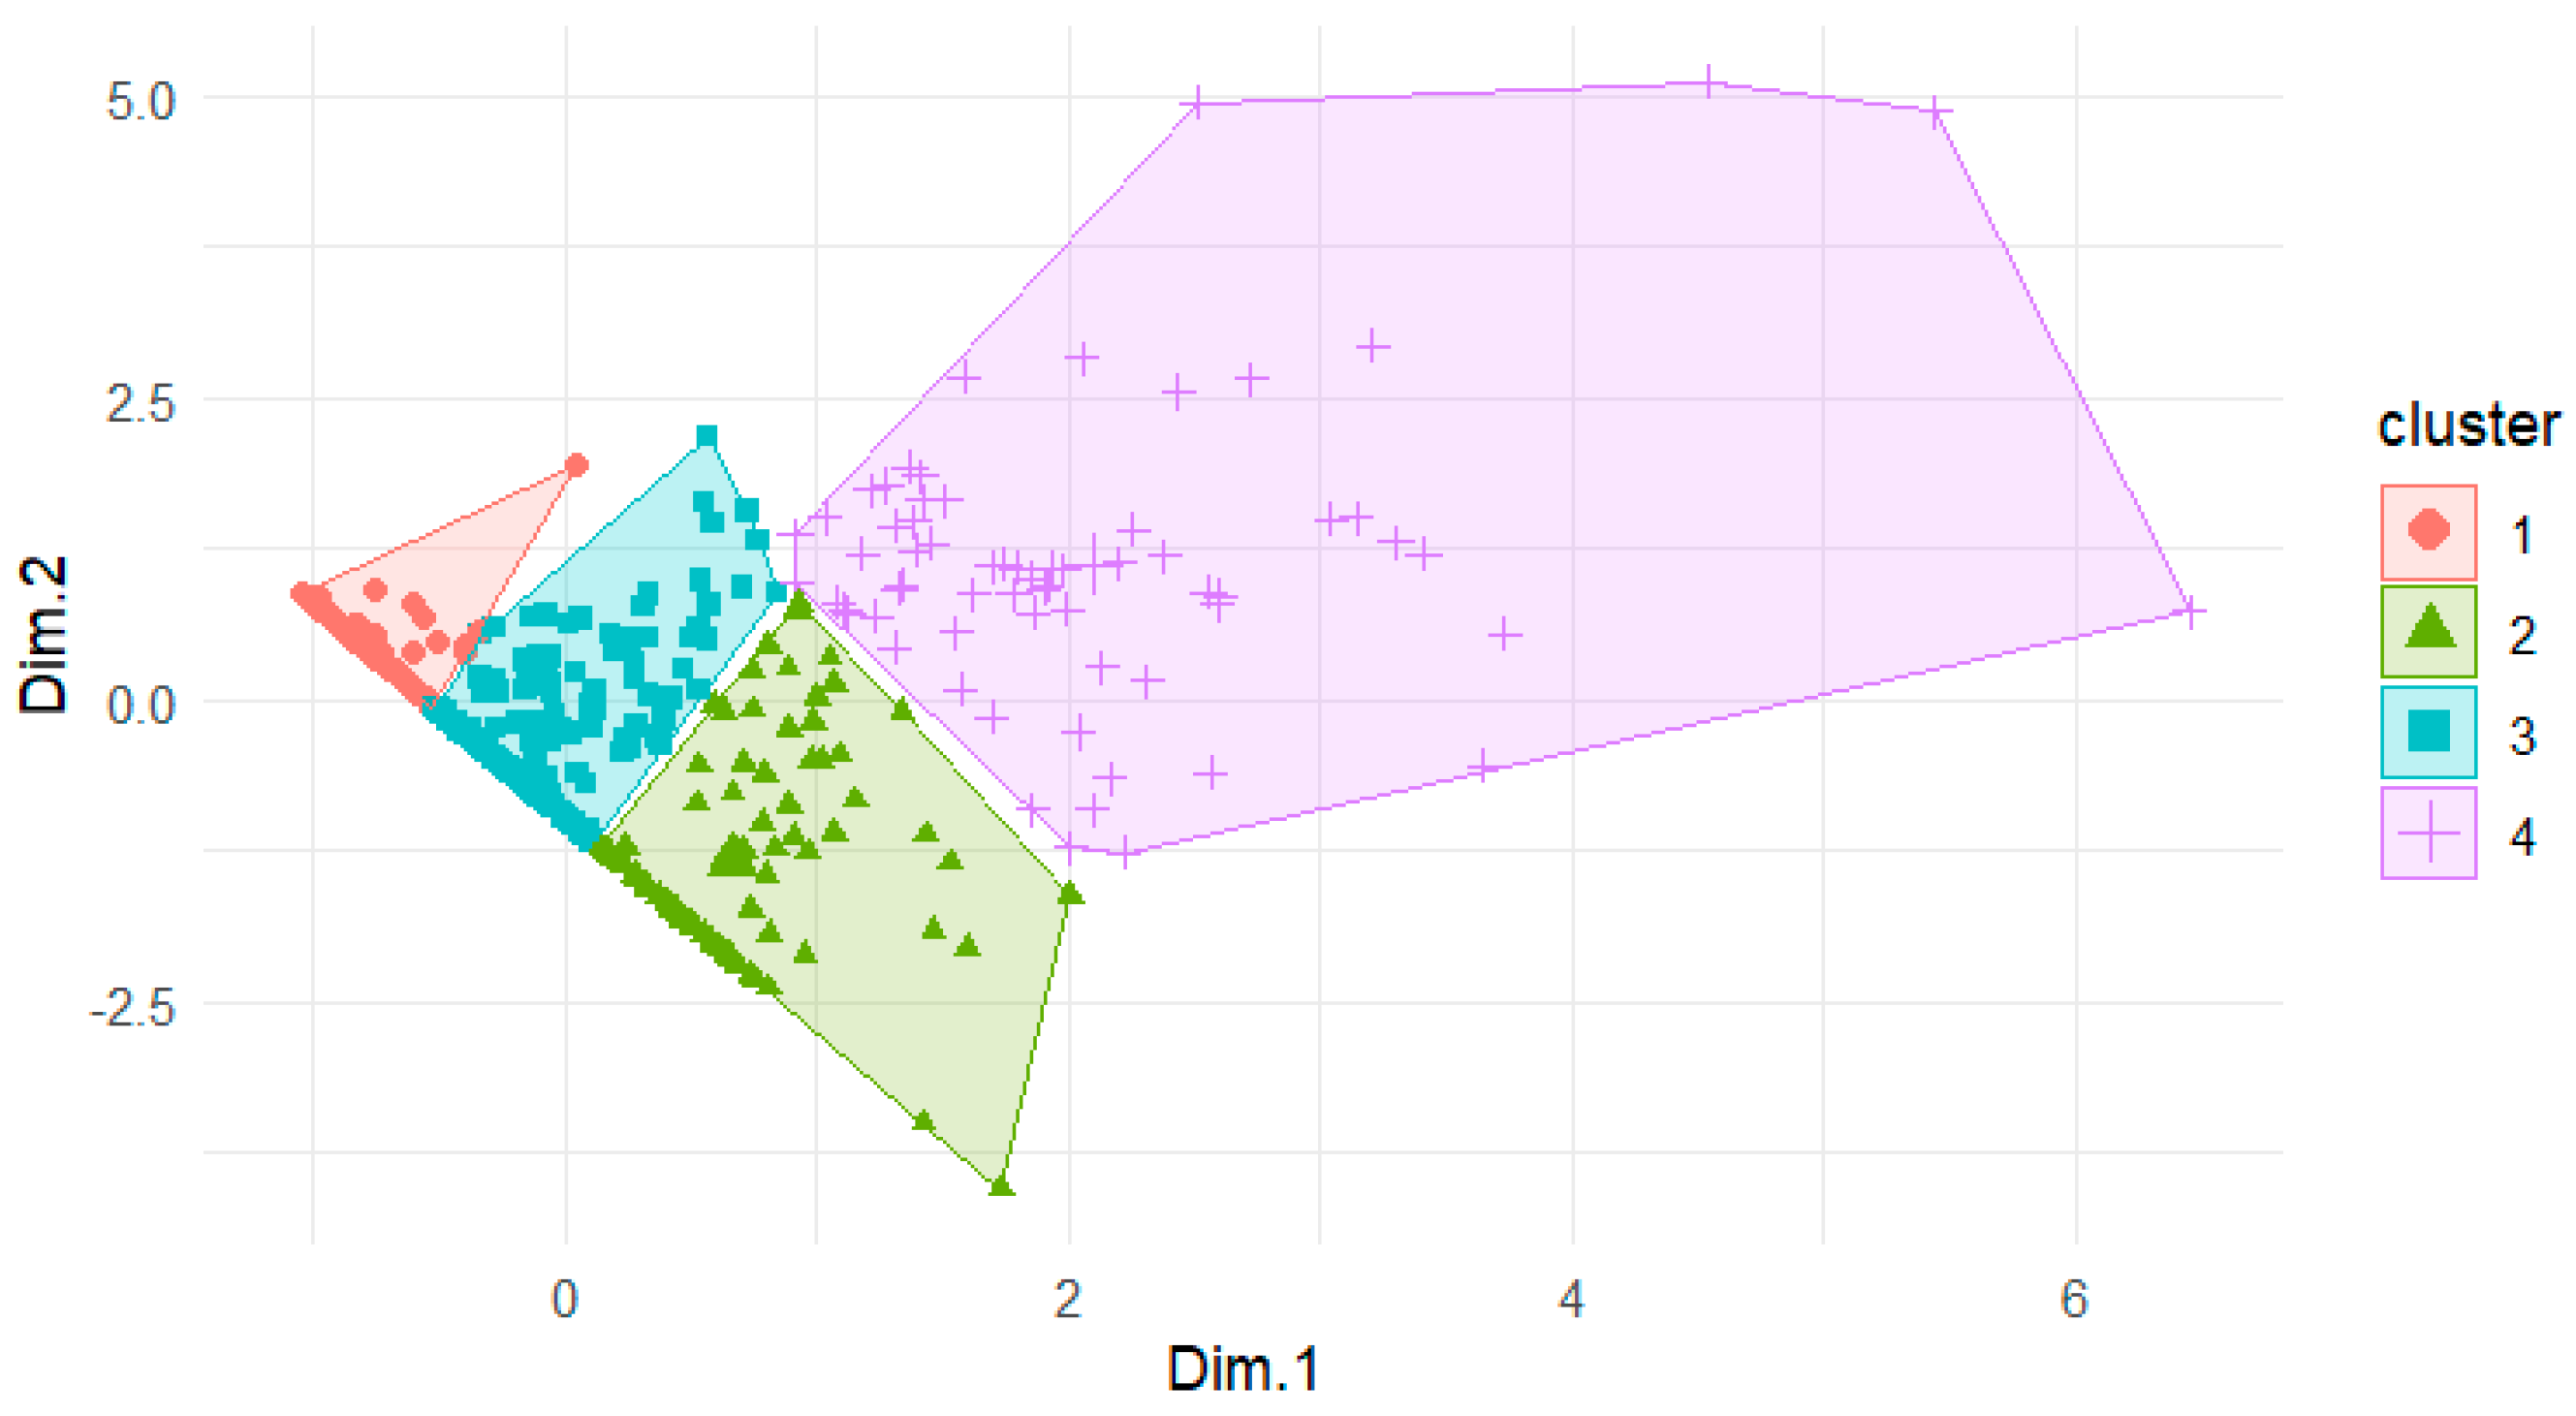
To further explore underlying structures, K-Means clustering was applied within the reduced-dimensional space obtained through PCA. The optimal number of clusters was determined to be four, based on the elbow method. The resulting cluster distribution is depicted in
Figure 2 below, where each point represents an individual, positioned according to the first two principal components, facilitating visual differentiation among clusters.
After obtaining the results from
Figure 2, an examination of cluster composition concerning commitment levels revealed that Cluster 1 exhibited the highest proportion of non-retained individuals (27.86%), whereas the remaining clusters showed significantly lower percentages, with Cluster 4 containing no non-retained individuals at all. To gain additional insights, the proportion of the grouped current academic category levels within each cluster was analysed. This categorical variable, which is part of the initial database comprising 103 variables, is detailed in
Table A2 of
Appendix A. The results of this analysis are summarised in
Table 2, providing valuable information on the attributes of non-retained individuals in the QES sub-dataset.
This analysis allows for the identification of the composition of each cluster based on different qualitative variables of interest, providing relevant information about the features of non-retained individuals in the QES sub-dataset. In this case, the current category level variable reflects a clear segmentation between academic levels, from the initial levels in Cluster 1 to the advanced levels in Cluster 4. The EC sub-dataset was similarly analysed using PCA, which revealed that the first two principal components account for approximately 85% of the total variance.
Table 3 details the percentage of each variable’s contribution to the variance explained by these two principal components. It shows that the first principal component is strongly influenced by the variables related to gross compensation across different years, while the second principal component reflects a greater weight of the variables associated with the functional complement.
To visualise the relationships among the variables, a scatter plot was generated using the first two principal components (see
Figure 3). This plot specifically includes individuals classified as non-loyal (i.e., those for whom the target variable is “Yes”). Each point is colour-coded based on grouped academic categories, allowing for clear differentiation. This quantitative variable is listed in
Appendix A,
Table A2.
Next, K-Means clustering was applied to this reduced space to segment the data (see
Figure 4). As in the QES sub-dataset, the elbow method was used to determine the optimal number of clusters, which was found to be four.
Figure 4 shows the distribution of the QES sub-dataset data in the space defined by the first two principal components after applying the K-Means clustering algorithm. Each colour represents a different cluster, allowing visualisation of how individuals are grouped based on the underlying structure of the data. The clusters are clearly differentiated, indicating that the variables selected for the analysis allow for effective segmentation of individuals into distinct profiles. This visualisation provides an overview of the internal structure of the dataset. The spatial separation between clusters suggests significant differences that can be explored more deeply in subsequent analyses.
Finally, an exploration of the distribution of qualitative variables across the identified clusters was performed. These qualitative variables are part of the initial dataset, which consists of 103 variables. In particular, the qualitative variable “objective” classifies individuals into two groups: those considered non-loyal, defined by a “Yes” value in the target variable, and those considered loyal, classified with a “No” value. In this context, the analysis of cluster composition about commitment levels revealed that Cluster 1 had the highest proportion of non-retained individuals, with 27.82% of the cases, suggesting a notable concentration of non-loyal individuals within this cluster. A key observation from this clustering analysis is that Cluster 1 is strongly associated with a lack of “talent engagement”, distinguishing it as a critical group for further investigation. Identifying the unique characteristics of this cluster is essential to understanding the factors contributing to non-retention.
The percentage distribution of individuals based on “current category level” is presented in
Table 4, further contextualising the insights derived from the EC sub-dataset analysis.
Table 4 shows the percentage distribution of a qualitative variable that reflects the current academic levels of individuals in each of the four clusters defined within the EC sub-dataset. This distribution allows for the observation of how individuals are grouped based on their academic category across the different clusters. The table reveals that the clusters are primarily grouped according to academic career levels. Clusters 1 and 3 mainly include individuals at the lower levels of the academic career. In contrast, Cluster 2 groups individuals at more advanced levels, with a higher representation of Full Professors.
4. Discussion
This study applied unsupervised machine learning methods to analyse a dataset related to the university academic environment, with a specific focus on university professors and researchers, and their relationship with talent commitment.
One of the key aspects to consider when analysing talent commitment in higher education institutions is the specific nature of the university environment compared to other sectors [
37], particularly the business sector. Unlike commercial organisations, universities are subject to additional legal and administrative regulations that significantly influence human resource management. These include public regulations governing recruitment, promotion, and job stability, externally determined salary scales, and an institutional framework in which non-monetary incentives carry considerable weight.
In this regard, although the present study draws on concepts such as Quantitative Emotional Salary (QES), which are inspired by practices from the business world, their application has been carefully contextualised. The aim is not to directly transfer private sector models, but rather to explore internal patterns within the university system that may serve as meaningful indicators of motivation and retention, based on their statistical behaviour resembling that of economic compensation.
Acknowledging these structural differences is essential for a proper interpretation of the results. Thus, the contribution of this study lies in offering a methodological framework that can be adapted to different institutional contexts, always considering the regulatory and organisational constraints inherent to the education sector.
The findings offer valuable insights into the factors influencing talent loyalty within academic institutions. The composition of the variables that make up the two sub-datasets is detailed in
Appendix A,
Table A1. This table provides a complete description of the variables included in each sub-dataset, offering a clear view of the elements that constitute the data used in the analysis. Through dimensionality reduction and clustering techniques, significant patterns were identified—some aligning with previous research while others providing novel interpretations of professional behaviours and needs.
The proposed methodology proved effective in not only simplifying the inherent complexity of the dataset but also generating actionable insights that can inform strategies to improve talent commitment in academic settings. Various analytical tools were employed, including correlation matrix analysis, which was computed using Kendall’s coefficient, Principal Component Analysis (PCA), and the K-Means clustering algorithm. These techniques helped reduce the dataset’s dimensionality, facilitating the identification of key relationships and sub-datasets of interest.
Two primary sub-datasets emerged from the analysis: Quantitative Emotional Salary (QES) and Economic Compensation (EC). The QES sub-dataset, comprising nineteen correlated variables, highlights the critical role of emotional factors in faculty commitment. In contrast, the EC sub-dataset, consisting of ten correlated variables, demonstrates how economic compensation is also linked to talent commitment.
PCA was instrumental in reducing the dataset’s complexity while preserving its most significant information. In the QES sub-dataset, five principal components explained more than 70% of the total variance, whereas in the EC sub-dataset, just two principal components accounted for 80% of the total variance. Beyond dimensionality reduction, PCA also provided a clearer visualisation of relationships between clusters, enabling a more intuitive interpretation of the segmentation.
The application of clustering techniques, particularly the K-Means algorithm, revealed four distinct employee segments in both sub-datasets. Notably, the cluster closest to the origin of the coordinate system in both cases exhibited lower explained variability by the first two principal components. This suggests that observations within these clusters share less variability in explanatory factors, a finding of relevance since talent turnover was concentrated in these groups. Each observation represents a set of characteristics that define an individual in the dataset. Therefore, within the clusters closest to the origin of the coordinate system, individuals have lower variability in the characteristics that explain them, meaning they share more similarities. This is relevant because, as mentioned, talent turnover was concentrated in these clusters with lower variability, which may indicate that these shared characteristics are linked to the lack of talent retention. This indicates that the characteristics defining these clusters are associated with a higher likelihood of faculty member departure.
In the QES sub-dataset, segmentation revealed that professors with lower quantitative emotional salary levels were more likely to leave the institution. This finding aligns with previous studies, such as [
38], which emphasised the importance of emotional well-being and job satisfaction as key predictors of talent retention. These results suggest that emotional salary factors—such as recognition, work–life balance, and institutional support—play a crucial role in faculty commitment.
The study also found that all academic staff categories responded similarly to the absence of emotional salary, underscoring its universal importance. Additionally, results indicate that professors with lower economic salaries, as well as those in research-intensive positions, were more vulnerable to turnover.
By identifying key factors influencing talent commitment, this research reinforces the growing significance of non-economic well-being as a fundamental pillar for fostering faculty loyalty. While economic compensation remains relevant, the findings highlight those intangible factors—represented by the QES sub-dataset—strongly influence faculty decisions to remain at an institution.
These insights emphasise the need for comprehensive retention strategies that integrate both financial and emotional incentives. Strengthening faculty commitment requires not only improvements in salary structures but also targeted initiatives to enhance the work environment, professional recognition, and overall job satisfaction. By addressing both economic and emotional factors, universities can develop holistic strategies to retain academic talent and foster long-term institutional stability.
5. Conclusions
The findings of this research highlight a significant relationship between Quantitative Emotional Salary (QES) and talent loyalty, showing similar behavioural patterns to those observed in the Economic Compensation (EC) sub-dataset. However, this study emphasises, that both QES and EC independently contribute to academic talent loyalty, suggesting that while both factors influence commitment, they do so in complementary ways. This study reinforces the growing recognition that emotional salary plays a fundamental role in academic talent commitment, alongside economic factors.
The developed methodological framework proved effective in identifying latent patterns in the data while also reducing dimensionality, thereby enhancing interpretability. This improved clarity makes the results more accessible and applicable for decision-makers in higher education institutions.
Nevertheless, it is important to underscore that this research is based on a single institutional case study. As such, its findings are context-specific and should not be generalised across the entire higher education sector without further validation. Institutional structures, regulatory frameworks, and cultural contexts vary widely between universities and national systems, and these factors could significantly affect the relevance and replicability of the observed patterns.
Despite promising results, this study has certain limitations. One key limitation is that the projection of original variables into the PCA space may obscure significant nonlinear relationships, potentially limiting a deeper understanding of underlying data structures. Additionally, while the K-Means clustering algorithm is computationally efficient, it assumes spherical clusters of similar sizes, which may not fully capture the actual distribution of data points.
Another limitation pertains to the possible exclusion of essential qualitative variables during the initial data selection process. This study focused primarily on quantitative dimensions of emotional salary and economic compensation; however, qualitative factors—such as personal perceptions, institutional culture, and professional experiences—could provide additional insights into talent loyalty.
Future research should address these methodological limitations by exploring hybrid approaches that integrate both qualitative and quantitative dimensions. Expanding the scope of analysis to broader and more diverse organisational contexts would allow for a more comprehensive understanding of talent commitment.
This study also opens new pathways for data-driven talent management research. By leveraging data analytics, future studies can explore critical strategic lines in human resource management, helping institutions develop more targeted and effective policies for fostering long-term faculty engagement and commitment.


