
Overview of Typical Projects for Geological Storage of CO2 in Offshore Saline Aquifers

 ,
, 
Abstract
:1. Introduction
2. Typical Offshore Saline Aquifer Storage Project
2.1. Sleipner
2.1.1. Project Background
2.1.2. Geological Information
2.1.3. Injection Information
2.1.4. Monitoring
2.1.5. Modeling
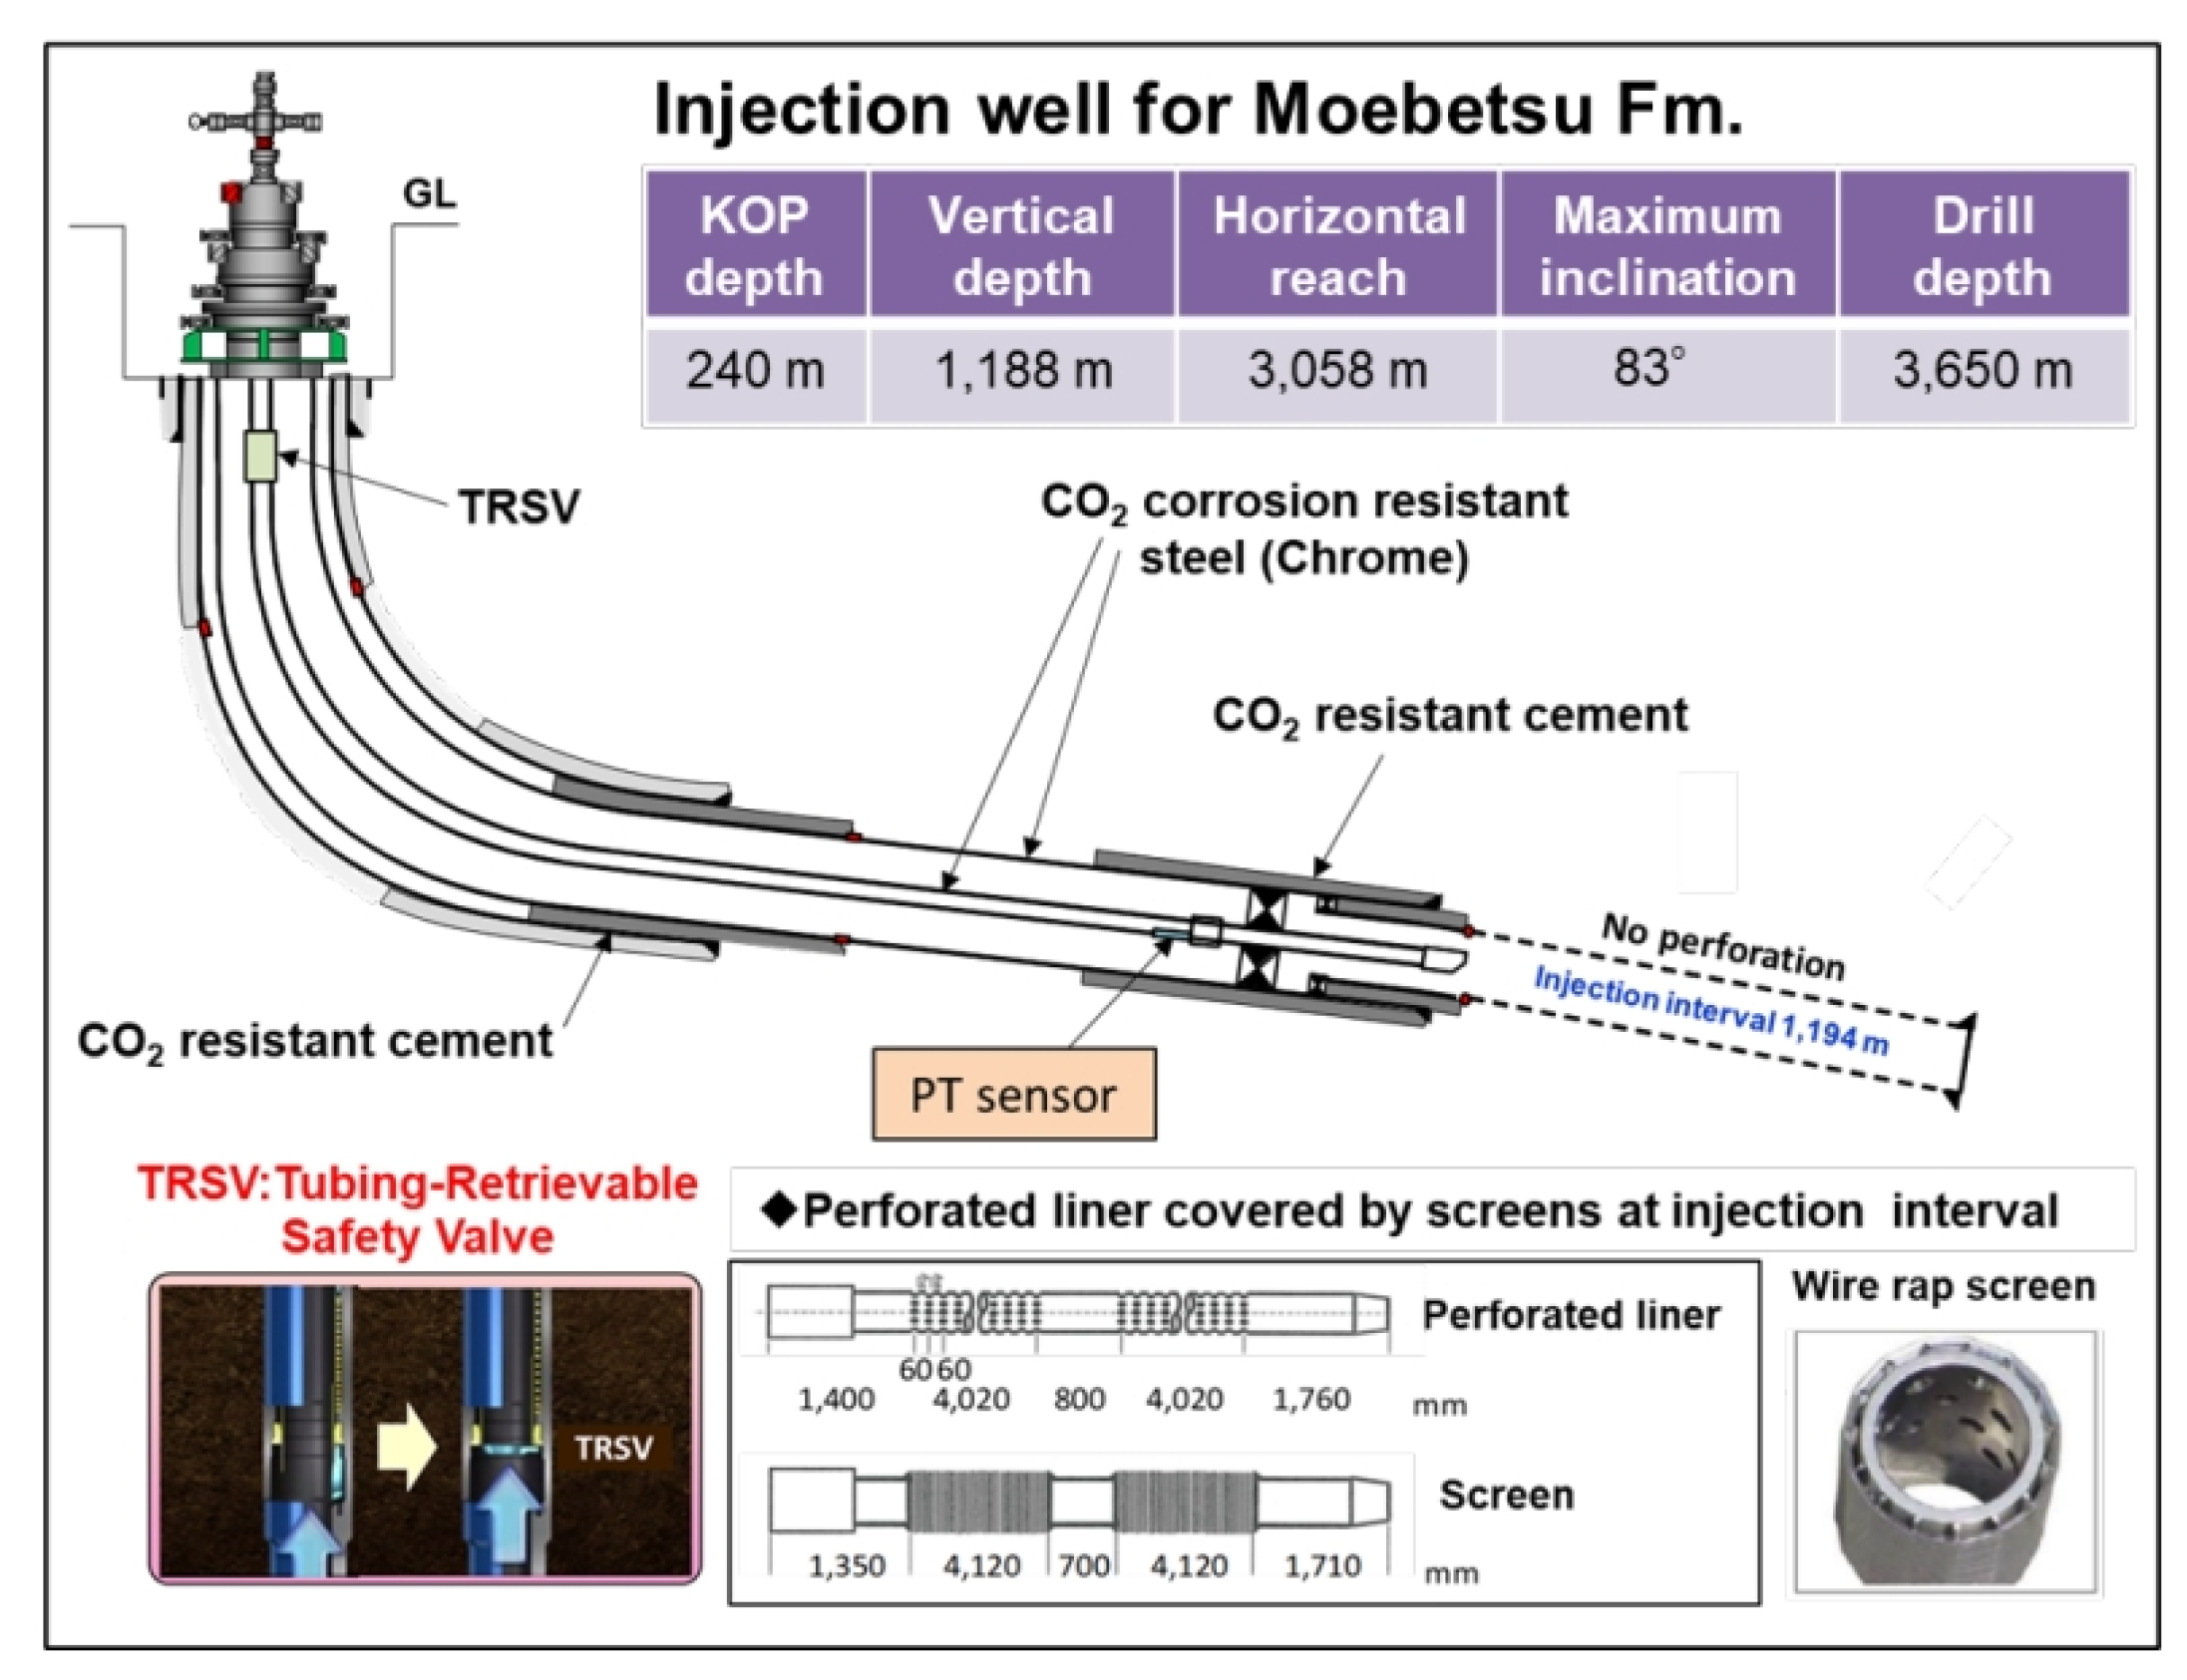
2.2. Tomakomai
2.2.1. Project Background
2.2.2. Geologic Information
2.2.3. Injection Information
2.2.4. Monitoring
2.2.5. Simulation
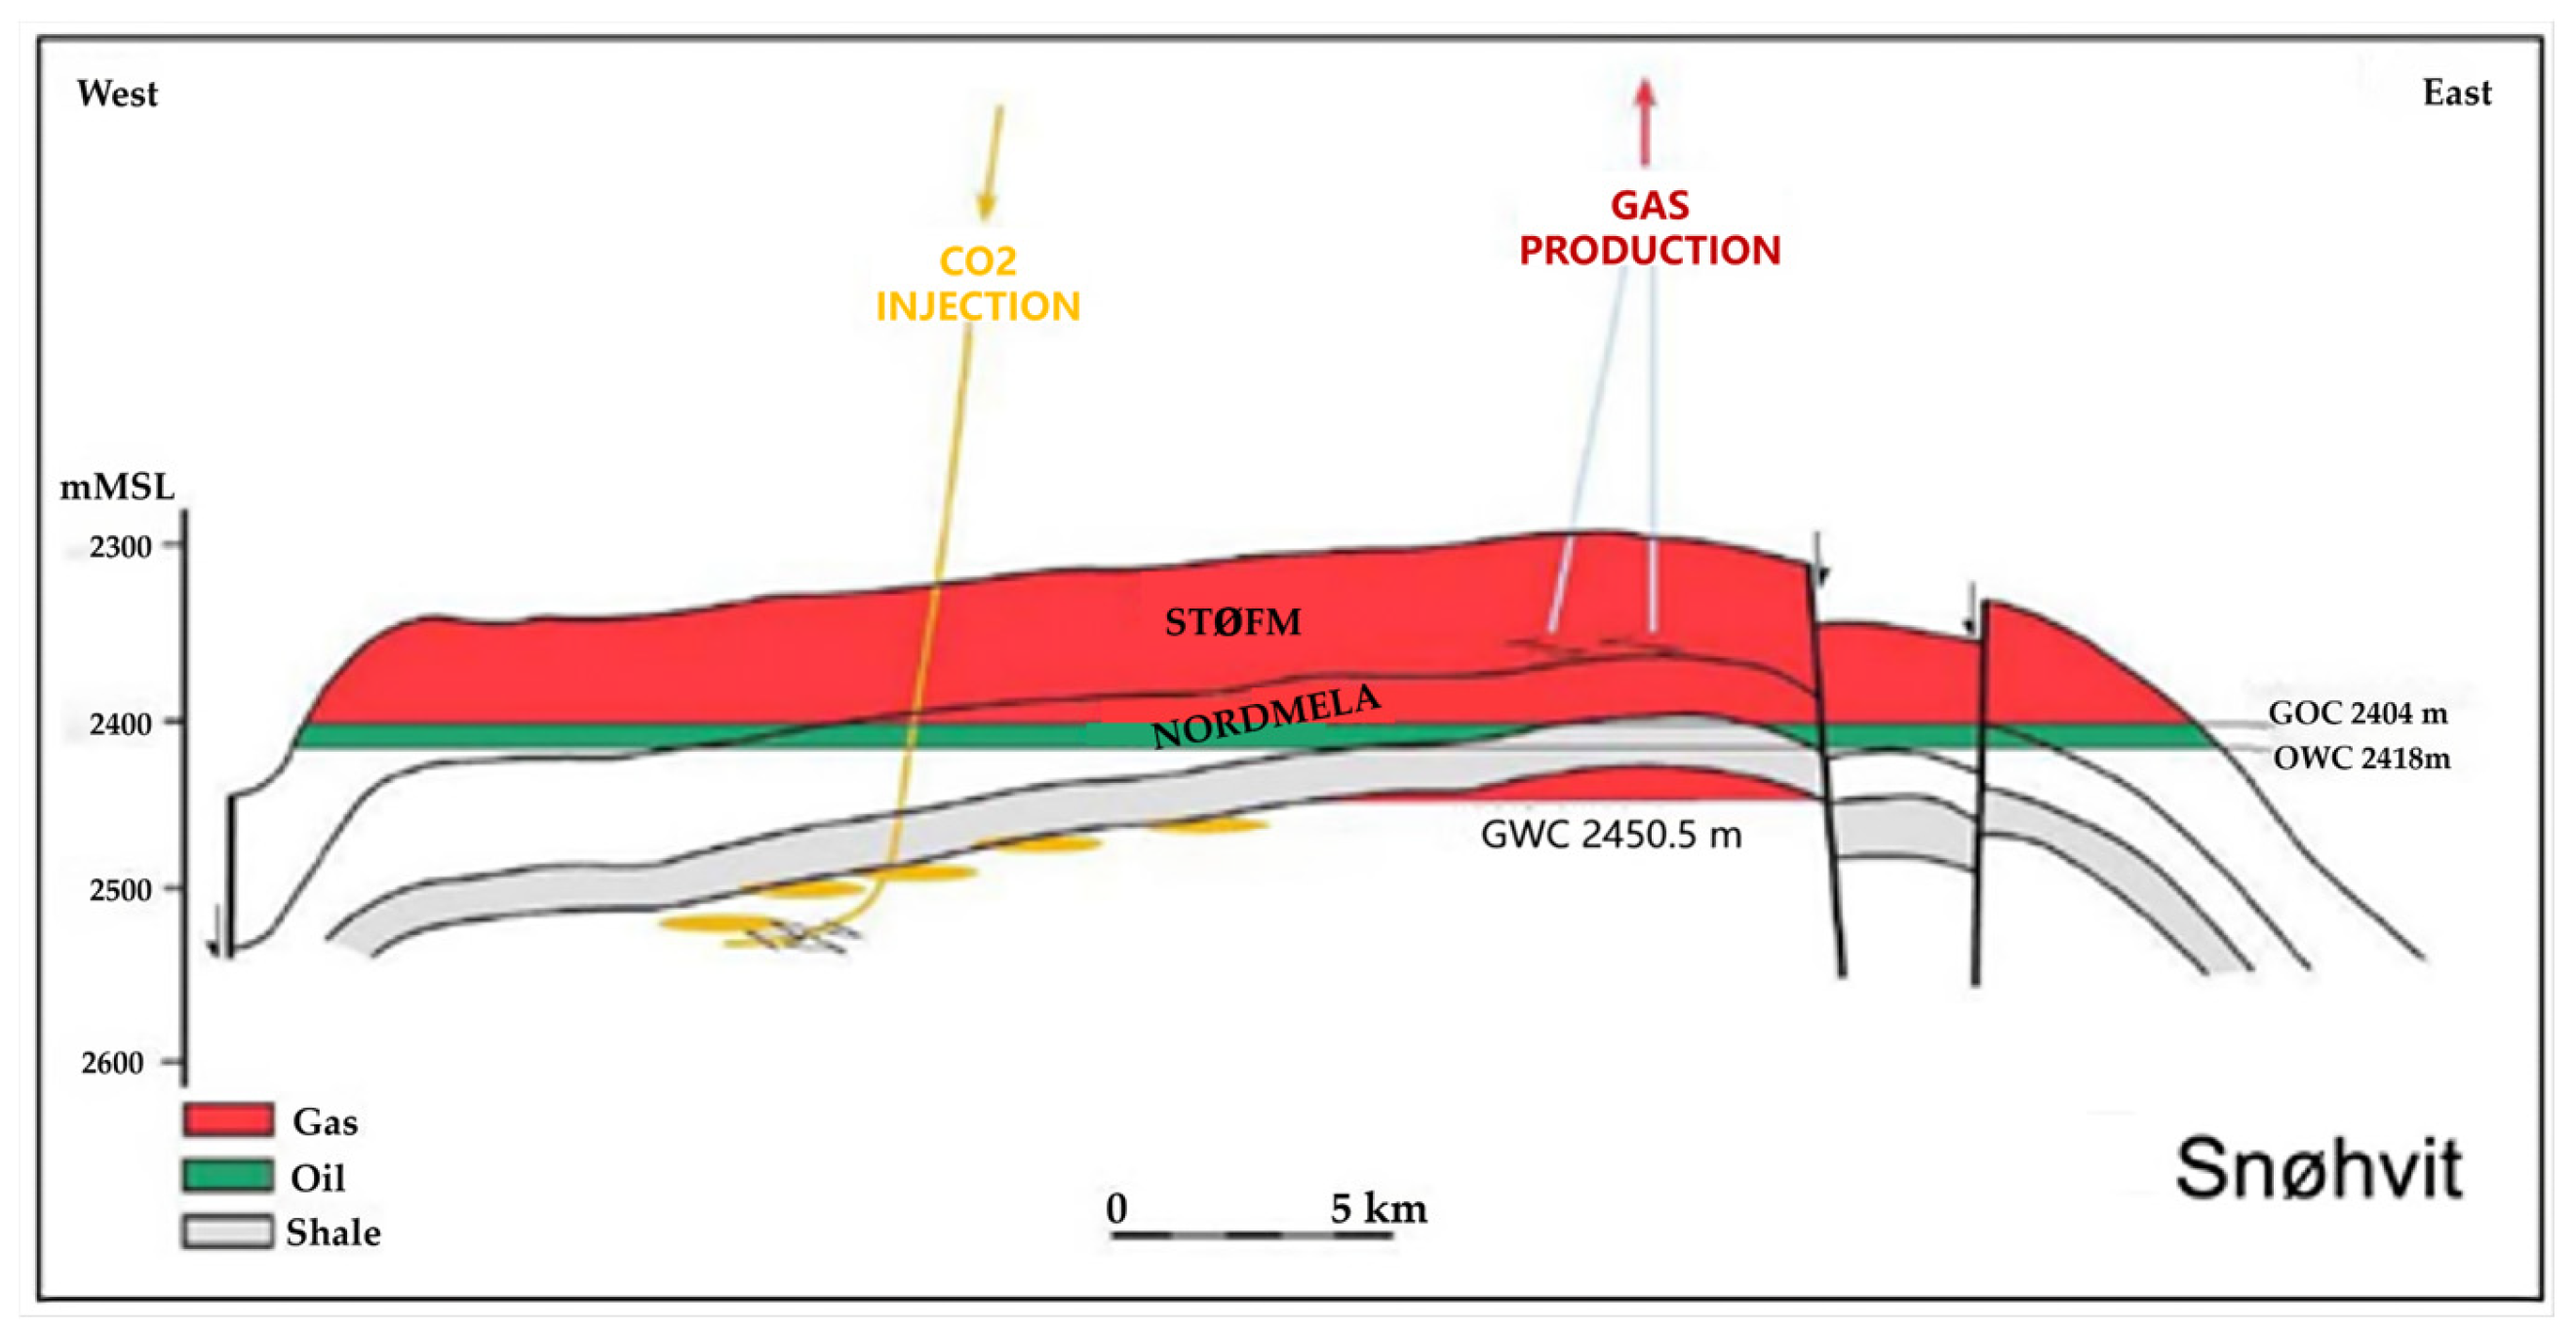
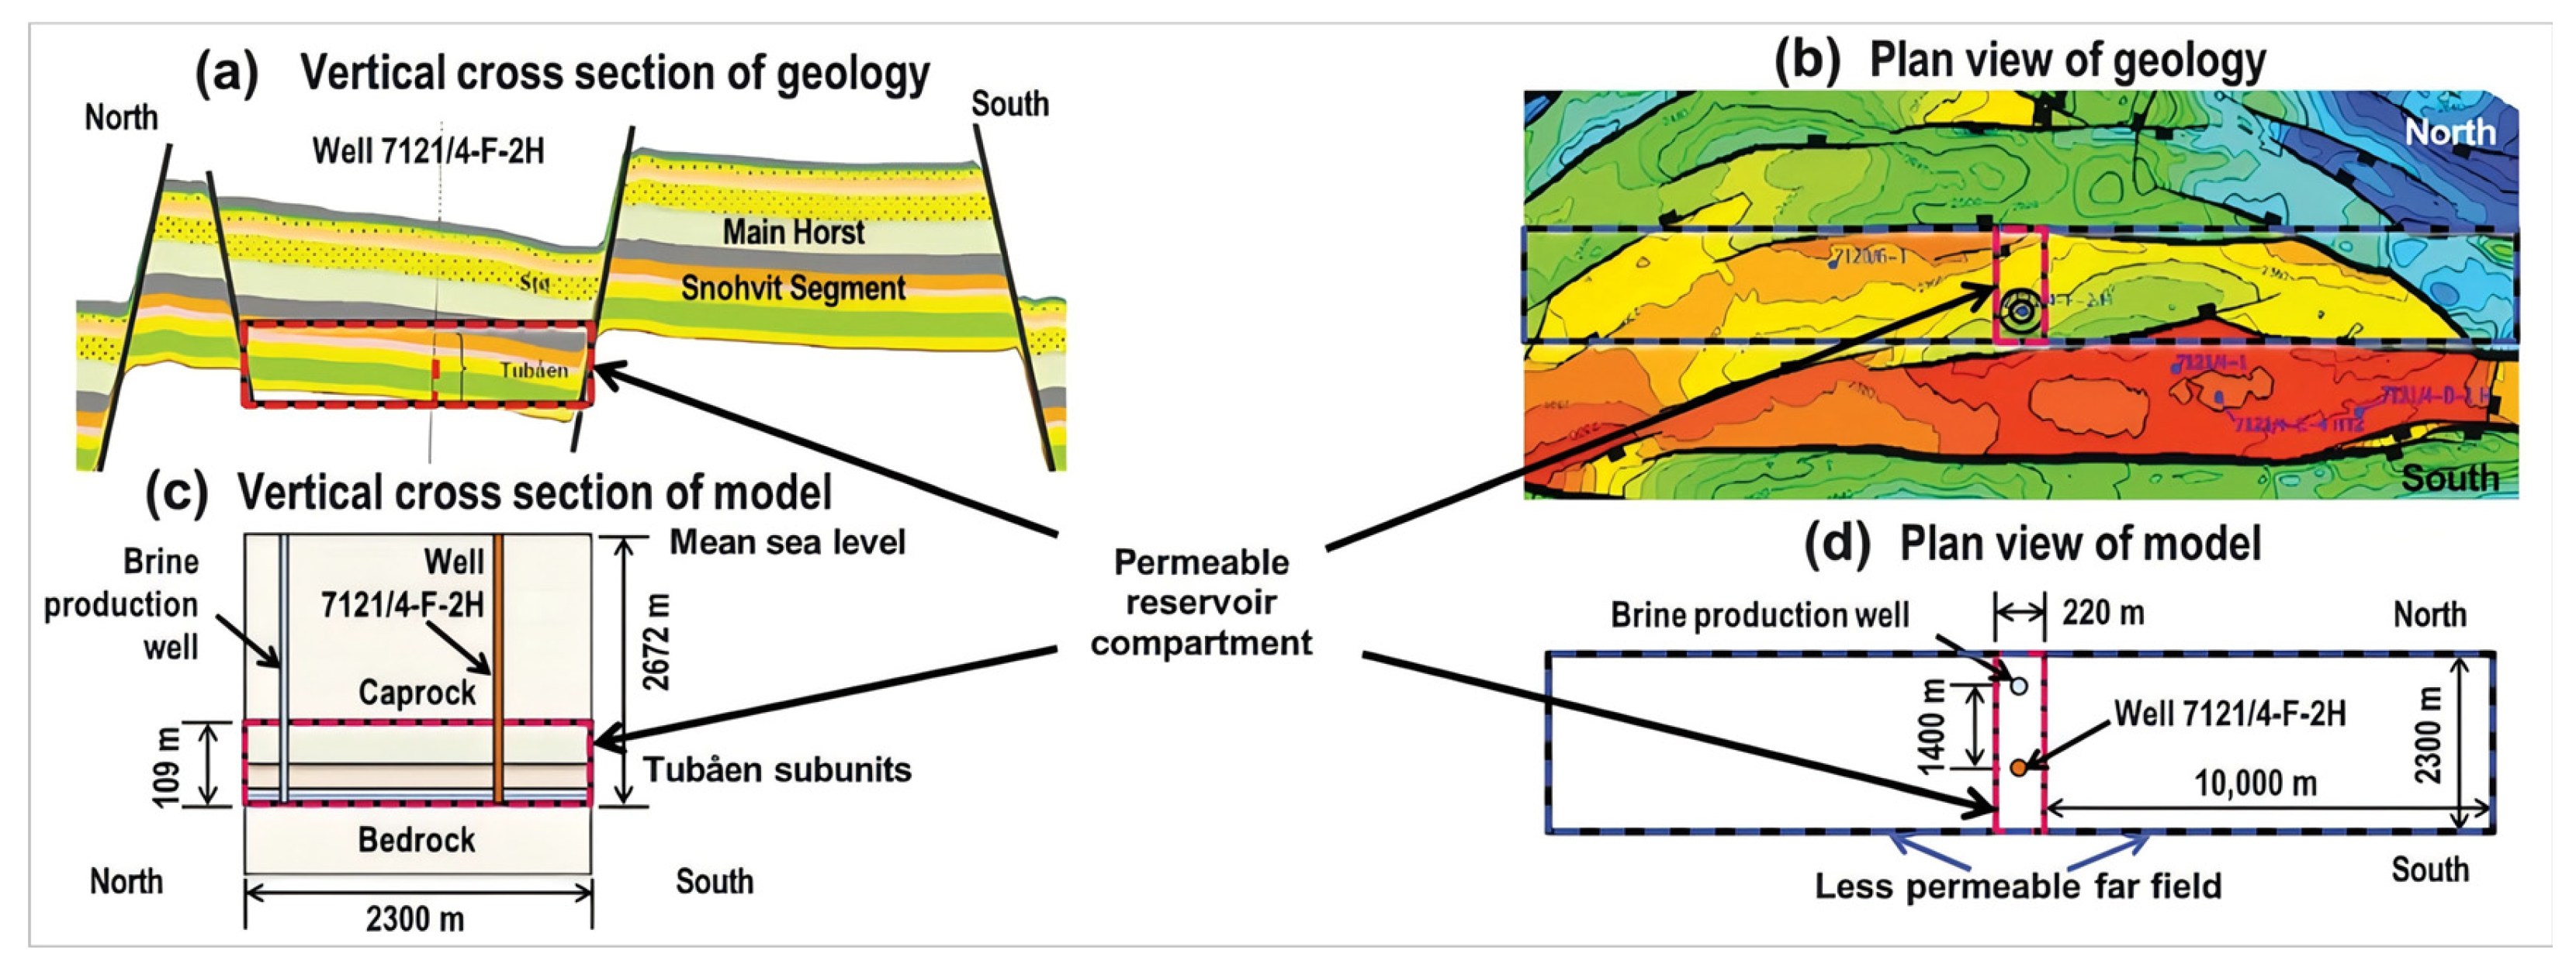
2.3. Snøhvit
2.3.1. Project Background
2.3.2. Geological Information
2.3.3. Injection Information
2.3.4. Monitoring
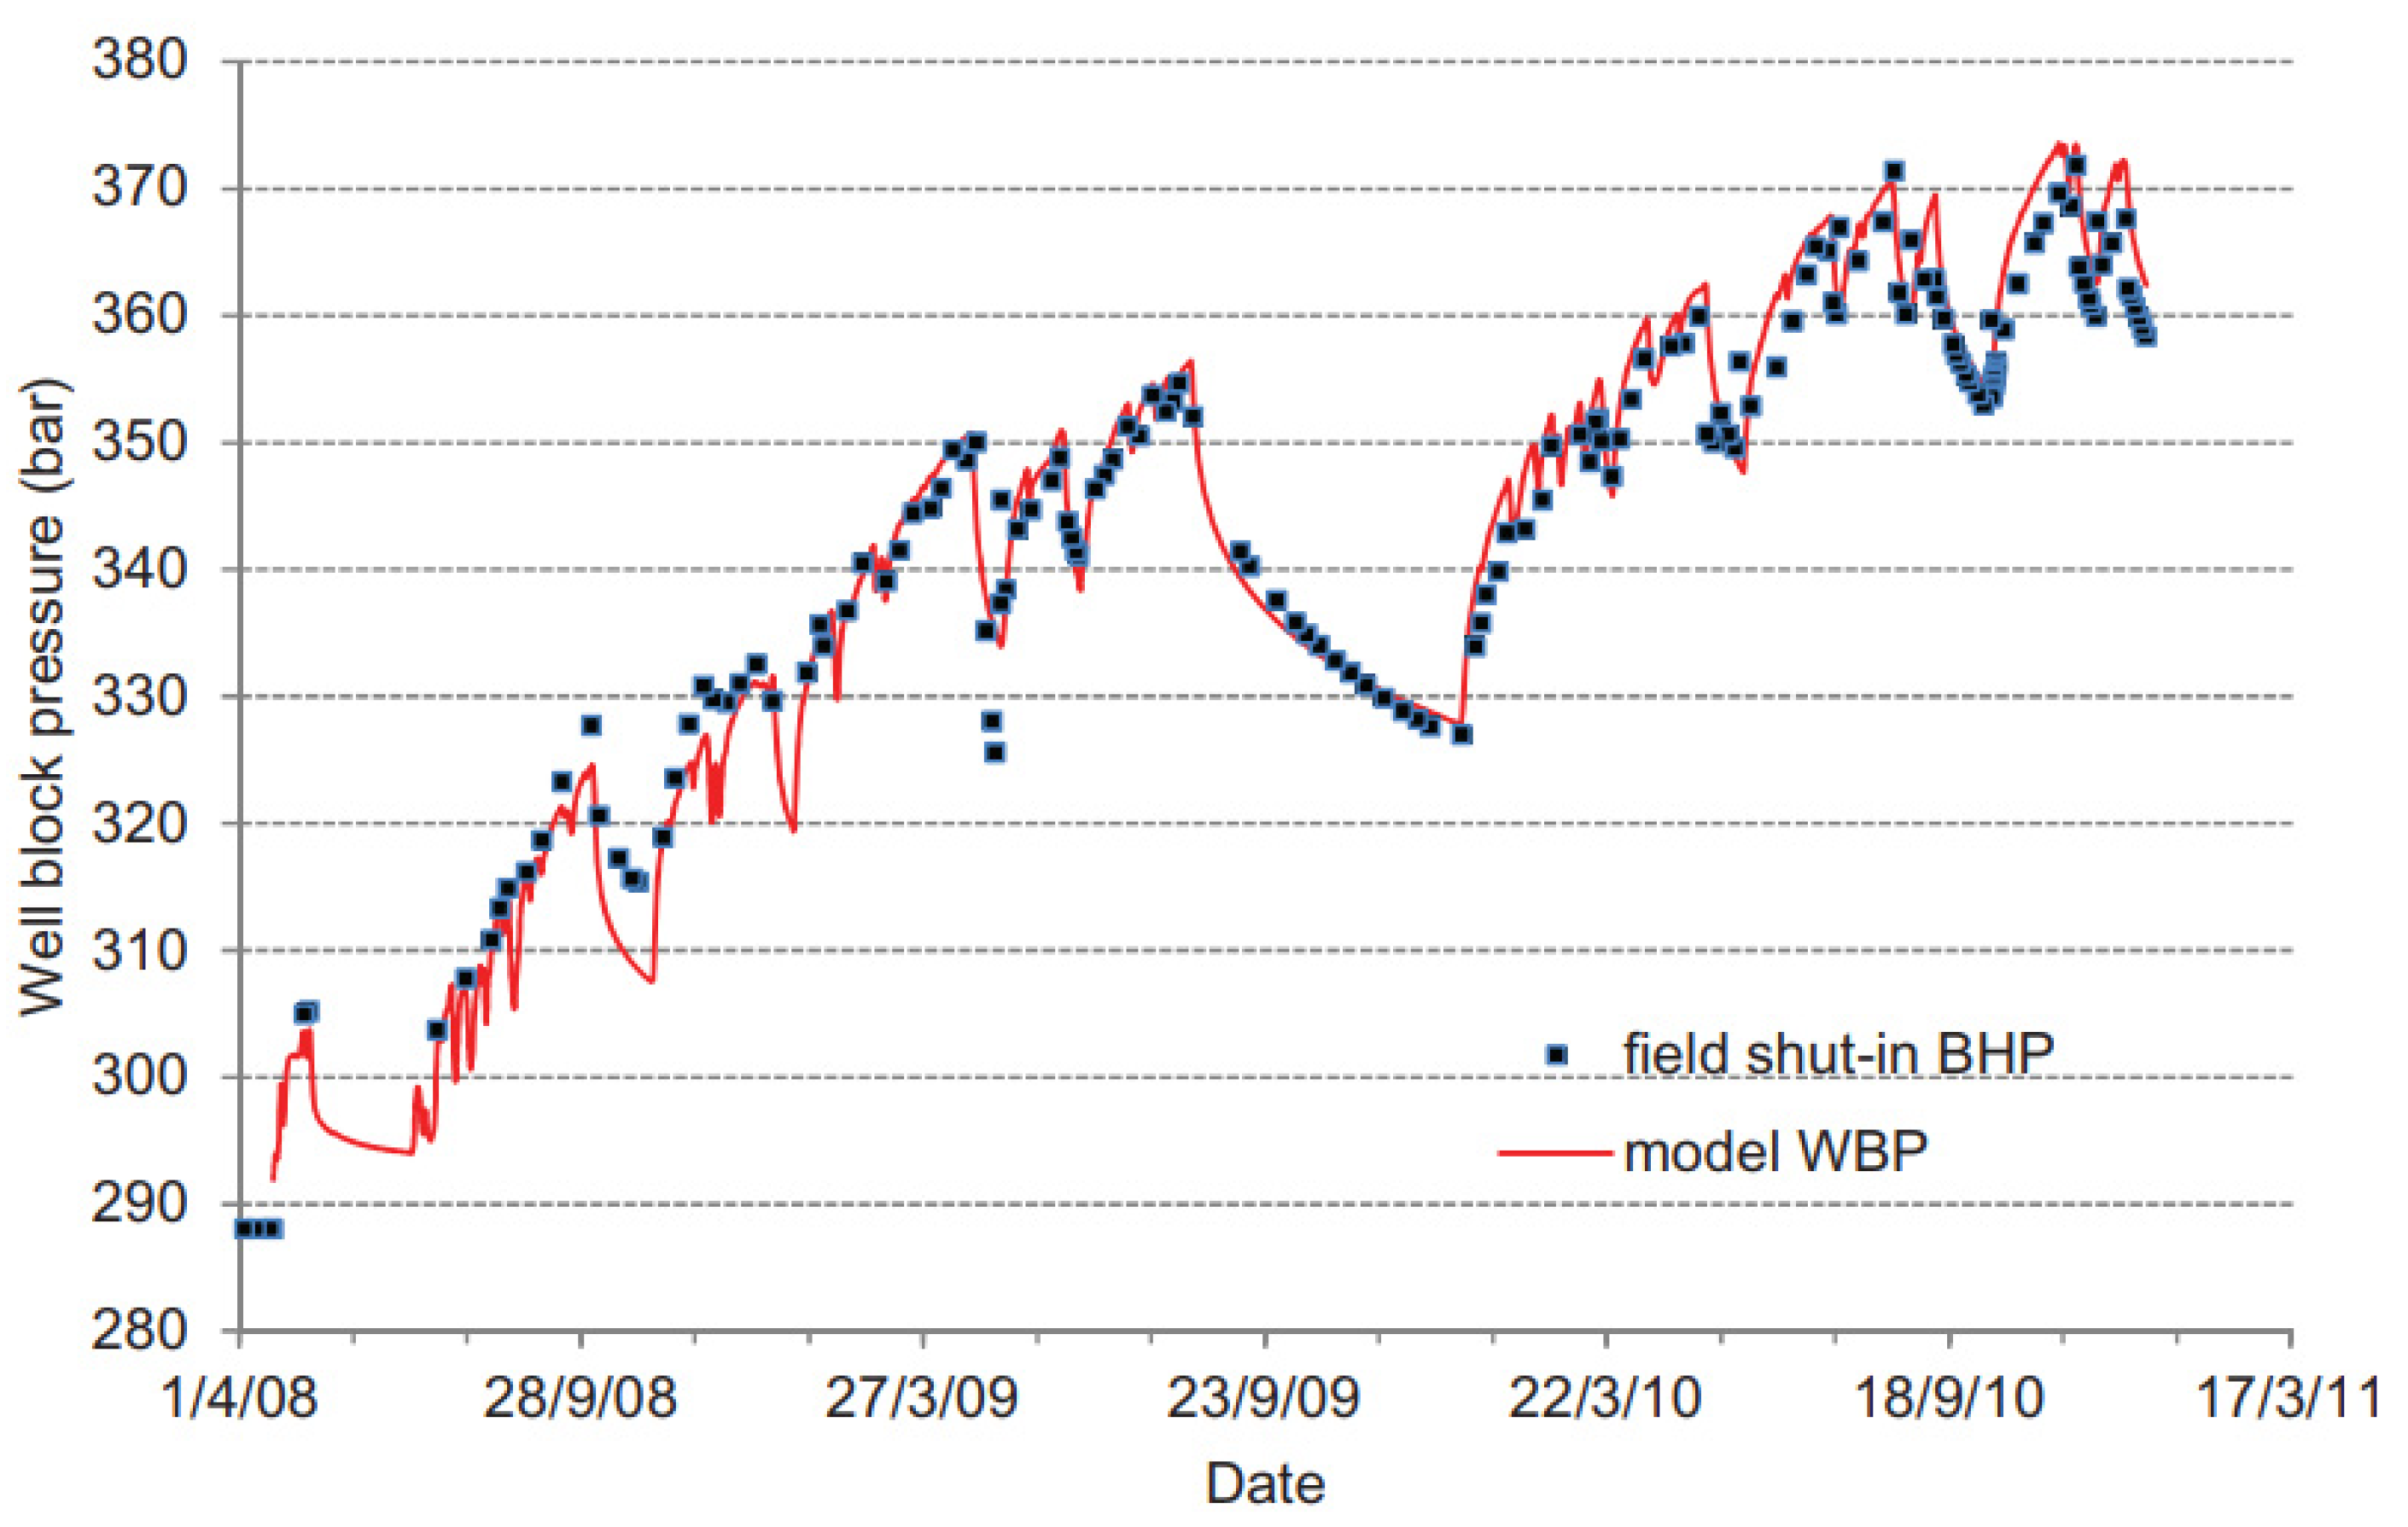
2.3.5. Simulation
3. Revelations and Outlook
3.1. Implications
3.2. Outlook
4. Conclusions
Author Contributions
Funding
Conflicts of Interest
References
- Lau, H.C.; Ramakrishna, S.; Zhang, K.; Radhamani, A.V. The Role of Carbon Capture and Storage in the Energy Transition. Energy Fuels 2021, 35, 7364–7386. [Google Scholar] [CrossRef]
- Bachu, S. Review of CO2 storage efficiency in deep saline aquifers. Int. J. Greenh. Gas Control 2015, 40, 188–202. [Google Scholar]
- IEA. Energy Technology Perspectives 2020—Special Report on Clean Energy Innovation; OECD Publishing: Paris, France, 2020. [Google Scholar] [CrossRef]
- Changwen, Q.; Gang, X.; Jianfeng, W.; Yinghong, L. A REVIEW of CO2 storage technology and perspective of CO2 storage in the nearshore area of south China. Mar. Geol. Front. 2012, 28, 40–45. [Google Scholar]
- Anderson, S.T. Risk, Liability, and Economic Issues with Long-Term CO2 Storage—A Review. Nat. Resour. Res. 2017, 26, 89–112. [Google Scholar]
- Cao, K.; Wu, L.; Wang, J.; Sun, J.; Sun, J. Progress and perspective of marine geological carbon storage in China. Geol. Surv. China 2023, 10, 72–76. [Google Scholar]
- IPCC. Global Warming of 1.5 °C. Intergovernmental Panel on Climate Change. 2018. Available online: https://www.ipcc.ch/sr15 (accessed on 20 August 2024).
- Field, C.B.; Mach, K. Rightsizing carbon dioxide removal. Science 2017, 356, 706–707. [Google Scholar] [CrossRef]
- Hepburn, C.; Adlen, E.; Beddington, J.; Carter, E.A.; Fuss, S.; Mac Dowell, N.; Minx, J.C.; Smith, P.; Williams, C.K. The technological and economic prospects for CO2 utilization and removal. Nature 2019, 575, 87–97. [Google Scholar] [CrossRef]
- Fuhrman, J.; McJeon, H.; Patel, P.; Doney, S.C.; Shobe, W.M.; Clarens, A.F. Food–energy–water implications of negative emissions technologies in a +1.5 °C future. Nat. Clim. Chang. 2020, 10, 920–927. [Google Scholar] [CrossRef]
- De Silva GP, D.; Ranjith, P.G.; Perera, M.S.A. Geochemical aspects of CO2 sequestration in deep saline aquifers: A review. Fuel 2015, 155, 128–143. [Google Scholar] [CrossRef]
- Holloway, S. Underground sequestration of carbon dioxide—A viable greenhouse gas mitigation option. Energy 2005, 30, 2318–2333. [Google Scholar] [CrossRef]
- Izgec, O.; Demiral, B.; Bertin, H.; Akin, S. CO2 injection into saline carbonate aquifer formations I: Laboratory investigation. Transp. Porous Media 2008, 72, 1–24. [Google Scholar] [CrossRef]
- Zhang, W.; Li, Y.; Omambia, A.N. Reactive transport modeling of effects of convective mixing on long-term CO2 geological storage in deep saline formations. Int. J. Greenh. Gas Control 2011, 5, 241–256. [Google Scholar] [CrossRef]
- Mi, L. Current status of global CO2 ocean sequestration and opportunities and challenges in China offshore areas. China Offshore Oil Gas 2023, 35, 123–135. [Google Scholar]
- Li, Q.; Wu, Z.; Li, X. Prediction of CO2 leakage during sequestration into marine sedimentary strata. Energy Convers. Manag. 2009, 50, 503–509. [Google Scholar] [CrossRef]
- Wu, L.; Zhang, T.; Sui, Y.; Xu, J. International experience and enlightenment of the development of carbon dioxide geological storage in the sea area. Nat. Resour. Econ. China 2023, 36, 59–66,81. [Google Scholar]
- Zhang, H.; Lu, D.; Wang, Y.; Tian, W.; Song, X.; Sun, N. Development and prospect of CO2 leakage monitoring during offshore geological storage. Environ. Eng. 2023, 41, 61–68. [Google Scholar]
- Urre, A.-K.; Eiken, O.; Alnes, H.; Vevatne, J.N.; Kiær, A.F. 20 Years of Monitoring CO2-injection at Sleipner. Energy Procedia 2017, 114, 3916–3926. [Google Scholar]
- Zhao, J.; Zheng, J.; Ren, L.; Lin, R.; Zhou, B. Research progress and development trend of marine CO2 geological storage. Pet. Geol. Oilfield Dev. Daqing 2024, 43, 1–13. [Google Scholar]
- Zhu, C.; Zhang, G.; Lu, P.; Meng, L.; Ji, X. Benchmark modeling of the Sleipner CO2 plume: Calibration to seismic data for the uppermost layer and model sensitivity analysis. Int. J. Greenh. Gas Control 2015, 43, 233–246. [Google Scholar] [CrossRef]
- Torp, T.A.; Gale, J. Demonstrating storage of CO2 in geological reservoirs: The Sleipner and SACS projects. Energy 2004, 29, 1361–1369. [Google Scholar] [CrossRef]
- Cavanagh, A.J.; Haszeldine, R.S. The Sleipner storage site: Capillary flow modeling of a layered CO2 plume requires fractured shale barriers within the Utsira Formation. Int. J. Greenh. Gas Control 2014, 21, 101–112. [Google Scholar] [CrossRef]
- Hermanrud, C.; Andresen, T.; Eiken, O.; Hansen, H.; Janbu, A.; Lippard, J.; Bolås, H.N.; Simmenes, T.H.; Teige, G.M.G.; Østmo, S. Storage of CO2 in saline aquifers–Lessons learned from 10 years of injection into the Utsira Formation in the Sleipner area. Energy Procedia 2009, 1, 1997–2004. [Google Scholar] [CrossRef]
- Cowton, L.; Neufeld, J.; White, N.; Bickle, M.; Williams, G.; White, J.; Chadwick, R. Benchmarking of vertically-integrated CO2 flow simulations at the Sleipner Field, North Sea. Earth Planet. Sci. Lett. 2018, 491, 121–133. [Google Scholar] [CrossRef]
- Akai, T.; Kuriyama, T.; Kato, S.; Okabe, H. Numerical modelling of long-term CO2 storage mechanisms in saline aquifers using the Sleipner benchmark dataset. Int. J. Greenh. Gas Control 2021, 110, 103405. [Google Scholar] [CrossRef]
- Zhou, Y.; Wang, R.; He, Y.; Zhao, S.; Zhou, Y.; Zhang, Y. Analysis and comparison of typical cases of CO2 geological storage in saline aquifer. Pet. Geol. Recovery Effic. 2023, 30, 162–167. [Google Scholar]
- Arts, R.; Chadwick, A.; Eiken, O.; Zweigel, P. Interpretation of the 1999 and 2001 Time-Lapseseismic Data (WP 5.4); Institute of Applied Geoscience TNO: Utrecht, The Netherlands, 2003. [Google Scholar]
- Chadwick, R.; Zweigel, P.; Gregersen, U.; Kirby, G.; Holloway, S.; Johannessen, P. Geological reservoir characterization of a CO2 storage site: The Utsira Sand, Sleipner, northern North Sea. Energy 2004, 29, 1371–1381. [Google Scholar] [CrossRef]
- Ahmadinia, M.; Shariatipour, S.M. Analysing the role of caprock morphology on history matching of Sleipner CO2 plume using an optimisation method. Greenh. Gases Sci. Technol. 2020, 10, 1077–1097. [Google Scholar] [CrossRef]
- Hansen, H.; Eiken, O.; Aasum, T.O. Tracing the Path of Carbon Dioxide from a Gas-condensate Reservoir. In Proceedings of the an Amine Plant and Back into a Subsurface Acquifer—Case Study: The Sleipner Area, Norwegian North Sea, Offshore Europe, Aberdeen, UK, 6–9 September 2005. [Google Scholar]
- Qi, L.; Yanzun, L.; Xiaoyi, X.; Xiaochun, L.; Guizhen, L.; Hang, Y.; Yongsheng, T. Current Status and Recommendations of Offshore CO2 Geological Storage Monitoring. J. Univ. Geol. 2023, 29, 1–12. [Google Scholar]
- Eiken, O.; Ringrose, P.; Hermanrud, C.; Nazarian, B.; Torp, T.A.; Høier, L. Lessons learned from 14 years of CCS operations: Sleipner, In Salah and Snøhvit. Energy Procedia 2011, 4, 5541–5548. [Google Scholar] [CrossRef]
- Wang, Z.; Liu, Q.; Ye, H.; Zhang, M.; Liu, S.; Weng, Y. Research progress on CO2 geological storage leakage and monitoring. Environ. Eng. 2023, 41, 69–81. [Google Scholar]
- Chadwick, R.A.; Noy, D.; Arts, R.; Eiken, O. Latest time-lapse seismic data from Sleipner yield new insights into CO2 plume development. Energy Procedia 2009, 1, 2103–2110. [Google Scholar] [CrossRef]
- White, J.C.; Williams, G.; Chadwick, A.; Furre, A.-K.; Kiær, A. Sleipner: The ongoing challenge to determine the thickness of a thin CO2 layer. Int. J. Greenh. Gas Control 2018, 69, 81–95. [Google Scholar]
- Zhang, G.; Lu, P.; Ji, X.; Zhu, C. CO2 Plume Migration and Fate at Sleipner, Norway: Calibration of Numerical Models, Uncertainty Analysis, and Reactive Transport Modelling of CO2 Trapping to 10,000 Years. Energy Procedia 2017, 114, 2880–2895. [Google Scholar]
- Chadwick, R.A.; Noy, D. History-matching flow simulations and time-lapse seismic data from the Sleipner CO2 plume. Geol. Soc. Lond. Pet. Geol. Conf. Ser. 2011, 7, 1171–1182. [Google Scholar]
- Boait, F.C.; White, N.J.; Bickle, M.J.; Chadwick, R.A.; Neufeld, J.A.; Huppert, H.E. Spatial and temporal evolution of injected CO2 at the Sleipner Field, North Sea. J. Geophys. Res. Solid Earth 2012, 117, B03309. [Google Scholar] [CrossRef]
- Lumley, D. 4D seismic monitoring of CO2 sequestration. Lead. Edge 2010, 29, 150–155. [Google Scholar]
- Chadwick, R.; Arts, R.; Eiken, O.; Kirby, G.A.; Lindeberg, E.; Zweigel, P.; Davies, R.J.; Cartwright, J.A.; Stewart, S.A.; Lappin, M.; et al. 4D Seismic Imaging of an Injected C02 Plume at the Sleipner Field, Central North Sea. Geol. Soc. Lond. Mem. 2007, 29, 311–320. [Google Scholar] [CrossRef]
- Zhang, G.; Lu, P.; Zhu, C. Model Predictions via History Matching of CO2 Plume Migration at the Sleipner Project, Norwegian North Sea. Energy Procedia 2014, 63, 3000–3011. [Google Scholar]
- Ringrose, P.S. The CCS hub in Norway: Some insights from 22 years of saline aquifer storage. Energy Procedia 2018, 146, 166–172. [Google Scholar]
- Arts, R.; Eiken, O.; Chadwick, A.; Zweigel, P.; van der Meer, L.; Zinszner, B. Monitoring of CO2 injected at Sleipner using time-lapse seismic data. Energy 2004, 29, 1383–1392. [Google Scholar]
- Zheng, Z. Numerical Simulation of CO2/Brine Core Displacement in Porous Media. Master’s Thesis, Dalian University of Technology, Dalian, China, 2018. [Google Scholar]
- Zhu, P. Review on CO2 geological storage in saline formations. Clean Coal Technol. 2021, 27, 33–38. [Google Scholar]
- Lindeberg, E.; Zweigel, P. Prediction of CO2 dispersal pattern improved by geology and reservoir simulation and verified by time lapse seismic. In Proceedings of the International Conference on Greenhouse Gas Control Technologies, Cairns, Australia, 13–16 August 2000. [Google Scholar]
- Zweigel, P.; Arts, R.; Lothe, A.E.; Lindeberg, E.B.G. Reservoir geology of the Utsira Formation at the first industrial-scale underground CO2 storage site (Sleipner area, North Sea). Geol. Soc. Lond. Spec. Publ. 2007, 233, 165–180. [Google Scholar]
- Tanaka, Y.; Abe, M.; Sawada, Y.; Tanase, D.; Ito, T.; Kasukawa, T. Tomakomai CCS Demonstration Project in Japan, 2014 Update. Energy Procedia 2014, 63, 6111–6119. [Google Scholar] [CrossRef]
- Tanaka, Y.; Sawada, Y.; Tanase, D.; Tanaka, J.; Shiomi, S.; Kasukawa, T. Tomakomai CCS Demonstration Project of Japan, CO2 Injection in Process. Energy Procedia 2017, 114, 5836–5846. [Google Scholar]
- Tanase, D.; Tanaka, J. Progress of CO2 Injection and Monitoring of the Tomakomai CCS Demonstration Project. SSRN Electron. J. 2021. [Google Scholar] [CrossRef]
- Tanase, D.; Sasaki, T.; Yoshii, T.; Motohashi, S.; Sawada, Y.; Aramaki, S.; Yamanouchi, Y.; Tanaka, T.; Ohkawa, S.; Inowaki, R. Tomakomai CCS Demonstration Project in Japan. Energy Procedia 2013, 37, 6571–6578. [Google Scholar] [CrossRef]
- Bi, J. Numerical simulation of CO2 storage in saline aquifers in the North Yellow Sea Basin. Ph.D. Thesis, Dalian University of Technology, Dalian, China, 2023. [Google Scholar]
- Sawada, Y.; Tanaka, J.; Suzuki, C.; Tanase, D.; Tanaka, Y. Tomakomai CCS Demonstration Project of Japan, CO2 Injection in Progress. Energy Procedia 2018, 154, 3–8. [Google Scholar] [CrossRef]
- Ito, D.; Matsuura, T.; Kamon, M.; Kawada, K.; Nishimura, M.; Tomita, S.; Katoh, A.; Akaku, K.; Inamori, T.; Yamanouchi, Y.; et al. Reservoir evaluation for the Moebetsu formation at Tomakomai candidate Site for CCS demonstration project in Japan. Energy Procedia 2013, 37, 4937–4945. [Google Scholar] [CrossRef]
- Fujita, C.; Hiratsuka, Y.; Yamamoto, H.; Nakajima, T.; Xue, Z. Numerical Simulation Study on Mitigation of the Pressure Build-up in the Geological Formation During Injection of CO2. Energy Procedia 2017, 114, 4765–4774. [Google Scholar]
- Chiaramonte, L.; White, J.A.; Trainor-Guitton, W. Probabilistic geomechanical analysis of compartmentalization at the Snøhvit CO2 sequestration project. J. Geophys. Res. Solid Earth 2015, 120, 1195–1209. [Google Scholar] [CrossRef]
- Sugihara, M.; Nishi, Y.; Ikeda, H.; Nawa, K.; Ishido, T. Monitoring CO2 Injection at the Tomakomai Field Using High-sensitivity Continuous Gravimetry. Energy Procedia 2017, 114, 4020–4027. [Google Scholar] [CrossRef]
- Tanaka, J. Tomakomai CCS Demonstration Project Key Results and Future Outlook; 2022. Available online: https://www.jccs-tomakomai-monitoring.com/JCCS/wp-content/uploads/2022/07/202207_ENG.pdf (accessed on 24 August 2024).
- Meckel, T.; Feng, Y.; Treviño, R.; Sava, D. High-resolution 3D marine seismic acquisition in the overburden at the Tomakomai CO2 storage project, offshore Hokkaido, Japan. Int. J. Greenh. Gas Control 2019, 88, 124–133. [Google Scholar] [CrossRef]
- Mabon, L.; Shackley, S.; Bower-Bir, N. Perceptions of sub-seabed carbon dioxide storage in Scotland and implications for policy: A qualitative study. Mar. Policy 2014, 45, 9–15. [Google Scholar] [CrossRef]
- Turrell, W.R.; Berx, B.; Bresnan, E.; León, P.; Rouse, S.; Webster, L.; Walsham, P.; Wilson, J.; Wright, P. A Review of National Monitoring Requirements to Support Offshore Carbon Capture and Storage. Front. Mar. Sci. 2022, 9, 838309. [Google Scholar] [CrossRef]
- Maldal, T.; Tappel, I.M. CO2 underground storage for Snøhvit gas field development. Energy 2004, 29, 1403–1411. [Google Scholar] [CrossRef]
- Zhang, H.; Lu, D.; Xiong, J. Progress and Inspiration of Marine CO2 Storage at Home and Abroad. China Resour. Compr. Util. 2023, 41, 166–169. [Google Scholar]
- Michael, K.; Golab, A.; Shulakova, V.; Ennis-King, J.; Allinson, G.; Sharma, S.; Aiken, T. Geological storage of CO2 in saline aquifers—A review of the experience from existing storage operations. Int. J. Greenh. Gas Control 2010, 4, 659–667. [Google Scholar] [CrossRef]
- Trémosa, J.; Castillo, C.; Vong, C.Q.; Kervévan, C.; Lassin, A.; Audigane, P. Long-term assessment of geochemical reactivity of CO2 storage in highly saline aquifers: Application to Ketzin, In Salah and Snøhvit storage sites. Int. J. Greenh. Gas Control 2014, 20, 2–26. [Google Scholar] [CrossRef]
- Pawar, R.J.; Bromhal, G.S.; Carey, J.W.; Foxall, W.; Korre, A.; Ringrose, P.S.; Tucker, O.; Watson, M.N.; White, J.A. Recent advances in risk assessment and risk management of geologic CO2 storage. Int. J. Greenh. Gas Control 2015, 40, 292–311. [Google Scholar] [CrossRef]
- Buscheck, T.A.; White, J.A.; Carroll, S.A.; Bielicki, J.M.; Aines, R.D. Managing geologic CO2 storage with pre-injection brine production: A strategy evaluated with a model of CO2 injection at Snøhvit. Energy Procedia 2016, 9, 154–1512. [Google Scholar]
- Wildenborg, T.; Chadwick, A.; Deflandre, J.-P.; Eiken, O.; Mathieson, A.; Metcalfe, R.; Hattenberger, C.S.; Wollenweber, J. Key Messages from Active CO2 Storage Sites. Energy Procedia 2013, 37, 6317–6325. [Google Scholar] [CrossRef]
- Pham TH, V.; Maast, T.E.; Hellevang, H.; Aagaard, P. Numerical modeling including hysteresis properties for CO2 storage in Tubåen formation, Snøhvit field, Barents Sea. Energy Procedia 2011, 4, 3746–3753. [Google Scholar] [CrossRef]
- Grude, S.; Landrø, M.; Dvorkin, J. Pressure effects caused by CO2 injection in the Tubåen Fm., the Snøhvit field. Int. J. Greenh. Gas Control 2014, 27, 178–187. [Google Scholar] [CrossRef]
- Shi, J.-Q.; Imrie, C.; Sinayuc, C.; Durucan, S.; Korre, A.; Eiken, O. Snøhvit CO2 Storage Project: Assessment of CO2 Injection Performance Through History Matching of the Injection Well Pressure over a 32-months Period. Energy Procedia 2013, 37, 3267–3274. [Google Scholar] [CrossRef]
- White, J.C.; Williams, G.; Chadwick, A. Seismic amplitude analysis provides new insights into CO2 plume morphology at the Snøhvit CO2 injection operation. Int. J. Greenh. Gas Control 2018, 79, 313–322. [Google Scholar] [CrossRef]


Disclaimer/Publisher’s Note: The statements, opinions and data contained in all publications are solely those of the individual author(s) and contributor(s) and not of MDPI and/or the editor(s). MDPI and/or the editor(s) disclaim responsibility for any injury to people or property resulting from any ideas, methods, instructions or products referred to in the content. |
© 2024 by the authors. Licensee MDPI, Basel, Switzerland. This article is an open access article distributed under the terms and conditions of the Creative Commons Attribution (CC BY) license (https://creativecommons.org/licenses/by/4.0/).
Share and Cite
Li, L.; Liu, Y.; Li, Y.; Wang, Z.; Guo, K.; Ma, Q.; Cui, Y.; Liu, K.; Chen, C. Overview of Typical Projects for Geological Storage of CO2 in Offshore Saline Aquifers. Liquids 2024, 4, 744-767. https://doi.org/10.3390/liquids4040042
Li L, Liu Y, Li Y, Wang Z, Guo K, Ma Q, Cui Y, Liu K, Chen C. Overview of Typical Projects for Geological Storage of CO2 in Offshore Saline Aquifers. Liquids. 2024; 4(4):744-767. https://doi.org/10.3390/liquids4040042
Chicago/Turabian StyleLi, Lintao, Yuming Liu, Yanzun Li, Ziyi Wang, Kai Guo, Qianli Ma, Yingying Cui, Kaibang Liu, and Cong Chen. 2024. "Overview of Typical Projects for Geological Storage of CO2 in Offshore Saline Aquifers" Liquids 4, no. 4: 744-767. https://doi.org/10.3390/liquids4040042
APA StyleLi, L., Liu, Y., Li, Y., Wang, Z., Guo, K., Ma, Q., Cui, Y., Liu, K., & Chen, C. (2024). Overview of Typical Projects for Geological Storage of CO2 in Offshore Saline Aquifers. Liquids, 4(4), 744-767. https://doi.org/10.3390/liquids4040042