Abstract
Impairment of the intestinal epithelial barrier, accompanied by local and systemic inflammation, underlies numerous human pathologies, including inflammatory bowel diseases, celiac disease, sepsis, as well as severe acute malnutrition. Bifidobacterium longum subsp. infantis and Lacticaseibacillus rhamnosus GG (LGG®) have been shown in preclinical studies to strengthen the gut epithelial barrier and attenuate inflammation. This study aimed to compare the ability of four commercial strains of B. infantis, LGG, and their combination to mitigate inflammation-mediated epithelial damage using an in vitro immunocompetent intestinal model. A microfluidic mid-throughput platform OrganoPlate® was used to co-culture intestinal epithelial cells (Caco-2) with peripheral blood mononuclear cells (PBMCs). Epithelial damage was induced by stimulating PBMCs with lipopolysaccharide (LPS), and probiotic-conditioned media were applied to the apical side of Caco-2 cells to assess effects on barrier integrity, cytokine secretion, and gene transcription. All tested probiotics significantly protected the epithelium by modulating tight junction protein expression and promoting transcription of homeostatic cytokines, resulting in a “leak-tight” phenotype. These findings indicate that metabolites produced by B. infantis and/or LGG can protect the intestinal epithelium in vitro, warranting further in vivo studies to evaluate the translational relevance of this effect.
1. Introduction
The intestinal epithelial cells (IECs) are tightly interconnected, forming a selective barrier that plays a crucial role in nutrient absorption and in protecting the host from the vast community of microorganisms (microbiota) residing in the intestinal lumen. Disruption of this barrier—often referred to as the “leaky gut” phenomenon—is implicated in a wide range of human pathologies, including inflammatory bowel disease (IBD), irritable bowel syndrome (IBS), sepsis, celiac disease, and others. A healthy gut microbiota helps maintain the integrity of this barrier avoiding unnecessary activation of the host immune system [1,2,3,4].
In infants, the gut microbiota is typically dominated by Bifidobacterium species, which contribute to essential metabolic and developmental functions, including immune system maturation, host metabolism, and colonization resistance to enteric pathogens [4,5,6,7,8]. Conversely, gut dysbiosis—an imbalance in microbial composition marked by overrepresentation of potentially pathogenic taxa—has been associated with persistent pathophysiological and immune abnormalities. Such dysbiosis may contribute to nutrient malabsorption, underweight, and failure to thrive in infants [9,10]. Mechanistically, severe acute malnutrition is linked to enteropathy characterized by disruption of epithelial tight junctions and increased gut permeability, leading to both intestinal and systemic inflammation [11].
Recent clinical evidence demonstrates that oral supplementation with Bifidobacterium longum subsp. infantis (B. infantis) can improve weight gain in malnourished infants in Bangladesh [12]. Similarly, Lacticaseibacillus (lactobacillus) rhamnosus GG (LGG®, Chr. Hansen A/S), alone or in combination with Bifidobacterium animalis, has been shown to reduce the incidence [13] and duration [14,15] of diarrhea. The beneficial effects of B. infantis and LGG have been attributed to their immunomodulatory and homeostatic properties, supported by both in vitro [16,17,18,19,20,21] and in vivo [22,23,24] studies. The contribution of Bifidobacteria—particularly B. infantis—to infant health largely depends on their ability to metabolize human milk oligosaccharides (HMOs) [25,26,27].
In this study, we aimed to compare the functional properties of several commercial strains of B. infantis, as well as potential efficacy superiority in combination with LGG (Table S1). All strains were cultured in a medium supplemented with two abundant HMOs found in human breast milk: 2′-Fucosyllactose (2′-FL) and Lacto-N-tetraose (LNT) [28]. When selecting strains and their combinations for clinical use, standard in vitro models—typically based on a single cell type—lack the complexity of the physiological environment, while in vivo models are costly, require ethical approval, and often fail to recapitulate human responses (reviewed in [29]). To overcome these limitations, we employed an “intestine-on-a-chip” approach that integrates epithelial and immune cells under fluidic conditions. This configuration mimics physiological shear stress, promoting epithelial differentiation and more accurately modeling intestinal inflammation [30,31]. Using a mid-throughput microfluidic device (OrganoPlate®, Mimetas B.V.) [32], we established an immunocompetent model of intestinal epithelial inflammation. The device allows rapid maturation of a leak-tight IEC (Caco-2) monolayer in one channel, while the opposing channel—separated by an extracellular matrix [33,34]—is populated with human PBMCs. Upon stimulation with Escherichia coli LPS, PBMCs secreted pro-inflammatory cytokines, compromising epithelial barrier integrity. We demonstrate that the supernatants derived from the tested probiotic strains mitigated this inflammation-mediated epithelial barrier damage via modulation of Caco-2 gene transcription related to tight junction complex formation and homeostatic cytokine expression.
2. Materials and Methods
2.1. PBMC Sourcing
Human peripheral blood samples were collected at the Clinical Investigation Center INVOLvE (Investigation and Volunteers for Human Health) of the Pasteur Institute from adult volunteers with no history of chronic inflammatory or autoimmune disorders, and no acute infectious disease at the time of sampling. Participants had not received any antimicrobial, antihistaminic, or anti-inflammatory treatment within the four weeks preceding the sampling. The participants’ age and sex are provided in Table S2.
All participants received both oral and written information about the study and provided written informed consent as part of the healthy volunteer COSIPOP cohort. The study protocol was approved by the Est II Ethics Committee (20 February 2023).
2.2. Mammalian Cells
The human colon adenocarcinoma cell line Caco-2/TC-7 (Caco-2) (Sigma-Aldrich, Saint Louis, MO, USA) was used between passages 2 and 12. Cells were cultured in complete Minimum Essential Medium (MEM; Gibco™, Thermo Fisher Scientific, Inc., Waltham, MA, USA) supplemented with 10% fetal bovine serum (FBS; Gibco), 1% sodium pyruvate (Gibco, Waltham, MA, USA), 1% non-essential amino acids (NEAA; Gibco), and 1% penicillin–streptomycin (Sigma-Aldrich). Cultures were maintained at 37 °C in a humidified atmosphere containing 5% CO2.
PBMCs were isolated from human blood using Ficoll-Paque™ PLUS (Cytiva, Marlborough, MA, USA) according to the manufacturer’s instructions. Briefly, whole blood was diluted 1:1 with phosphate-buffered saline (PBS) and layered over the Ficoll solution, followed by centrifugation at room temperature for 30 min at 400× g with no brake. The interphase containing PBMCs was carefully collected and washed twice in PBS by centrifugation at 600× g and then at 450× g for 10 min each. PBMCs were resuspended at a concentration of 1 × 10⁶ cells/mL in RPMI medium (Sigma-Aldrich) supplemented with 10% FBS (Gibco) and 1% penicillin–streptomycin (Sigma-Aldrich).
2.3. OrganoPlate Seeding, PBMC Activation and Experiment Organization
Epithelial tubule formation by Caco-2 cells in the three-lane OrganoPlate® (Mimetas B.V., Oegstgeest, The Netherlands) was performed as previously described [35]. Briefly, 2 × 10⁴ Caco-2 cells were seeded against a pH-buffered 4 mg/mL collagen I gel (rat tail collagen I; R&D Systems, Minneapolis, MN, USA) within the 400 μm three-lane OrganoPlate®. Cells were allowed to attach against the gel for 4 h at 37 °C in a humidified atmosphere containing 5% CO2. Following attachment, complete MEM medium was added to the inlets and outlets, and the plate was placed on an interval rocker (Perfusion Rocker; Mimetas) alternating between +7° and −7° inclination every 8 min to generate bidirectional flow under continuous perfusion (37 °C, 5% CO2). The culture medium was replaced on day 4 after seeding.
On day 5, 1 × 10⁵ PBMCs were prepared in RPMI medium either left unstimulated or stimulated with a LPS mix consisting of three Escherichia coli strains (Sigma-Aldrich; L2637, 3012, and 3137) at 100 ng/mL each (300 ng/mL total). This LPS mixture has been previously shown to induce robust activation of innate immune cells [35]. The PBMC suspensions were then loaded into the Basal channels of the OrganoPlates (see Graphical Abstract).
Transepithelial electrical resistance (TEER) was measured daily for three consecutive days to monitor epithelial barrier integrity. Following the final TEER measurement, media from each channel were collected for cytokine analysis, and Caco-2 cells were lysed for RNA extraction and subsequent gene expression analysis, as described below.
2.4. Immunofluorescent Microscopy Imaging
At the experimental endpoint, all cell cultures were fixed in 4% paraformaldehyde (VWR, 100504-858) prepared in DPBS containing calcium and magnesium (+Ca/+Mg; Gibco, 14040-083) for 30 min at room temperature. Cell membranes were then permeabilized with 0.1% Triton X-100 solution (in DPBS) for 20 min and blocked with 2% bovine serum albumin (BSA; Sigma, A2153) in DPBS for 1 h.
Primary antibodies against ZO-1 (Invitrogen, 61-7300; AB_138452, Carlsbad, CA, USA) and Villin (BD Biosciences, 610358; AB_397748, Franklin Lakes, NJ, USA) were diluted in 2% BSA/DPBS and incubated overnight at 4 °C. After washing, secondary antibodies (Invitrogen, A-21429; AB_2535850 and Jackson ImmunoResearch, 315-606-046; AB_2340251), DAPI (Invitrogen, D1306), and Phalloidin (Sigma, P5282) were diluted in 2% BSA/DPBS and applied for 2 h at room temperature. Cell cultures were rinsed thoroughly with DPBS before imaging.
Unless otherwise specified, all steps were performed on-chip and at room temperature. Confocal immunofluorescence imaging was conducted using a spinning-disk confocal microscope (Andor BC34 CF) equipped with a 20× air objective (numerical aperture = 0.8). Z-stacks were acquired across a 200 µm range with a Z-step size of 0.3 µm. Three-dimensional image reconstructions were generated using Imaris™ V10.1.0 (Bitplane AG, Schlieren, Switzerland) software.
2.5. Bacteria Culture
Bacterial strains (listed in Table S1) were first cultured overnight on De Man–Rogosa–Sharpe (MRS) agar plates (BD). A single colony from each strain was inoculated into 5 mL of MRS broth (CondaLab, Madrid, Spain) and incubated at 37 °C under anaerobic conditions in a Bactron™ anaerobic chamber (Sheldon Manufacturing, Inc., Cornelius, OR, USA). After 24 h of growth, cultures were diluted 1:100 into 40 mL of MRS medium without dextrose, supplemented with 0.5% (w/v) 2′-fucosyllactose (2′-FL) and 0.5% (w/v) lacto-N-tetraose (LNT), both kindly provided by DSM-Firmenich (Kaiseraugst, Switzerland). All cultures were maintained under anaerobic conditions.
For the combined culture, Bifidobacterium longum subsp. infantis Bifin02™ (Chr. Hansen A/S, Hørsholm, Denmark) and Lacticaseibacillus rhamnosus GG (LGG®, Chr. Hansen A/S) pre-cultures were mixed in equal proportions (1:1) prior to inoculation. Following overnight incubation, aliquots were collected for cytometric analysis and optical density (OD) measurement, while colony-forming unit (CFU) enumeration was performed by plating on MRS agar. Sterile media aliquots were used as blanks and negative controls.
The remaining bacterial cultures were centrifuged at 10,000× g for 10 min. The pH of the clarified supernatants was measured using a FiveEasy™ pH meter (Mettler Toledo GmbH, Greifensee, Switzerland) and adjusted to pH 7.0 with NaOH. Supernatants were then sterilized through 0.22 µm MCE membrane filters (Millipore-Merck, Darmstadt, Germany) and stored at −80 °C. Bacterial pellets from Bifin02™, LGG, and their combination were washed in sterile PBS, centrifuged again at 10,000× g for 10 min, and stored at −80 °C for subsequent qPCR analysis.
2.6. Lectin-Based Discrimination of Bacteria Strain in Mixture
Bacterial culture samples of LGG, Bifin02 and their combination (“Combo”) were first quantified by flow cytometry using calibrated microsphere standards from the LIVE/DEAD™ BacLight™ Bacterial Viability and Counting Kit (Thermo Fisher Scientific) to determine absolute bacterial concentrations, following the manufacturer’s instructions.
Subsequently, a solution of Ricinus communis agglutinin I (RCA) lectin coupled to Fluorescein (Invitrogen, Carlsbad, CA, USA) was added to 3 × 10⁷ cell/mL of each bacterial suspension at a final concentration of 15 µg/mL. Samples were incubated for 20 min at room temperature, protected from light, and then centrifuged at 10,000× g for 10 min at room temperature to pellet the bacteria. Supernatants were carefully discarded, and pellets were gently resuspended in 1× phosphate-buffered saline (PBS) to remove unbound lectin.
Fluorescence measurements were performed using a BD Influx™ cell sorter (BD Biosciences) by detecting signals in the RCA fluorescence channel (Blue540_30) and forward scatter (FSC) parameters. For each sample, 20,000 events were recorded at an acquisition rate of approximately 1000 events per second. Data were analyzed using FlowJo™ software, version 10. (FLOWJO, LLC, Ashland, OR, USA).
2.7. Cytokine Secretion
Media were collected separately from Lumen and Basal channels (inlets and outlets) of the OrganoPlates and stored at −20 °C until further analysis by Luminex assay. The concentrations of CCL2, CCL20, CCL28, IFN-γ, IL-2, IL-8, TNF-α, CCL3, CCL25, CXCL10, IL-1β, IL-6, and IL-10 were quantified using a human multiplex assay (R&D Systems) according to the manufacturer’s instructions, and measurements were performed on a Bio-Plex® 200 system (Bio-Rad, Hercules, CA, USA). Only cytokines with quantifiable levels within the standard curve range are reported.
In addition, IL-8 concentration was independently measured using a human ELISA kit (R&D Systems) following the manufacturer’s protocol.
2.8. TEER Measurements
Transepithelial electrical resistance (TEER) was measured at multiple time points using an automated multichannel impedance spectrometer compatible with the OrganoPlate® (OrganoTEER™, Mimetas), following the procedure described by Beaurivage et al. [33], with slight modifications. Specifically, OrganoPlates were equilibrated at room temperature for 30 min prior to measurement.
Data acquisition and analysis were performed using OrganoTEER™ software, which automatically extracts the TEER contribution and normalizes the values to resistance units (Ω·cm2).
2.9. Metabolomic Analysis
Supernatants were extracted in water using a constant ratio of sample mass to extraction volume. Each sample was weighed, and ultrapure water with stable isotope-labeled internal standards was added at a ratio of 1:4 (wt/wt) sample to solvent. Extracts were homogenized by bead beating with ceramic beads (4 × 30 s at 30 Hz). Non-soluble material was pelleted by centrifugation at 16,000× g for 5 min at 4 °C. The supernatant was transferred to a Spin-X® centrifuge 22 μm tube filter Corning® Costar® (Corning, Inc., Corning, NY, USA) and extracts passed through (15,000× g/4 °C/5 min) ready for analysis.
Metabolite analysis was carried out by MS-Omics (Vedbæk, Denmark) using gas chromatography–mass spectrometry.
2.9.1. SCFA
Samples were acidified using hydrochloric acid, and deuterium-labeled internal standards were added. Analysis was performed in randomized order using a high-polarity Zebron™ ZB-FFAP column (Phenomenex, Inc., Torrance, CA, USA, GC Cap. Column 30 m × 0.25 mm × 0.25 µm) installed in a GC (7890B, Agilent) coupled with a quadrupole MS detector (5977B, Agilent, Santa Clara, CA, USA). The system was controlled by ChemStation™ (Agilent Technologies, Inc.). Peak areas were integrated using Skyline (24.1, MacCoss Lab Software), before quantification and curation using an in-house pipeline written in MATLAB (2022b, MathWorks). Matrix effects, carryover, noise levels, and precision were evaluated using corresponding quality control samples.
2.9.2. Tryptophan
Samples were fortified with stable isotope labelled internal standards and derivatized with methyl chloroformate using an adapted version of the protocol described by Smart et al. [36]. Analysis was performed in randomized order using a high polarity Zebron ZB-50 column GC (Cap. column 30 m × 0.25 mm × 0.25 µm) installed in a GC coupled with a quadrupole detector. The system was controlled by ChemStation. Peak areas were integrated using Skyline (24.1, MacCoss Lab Software), before curation and quantification against a ten-point external calibration curve, using an in-house pipeline written in MatLab (2022b, MathWorks). Matrix effects, carry-over, noise levels, and precision were evaluated using corresponding quality control samples.
2.9.3. Data Processing and Statistical Analysis
Peak areas are extracted using Skyline 24.1 (MacCoss Lab Software).
Univariate statistics (provided as t-tests and relative intensity fold changes) show if any single variable is significantly different between two specified treatment groups. For statistical tests, data was transformed with power transformation (Box–Cox). As this allows assuming normality of the data, t-tests were performed. The obtained p-values were corrected by Benjamini–Hochberg correction with a false positive rate of 0.05.
2.10. Gene Transcription Analysis
2.10.1. Sample Preparation
Caco-2 cells were pelleted by centrifugation, and the supernatant was discarded. Total RNA was extracted using the NucleoSpin® RNA XS kit (Macherey-Nagel GmbH, Düren, Germany) according to the manufacturer’s instructions, followed by an additional purification step with the RNA Clean & Concentrator™ kit (Zymo Research, Irvine, CA, USA). Purified RNA was eluted in 15 µL of nuclease-free water, and RNA integrity and concentration were assessed using the DNF-471 RNA (15 nt) Fragment Analyzer kit (Agilent Technologies).
Gene transcription analysis was performed on the Biomark System (Standard Biotools) using TaqMan® (Roche Molecular Systems, Inc., South San Francisco, CA, USA) chemistry. RNA samples were normalized at 1 ng/µL, reverse transcribed and pre-amplified with 18 cycles using the Preamp and Reverse Transcription kit (Standard Biotools, Singapore) following the manufacturer’s instructions. Pre-amplification was performed to ensure that there are sufficient target gene copies in each sample for equivalent distribution in all microwell of the Biomark chip. Pre-amplified samples and assays were prepared and loaded on a Biomark Integrated Fluidic Circuit (IFC) 192.24 (Standard Biotools) using the 192.24 GE Dynamic Array Reagent Kit and the TaqMan Fast Advanced Master Mix (Applied Biosystems, Waltham, MA, USA) according to the manufacturer’s instructions. TaqMan assays were obtained from the Thermo Fisher catalog. Assay IDs are listed in Table S3.
For standard curve analysis and calculation of assay efficiencies a pool of seven samples representing all sample groups of the experiment was prepared and processed in parallel to the samples. After pre-amplification, the pool sample was diluted over 16 serial dilutions at 1/10th and added to the Biomark chip.
2.10.2. Standard Curves Analysis
Standard curves were used to evaluate the efficiency of each primer couple based on modeling Ct values against the 10-log concentrations of standard dilutions (using sixteen 10-fold dilution points), via weighted linear regression [37]. In principle, for each primer of interest, the relationship between Cts and 10-log concentration is expected to be linear, the slope of the standard curve giving the efficiency of the tested primer. The linearity of the PCR was evaluated by the coefficient of determination R2, the linearity of the reactions being validated with R2 ≥ 0.9. Then, the amplification efficiency for each primer was calculated as Eprimer = 10(−1/slope), whereas the efficiency in percentages was calculated as Eprimer,% = (10(−1/slope) − 1)*100 [38].
Primers with Eprimer,% between 90% and 110% were validated. Primers with efficiency between 80% and 90% were analyzed but the lower efficiency was considered in the result interpretation. An efficiency lower than 80% usually indicates low abundance or even absence of the target gene in the pool. An efficiency higher than 110% is usually an indicator of the presence of inhibitors in the samples.
2.10.3. Reference Genes Selection and Normalization
Since primers’ efficiencies were not all equal to 100%, we used the Pfaffl normalization method for RT-qPCR data [39]. That relative quantification method is based on the calculation of the ratio between the expression of target genes and the expression of reference gene(s) present in all samples of interest. The reference gene(s) have to be chosen among candidate house-keeping genes, selecting those that are the most stably expressed among all samples.
To identify the most stable house-keeping genes, we used the function selectHKs of the freely available R/Bioconductor package 4.4 NormqPCR, applying the geNorm method, using a cut-off value of 0.15 for the pairwise variation Vn/Vn+1, and the minimum number of reference genes to be used for normalization was set to 2 [40].
In our case, three housekeeping genes were tested (RPLP0, B2M, GAPDH), and the reference genes selection procedure evidenced that RPLP0 and GAPDH were the most stable and relevant for normalization.
The ratio for relative expression with the Pfaffl normalization is defined as:
with
R = Etarget(Ctcalib target − Ctsamples target)/Eref(Ctcalib ref − Ctsamples ref)
Etarget: Target primer amplification efficiency;
Eref: Reference gene amplification efficiency;
Ctsamples target: Ct of the target genes in samples;
Ctsamples ref: Ct of the reference genes in samples;
Ctcalib target: Ct of the target genes in calibrator samples;
Ctcalib ref: Ct of the reference genes in calibrator samples.
The calibrator is usually a set of one or more samples used as reference. In our case, the Ctcalib was computed as the geometric mean of the Cts of all samples from the “MRS, No LPS” group.
Note that, in the case when more than one reference gene is selected, the equation denominator is considered as the geometric mean of Eref(Ctcalib ref − Ctsamples ref) among all reference genes.
2.10.4. Variance Partitioning and Confounding Effect Correction
Variance partitioning was used in this study to estimate the effect of each clinical and technical variable on normalized expression data from the gene transcription experiment, to identify confounding effect variables [41]. Based on that analysis, the extraction batch and PBMC donor effects were corrected using the removeBatchEffect function of the R/Bioconductor limma package [42].
2.11. Statistical Analysis
For each comparison considered in each dataset of interest, each assay was analyzed individually, comparing its expression in one condition compared to another. For the analysis of gene transcription data, since the confounding effects (including the donor effect) were investigated and corrected via variance partitioning, we simply used a non-parametric Wilcoxon test (the null hypothesis being that the mean expression of the considered assay was not significantly different between the two investigated conditions). For all other datasets, we used a linear fixed-effect model (function lmer of the R package lme4), to adjust for the donor effect (included as a random effect in the model). To correct for the multiple testing effect, p-values were adjusted using the Benjamini–Hochberg approach [43]. The log2-fold change (hereafter LFC) associated with the comparison was calculated as the log2 ratio of mean expression levels between the two conditions. We considered that the expression of an assay was significantly different in the two investigated conditions when the adjusted p-value was lower than 0.05.
3. Results
To better mimic the physiological disruption of epithelial barrier due to continuing inflammatory process, both epithelial and immune cells should be present in the experimental system. Therefore, we used a microfluidic device OrganoPlate consisting of 40 chips, each containing three parallel microchannels (lanes). The central lane was filled with an extracellular matrix (collagen I), forming a separation between the two adjacent channels and thereby enabling co-culture of distinct cell types while still allowing molecules to diffuse [33]. Caco-2 cells were seeded into one of the outer channels (the “Lumen” channel) and allowed to proliferate until they formed a confluent, tubule-shaped monolayer (Figure 1A). Each channel is connected to small reservoirs containing culture medium, and a gravity-driven bidirectional flow is generated by the rocking motion of the plate that forces the medium through the channel. The shear stress created by the flow promotes rapid maturation of the epithelial monolayer [31], which is demonstrated by TEER, which reached stable, elevated values by day 4 of culture (Figure 1B).
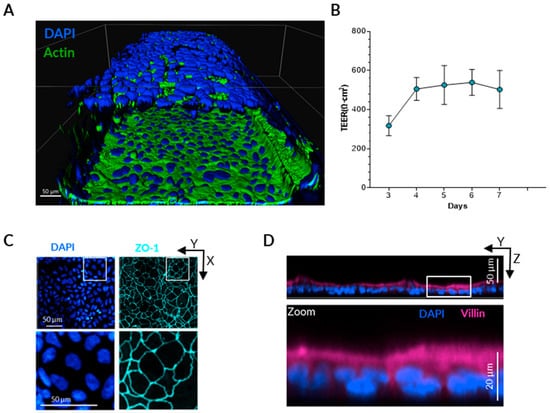
Figure 1.
Gut-on-a-chip model set-up. (A) Three-dimensional reconstruction of the epithelial tubule obtained from confocal immunofluorescence staining of nuclei (DAPI) and actin filaments, five days after Caco-2 seeding. (B) Representative time course of epithelial barrier formation assessed by TEER measurements from day 3 to day 7 in the absence of PBMCs. (C) Immunostaining of Caco-2 cells showing localization of tight junction protein Zonula Occludens-1 (ZO-1). (D) Immunostaining of Caco-2 cells showing localization of Villin at the apical surface of the epithelial monolayer.
To verify epithelial polarization and differentiation, immunofluorescence staining was performed for the tight junction protein Zonula Occludens-1 (ZO-1) and the apical cytoskeletal marker Villin. After five days of culture under shear stress, ZO-1 was localized along the contact lines between the cells (Figure 1C), whereas Villin expression was predominantly observed on the apical surface of the Caco-2 monolayer, facing the center of the channel (Figure 1D).
Once the Caco-2 monolayer reached maturity after five days in culture, human PBMCs were introduced into the opposite (Basal) channel of the OrganoPlate. To induce inflammation and provoke epithelial barrier damage, PBMCs were stimulated with Escherichia coli LPS, mimicking severe dysbiosis characterized by overgrowth of Gram-negative bacteria [44,45] and their translocation into blood circulation [46]. Cytokine and chemokine concentrations were quantified in both channels after three days of co-culture.
In the presence of non-stimulated PBMCs, we observed accumulation of IL-8, IP-10 (CXCL10), and TNF-α in the Basal channel, along with a modest increase in IL-8 in the Lumen channel (Figure 2A). Direct stimulation of PBMCs with LPS resulted in a pronounced increase in the concentration of nearly all measured cytokines in the Basal channel, consistent with a robust inflammatory response. The only exception was CXCL10 whose levels were markedly reduced in the Basal channel following LPS stimulation. In the Lumen channel, only three cytokines—CCL2, IL-6, and IL-8—were detected at quantifiable levels. Among these, IL-8 showed a minor increase in the presence of non-stimulated PBMCs, followed by a pronounced rise in both IL-8 and IL-6 concentrations upon LPS treatment.
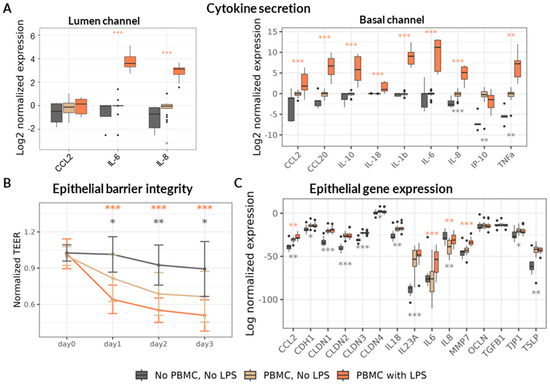
Figure 2.
Induction and monitoring of inflammation in the Gut-on-a-chip model. Asterisks denote statistical significance with p-value < 0.05 (*), p < 0.01 (**), and p < 0.001 (***), determined by either a linear fixed-effect model or a non-parametric Wilcoxon test, as detailed in the Section 2. Comparisons were made against the “PBMC, No LPS” group, with grey asterisks indicating differences relative to the “No PBMC, No LPS” condition and orange asterisks indicating differences relative to the “PBMC with LPS” condition. Data represent results from six PBMC donors across three independent experiments (N = 3), with 18 technical replicates per experimental condition (n = 18). (A) Relative changes in cytokine concentrations measured in the Lumen (left) and Basal (right) channels three days after administration of LPS-stimulated or non-stimulated PBMCs, normalized to the “PBMC, No LPS” condition. (B) TEER values over time, normalized to the “Day 0” measurement (immediately prior to PBMC addition). (C) Relative gene expression of Caco-2 cells on Day 3, normalized to the house-keeping gene expression.
Consistent with pro-inflammatory cytokine upregulation, the epithelial barrier integrity assessed by TEER decreased in the presence of PBMCs and further declined to approximately 50–60% of baseline levels following LPS stimulation (Figure 2B). The TEER differences between treatments were maintained throughout the three-day observation period, confirming sustained barrier disruption under inflammatory conditions.
In addition, we analyzed the transcriptional response of Caco-2 cells, focusing on genes encoding cytokines and chemokines involved in epithelial homeostasis and inflammation, as well as genes encoding proteins involved in epithelial barrier integrity maintenance including cell adhesion. The presence of PBMCs significantly increased the transcription of several cytokines, including both pro-inflammatory (CCL2, IL-23A) and homeostatic (IL-18, TSLP) nature (Figure 2C). PBMC presence in the Basal channel reduced the transcription of the key pro-inflammatory cytokine IL-8 and upregulated multiple genes related to epithelial barrier maintenance, including E-Cadherin (CDH1), Tight-Junction Protein 1 (TJP1/ZO-1), and members of the Claudin family proteins (CLDN-1, -2, -3, -4).
LPS stimulation of PBMC provoked upregulation only of pro-inflammatory cytokines CCL2, IL-6 and IL-8 as well of matrix metalloproteinase 7 (MMP7) known to cleave E-Cadherin [47] and degrade extracellular matrix [48] thus promoting an increase in intestinal permeability. Overall, LPS stimulation of PBMCs resulted in a marked upregulation of inflammatory cytokines and a significant decrease in TEER, indicating compromised epithelial barrier integrity. This phenotype closely mirrors a disrupted intestinal barrier exposed to a pro-inflammatory milieu as observed in severe cases of malnutrition [11].
To evaluate potential protective interventions, we first examined the effect of the supernatant derived from the B. infantis reference strain ATCC 15697 on epithelial barrier integrity using the LPS-stimulated PBMC inflammation model. Bacteria were cultured under anaerobic conditions for 24 h in medium supplemented with two abundant human milk oligosaccharides (HMOs): 2′-fucosyllactose (2′-FL)—the most prevalent HMO in “secretor” mothers, representing approximately 80% of the population—and lacto-N-tetraose (LNT), one of the dominant HMOs in “non-secretor” mothers [49,50]. Bacterial growth was assessed by optical density (OD) measurement, colony-forming unit (CFU) enumeration, and flow cytometry (Table S1). Consistent with the production of organic acids (including Lactate and short chain fatty acids—SCFA) [51,52], the pH of the culture medium decreased from 6.3 to 4.4 after 24 h of growth. The filtered and pH-neutralized bacterial supernatant was then added to the Caco-2 culture medium in the Lumen channel at final concentrations ranging from 10% to 30% (v/v), concurrently with the addition of LPS-stimulated (or non-stimulated) PBMCs to the Basal channel. Remarkably, the B. infantis ATCC 15697 supernatant mitigated the deleterious effects of LPS-stimulated PBMCs on epithelial barrier integrity in a dose-dependent manner, fully preserving TEER at the 30% concentration. This protective effect remained stable for three days (Figure 3). Consequently, the 30% (v/v) concentration was used for all subsequent experiments with other probiotic strains.
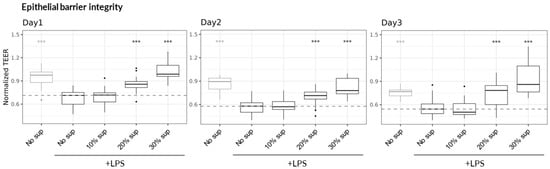
Figure 3.
Dose-dependent protective effect of B. infantis ATCC 15697 on epithelial barrier integrity. TEER values were monitored over three days and normalized to the measurement at Day 0, immediately prior to the addition of LPS-stimulated or non-stimulated PBMCs. Asterisks indicate statistical significance with p-value < 0.001 (***), relative to the “No sup, +LPS” treatment on the same day, as determined by a linear fixed-effect model (6 PBMC donors across three independent experiments (N = 3) with 18 technical replicates per condition (n = 18).
Next, we compared the capacity of several probiotic B. infantis strains—Bi-26™ (Chr. Hansen A/S), EVC001, Bifin02—one strain of L. rhamnosus GG (LGG) and the combination of Bifin02 and LGG (“Combo”) (Table 1), to mitigate inflammation-induced epithelial damage and to assess the effect of LGG supplementation.

Table 1.
Bacteria growth.
To distinguish between the two strains within the Combo, bacterial cultures were stained immediately after growth with fluorescently labeled Ricinus Communis Agglutinin I (RCA I) lectin. This lectin efficiently stained the Bifin02 strain (99%) but only rarely labeled LGG (7.5%) (Figure S1). In the Combo culture, 74% of cells were RCA-positive, corresponding to an estimated strain ratio of approximately 3:1 in favor of Bifin02. To verify bacterial viability and cultivability, diluted culture aliquots were plated on MRS agar. All single-strain cultures achieved high colony-forming unit (CFU) counts ranging from 2.15 × 10⁷ to 4.4 × 10⁸ CFU/mL, while the Combo reached 1.15 × 10⁹ CFU/mL, with an approximate Bifin02 to LGG ratio of 2:1. The slight discrepancy between the ratios obtained by flow cytometry and plating likely reflects that plating quantifies viable and cultivable bacteria, whereas flow cytometry detects all intact cells, including non-culturable ones.
Consistent with OD and CFU measurements, the pH of the culture medium after 24 h of growth was 4.6 ± 0.14 for all cultures containing B. infantis strains, including the Combo, while the pure LGG culture reached pH 5.6—indicating metabolic activity of all strains tested. Filtered, pH-neutralized culture supernatants were then added to the Caco-2 culture medium at a final concentration of 30% (v/v) and tested in the Gut-on-a-chip inflammation model. Remarkably, all tested probiotic supernatants significantly mitigated LPS-induced epithelial barrier damage, as evidenced by preservation of TEER values (Figure 4A).
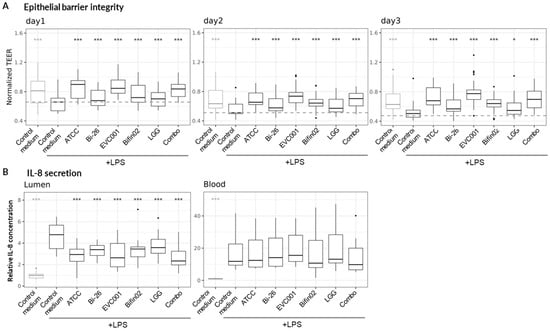
Figure 4.
Protective effect of probiotic supernatants. Linear fixed-effect model was fitted, each treatment being compared to the “Control medium, +LPS” condition. Asterisks indicate statistical significance with p-value < 0.05 (*) and p < 0.001 (***). (A) TEER) monitored over three days and normalized to Day 0 (immediately before the addition of LPS-stimulated or non-stimulated PBMCs). Data represent results from nine PBMC donors across three independent experiments (N = 3) with 21 technical replicates per condition (n = 21). (B) Relative changes in IL-8 concentrations measured in the Lumen (left) and Basal (right) channels three days after administration of LPS-stimulated or non-stimulated PBMCs. Values were normalized to the “Control medium” condition (PBMC without LPS treatment). Data represent results from four PBMC donors across three independent experiments (N = 3) with 12 technical replicates per condition (n = 12).
We next quantified IL-8, a key pro-inflammatory cytokine that was strongly upregulated in our model (Figure 2A), using ELISA. While probiotic supernatants did not alter IL-8 concentrations in the Basal channel, the increase in IL-8 in the Lumen channel was significantly reduced compared to the control medium (non-inoculated bacterial medium) by all probiotic supernatants (Figure 4B).
We next investigated the metabolomic profiles of the probiotic culture supernatants, focusing specifically on short-chain fatty acids (SCFAs) and metabolites derived from the tryptophan/indole pathway, as both classes are closely associated with epithelial barrier maintenance and immunomodulatory effects [53]. Indeed, Among the most strongly upregulated metabolites across all probiotic supernatants were formic acid, a member of the SCFA family, and indole-3-lactic acid (ILA), a key tryptophan-derived metabolite. Notably, LGG exhibited the lowest production of ILA among the tested strains (Figure 5). Additional indole derivatives—including indole-3-propionic acid (I3P), indole-3-butyric acid, and tryptamine—were also detected in the supernatants of all B. infantis strains, with ILA concentrations reaching 25–40 µM (Figure S2).
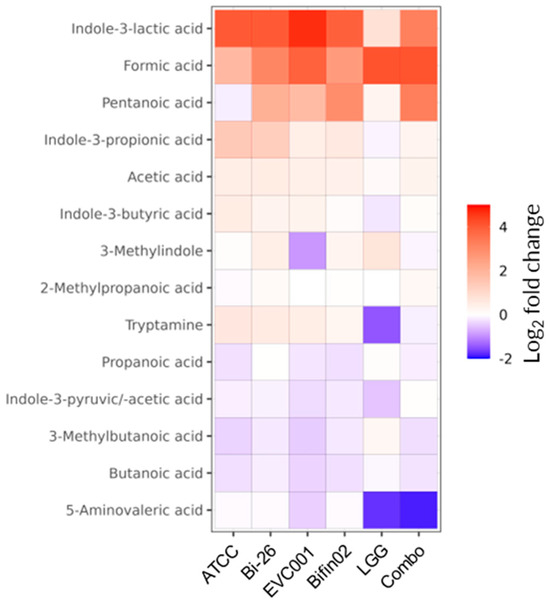
Figure 5.
Production of SCFAs and tryptophan-derived metabolites by probiotic strains. Relative changes in metabolite concentrations were determined by comparing probiotic supernatants to fresh (non-inoculated) medium. Only metabolites with a Descriptive Power (DP) > 2.5 are shown.
In contrast, increases in indole-derived metabolites were minimal or undetectable in LGG supernatants and were lower in Combo compared to Bifin02 alone. As expected, lactate, one of the main by-products of lactic acid bacteria and bifidobacteria metabolism [54], was also among the most upregulated metabolites detected (Table S3).
Given the similarity in metabolomic profiles and biological effects among the individual B. infantis strains on epithelial barrier integrity and IL-8 secretion, we next investigated the potential mechanism of action focusing on the reference strain ATCC 15697, the Bifin02 probiotic strain, and the combination of Bifin02 with LGG (“Combo”) to evaluate the possible additive contribution of LGG within the two-strain formulation. To this end, we expanded cytokine profiling for these three probiotic supernatants using Luminex multiplex analysis. In the Basal channel, none of the tested supernatants altered LPS-induced cytokine concentrations by more than twofold (Figure 6, right; Figure S3). In contrast, in the Lumen channel, only the supernatant from the B. infantis ATCC 15697 strain induced a mild but statistically significant reduction in IL-6 and IL-8 levels (Figure 6, left). Changes in CCL2 concentrations were minimal across all treatments, though statistically significant differences were observed for two of the probiotic conditions.
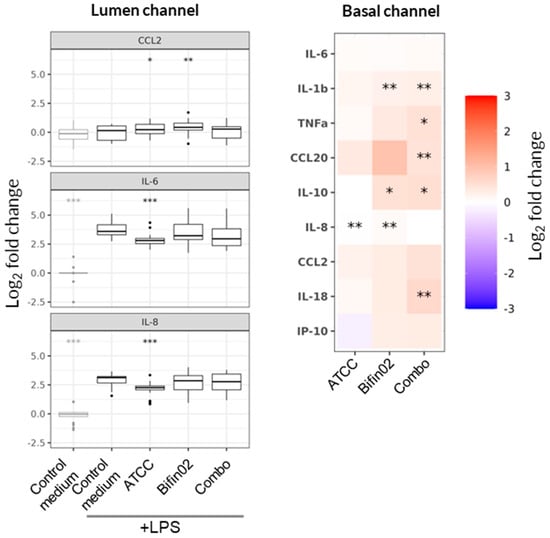
Figure 6.
Effect of probiotic supernatants on cytokine secretion. Linear fixed-effect model, with each treatment compared to the “Control medium, +LPS” condition. Asterisks indicate statistical significance with p-value < 0.05 (*), p < 0.01 (**), and p < 0.001 (***). Data represents results from six PBMC donors across three independent experiments (N = 3) with 18 technical replicates per condition (n = 18). Relative changes in cytokine concentrations were measured in the Lumen and Basal channels three days after administration of LPS-stimulated or non-stimulated PBMCs.
Since the cytokines detected in the Lumen channel may originate either from Caco-2 epithelial cells or by diffusion from the Basal channel [33] we next investigated the direct effect of probiotic supernatants on epithelial cytokine transcription. To this end, we quantified the expression of genes encoding cytokines and chemokines involved in epithelial homeostasis and inflammation. We observed that the tested probiotic supernatants did not consistently modulate the LPS-induced upregulation of IL-6 and IL-8 cytokines and no statistically significant changes were detected (Figure 7, left). In contrast, transcription of the homeostatic cytokines TSLP, TGFB, and IL-18 was significantly upregulated by all three probiotic supernatants, except for Bifin02, which exhibited the same trend for TSLP but did not reach the statistical significance threshold.
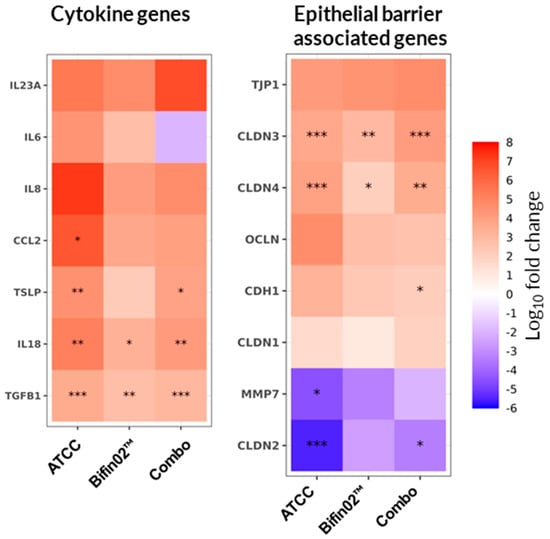
Figure 7.
Effect of probiotic supernatants on epithelial cell gene transcription. Relative gene expression of Caco-2 cells was assessed on Day 3 of the experiment and compared to the “Control medium, +LPS” condition using a non-parametric Wilcoxon test. Asterisks indicate statistical significance with p < 0.05 (*), p < 0.01 (**), and p < 0.001 (***). Data represent results from six PBMC donors across three independent experiments (N = 3) with 18 technical replicates per condition (n = 18).
To test the hypothesis that probiotic protection might also involve cytokine-independent mechanisms, we further examined the transcription of genes encoding proteins essential for epithelial barrier integrity maintenance. Indeed, CLDN3 and CLDN4 (encoding Claudin-3 and Claudin-4) were upregulated by all three probiotic treatments, while CLDN2 expression was significantly downregulated by both the ATCC 15697 and Combo supernatants, with Bifin02 showing a similar but non-significant tendency (Figure 7, right). Additionally, modest upregulation of TJP1, OCLN, and CDH1 (encoding ZO-1, Occludin, and E-Cadherin, respectively) was observed, alongside a trend toward MMP7 downregulation. However, these changes mostly did not reach statistical significance.
4. Discussion
For more than a decade, intestine-on-a-chip technologies have been developed to bridge the translational gap between conventional in vitro cell-based models and clinical studies. These systems combine the experimental control of laboratory models with the ability to recapitulate key aspects of organ-level physiology and host responses through the inclusion of multiple relevant cell types. The intestinal wall comprises a diverse array of cell populations, including secretory epithelial cells (i.e., Goblet, Paneth, and enteroendocrine cells), intraepithelial and tissue-resident immune cells, as well as a dense mesh of vascular and neuronal networks. Several studies have demonstrated that primary, often biopsy-derived, intestinal epithelium containing multiple specialized epithelial cell types—along with endothelial and immune cells—can be successfully integrated into microfluidic systems, thereby reproducing mucus production, barrier function, and inflammatory signaling (reviewed in [55,56,57]).
Although such complex co-culture models more accurately mimic in vivo intestinal physiology compared to cell line–based systems, they are limited by technical complexity, donor-dependent variability, and low throughput, which collectively reduce experimental reproducibility. In the present study, we employed the Caco-2 cell line, which—while unable to replicate the full functional diversity of the intestinal epithelium—provides a robust and reproducible model of epithelial barrier function and cytokine secretion.
Because immune cells are central to intestinal homeostasis and inflammation, we incorporated PBMCs into our microfluidic co-culture. Although PBMCs differ from the tissue-resident immune cells found in the lamina propria, their inclusion enabled modeling of epithelial–immune cross-talk. Indeed, PBMCs in our model induced accumulation of IL-8, IP-10, and TNFα in the Basal channel and elicited a moderate increase in epithelial paracellular permeability (Figure 2). Furthermore, PBMC presence exerted a bivalent effect on Caco-2 cytokine gene transcription—upregulating immunoregulatory cytokines (TSLP, IL18) and downregulating the pro-inflammatory IL8, while concurrently enhancing expression of pro-inflammatory mediators such as IL23A and CCL2 (monocyte chemoattractant protein-1—MIP-1) (Figure 2C). In parallel, transcription of genes encoding proteins involved in epithelial barrier maintenance, including Claudins (CLDN1, CLDN2, CLDN3, CLDN4), E-cadherin (CDH1), and ZO-1 (TJP1), was also upregulated (Figure 2C). These findings underscore the importance of epithelial–immune cell interactions in regulating intestinal homeostasis [58] and demonstrate that such cross-talk can be partially recapitulated in a simplified yet physiologically relevant Caco-2–PBMC co-culture system.
Since LPS translocation towards the blood stream is a hallmark of severe epithelial barrier dysfunction and has been reported in cases of acute malnutrition in infants [11,59,60], we employed LPS as a physiologically relevant trigger to induce PBMC-mediated inflammation in our model. LPS stimulation led to the upregulation of most tested cytokines in the Basal channel, with the exception of the chemokine CXCL10, which was downregulated (Figure 2A). Interestingly, although CXCL10 is typically associated with inflammation and immune cell recruitment [61,62], Proost et al. reported the inhibitory effect of LPS on IFNγ-induced secretion of CXCL10 by PBMCs, but not by fibroblasts, thereby potentially facilitating T-cell recruitment to sites of infection from the circulation [63]. In the Lumen channel, only the concentration of IL-8 and IL-6 were significantly increased among the three quantitatively detected cytokines (Figure 2A).
Our findings demonstrate that conditioned media of B. infantis—either alone or combined with LGG —grown in medium supplemented with 2′-FL and LNT, effectively protected against LPS-induced epithelial barrier damage, as evidenced by TEER measurements. Interestingly, the concentrations of cytokines in the Basal channel remained largely unaffected by probiotic supernatants (Figure 6, right), while IL-6 and IL-8 increases in the Lumen channel were only modestly attenuated and not always statistically significant (Figure 6, left). Likewise, probiotic supernatants did not significantly reduce IL6 and IL8 transcription in Caco-2 cells (Figure 7, left). These results suggest that intestinal barrier disruption in our model is primarily mediated by cytokines produced by PBMCs, and that the protective effect of the probiotic-conditioned media occurs independently of cytokine modulation.
A plausible explanation is that cytokines detected in the Lumen channel may primarily diffuse from the Basal (PBMC-containing) compartment, rather than being secreted de novo by Caco-2 cells. Once these cytokines reach the epithelial cells grown on a collagen matrix separating the two channels, they induce epithelial barrier loosening, further accelerating diffusion into the Lumen channel. Since probiotic supernatants preserved epithelial integrity, they may have indirectly reduced cytokine diffusion from the Basal compartment. Thus, the observed decrease in luminal cytokine concentrations could reflect reduced permeability, rather than direct modulation of cytokine secretion by epithelial cells—a hypothesis warranting further investigation.
In contrast to their limited effects on pro-inflammatory cytokines, probiotic supernatants upregulated immunoregulatory and tissue-repair genes, including TGFB, TSLP, and IL18 [58]. Additionally, the supernatants modulated the transcription of tight-junction–related Claudin genes, shifting expression toward “tight” Claudins (CLDN3, CLDN4) and reducing the “leaky” CLDN2. Expression of other junctional proteins—including TJP1 (ZO-1), OCLN (Occludin), and CDH1 (E-cadherin)—was also slightly upregulated, though mostly without statistical significance.
Importantly, CLDN2 upregulation has been consistently observed in the intestinal epithelium of patients with inflammatory bowel disease (IBD) [64] and in epithelial cell lines exposed to pro-inflammatory cytokines such as TNFα [65] and IL-6 [66,67], both of which were strongly induced by LPS stimulation of PBMCs in our model (Figure 2A). Consistent with our observations, previous studies demonstrated that B. infantis–conditioned medium prevents TNFα + IFNγ–induced TEER loss through downregulation of CLDN2 and upregulation of ZO-1, OCLN, and CLDN1 expression [16,68]. Together, these findings support the hypothesis that probiotic-derived supernatants protect the intestinal barrier by promoting the expression of tight junction components and limiting cytokine-driven barrier disruption, rather than by directly suppressing inflammation.
One of the key mechanisms through which probiotics modulate tight junction protein expression involves activation of pattern recognition receptors, particularly Toll-like receptors (TLRs) such as TLR2 and TLR9 [69,70,71]. Indeed, TLR2 activation in intestinal epithelial cells (IECs) has been shown to enhance barrier integrity via modulation of tight junction organization [72]. Although live bacteria were not included in our experimental set-up, bacterial supernatants likely contained cell debris and extracellular vesicles bearing TLR2 ligands, including lipoproteins, lipoteichoic acid, and peptidoglycan fragments [73] that may have contributed to epithelial reinforcement via TLR-mediated signaling.
Another mechanism by which probiotics support epithelial barrier function is through the production of bioactive metabolites. Indeed, all the probiotic supernatants tested—except that of LGG alone—promoted an increase in several indole derivatives (Figure 5 and Figure S2), metabolites of the tryptophan–indole pathway known to enhance epithelial barrier integrity and mitigate inflammation through activation of the aryl hydrocarbon receptor (AhR) [74,75,76]. Among these, ILA was the most abundant, produced at concentrations of approximately 25–40 µM by B. infantis strains, consistent with previously reported levels of this metabolite in the feces of healthy infants [77,78]. Notably, ILA is found at higher concentrations in breastfed infants, who are enriched Bifidobacterium species, supporting a correlation between HMO consumption, bifidobacterial abundance, and ILA production [77,78,79,80,81]. Our results align with earlier studies describing HMO-dependent ILA biosynthesis by B. infantis [78,81,82], which exerts anti-inflammatory and cytoprotective effects via the AhR and Nuclear factor erythroid 2-related factor 2 (Nrf2) signaling pathways [78,83,84].
In summary, all tested B. infantis strains and LGG demonstrated the ability to protect the intestinal epithelium from inflammation-induced damage triggered by LPS-stimulated PBMCs. However, the inclusion of LGG in combination with B. infantis Bifin02 did not yield additional protective effects under the conditions tested. This lack of synergy may be attributed to differences in bacterial growth kinetics, nutrient competition, or the medium composition in co-culture, which differ substantially from in vivo conditions.
Mechanistically, our findings suggest that indole derivatives produced by B. infantis strengthen the epithelial barrier primarily through modulation of tight junction gene expression and activation of homeostatic gene transcription, collectively promoting a “leak-tight phenotype. The protective effect of LGG maty rely on other soluble molecules such as previously described Msp1/p75 and p40 proteins and exopolysaccharide components [85,86,87].
Although the current Gut-on-a-Chip model cannot fully replicate the complex interplay among live probiotics, intestinal microbiota, and host tissues in vivo, it successfully reproduces key features of immune cell-mediated intestinal inflammation. This enables mid-throughput screening of biotherapeutics and may ultimately support personalized medicine approaches using donor-derived immune cells.
Based on previous monoculture studies, both LGG and B. infantis exhibited protective effects on the epithelial barrier, reducing pro-inflammatory cytokine secretion and stabilizing expression of tight junction proteins such as ZO-1, Occludin, and Claudin-1 [16,17,18,19,20]. However, by incorporating PBMCs into the co-culture, our model revealed additional probiotic effects on homeostatic cytokines (TSLP, IL-18) and Claudin family gene regulation, findings that have not been previously reported. Unlike monoculture-based studies—where inflammation is typically induced by direct epithelial exposure to microbial molecules (e.g., LPS, flagellin) or pro-inflammatory cytokines (e.g., IL-1β)—our model reproduces a systemic inflammation mediated by PBMC activation following simulated microbial translocation to the blood stream. This approach resembles advanced disease states characterized by severe epithelial barrier dysfunction, such as inflammatory bowel disease (IBD), sepsis, and acute malnutrition, thereby providing a relevant platform to study barrier-protective mechanisms of probiotics in the context of systemic inflammation.
Supplementary Materials
The following supporting information can be downloaded at: https://www.mdpi.com/article/10.3390/applmicrobiol5040110/s1, Table S1: Bacterial strains, Table S2: Blood donor characteristics, Table S3: Genes and qPCR assays ID, Figure S1: Strain discrimination using lectin staining, Figure S2: Absolute concentration of upregulated metabolites, Figure S3: Absolute concentration of quantitatively detected cytokines.
Author Contributions
Conceptualization: I.B. and C.V. (Cecile Vernochet); data generation and analysis: I.B., B.B., B.B.A., S.P., S.B., A.H., M.R., J.M.T. and M.M.; resources, J.S. (Justine Sunshine), M.S., COSIPOP Study Group and J.P.; writing I.B. and C.V. (Cecile Vernochet); supervision and validation: J.S. (Jared Silverman), C.V. (Christophe Vedrine) and R.D. All authors have read and agreed to the published version of the manuscript.
Funding
This research was funded by Gates Medical Research Institute.
Institutional Review Board Statement
The study was conducted in accordance with the Declaration of Helsinki, and approved by the Institutional Review Board of Est II Ethics Committee (protocol code 2022-A00546-37 and date of approval 20 February 2023).
Informed Consent Statement
Informed consent was obtained from all subjects involved in the study.
Data Availability Statement
The original contributions presented in this study are included in the article and Supplementary Materials. Further inquiries can be directed to the corresponding author.
Acknowledgments
2′-Fucosyllactose (2′-FL) and Lacto-N-tetraose HMOs used in this research were donated by dsm-firmenich. We thank dsm-firmenich for its ongoing support of research into the benefits of HMOs. We are grateful to the healthy volunteers for their participation in the study. We also thank the COSIPOP study group members who conceived and managed the COSIPOP cohort from Human health of the Institute Pasteur and the biobank (CHIP) of the Biological Resource Center of the Institute Pasteur (Paris) for distribution of the blood samples. COSIPOP study group members: Laurence Arowas, Nathalie Clement, Maurine Delhaye, Christine Fanaud, Emilie Nguyen, Clémence Noury, Blanca-Liliana Perlaza, Emmanuel Roux, Marie Vogtensperger, Ayla Zayoud, Nathalie Jolly * and Hélène Laude *. * Co-senior authors: We thank IFF (International Flavors & Fragrances Inc.) for providing the Bi-26™ and Novonesis for providing the Bifin02™ and LGG® strains for this study.
Conflicts of Interest
The authors declare no conflicts of interest. The Gates Medical Research Institute is a non-profit organization dedicated to the discovery, development and effective use of novel biomedical interventions addressing substantial global health concerns, for which investment incentives are limited.
References
- Di Tommaso, N.; Gasbarrini, A.; Ponziani, F.R. Intestinal Barrier in Human Health and Disease. Int. J. Environ. Res. Public Health 2021, 18, 12836. [Google Scholar] [CrossRef] [PubMed]
- Stolfi, C.; Maresca, C.; Monteleone, G.; Laudisi, F. Implication of Intestinal Barrier Dysfunction in Gut Dysbiosis and Diseases. Biomedicines 2022, 10, 289. [Google Scholar] [CrossRef] [PubMed]
- Zheng, D.; Liwinski, T.; Elinav, E. Interaction between microbiota and immunity in health and disease. Cell Res. 2020, 30, 492–506. [Google Scholar] [CrossRef]
- Donald, K.; Finlay, B.B. Early-life interactions between the microbiota and immune system: Impact on immune system development and atopic disease. Nat. Rev. Immunol. 2023, 23, 735–748. [Google Scholar] [CrossRef]
- Kane, A.V.; Dinh, D.M.; Ward, H.D. Childhood malnutrition and the intestinal microbiome. Pediatr. Res. 2015, 77, 256–262. [Google Scholar] [CrossRef]
- Dogra, S.K.; Kwong Chung, C.; Wang, D.; Sakwinska, O.; Colombo Mottaz, S.; Sprenger, N. Nurturing the Early Life Gut Microbiome and Immune Maturation for Long Term Health. Microorganisms 2021, 9, 2110. [Google Scholar] [CrossRef]
- Zhang, H.; Zhang, Z.; Liao, Y.; Zhang, W.; Tang, D. The Complex Link and Disease Between the Gut Microbiome and the Immune System in Infants. Front. Cell. Infect. Microbiol. 2022, 12, 924119. [Google Scholar] [CrossRef]
- Sanidad, K.Z.; Zeng, M.Y. Neonatal gut microbiome and immunity. Curr. Opin. Microbiol. 2020, 56, 30–37. [Google Scholar] [CrossRef] [PubMed]
- Casaburi, G.; Duar, R.M.; Brown, H.; Mitchell, R.D.; Kazi, S.; Chew, S.; Cagney, O.; Flannery, R.L.; Sylvester, K.G.; Frese, S.A.; et al. Metagenomic insights of the infant microbiome community structure and function across multiple sites in the United States. Sci. Rep. 2021, 11, 1472. [Google Scholar] [CrossRef]
- Duar, R.M.; Henrick, B.M.; Casaburi, G.; Frese, S.A. Integrating the Ecosystem Services Framework to Define Dysbiosis of the Breastfed Infant Gut: The Role of B. infantis and Human Milk Oligosaccharides. Front. Nutr. 2020, 7, 33. [Google Scholar] [CrossRef]
- Iddrisu, I.; Monteagudo-Mera, A.; Poveda, C.; Pyle, S.; Shahzad, M.; Andrews, S.; Walton, G.E. Malnutrition and Gut Microbiota in Children. Nutrients 2021, 13, 2727. [Google Scholar] [CrossRef]
- Barratt, M.J.; Nuzhat, S.; Ahsan, K.; Frese, S.A.; Arzamasov, A.A.; Sarker, S.A.; Islam, M.M.; Palit, P.; Islam, M.R.; Hibberd, M.C.; et al. Bifidobacterium infantis treatment promotes weight gain in Bangladeshi infants with severe acute malnutrition. Sci. Transl. Med. 2022, 14, eabk1107. [Google Scholar] [CrossRef]
- Castro-Mejía, J.L.; O’Ferrall, S.; Krych, Ł.; O’Mahony, E.; Namusoke, H.; Lanyero, B.; Kot, W.; Nabukeera-Barungi, N.; Michaelsen, K.F.; Mølgaard, C.; et al. Restitution of gut microbiota in Ugandan children administered with probiotics (Lactobacillus rhamnosus GG and Bifidobacterium animalis subsp. lactis BB-12) during treatment for severe acute malnutrition. Gut Microbes 2020, 11, 855–867. [Google Scholar] [CrossRef]
- Grenov, B.; Namusoke, H.; Lanyero, B.; Nabukeera-Barungi, N.; Ritz, C.; Mølgaard, C.; Friis, H.; Michaelsen, K.F. Effect of Probiotics on Diarrhea in Children With Severe Acute Malnutrition: A Randomized Controlled Study in Uganda. J. Pediatr. Gastroenterol. Nutr. 2017, 64, 396–403. [Google Scholar] [CrossRef]
- Kara, S.S.; Volkan, B.; Erten, I. Lactobacillus rhamnosus GG can protect malnourished children. Benef. Microbes 2019, 10, 237–244. [Google Scholar] [CrossRef]
- Guo, S.; Gillingham, T.; Guo, Y.; Meng, D.; Zhu, W.; Walker, W.A.; Ganguli, K. Secretions of Bifidobacterium infantis and Lactobacillus acidophilus Protect Intestinal Epithelial Barrier Function. J. Pediatr. Gastroenterol. Nutr. 2017, 64, 404–412. [Google Scholar] [CrossRef] [PubMed]
- O’Hara, A.M.; O’Regan, P.; Fanning, A.; O’Mahony, C.; Macsharry, J.; Lyons, A.; Bienenstock, J.; O’Mahony, L.; Shanahan, F. Functional modulation of human intestinal epithelial cell responses by Bifidobacterium infantis and Lactobacillus salivarius. Immunology 2006, 118, 202–215. [Google Scholar] [CrossRef]
- Sibartie, S.; O’Hara, A.M.; Ryan, J.; Fanning, A.; O’Mahony, J.; O’Neill, S.; Sheil, B.; O’Mahony, L.; Shanahan, F. Modulation of pathogen-induced CCL20 secretion from HT-29 human intestinal epithelial cells by commensal bacteria. BMC Immunol. 2009, 10, 54. [Google Scholar] [CrossRef] [PubMed]
- Álvarez-Mercado, A.I.; Plaza-Díaz, J.; de Almagro, M.C.; Gil, Á.; Moreno-Muñoz, J.A.; Fontana, L. Bifidobacterium longum subsp. infantis CECT 7210 Reduces Inflammatory Cytokine Secretion in Caco-2 Cells Cultured in the Presence of Escherichia coli CECT 515. Int. J. Mol. Sci. 2022, 23, 10813. [Google Scholar] [CrossRef] [PubMed]
- Li, A.; Zhang, C.; Chi, H.; Han, X.; Ma, Y.; Zheng, J.; Liu, C.; Li, C. 2′-Fucosyllactose promotes Lactobacillus rhamnosus KLDS 8001 to repair LPS-induced damage in Caco-2 cells. J. Food Biochem. 2022, 46, e14059. [Google Scholar] [CrossRef]
- Fang, H.W.; Fang, S.B.; Chiang Chiau, J.S.; Yeung, C.Y.; Chan, W.T.; Jiang, C.B.; Cheng, M.L.; Lee, H.C. Inhibitory effects of Lactobacillus casei subsp. rhamnosus on Salmonella lipopolysaccharide-induced inflammation and epithelial barrier dysfunction in a co-culture model using Caco-2/peripheral blood mononuclear cells. J. Med. Microbiol. 2010, 59 Pt 5, 573–579. [Google Scholar] [CrossRef]
- Konieczna, P.; Akdis, C.A.; Quigley, E.M.; Shanahan, F.; O’Mahony, L. Portrait of an immunoregulatory Bifidobacterium. Gut Microbes 2012, 3, 261–266. [Google Scholar] [CrossRef]
- van der Kleij, H.; O’Mahony, C.; Shanahan, F.; O’Mahony, L.; Bienenstock, J. Protective effects of Lactobacillus rhamnosus [corrected] and Bifidobacterium infantis in murine models for colitis do not involve the vagus nerve. Am. J. Physiol. Regul. Integr. Comp. Physiol. 2008, 295, R1131–R1137. [Google Scholar] [CrossRef]
- Mao, J.; Qi, S.; Cui, Y.; Dou, X.; Luo, X.M.; Liu, J.; Zhu, T.; Ma, Y.; Wang, H. Lactobacillus rhamnosus GG Attenuates Lipopolysaccharide-Induced Inflammation and Barrier Dysfunction by Regulating MAPK/NF-κB Signaling and Modulating Metabolome in the Piglet Intestine. J. Nutr. 2020, 150, 1313–1323. [Google Scholar] [CrossRef] [PubMed]
- Lordan, C.; Roche, A.K.; Delsing, D.; Nauta, A.; Groeneveld, A.; MacSharry, J.; Cotter, P.D.; van Sinderen, D. Linking human milk oligosaccharide metabolism and early life gut microbiota: Bifidobacteria and beyond. Microbiol. Mol. Biol. Rev. MMBR 2024, 88, e0009423. [Google Scholar] [CrossRef]
- Thomson, P.; Medina, D.A.; Garrido, D. Human milk oligosaccharides and infant gut bifidobacteria: Molecular strategies for their utilization. Food Microbiol. 2018, 75, 37–46. [Google Scholar] [CrossRef]
- Sela, D.A.; Chapman, J.; Adeuya, A.; Kim, J.H.; Chen, F.; Whitehead, T.R.; Lapidus, A.; Rokhsar, D.S.; Lebrilla, C.B.; German, J.B.; et al. The genome sequence of Bifidobacterium longum subsp. infantis reveals adaptations for milk utilization within the infant microbiome. Proc. Natl. Acad. Sci. USA 2008, 105, 18964–18969. [Google Scholar] [CrossRef]
- Vinjamuri, A.; Davis, J.C.C.; Totten, S.M.; Wu, L.D.; Klein, L.D.; Martin, M.; Quinn, E.A.; Scelza, B.; Breakey, A.; Gurven, M.; et al. Human Milk Oligosaccharide Compositions Illustrate Global Variations in Early Nutrition. J. Nutr. 2022, 152, 1239–1253. [Google Scholar] [CrossRef]
- Ingber, D.E. Human organs-on-chips for disease modelling, drug development and personalized medicine. Nat. Rev. Genet. 2022, 23, 467–491. [Google Scholar] [CrossRef]
- Pocock, K.; Delon, L.; Bala, V.; Rao, S.; Priest, C.; Prestidge, C.; Thierry, B. Intestine-on-a-Chip Microfluidic Model for Efficient in Vitro Screening of Oral Chemotherapeutic Uptake. ACS Biomater. Sci. Eng. 2017, 3, 951–959. [Google Scholar] [CrossRef] [PubMed]
- Chi, M.; Yi, B.; Oh, S.; Park, D.J.; Sung, J.H.; Park, S. A microfluidic cell culture device (μFCCD) to culture epithelial cells with physiological and morphological properties that mimic those of the human intestine. Biomed. Microdevices 2015, 17, 9966. [Google Scholar] [CrossRef]
- Trietsch, S.J.; Naumovska, E.; Kurek, D.; Setyawati, M.C.; Vormann, M.K.; Wilschut, K.J.; Lanz, H.L.; Nicolas, A.; Ng, C.P.; Joore, J.; et al. Membrane-free culture and real-time barrier integrity assessment of perfused intestinal epithelium tubes. Nat. Commun. 2017, 8, 262. [Google Scholar] [CrossRef] [PubMed]
- Beaurivage, C.; Naumovska, E.; Chang, Y.X.; Elstak, E.D.; Nicolas, A.; Wouters, H.; van Moolenbroek, G.; Lanz, H.L.; Trietsch, S.J.; Joore, J.; et al. Development of a Gut-On-A-Chip Model for High Throughput Disease Modeling and Drug Discovery. Int. J. Mol. Sci. 2019, 20, 5661. [Google Scholar] [CrossRef]
- Gijzen, L.; Marescotti, D.; Raineri, E.; Nicolas, A.; Lanz, H.L.; Guerrera, D.; van Vught, R.; Joore, J.; Vulto, P.; Peitsch, M.C.; et al. An Intestine-on-a-Chip Model of Plug-and-Play Modularity to Study Inflammatory Processes. SLAS Technol. Transl. Life Sci. Innov. 2020, 25, 585–597. [Google Scholar] [CrossRef]
- Bounab, Y.; Eyer, K.; Dixneuf, S.; Rybczynska, M.; Chauvel, C.; Mistretta, M.; Tran, T.; Aymerich, N.; Chenon, G.; Llitjos, J.F.; et al. Dynamic single-cell phenotyping of immune cells using the microfluidic platform DropMap. Nat. Protoc. 2020, 15, 2920–2955. [Google Scholar] [CrossRef] [PubMed]
- Smart, K.F.; Aggio, R.B.; Van Houtte, J.R.; Villas-Bôas, S.G. Analytical platform for metabolome analysis of microbial cells using methyl chloroformate derivatization followed by gas chromatography-mass spectrometry. Nat. Protoc. 2010, 5, 1709–1729. [Google Scholar] [CrossRef] [PubMed]
- Rutledge, R.G.; Côté, C. Mathematics of quantitative kinetic PCR and the application of standard curves. Nucleic Acids Res. 2003, 31, e93. [Google Scholar] [CrossRef]
- Rasmussen, R. Quantification on the LightCycler. In Rapid Cycle Real-Time PCR: Methods and Applications; Meuer, S., Wittwer, C., Nakagawara, K.-I., Eds.; Springer: Berlin/Heidelberg, Germany, 2001; pp. 21–34. [Google Scholar]
- Pfaffl, M.W. A new mathematical model for relative quantification in real-time RT-PCR. Nucleic Acids Res. 2001, 29, e45. [Google Scholar] [CrossRef]
- Vandesompele, J.; De Preter, K.; Pattyn, F.; Poppe, B.; Van Roy, N.; De Paepe, A.; Speleman, F. Accurate normalization of real-time quantitative RT-PCR data by geometric averaging of multiple internal control genes. Genome Biol. 2002, 3, Research0034. [Google Scholar] [CrossRef]
- Hoffman, G.E.; Schadt, E.E. variancePartition: Interpreting drivers of variation in complex gene expression studies. BMC Bioinform. 2016, 17, 483. [Google Scholar] [CrossRef]
- Ritchie, M.E.; Phipson, B.; Wu, D.; Hu, Y.; Law, C.W.; Shi, W.; Smyth, G.K. limma powers differential expression analyses for RNA-sequencing and microarray studies. Nucleic Acids Res. 2015, 43, e47. [Google Scholar] [CrossRef]
- Benjamini, Y.; Hochberg, Y. Controlling the False Discovery Rate: A Practical and Powerful Approach to Multiple Testing. J. R. Stat. Soc. Ser. B 1995, 57, 289–300. [Google Scholar] [CrossRef]
- Weiss, G.A.; Hennet, T. Mechanisms and consequences of intestinal dysbiosis. Cell. Mol. Life Sci. CMLS 2017, 74, 2959–2977. [Google Scholar] [CrossRef]
- Page, M.J.; Kell, D.B.; Pretorius, E. The Role of Lipopolysaccharide-Induced Cell Signalling in Chronic Inflammation. Chronic Stress 2022, 6, 24705470221076390. [Google Scholar] [CrossRef] [PubMed]
- Nagpal, R.; Yadav, H. Bacterial Translocation from the Gut to the Distant Organs: An Overview. Ann. Nutr. Metab. 2017, 71 (Suppl. S1), 11–16. [Google Scholar] [CrossRef] [PubMed]
- Noë, V.; Fingleton, B.; Jacobs, K.; Crawford, H.C.; Vermeulen, S.; Steelant, W.; Bruyneel, E.; Matrisian, L.M.; Mareel, M. Release of an invasion promoter E-cadherin fragment by matrilysin and stromelysin-1. J. Cell Sci. 2001, 114 Pt 1, 111–118. [Google Scholar] [CrossRef]
- Burke, B. The role of matrix metalloproteinase 7 in innate immunity. Immunobiology 2004, 209, 51–56. [Google Scholar] [CrossRef]
- Soyyılmaz, B.; Mikš, M.H.; Röhrig, C.H.; Matwiejuk, M.; Meszaros-Matwiejuk, A.; Vigsnæs, L.K. The Mean of Milk: A Review of Human Milk Oligosaccharide Concentrations throughout Lactation. Nutrients 2021, 13, 2737. [Google Scholar] [CrossRef]
- Konieczna, M.; Koryszewska-Bagińska, A.; Bzikowska-Jura, A.; Chmielewska-Jeznach, M.; Jarzynka, S.; Olędzka, G. Modifiable and Non-Modifiable Factors That Affect Human Milk Oligosaccharides Composition. Nutrients 2024, 16, 2887. [Google Scholar] [CrossRef]
- Zabel, B.E.; Gerdes, S.; Evans, K.C.; Nedveck, D.; Singles, S.K.; Volk, B.; Budinoff, C. Strain-specific strategies of 2′-fucosyllactose, 3-fucosyllactose, and difucosyllactose assimilation by Bifidobacterium longum subsp. infantis Bi-26 and ATCC 15697. Sci. Rep. 2020, 10, 15919. [Google Scholar] [CrossRef]
- Zalán, Z.; Hudáček, J.; Štětina, J.; Chumchalová, J.; Halász, A. Production of organic acids by Lactobacillus strains in three different media. Eur. Food Res. Technol. 2010, 230, 395–404. [Google Scholar] [CrossRef]
- Fu, Y.; Lyu, J.; Wang, S. The role of intestinal microbes on intestinal barrier function and host immunity from a metabolite perspective. Front. Immunol. 2023, 14, 1277102. [Google Scholar] [CrossRef] [PubMed]
- Mathur, H.; Beresford, T.P.; Cotter, P.D. Health Benefits of Lactic Acid Bacteria (LAB) Fermentates. Nutrients 2020, 12, 1679. [Google Scholar] [CrossRef]
- Donkers, J.M.; Eslami Amirabadi, H.; van de Steeg, E. Intestine-on-a-chip: Next level in vitro research model of the human intestine. Curr. Opin. Toxicol. 2021, 25, 6–14. [Google Scholar] [CrossRef]
- Morelli, M.; Kurek, D.; Ng, C.P.; Queiroz, K. Gut-on-a-Chip Models: Current and Future Perspectives for Host-Microbial Interactions Research. Biomedicines 2023, 11, 619. [Google Scholar] [CrossRef]
- Xiang, Y.; Wen, H.; Yu, Y.; Li, M.; Fu, X.; Huang, S. Gut-on-chip: Recreating human intestine in vitro. J. Tissue Eng. 2020, 11, 2041731420965318. [Google Scholar] [CrossRef]
- Peterson, L.W.; Artis, D. Intestinal epithelial cells: Regulators of barrier function and immune homeostasis. Nat. Rev. Immunol. 2014, 14, 141–153. [Google Scholar] [CrossRef]
- Patterson, G.T.; Osorio, E.Y.; Peniche, A.; Dann, S.M.; Cordova, E.; Preidis, G.A.; Suh, J.H.; Ito, I.; Saldarriaga, O.A.; Loeffelholz, M.; et al. Pathologic Inflammation in Malnutrition Is Driven by Proinflammatory Intestinal Microbiota, Large Intestine Barrier Dysfunction, and Translocation of Bacterial Lipopolysaccharide. Front. Immunol. 2022, 13, 846155. [Google Scholar] [CrossRef]
- Jones, K.D.; Hünten-Kirsch, B.; Laving, A.M.; Munyi, C.W.; Ngari, M.; Mikusa, J.; Mulongo, M.M.; Odera, D.; Nassir, H.S.; Timbwa, M.; et al. Mesalazine in the initial management of severely acutely malnourished children with environmental enteric dysfunction: A pilot randomized controlled trial. BMC Med. 2014, 12, 133. [Google Scholar] [CrossRef] [PubMed]
- Singh, S.; Anshita, D.; Ravichandiran, V. MCP-1: Function, regulation, and involvement in disease. Int. Immunopharmacol. 2021, 101 Pt B, 107598. [Google Scholar] [CrossRef] [PubMed]
- Antonelli, A.; Ferrari, S.M.; Giuggioli, D.; Ferrannini, E.; Ferri, C.; Fallahi, P. Chemokine (C-X-C motif) ligand (CXCL)10 in autoimmune diseases. Autoimmun. Rev. 2014, 13, 272–280. [Google Scholar] [CrossRef]
- Proost, P.; Vynckier, A.K.; Mahieu, F.; Put, W.; Grillet, B.; Struyf, S.; Wuyts, A.; Opdenakker, G.; Van Damme, J. Microbial Toll-like receptor ligands differentially regulate CXCL10/IP-10 expression in fibroblasts and mononuclear leukocytes in synergy with IFN-gamma and provide a mechanism for enhanced synovial chemokine levels in septic arthritis. Eur. J. Immunol. 2003, 33, 3146–3153. [Google Scholar] [CrossRef]
- Garcia-Hernandez, V.; Quiros, M.; Nusrat, A. Intestinal epithelial claudins: Expression and regulation in homeostasis and inflammation. Ann. N. Y. Acad. Sci. 2017, 1397, 66–79. [Google Scholar] [CrossRef]
- Mankertz, J.; Amasheh, M.; Krug, S.M.; Fromm, A.; Amasheh, S.; Hillenbrand, B.; Tavalali, S.; Fromm, M.; Schulzke, J.D. TNFalpha up-regulates claudin-2 expression in epithelial HT-29/B6 cells via phosphatidylinositol-3-kinase signaling. Cell Tissue Res. 2009, 336, 67–77. [Google Scholar] [CrossRef]
- Suzuki, T.; Yoshinaga, N.; Tanabe, S. Interleukin-6 (IL-6) regulates claudin-2 expression and tight junction permeability in intestinal epithelium. J. Biol. Chem. 2011, 286, 31263–31271. [Google Scholar] [CrossRef] [PubMed]
- Al-Sadi, R.; Ye, D.; Boivin, M.; Guo, S.; Hashimi, M.; Ereifej, L.; Ma, T.Y. Interleukin-6 modulation of intestinal epithelial tight junction permeability is mediated by JNK pathway activation of claudin-2 gene. PLoS ONE 2014, 9, e85345. [Google Scholar] [CrossRef] [PubMed]
- Ewaschuk, J.B.; Diaz, H.; Meddings, L.; Diederichs, B.; Dmytrash, A.; Backer, J.; Looijer-van Langen, M.; Madsen, K.L. Secreted bioactive factors from Bifidobacterium infantis enhance epithelial cell barrier function. Am. J. Physiol. Gastrointest. Liver Physiol. 2008, 295, G1025–G1034. [Google Scholar] [CrossRef] [PubMed]
- Ulluwishewa, D.; Anderson, R.C.; McNabb, W.C.; Moughan, P.J.; Wells, J.M.; Roy, N.C. Regulation of tight junction permeability by intestinal bacteria and dietary components. J. Nutr. 2011, 141, 769–776. [Google Scholar] [CrossRef]
- Rose, E.C.; Odle, J.; Blikslager, A.T.; Ziegler, A.L. Probiotics, Prebiotics and Epithelial Tight Junctions: A Promising Approach to Modulate Intestinal Barrier Function. Int. J. Mol. Sci. 2021, 22, 6729. [Google Scholar] [CrossRef]
- Gou, H.Z.; Zhang, Y.L.; Ren, L.F.; Li, Z.J.; Zhang, L. How do intestinal probiotics restore the intestinal barrier? Front. Microbiol. 2022, 13, 929346. [Google Scholar] [CrossRef]
- Cario, E.; Gerken, G.; Podolsky, D.K. Toll-like receptor 2 enhances ZO-1-associated intestinal epithelial barrier integrity via protein kinase C. Gastroenterology 2004, 127, 224–238. [Google Scholar] [CrossRef]
- van Bergenhenegouwen, J.; Kraneveld, A.D.; Rutten, L.; Kettelarij, N.; Garssen, J.; Vos, A.P. Extracellular vesicles modulate host-microbe responses by altering TLR2 activity and phagocytosis. PLoS ONE 2014, 9, e89121. [Google Scholar] [CrossRef]
- Gao, J.; Xu, K.; Liu, H.; Liu, G.; Bai, M.; Peng, C.; Li, T.; Yin, Y. Impact of the Gut Microbiota on Intestinal Immunity Mediated by Tryptophan Metabolism. Front. Cell. Infect. Microbiol. 2018, 8, 13. [Google Scholar] [CrossRef]
- Pernomian, L.; Duarte-Silva, M.; de Barros Cardoso, C.R. The Aryl Hydrocarbon Receptor (AHR) as a Potential Target for the Control of Intestinal Inflammation: Insights from an Immune and Bacteria Sensor Receptor. Clin. Rev. Allergy Immunol. 2020, 59, 382–390. [Google Scholar] [CrossRef]
- Gasaly, N.; de Vos, P.; Hermoso, M.A. Impact of Bacterial Metabolites on Gut Barrier Function and Host Immunity: A Focus on Bacterial Metabolism and Its Relevance for Intestinal Inflammation. Front. Immunol. 2021, 12, 658354. [Google Scholar] [CrossRef]
- Laursen, M.F.; Sakanaka, M.; von Burg, N.; Mörbe, U.; Andersen, D.; Moll, J.M.; Pekmez, C.T.; Rivollier, A.; Michaelsen, K.F.; Mølgaard, C.; et al. Bifidobacterium species associated with breastfeeding produce aromatic lactic acids in the infant gut. Nat. Microbiol. 2021, 6, 1367–1382. [Google Scholar] [CrossRef]
- Ehrlich, A.M.; Pacheco, A.R.; Henrick, B.M.; Taft, D.; Xu, G.; Huda, M.N.; Mishchuk, D.; Goodson, M.L.; Slupsky, C.; Barile, D.; et al. Indole-3-lactic acid associated with Bifidobacterium-dominated microbiota significantly decreases inflammation in intestinal epithelial cells. BMC Microbiol. 2020, 20, 357. [Google Scholar] [CrossRef] [PubMed]
- Brink, L.R.; Mercer, K.E.; Piccolo, B.D.; Chintapalli, S.V.; Elolimy, A.; Bowlin, A.K.; Matazel, K.S.; Pack, L.; Adams, S.H.; Shankar, K.; et al. Neonatal diet alters fecal microbiota and metabolome profiles at different ages in infants fed breast milk or formula. Am. J. Clin. Nutr. 2020, 111, 1190–1202. [Google Scholar] [CrossRef]
- Aust, A.C.; Vidova, V.; Coufalikova, K.; Smetanova, S.; Kozeluhova, K.; Micenkova, L.; Videnska, P.; Smatana, S.; Budinska, E.; Borek, I.; et al. Fecal tryptophan metabolite profiling in newborns in relation to microbiota and antibiotic treatment. Appl. Microbiol. Biotechnol. 2024, 108, 504. [Google Scholar] [CrossRef]
- Henrick, B.M.; Rodriguez, L.; Lakshmikanth, T.; Pou, C.; Henckel, E.; Arzoomand, A.; Olin, A.; Wang, J.; Mikes, J.; Tan, Z.; et al. Bifidobacteria-mediated immune system imprinting early in life. Cell 2021, 184, 3884–3898.e3811. [Google Scholar] [CrossRef]
- Bajic, D.; Wiens, F.; Wintergerst, E.; Deyaert, S.; Baudot, A.; Van den Abbeele, P. HMOs Exert Marked Bifidogenic Effects on Children’s Gut Microbiota Ex Vivo, Due to Age-Related Bifidobacterium Species Composition. Nutrients 2023, 15, 1701. [Google Scholar] [CrossRef]
- Meng, D.; Sommella, E.; Salviati, E.; Campiglia, P.; Ganguli, K.; Djebali, K.; Zhu, W.; Walker, W.A. Indole-3-lactic acid, a metabolite of tryptophan, secreted by Bifidobacterium longum subspecies infantis is anti-inflammatory in the immature intestine. Pediatr. Res. 2020, 88, 209–217. [Google Scholar] [CrossRef]
- Cui, Q.; Zhang, Z.; Tian, X.; Liang, X.; Lu, Y.; Shi, Y.; Kuerman, M.; Wang, R.; Yu, Z.; Gong, P.; et al. Bifidobacterium bifidum Ameliorates DSS-Induced Colitis in Mice by Regulating AHR/NRF2/NLRP3 Inflammasome Pathways through Indole-3-lactic Acid Production. J. Agric. Food Chem. 2023, 71, 1970–1981. [Google Scholar] [CrossRef]
- Yan, F.; Liu, L.; Dempsey, P.J.; Tsai, Y.H.; Raines, E.W.; Wilson, C.L.; Cao, H.; Cao, Z.; Liu, L.; Polk, D.B. A Lactobacillus rhamnosus GG-derived soluble protein, p40, stimulates ligand release from intestinal epithelial cells to transactivate epidermal growth factor receptor. J. Biol. Chem. 2013, 288, 30742–30751. [Google Scholar] [CrossRef]
- Lebeer, S.; Claes, I.J.; Balog, C.I.; Schoofs, G.; Verhoeven, T.L.; Nys, K.; von Ossowski, I.; de Vos, W.M.; Tytgat, H.L.; Agostinis, P.; et al. The major secreted protein Msp1/p75 is O-glycosylated in Lactobacillus rhamnosus GG. Microb. Cell Factories 2012, 11, 15. [Google Scholar] [CrossRef]
- Lebeer, S.; Claes, I.J.; Verhoeven, T.L.; Vanderleyden, J.; De Keersmaecker, S.C. Exopolysaccharides of Lactobacillus rhamnosus GG form a protective shield against innate immune factors in the intestine. Microb. Biotechnol. 2011, 4, 368–374. [Google Scholar] [CrossRef] [PubMed]
Disclaimer/Publisher’s Note: The statements, opinions and data contained in all publications are solely those of the individual author(s) and contributor(s) and not of MDPI and/or the editor(s). MDPI and/or the editor(s) disclaim responsibility for any injury to people or property resulting from any ideas, methods, instructions or products referred to in the content. |
© 2025 by the authors. Licensee MDPI, Basel, Switzerland. This article is an open access article distributed under the terms and conditions of the Creative Commons Attribution (CC BY) license (https://creativecommons.org/licenses/by/4.0/).