Article

Predicting Plant Breeder Decisions Across Multiple Selection Stages in a Wheat Breeding Program

by
Sebastian Michel
1,*,
Franziska Löschenberger
2,
Christian Ametz
2,
Herbert Bistrich
2 and
Hermann Bürstmayr
1
1
Institute of Crop Breeding and Genomics, University of Natural Resources and Life Sciences Vienna, Konrad-Lorenz-Str. 20, 3430 Tulln, Austria
2
Saatzucht Donau GesmbH & CoKG, Saatzuchtstrasse 11, 2301 Probstdorf, Austria
*
Author to whom correspondence should be addressed.
Crops 2025, 5(5), 69; https://doi.org/10.3390/crops5050069
Submission received: 4 August 2025 / Revised: 23 September 2025 / Accepted: 30 September 2025 / Published: 2 October 2025

Abstract

Selection decisions in plant breeding programs are complex, and breeders aim to integrate phenotypic impressions, genotypic data, and agronomic performance across multiple selection stages to develop successful varieties. This study investigates whether such decisions can be predicted in a commercial winter wheat (Triticum aestivum L.) breeding program using elastic net models trained on genome-wide distributed markers and genomic estimated breeding values. For this purpose, a dataset of several thousand lines tested between 2015 and 2019 in preliminary, advanced, and elite multi-environment yield trials was analyzed across three decision-making scenarios. The predictive models achieved a higher precision than random selection in all scenarios, with an increased performance when genomic estimated breeding values were included as predictors. Comparisons of breeder selections and model recommendations in terms of selection differentials for key agronomic traits showed a substantial overlap in breeding objectives, while both the breeder’s decisions and the model’s suggestions maintained similar levels of genetic diversity. Although the precision of the elastic net model was of moderate magnitude, divergent model recommendations often identified promising alternative lines, highlighting the potential of artificial intelligence to support decision-making in plant breeding.

1. Introduction

Plant breeding involves a complex decision-making process for breeders that is based on the available phenotypic, genotypic, and environmental data [1]. Regarding line breeding programs for crops like wheat, these selection decisions integrate both quantitative trait measurements and qualitative observations made across several years [2]. Such line breeding programs usually use a multi-stage selection scheme, often spanning multiple environments, with an increasing complexity of breeding targets like yield, quality, and disease resistance, and thus an intensification of the challenge of consistent decision-making [3,4,5]. Modern selection schemes aim furthermore for a more informed balance of genetic gain with the maintenance of genetic diversity based on genome-wide marker data [6,7]. Although traditional breeding methods still play a major role in developing improved novel crop varieties [8], recent years have seen the emergence of new artificial intelligence tools to support breeders, including manifold management, mapping, and prediction approaches for individual traits [9,10]. The possible application areas are broad and range, for example, from image-based analysis [11] to breeding program optimization [12]. In particular, the usage of genomic estimated breeding values [13] or spectral-based predictions [14] has led to more informed selection decisions during the last decade, with both being used extensively at the stage of often unreplicated single-location preliminary yield trials [15,16,17,18]. Various statistical and machine learning models, belonging to the broader field of artificial intelligence, are therefore applied to capture the relationship between predictors and phenotypic traits [19]. The breeding values obtained from these models can subsequently guide breeders in making selection decisions, thereby supporting the identification of the individuals with the most favorable performance profiles [20,21].
Aside from these data-driven inputs, the so-called breeder’s eye, based on visual assessment, experience, and prior knowledge of a breeding program’s germplasm also plays a major role in these decisions [2,22,23].
Given this complex framework, breeders have the inherently difficult task of actually making the final selection decisions on ‘maintaining’ or ‘discarding’ the most promising lines among hundreds or thousands of selection candidates. Although these selection decisions have long-term consequences for the success of a breeding program, most predictive breeding or artificial intelligence applications in plant breeding focus on the prediction of individual traits [10,24], but less attention is paid to modeling breeders’ overall multi-trait selection decisions [25]. Modeling the actual decision-making behavior of a breeder, i.e., when and why a breeder selects a line, is thus a less explored aspect of decision support tools in plant breeding. The aim of this study was to evaluate whether breeder selection decisions in a multi-stage winter wheat breeding program can be predicted using elastic net models trained on genome-wide marker data and genomic estimated breeding values, thereby laying the groundwork for a recommender system that supports selection without replacing expert judgment.

2. Materials and Methods

2.1. Plant Material, Classification of Breeder’s Decisions, and Genotypic Data

This study focuses on a set of 4976 winter wheat (Triticum aestivum L.) breeding lines from the breeding program of Saatzucht Donau GesmbH & CoKG, which were tested in unreplicated F5 preliminary yield trials ( P Y T s ) , F6 advanced multi-environment yield trials ( A Y T s ) , and F7 elite multi-environment yield trials ( E Y T s ) between 2015 and 2019 in Austria. The lines were part of five distinct cohorts, each comprising 925–1966 lines. The plant material within each cohort was classified into non-selected lines ( s = 0 ) as well as lines that were selected once ( s = 1 ) or twice ( s = 2 ), based on the breeder’s decisions in the respective P Y T , as well as two subsequent years of A Y T s and E Y T s (Figure 1). These selection decisions were reached by implicitly integrating field-based phenotypic observations, the breeder’s knowledge of the germplasm, and data-driven inputs from statistical and machine learning models, such as best linear unbiased estimates (BLUEs) and genomic estimated breeding values (GEBVs) for major agronomic traits like grain yield, baking quality, and disease resistance.
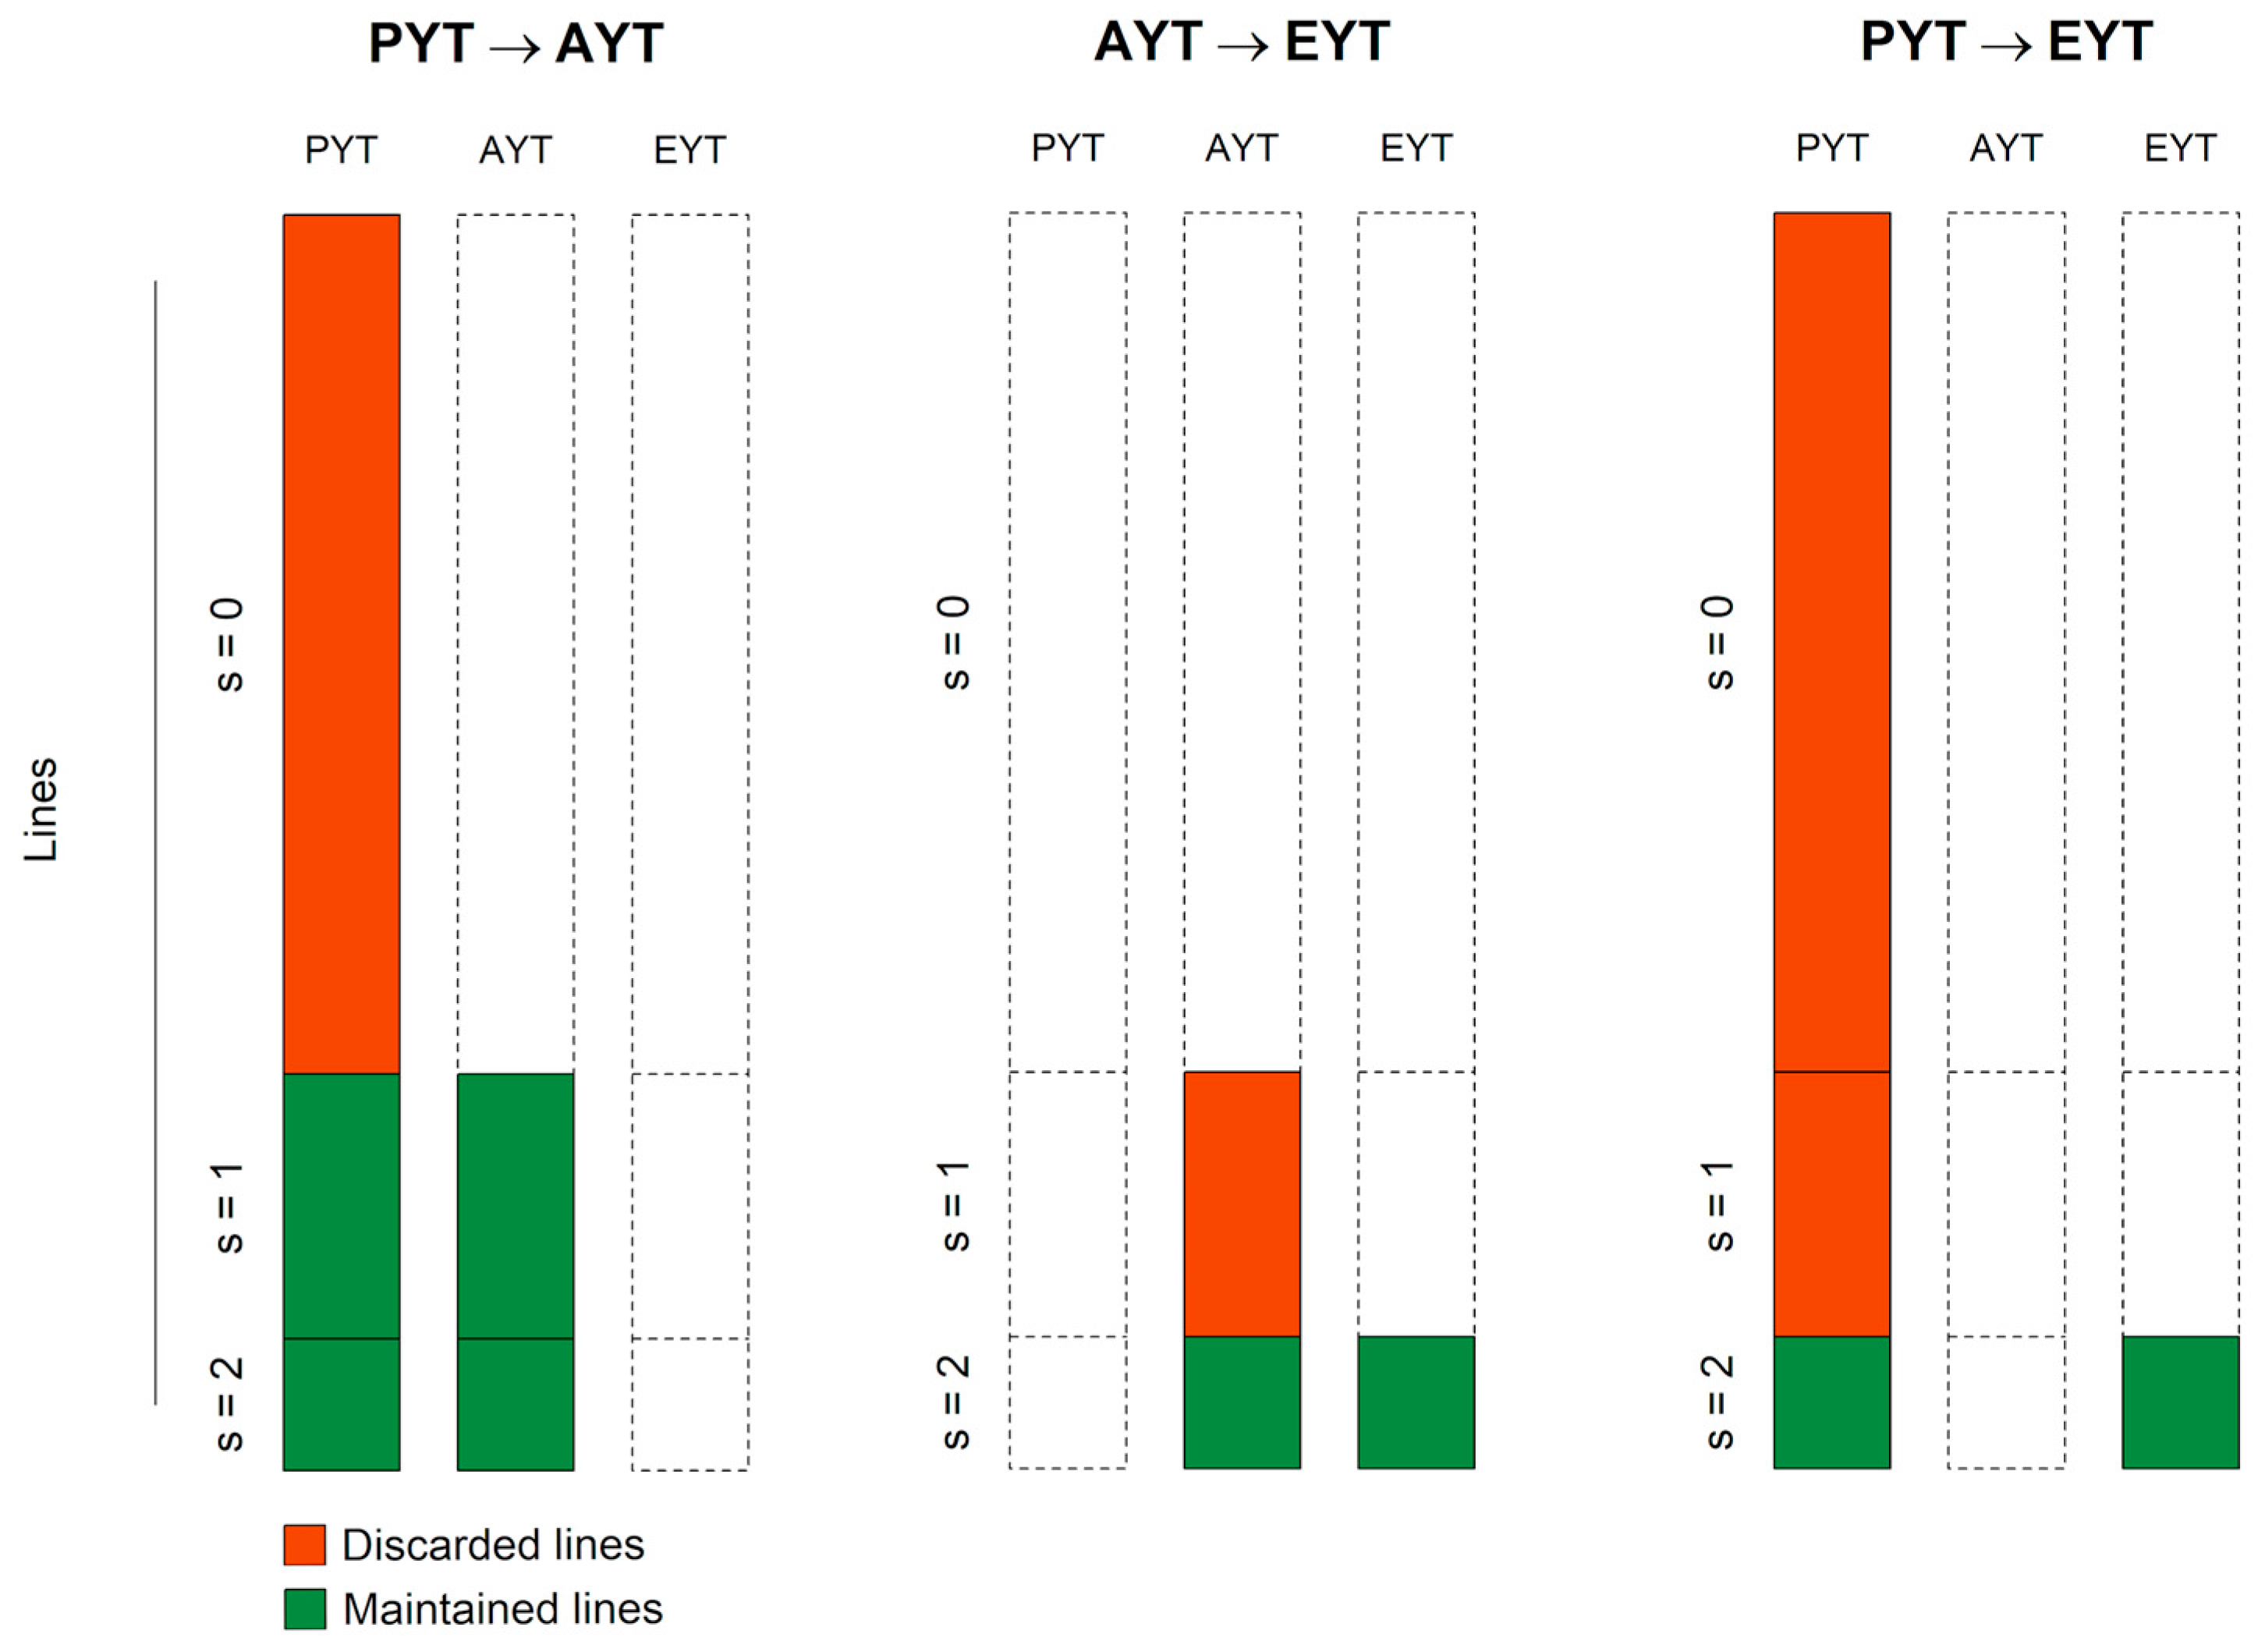
Three scenarios of binary breeder’s decisions, i.e., maintaining versus discarding lines, made during the multi-stage selection scheme of the mentioned winter wheat breeding program were investigated in this study (Figure 2):
  • Selection decisions in P Y T s concerning lines that were forwarded to A Y T s ( P Y T A Y T ) , with a classification of non-selected lines ( s = 0 ) versus lines that were selected once ( s = 1 ) as well as twice ( s = 2 ).
  • Selection decisions in A Y T s concerning lines that were tested again in E Y T s ( A Y T E Y T ) , with a classification of lines that were selected once ( s = 1 ) versus lines that were selected twice ( s = 2 ).
  • Selection decisions concerning all lines tested in P Y T s and the subset of twice-selected lines ( s = 2 ) that finally entered E Y T s after passing A Y T s ( P Y T E Y T ) , with a classification of non-selected lines ( s = 0 ) as well as lines that were selected once ( s = 1 ) versus lines that were selected twice ( s = 2 ).
All breeding lines were genotyped with the DArTcap-targeted genotyping-by-sequencing approach [26], where alleles of the SNP markers were coded as “−1” for homozygous minor, “+1” for homozygous major, and “0” for heterozygous. SNP markers with more than 10% of missing data were filtered out, as were SNP markers with a minor allele frequency smaller than 5%, which resulted in a final dataset of 2225 SNP markers for all subsequent analyses after imputation with the missForest algorithm [27]. The missForest algorithm is a non-parametric imputation method that uses random forests [28] to iteratively predict and replace missing SNP marker values based on observed data patterns [29]. A principal component analysis with these SNP markers did not reveal a clear population structure in the studied panel of winter wheat breeding lines among cohorts or the different selection classes (Figures S1 and S2).
GEBVs for grain yield, protein content, protein yield, extensogram dough energy, and Fusarium head blight (FHB) severity were further used as predictors as well as to assess the selection differentials in the above-mentioned scenarios (Figure 2). These GEBVs were routinely available to the breeder and were central to selection decisions, since they reflect the core breeding objectives of the program: yield, quality, and disease resistance. The GEBVs were derived using genomic best linear unbiased prediction (GBLUP) models trained on extensive multi-environment trial data from advanced generation breeding lines, as described in previous studies [30,31].

2.2. Prediction of the Breeder’s Multi-Stage Selection Decisions by Elastic Net

The ability to predict a breeder’s decisions was assessed by repeatedly randomly sampling sets of 400 lines from each cohort 50 times, where 350 lines came from the class of non-selected lines ( s = 0 ), 40 lines from the class of lines that were selected once ( s = 1 ), and 10 lines from the class of lines that were selected twice ( s = 2 ) to build different training and validation populations. These specific numbers of lines were chosen to reflect selection intensities in actual line breeding programs. The percentage of lines that was selected in P Y T s and entered A Y T s was thus 12.5% ( P Y T A Y T ) , while the percentage of lines that were selected in A Y T s for another round of testing in E Y T s amounted to 20% ( A Y T E Y T ) . Hence, merely 2.5% of the lines tested in P Y T s were selected twice by the breeder and assessed both in A Y T s and E Y T s ( P Y T E Y T ) .
Training populations for the purpose of predicting breeder’s decisions were built by combing the three cohorts from 2015–2017 and 2016–2018 to predict the respective subsequent cohorts for 2018 and 2019. The dependent variable in these predictions was always the above-mentioned classification into ‘maintained’ and ‘discarded’ lines (Figure 2), while two different predictor sets were used: only SNP markers as well as a mixture of SNP markers and GEBVs. The GEBVs were, for this purpose, standardized by
s g e b v i j k = g e b v i j k µ j k σ j k
where g e b v i j k is the genomic estimated breeding value of the ith line for the jth trait in the kth cohort, µ j k is the average of the GEBVs for the jth trait in the kth cohort, and σ j k is the standard deviation of the GEBVs for the jth trait in the kth cohort. These GEBVs were available to the breeder and extensively were used when conducting selection decisions as part of the routine implementation of genomic selection in the wheat breeding program and served merely as predictors in the study at hand. The GEBVs were standardized to improve prediction model stability and prevent traits with larger numeric ranges from disproportionately influencing the employed prediction models.
Breeder’s decisions with regard to ‘maintained’ and ‘discarded’ lines were used as dependent variables in an elastic model, which was implemented with the R package glmnet version 4.1-10 [32]. The elastic net was thus used for classification, where SNPs and GEBVs served as predictors. The predictor effects u ^ for SNPs and GEBVs were estimated as follows:
u ^ = argmin u ( y Z u 2 + λ [ α u 1 +   1 2 1 α u 2 2 ]
where y is the vector of observed breeder’s decisions, coded as 1 (‘maintained’) and 0 (‘discarded’). Z is the design matrix of predictors, here consisting of SNPs or SNP and GEBVs. u is the vector of coefficients, λ the non-negative regularization parameter controlling the overall penalty strength, u 1 the L 1 norm of the coefficient vector, squared u 2 2 the squared L 2 norm of the coefficient vector, and α designates the mixing parameter between the L 1 and L 2 regularizations. Setting the hyperparameter α = 1 3 ensured an equal weight of the L 1 and L 2 regularization for combining shrinkage properties to handle multicollinearity with marker selection properties for reducing the influence of noisy signals [25]. Aiming to reflect a recommender system where the most desirable selection candidates are suggested to a breeder, the lines in the validation population with the highest probability to fall into the class of ‘maintained’ lines were accordingly binary labeled (Figure 2):
  • The 50 lines in the validation population with the highest probability of falling into the class of once- and twice-selected lines ( s e l = 1 and s e l = 2 ) were accordingly labeled with ‘maintain’, and the other 350 lines were labeled as ‘discard’ in the scheme P Y T A Y T .
  • The 10 lines in the validation population with the highest probability of falling into the class of twice-selected lines ( s e l = 2 ) were accordingly labeled with ‘maintain’, and the other 40 lines were labeled as ‘discard’ in the scheme A Y T E Y T .
  • The 10 lines in the validation population with the highest probability of falling into the class of twice-selected lines ( s e l = 2 ) were accordingly labeled with ‘maintain’, and the other 390 lines were labeled as ‘discard’ in the scheme P Y T E Y T .
  • The precision of this classification into ‘maintained’ and ‘discarded’ lines in the different selection schemes was finally estimated by:
    P r e c i s o n = T P T P + F P
    where T P is the number of true positive- and F P is the number of false positive-classified lines in the validation population based on a confusion matrix. T P refers to lines that were predicted as being ‘maintained’ and were actually selected by the breeder, whereas F P refers to lines that were wrongly classified by elastic net as falling into the class of ‘maintained’ lines. The precision was lastly compared to a random choice from among the lines in the validation population in the above-outlined scenarios.

2.3. Comparison of the Breeder’s Selection Decisions and Elastic Net’s Recommendations

Comparisons between the breeder’s selection decisions and elastic net were made in terms of the selection differential based on GEBVs for grain yield, protein content, protein yield, and protein quality (i.e. extensogram dough energy) as well as disease resistance (i.e. Fusarium head blight (FHB) severity). The reference for this comparison was thereby given by the selection differential of the standardized GEBVs of the lines that were selected by the breeder in the different scenarios (Figure 2). This reference was subsequently compared with the selection recommendations made by elastic net with regard to the pending selection candidates, following the above-outlined labeling of lines as ‘maintain’ and ‘discard’. Additionally, the average modified Roger’s distance of the lines chosen either by the breeder or recommended by elastic net was assessed by using the SNP markers in order to approximate the change in genetic diversity by selection as follows:
d i j = 1 2 M m = 1 M n = 1 2 p i m n p j m n 2
where d i j is the modified Roger’s distance between lines i and j, with p i m n being the frequency of the nth allele at the mth SNP marker of the ith line and p j m n the frequency of the nth allele at the mth SNP marker of the jth line, and M is the total number of markers [33].

3. Results

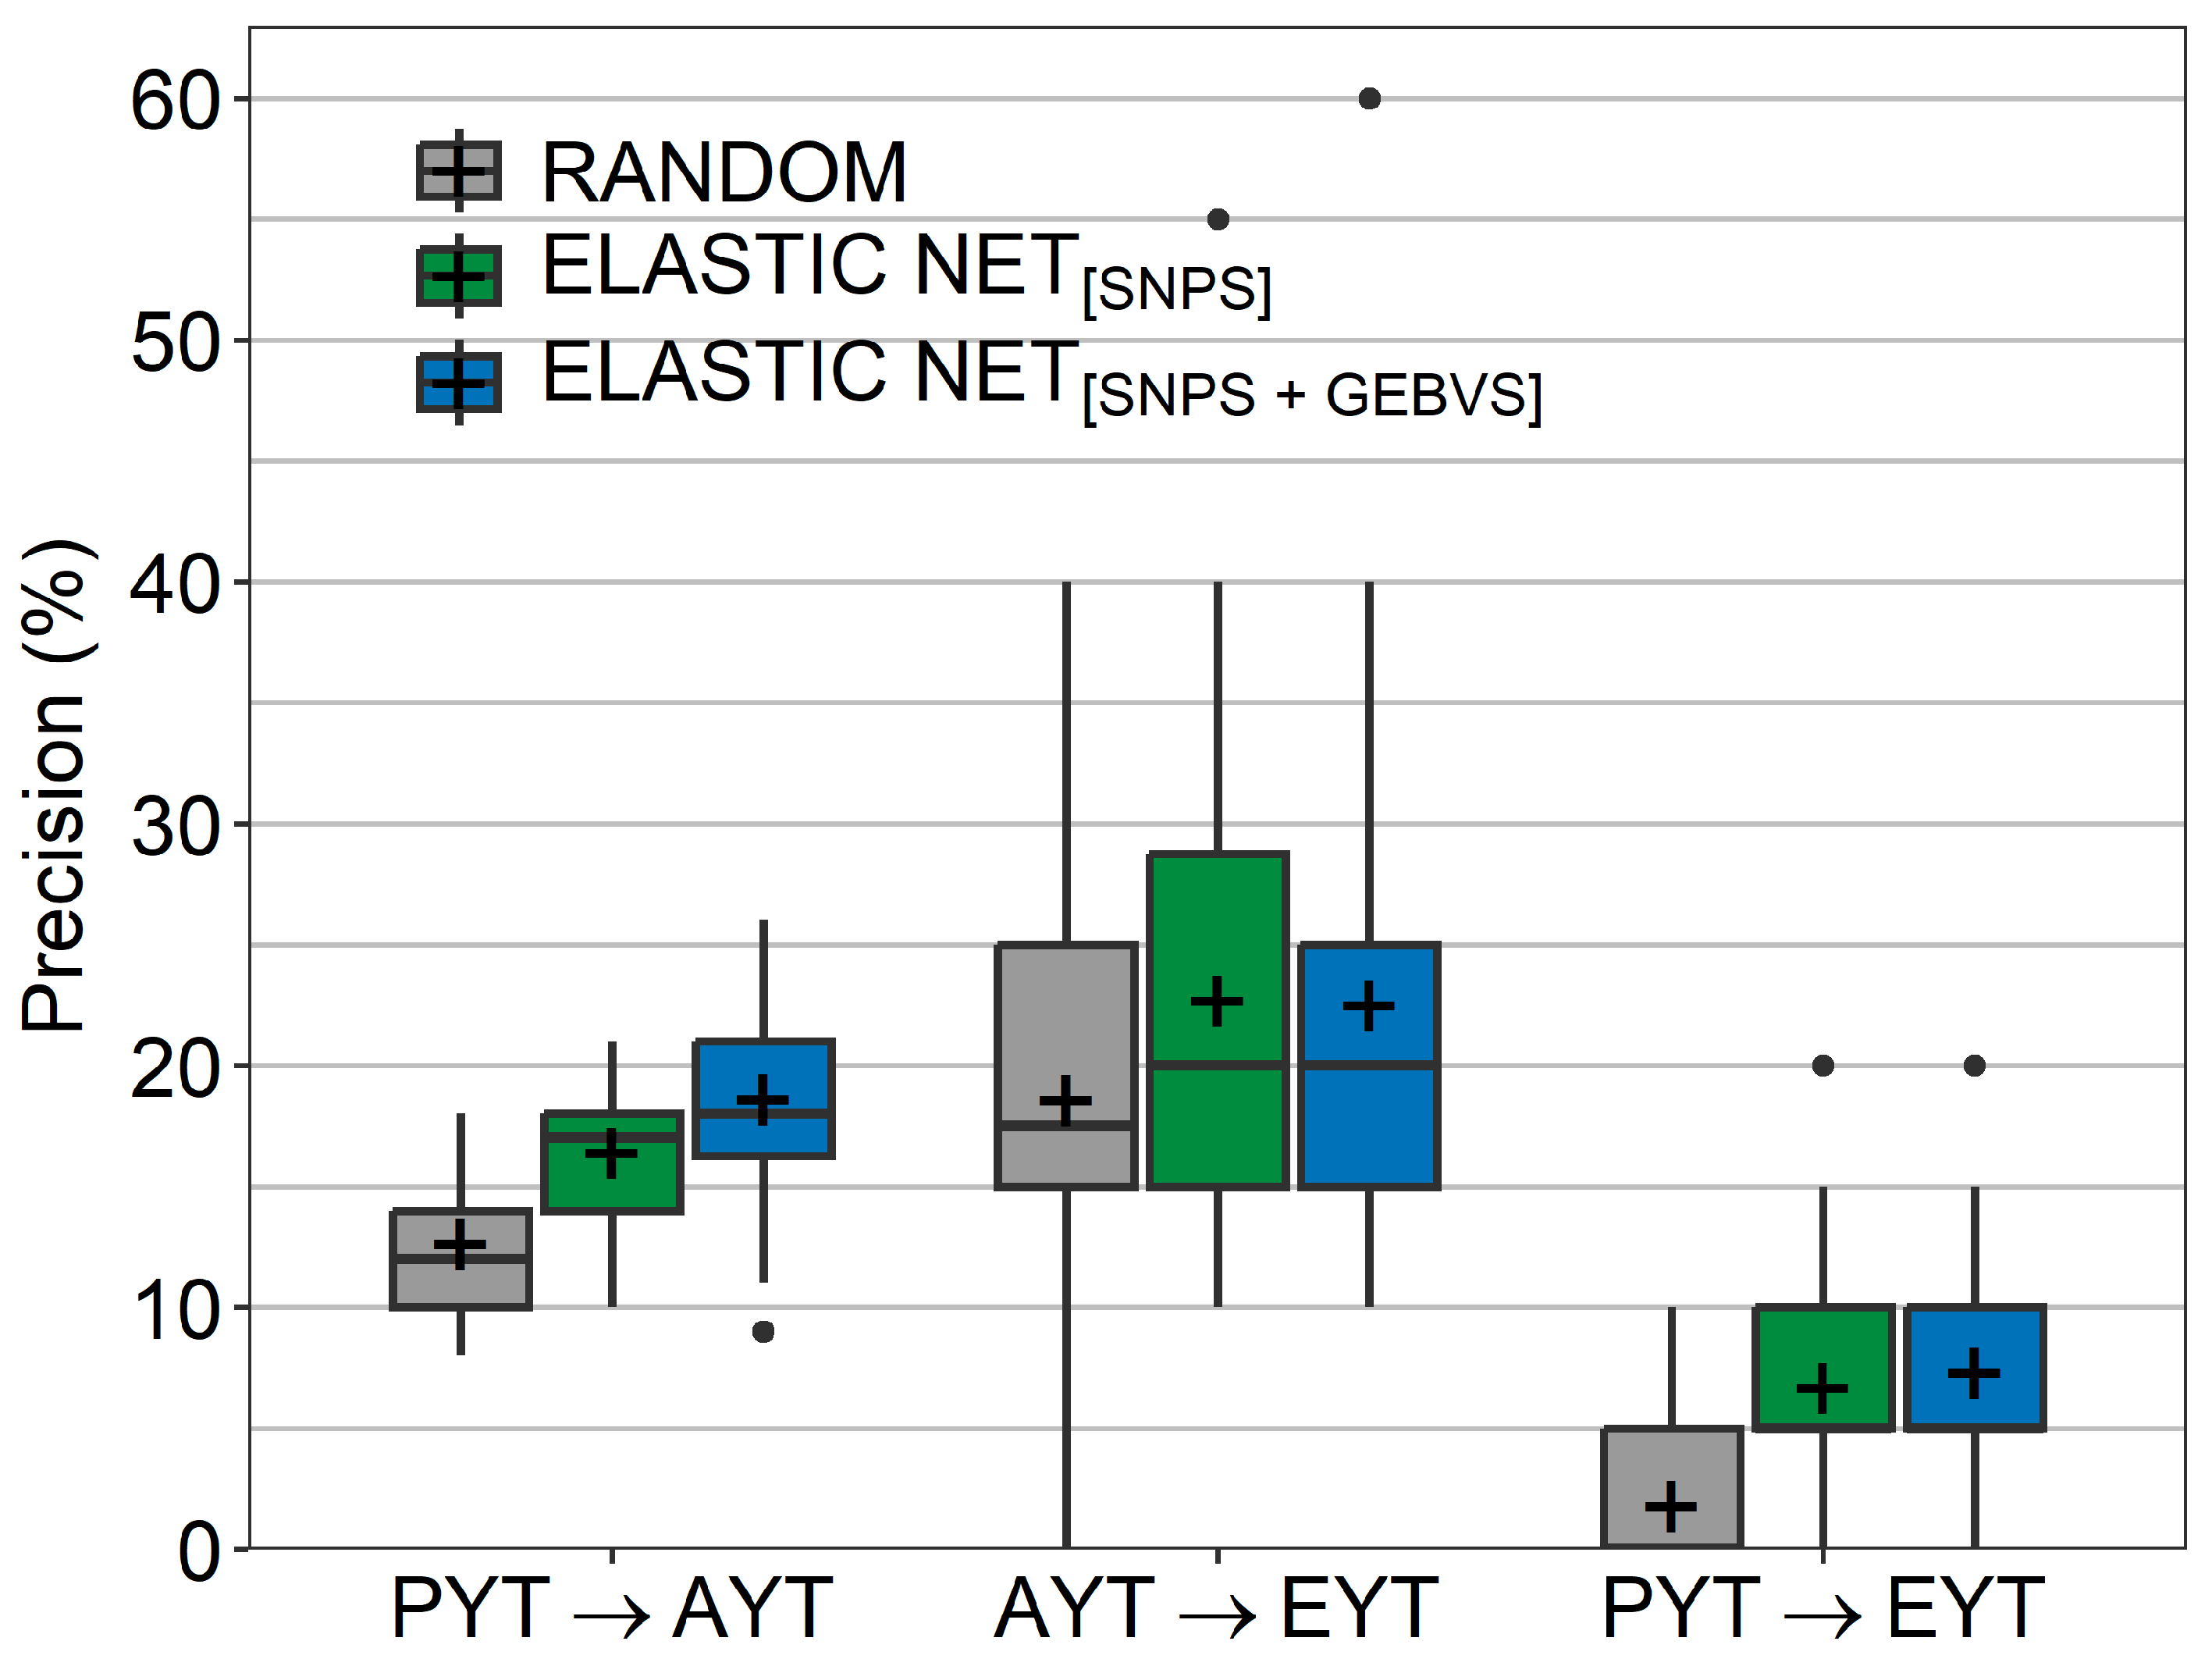
Elastic net models were trained with binary breeder’s selection decisions made in three different cohorts (2015–2017 and 2016–2018), while the subsequent cohort (2018 and 2019) served as a validation population. The precision of these model recommendations was firstly assessed for lines tested in P Y T s that were forwarded to A Y T s ( P Y T A Y T ) . Using solely SNP markers as predictors led to a precision of 16.4%, which was higher than the 12.6% by a random classification (Figure 3). Combining the SNP markers with the GEBVs of major agronomic traits led to a further increase in precision with an average of 18.6%. A similar observation was made for the scenario of lines that were forwarded from A Y T s to E Y T s ( A Y T E Y T ) , where elastic net performed better with a precision of 22.5–22.7% in comparison to the precision of a random selection (18.6%). Although the precision of elastic net for predicting the breeder’s selection decisions was quite low in terms of immediately predicting lines that were selected in P Y T s and maintained to the stage of E Y T s ( P Y T E Y T ) (6.7–7.3%), it was still markedly higher than a random choice of lines (1.8%).
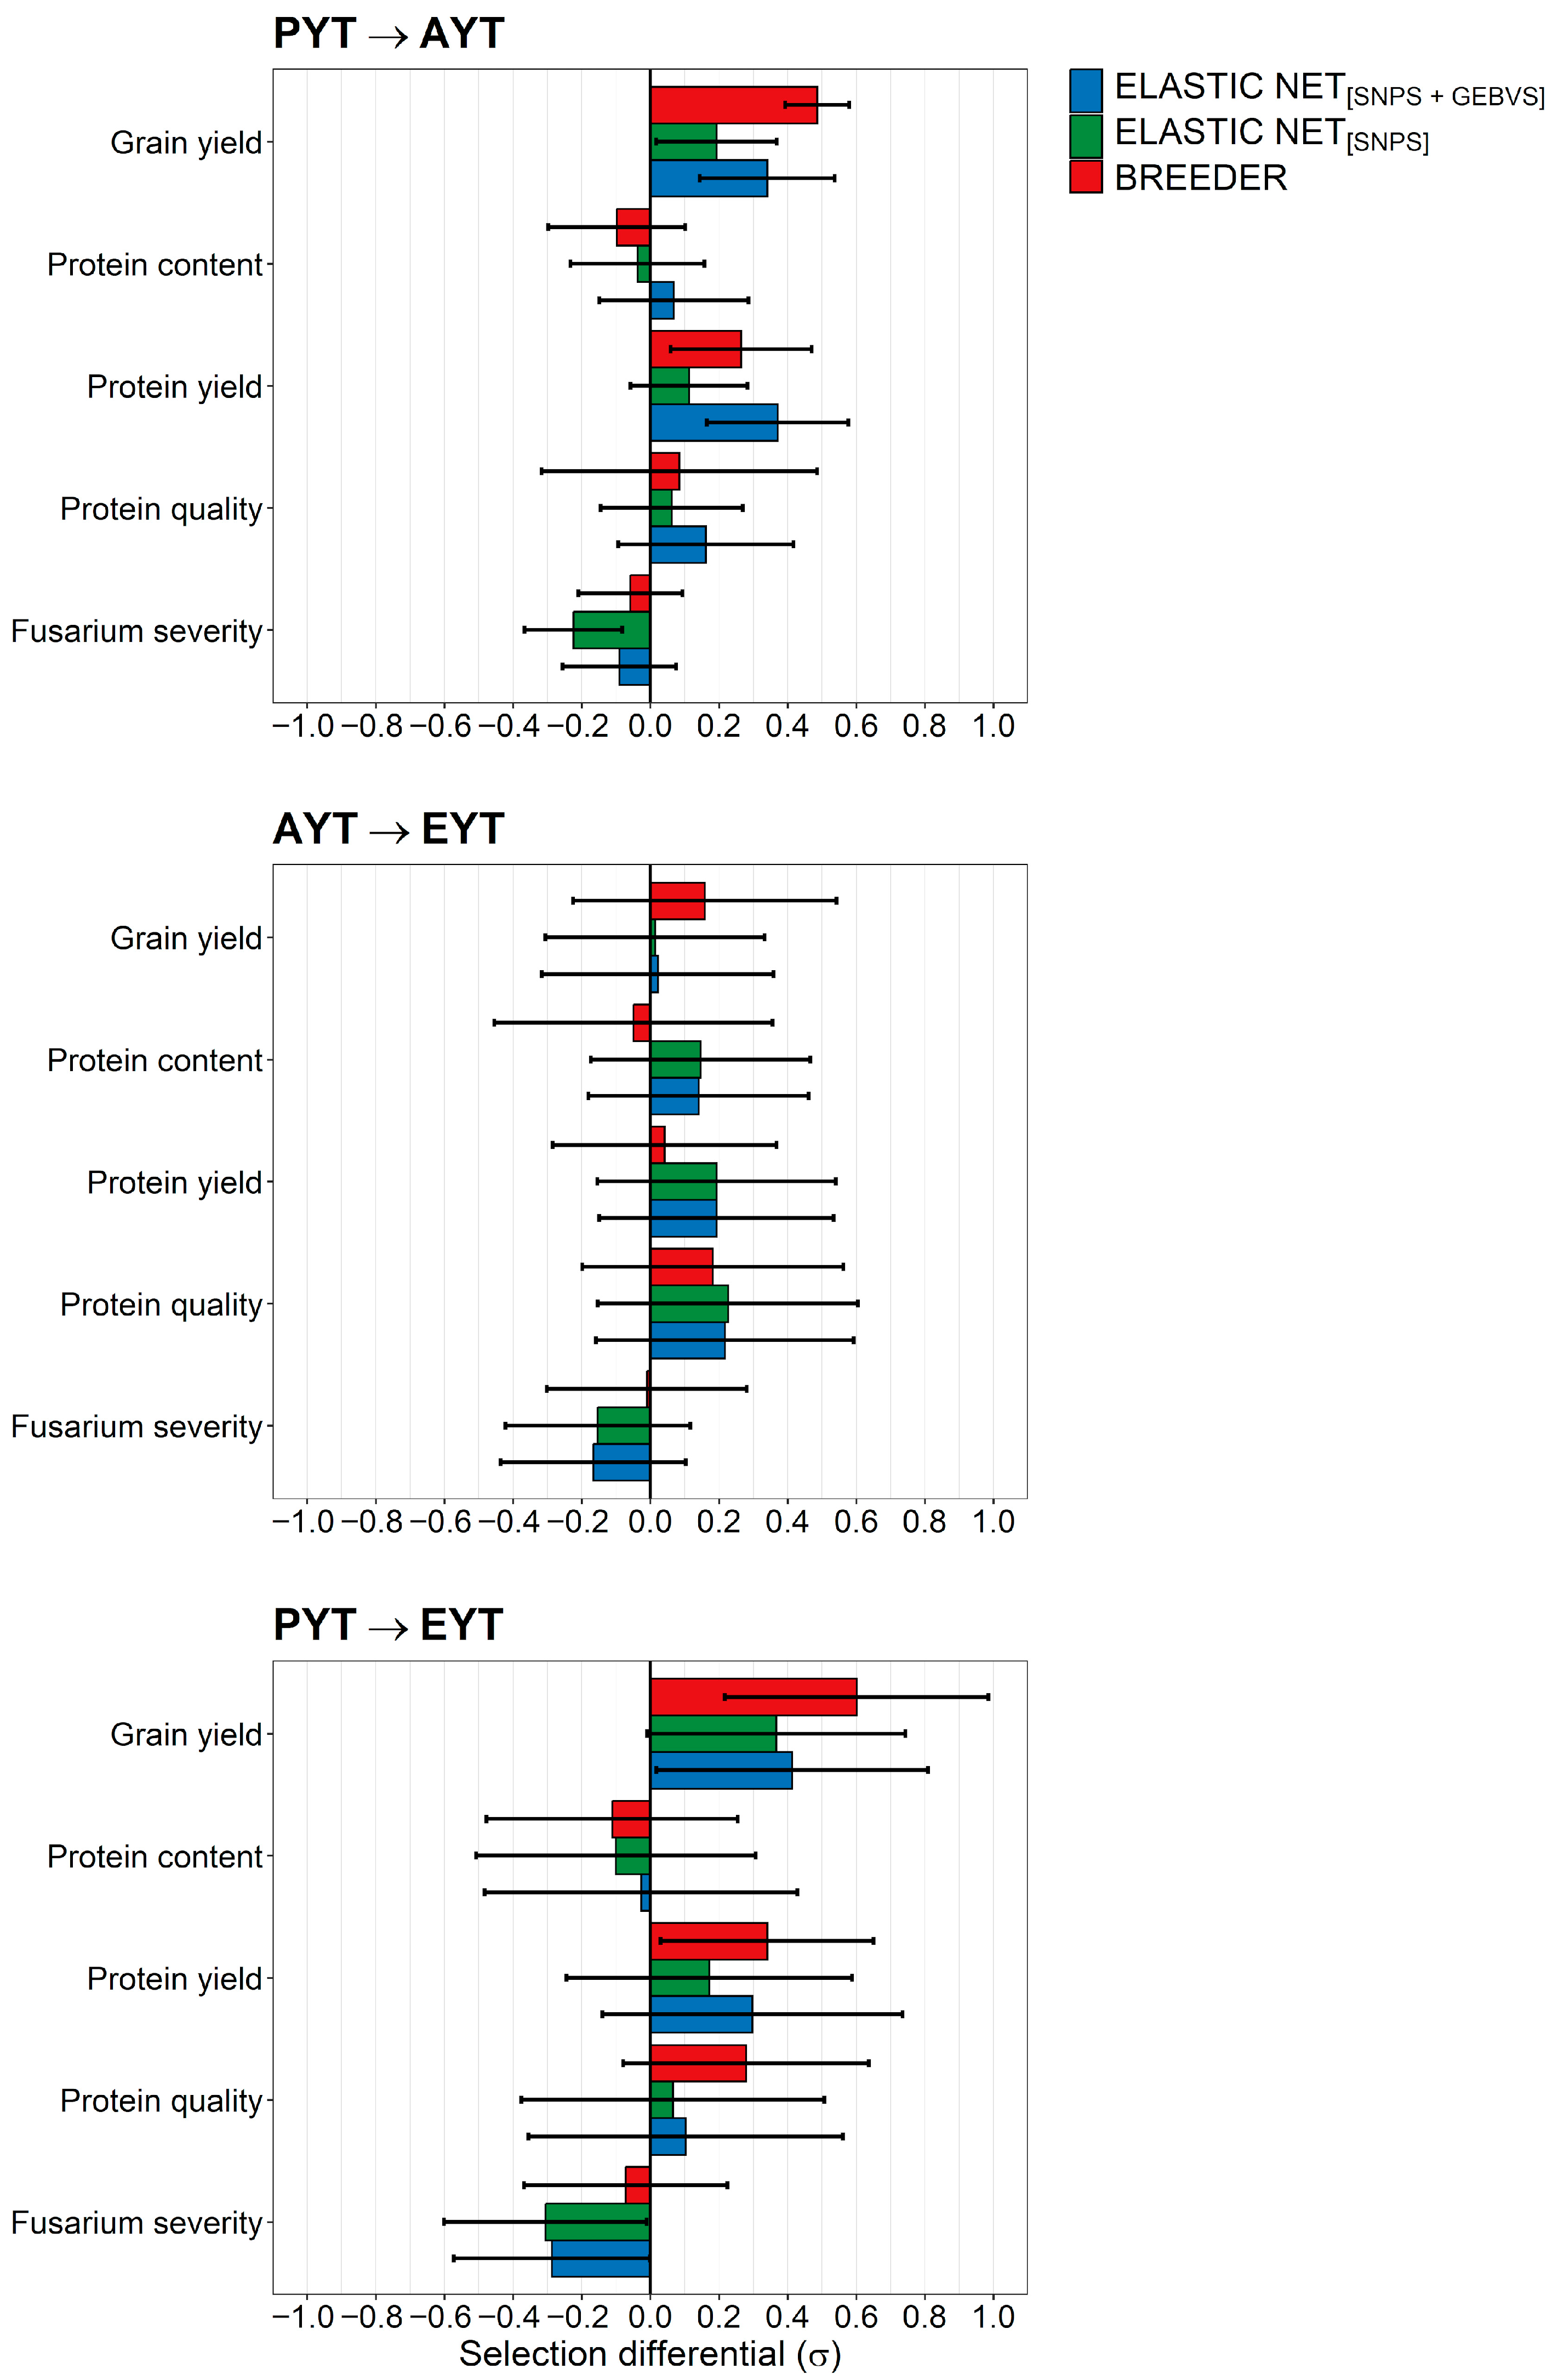
Comparing the breeder’s selection decisions and elastic net’s recommendations in terms of the selection differential applied to GEBVs in the respective scenarios and validation populations clearly revealed the general aims of increasing grain yield and baking quality as well as the disease resistance of a winter bread wheat breeding program (Figure 4). The relative importance of each of these aspects assigned by the breeder’s selection decisions and elastic net’s recommendations varied though in the different selection scenarios ( P Y T A Y T , A Y T E Y T , P Y T E Y T ) . The increase in protein yield in the breeder’s selection decisions was mostly accountable to an increase in grain yield, while elastic net’s recommendations also emphasized a slight increase in protein content on the expense of grain yield. The protein quality, as measured by the extensogram dough energy, received on the other hand a similar importance both in the breeder’s actual decisions as well as the recommendations made by elastic net. Nevertheless, the application of a stronger selection pressure towards a lower disease severity was suggested by elastic net, as indicated by a larger selection differential with respect to FHB severity, in comparison to the actual breeder’s choice of the lines.
Nevertheless, following either the breeder’s actual choice or the recommendations decreased the average modified Roger’s distance among the selected lines in all scenarios, indicating a slight reduction in genetic diversity during multi-stage selection in the breeding program (Figure 5). This reduction in genetic diversity was similar to the stage of P Y T to A Y T for both the breeder’s selection and elastic net’s recommendations ( P Y T A Y T ) . However, this decrease was slightly lower when selecting lines in A Y T s for re-testing in E Y T s   ( A Y T E Y T ) in comparison to all lines tested in this stage, suggesting that the breeder had a strong interest in both balancing genetic gain for major agronomic traits and maintaining the genetic diversity in the breeding program’s gene pool.

4. Discussion

Selection decisions in plant breeding are an inherently complex endeavor where multiple factors such as the field impression, disease resistance, quality, and yield of the pending selection candidates play a certain role [2,22]. Technologies like genomic prediction [20] have thus been extensively used in line breeding programs in recent years [34,35], mainly to guide decisions with respect to lines that are forwarded to more costly and thorough testing in multi-environment trials during the multi-stage selection process in a variety development pipelines [5,36,37]. The assessment of the actual field performance in multi-environment trials for yield, more sophisticated quality analysis, and testing in multiple replicated disease nurseries delivers subsequently more precise information on each selection candidate. Given this plethora of information, the breeder in charge has finally to decide which genotypes should be forwarded to the next stage of multi-environment trials and lastly official registration trials, determining in this way the success of a plant breeding program.
This study aimed to tackle this issue in the form of a recommender system that can be generally employed to reduce the problem of data overload in the process of finding relevant and useful content, e.g., in databases [38] and entertainment and shopping platforms [39]. Hence, a multitude of applications and modeling approaches have been developed in this area of research [40], with the interactions of artificial intelligence and humans being of central interest for practical implementation [41]. In the case of a wheat breeding program, such a recommender system would make it possible to screen the relevant information like field scorings or genomic breeding values more systematically without being overwhelmed by vast amounts information from all selection candidates at once [25,42]. Such a recommender system can be based on a positive or negative evaluation of lines from the same gene pool from previous years and cohorts in a breeding program, and represents an artificial intelligence approach where a model recommends similar not-yet-rated selection candidates based on genetic relatedness as well as performance predictions or estimates [25,42]. These recommendations can be used to support a breeder’s selection decisions by prioritizing the recommended lines when screening all selection candidates with regard to their estimates and predictions for the numerous agronomic traits that have to be considered. Training an elastic net model with a breeder’s decisions for this purpose revealed that the breeder’s selection decisions in P Y T s and A Y T s were partly predictable. This was evident from the relatively higher precision of classification into ‘maintained’ and ‘discarded’ lines seen from the elastic net in comparison to the random classification for all tested multi-stage selection scenarios. This suggested that the elastic model can help prioritize early-generation selection candidates, especially when selection decisions must be made among many thousands of lines. Selection decisions in advanced generations are usually made by the breeder with data of higher quality and among a smaller set of lines, nevertheless a recommender system might still be useful in terms of providing a second opinion alongside field observations and further data-driven selection tools. The precision for predicting the subset lines that passed P Y T s and A Y T s and finally entered E Y T s was very low, so the elastic model was not reliable for directly predicting long-term advancement and highlighted that cumulative breeder’s knowledge and unforeseen performance factors cannot be easily modeled in a recommender system. The usefulness as decision-support tools of such a recommender system based, for example, on an elastic net, can thus be seen in the early and intermediate stages of variety development where selection decisions among many lines have to made.
Some increase in the precision of the employed elastic net model was furthermore observed when using a combination of both SNP markers and GEBVs as predictors in these cases, indicating that the preferences of the breeder were well-caught by agronomic performance and genotyping data.
Such observations were also made when training models with genome-wide SNP markers with farmers’ preferences in participatory breeding approaches [43]. This highlights that such decision-making has a genetic component, where preferences by farmers are oftentimes linked with traits associated with yield, quality, and disease resistance [44,45,46]. These preferences are quite similar to commercial breeders in centralized breeding programs, where both data-driven inputs, but also indirect traits associated with major agronomic traits like tassel morphology in maize [47] or tillering capacity in wheat [48] are considered in early-generation selection decisions. Hence the consistency with regard to the breeding goals of increasing grain yield, baking quality, and disease resistance, or at least keeping the latter two stable, by the breeder or by following the recommendations made by the elastic net model was not surprising in the study at hand. In addition to improving agronomically relevant traits, managing the genetic diversity in the gene pool of a breeding program is another major task for the responsible breeder [49,50,51]. Since genetic diversity can be considered as the fuel that drives genetic gain, it is indispensable for crop genetic improvement [52,53]. The change in the average Roger’s distance was thus of a rather small magnitude based on recommendations by elastic net as well as the actual breeder’s decisions, with the strongest change in a single stage of the multi-stage scheme selection from P Y T to A Y T . The recommendations made by elastic net aimed thus, like the breeder, to both handle genetic diversity in combination with shifting the population mean for major agronomic traits into the desired direction. This observation might be expected, since training a model like elastic net with breeder’s decisions can be regarded as a more elaborate form of a retrospective selection index [54], which takes into account the genetic relatedness of past and present selection candidates, as well as the selection differential for agronomic traits.
Although the overall precision of elastic net’s recommendations—i.e., the overlap with the breeder’s actual decisions—was rather low, the general trend with respect to breeding goals and genetic diversity was similar. This firstly showed that in many cases the elastic net model made different suggestions than the breeder with regard pending selection candidates. Nevertheless, these deviating suggestions still led to promising lines in retrospect, showing the potential of artificial intelligence to discover new useful combinations. Integrating both aspects in a reciprocal fine-tuning scheme with feed-back from the breeder to the machine, i.e., the model, might accordingly be an interesting option for a practical implementation [25]. Such a scheme would feature a model update and improved recommendations for variety selection based on breeder feedback in the manner of a hybrid between human and artificial intelligence (Figure S3). Applying this scheme in the study at hand revealed the practical usefulness for breeders as there appeared to be no need to look at the whole array of selection candidates to reach a final selection decision, especially in P Y T s (Figure S4). This synergistic, proactive, and purposeful interaction between artificial intelligence and humans aims to augment instead of replace human intelligence [55,56,57], and might lead to a more refined and elaborated decision-making process in plant breeding programs.

5. Conclusions

This study explored the potential of developing a recommender system that incorporates breeders’ preferences to assist with early and advanced generation selection in plant breeding, using the selection decisions of an experienced breeder that managed a commercial wheat breeding program as a basis. The recommendations made by an elastic net model aligned well with core breeding objectives, such as improving or maintaining the performance for major agronomic traits as well as preserving genetic diversity across multiple stages of selection. Interestingly, even when the model’s suggestions diverged from the breeder’s choices, they frequently identified promising alternative candidates, highlighting the potential of artificial intelligence to uncover novel and useful genetic combinations. Nevertheless, the precision of the elastic net model was only of a moderate magnitude, and not sufficient for independent selection. This precision might be increased by using more sophisticated machine learning models like gradient boosting machines or deep learning techniques. However, the recommendations should still be used only as a decision-support tool with the final selection decisions remaining in the hands of the breeder.
Furthermore, the basic classification into ‘maintained’ and ‘discarded’ lines as sued in this study might oversimplify complex breeder decisions for the purpose of practical applications. A practical implementation of such a recommender system would thus, among other things, require careful training population designs that also consider underlying factors that explain how these selection decisions were reached; for example, a strong disease pressure or other stresses that might have biased the selection decisions in individual years. Lastly, extending such a recommender system by using more objective information like baking quality classes, actual performance in different regions and production systems to provide recommendations with respect to adaptation for specific trial series, products, and marketing segments could be one further avenue that might also be explored in the future. Implementing such a recommender system as a feedback-driven framework, where breeders iteratively refine and guide model predictions, would finally offer a promising path toward integrating artificial and human intelligence.

Supplementary Materials

The following supporting information can be downloaded at: https://www.mdpi.com/article/10.3390/crops5050069/s1, Figure S1: Principal component analysis of the 4976 winter wheat (Triticum aestivum L.) breeding lines in the study with respect to the cohorts 2015–2019; Figure S2: Principal component analysis of the 4976 winter wheat (Triticum aestivum L.) breeding lines in the study with respect to the classes of non-selected lines ( s = 0 ) as well as lines that were selected once ( s = 1 ) or twice ( s = 2 ), based on the breeder’s decisions in the respective preliminary yield trials ( P Y T ) as well as two subsequent years of advanced and elite multi-environment yield trials; Figure S3: Schematic representation of the suggested reciprocal fine-tuning algorithm, where the breeder actively provides feedback to a machine learning algorithm; Figure S4: Percentage of chosen target lines and the total percentage of labeled lines among all selection candidates in each iteration of the suggested reciprocal fine-tuning algorithm. A random choice among the selection candidates (RANDOM) was compared with elastic nets trained nets with SNP markers ( E L A S T I C N E T [ S N P S ] ) as well as a mixture of SNP markers and genomic estimated breeding values (GEBVS) of major agronomic traits ( E L A S T I C N E T [ S N P S + G E B V S ] ) . Selection decisions were investigated concerning lines that were forwarded from preliminary yield trials to advanced yield trials ( P Y T A Y T ) , concerning lines that were tested again in elite yield trials ( A Y T E Y T ) as well as concerning all lines tested in the stage of preliminary yield trials and the subset of lines that finally entered elite yield trials ( P Y T E Y T ) .

Author Contributions

Conceptualization, S.M. and F.L.; methodology, S.M.; software, S.M.; validation, S.M. and C.A.; formal analysis, S.M.; investigation, S.M. and F.L.; resources, F.L., H.B. (Herbert Bistrich), and C.A.; data curation, F.L.; writing—original draft preparation, S.M.; writing—review and editing, S.M. and F.L.; visualization, S.M.; supervision, H.B. (Hermann Bürstmayr); project administration, H.B. (Hermann Bürstmayr) and F.L.; funding acquisition, F.L. All authors have read and agreed to the published version of the manuscript.

Funding

This research was funded by the “Frontrunner” FFG project TRIBIO (35412407).

Data Availability Statement

The datasets generated during and/or analyzed during the current study are available from the corresponding author upon reasonable request.

Acknowledgments

We would like to thank Maria Bürstmayr and her team for the tremendous work when extracting the DNA of the hundreds of wheat lines. We would also like to thank the anonymous reviewers for their comments and suggestions for improving the manuscript.

Conflicts of Interest

Authors F.L., C.A., and H.B. (Herbert Bistrich) were employed by the company Saatzucht Donau GesmbH & CoKG. The remaining authors declare that the research was conducted in the absence of any commercial or financial relationships that could be construed as a potential conflict of interest.

References

  1. Bernardo, R. Reinventing Quantitative Genetics for Plant Breeding: Something Old, Something New, Something Borrowed, Something BLUE. Heredity 2020, 125, 375–385. [Google Scholar] [CrossRef]
  2. Duvick, D.N. Theory, Empiricism and Intuition in Professional Plant Breeding. In Farmers, Scientists and Plant Breeding: Integrating Knowledge and Practice; CABI Publishing: Wallingford, UK, 2002; pp. 189–211. [Google Scholar]
  3. Batista, L.G.; Gaynor, R.C.; Margarido, G.R.A.; Byrne, T.; Amer, P.; Gorjanc, G.; Hickey, J.M. Long-Term Comparison between Index Selection and Optimal Independent Culling in Plant Breeding Programs with Genomic Prediction. PLoS ONE 2021, 16, e0235554. [Google Scholar] [CrossRef]
  4. Akdemir, D.; Beavis, W.; Fritsche-Neto, R.; Singh, A.K.; Isidro-Sánchez, J. Multi-Objective Optimized Genomic Breeding Strategies for Sustainable Food Improvement. Heredity 2019, 122, 672–683. [Google Scholar] [CrossRef]
  5. Guzmán, C.; Peña, R.J.; Singh, R.; Autrique, E.; Dreisigacker, S.; Crossa, J.; Rutkoski, J.; Poland, J.; Battenfield, S. Wheat Quality Improvement at CIMMYT and the Use of Genomic Selection on It. Appl. Transl. Genom. 2016, 11, 3–8. [Google Scholar] [CrossRef]
  6. Gorjanc, G.; Gaynor, R.C.; Hickey, J.M. Optimal Cross Selection for Long-Term Genetic Gain in Two- Part Programs with Rapid Recurrent Genomic Selection. Theor. Appl. Genet. 2018, 131, 1953–1966. [Google Scholar] [CrossRef]
  7. Vanavermaete, D.; Fostier, J.; Maenhout, S.; De Baets, B. Adaptive Scoping: Balancing Short- and Long-Term Genetic Gain in Plant Breeding. Euphytica 2022, 218, 109. [Google Scholar] [CrossRef]
  8. Repinski, S.L.; Hayes, K.N.; Miller, J.K.; Trexler, C.J.; Bliss, F.A. Plant Breeding Graduate Education: Opinions about Critical Knowledge, Experience, and Skill Requirements from Public and Private Stakeholders Worldwide. Crop Sci. 2011, 51, 2325–2336. [Google Scholar] [CrossRef]
  9. Sangjan, W.; Kick, D.R.; Washburn, J.D. Improving Plant Breeding through AI-Supported Data Integration. Theor. Appl. Genet. 2025, 138, 132. [Google Scholar] [CrossRef] [PubMed]
  10. Farooq, M.A.; Gao, S.; Hassan, M.A.; Huang, Z.; Rasheed, A.; Hearne, S.; Prasanna, B.; Li, X.; Li, H. Artificial Intelligence in Plant Breeding. Trends Genet. 2024, 40, 891–908. [Google Scholar] [CrossRef]
  11. Roth, L.; Fossati, D.; Krähenbühl, P.; Walter, A.; Hund, A. Image-Based Phenomic Prediction Can Provide Valuable Decision Support in Wheat Breeding. Theor. Appl. Genet. 2023, 136, 162. [Google Scholar] [CrossRef] [PubMed]
  12. Moeinizade, S.; Hu, G.; Wang, L. A Reinforcement Learning Approach to Resource Allocation in Genomic Selection. Intell. Syst. with Appl. 2022, 14, 200076. [Google Scholar] [CrossRef]
  13. Robertsen, C.; Hjortshøj, R.; Janss, L. Genomic Selection in Cereal Breeding. Agronomy 2019, 9, 95. [Google Scholar] [CrossRef]
  14. Robert, P.; Brault, C.; Rincent, R.; Segura, V. Phenomic Selection: A New and Efficient Alternative to Genomic Selection. In Methods in Molecular Biology; Springer Nature: Berlin, Germany, 2022; Volume 2467, pp. 397–420. ISBN 9781071622056. [Google Scholar]
  15. Borrenpohl, D.; Huang, M.; Olson, E.; Sneller, C. The Value of Early-Stage Phenotyping for Wheat Breeding in the Age of Genomic Selection. Theor. Appl. Genet. 2020, 133, 2499–2520. [Google Scholar] [CrossRef]
  16. Robert, P.; Auzanneau, J.; Goudemand, E.; Oury, F.-X.; Rolland, B.; Heumez, E.; Bouchet, S.; Le Gouis, J.; Rincent, R. Phenomic Selection in Wheat Breeding: Identification and Optimisation of Factors Influencing Prediction Accuracy and Comparison to Genomic Selection. Theor. Appl. Genet. 2022, 135, 895–914. [Google Scholar] [CrossRef]
  17. Meyenberg, C.; Braun, V.; Longin, C.F.H.; Thorwarth, P. Feature Engineering and Parameter Tuning: Improving Phenomic Prediction Ability in Multi-Environmental Durum Wheat Breeding Trials. Theor. Appl. Genet. 2024, 137, 188. [Google Scholar] [CrossRef]
  18. Belamkar, V.; Guttieri, M.J.; Hussain, W.; Jarquín, D.; El-basyoni, I.; Poland, J.; Lorenz, A.J.; Baenziger, P.S. Genomic Selection in Preliminary Yield Trials in a Winter Wheat Breeding Program. G3 Genes|Genomes|Genet. 2018, 8, 2735–2747. [Google Scholar] [CrossRef] [PubMed]
  19. Desta, Z.A.; Ortiz, R. Genomic Selection: Genome-Wide Prediction in Plant Improvement. Trends Plant Sci. 2014, 19, 592–601. [Google Scholar] [CrossRef] [PubMed]
  20. Meuwissen, T.H.E.; Hayes, B.J.; Goddard, M.E. Prediction of Total Genetic Value Using Genome-Wide Dense Marker Maps. Genetics 2001, 157, 1819–1829. [Google Scholar] [CrossRef]
  21. Rincent, R.; Charpentier, J.-P.; Faivre-Rampant, P.; Paux, E.; Le Gouis, J.; Bastien, C.; Segura, V. Phenomic Selection Is a Low-Cost and High-Throughput Method Based on Indirect Predictions: Proof of Concept on Wheat and Poplar. G3 Genes|Genomes|Genet. 2018, 8, 3961–3972. [Google Scholar] [CrossRef] [PubMed]
  22. Tschermak, E. Ein Leben Fuer Die Zuechtung. Aus Der Werkstatt Eines Alten Pflanzenzuechter. Odal 1941, 10, 768–777. [Google Scholar]
  23. Timmermann, M. The Breeder’s Eye—Theoretical Aspects of the Breeder’s Decision-Making. In Proceedings of the COST SUSVAR Workshop on Cereal Crop Diversity: Implications for Production and Products; Ostergard, H., Fontaine, L., Eds.; Institut Technique de l’Agriculture Biologique: Paris, France, 2006; pp. 118–123. ISBN 2-9515855-7-8 9782951585577. [Google Scholar]
  24. Crossa, J.; Montesinos-Lopez, O.A.; Costa-Neto, G.; Vitale, P.; Martini, J.W.R.; Runcie, D.; Fritsche-Neto, R.; Montesinos-Lopez, A.; Pérez-Rodríguez, P.; Gerard, G.; et al. Machine Learning Algorithms Translate Big Data into Predictive Breeding Accuracy. Trends Plant Sci. 2024, 30, 167–184. [Google Scholar] [CrossRef]
  25. Michel, S.; Löschenberger, F.; Ametz, C.; Bistrich, H.; Bürstmayr, H. Can We Teach Machines to Select Like a Plant Breeder? A Recommender System Approach to Support Early Generation Selection Decisions Based on Breeders’ Preferences. Crops 2025, 5, 31. [Google Scholar] [CrossRef]
  26. Diversity Arrays Technology Pty Ltd. DArT P/L. 2020. Available online: https://www.diversityarrays.com/ (accessed on 1 October 2025).
  27. Stekhoven, D.J.; Bühlmann, P. Missforest-Non-Parametric Missing Value Imputation for Mixed-Type Data. Bioinformatics 2012, 28, 112–118. [Google Scholar] [CrossRef]
  28. Breiman, L. Random Forests. Mach. Learing 2001, 45, 5–32. [Google Scholar] [CrossRef]
  29. Rutkoski, J.E.; Poland, J.; Jannink, J.-L.; Sorrells, M.E. Imputation of Unordered Markers and the Impact on Genomic Selection Accuracy. G3 Genes|Genomes|Genet. 2013, 3, 427–439. [Google Scholar] [CrossRef]
  30. Moreno-Amores, J.; Michel, S.; Löschenberger, F.; Buerstmayr, H. Dissecting the Contribution of Environmental Influences, Plant Phenology, and Disease Resistance to Improving Genomic Predictions for Fusarium Head Blight Resistance in Wheat. Agronomy 2020, 10, 2008. [Google Scholar] [CrossRef]
  31. Michel, S.; Löschenberger, F.; Ametz, C.; Pachler, B.; Sparry, E.; Bürstmayr, H. Combining Grain Yield, Protein Content and Protein Quality by Multi—Trait Genomic Selection in Bread Wheat. Theor. Appl. Genet. 2019, 132, 2767–2780. [Google Scholar] [CrossRef]
  32. Tay, J.K.; Narasimhan, B.; Hastie, T. Elastic Net Regularization Paths for All Generalized Linear Models. J. Stat. Softw. 2023, 106, 1–31. [Google Scholar] [CrossRef] [PubMed]
  33. Reif, J.C.; Melchinger, A.E.; Frisch, M. Genetical and Mathematical Properties of Similarity and Dissimilarity Coefficients Applied in Plant Breeding and Seed Bank Management. Crop Sci. 2005, 45, 1–7. [Google Scholar] [CrossRef]
  34. Sneller, C.; Ignacio, C.; Ward, B.; Rutkoski, J.; Mohammadi, M. Using Genomic Selection to Leverage Resources among Breeding Programs: Consortium-Based Breeding. Agronomy 2021, 11, 1555. [Google Scholar] [CrossRef]
  35. Tsai, H.-Y.Y.; Janss, L.L.; Andersen, J.R.; Orabi, J.; Jensen, J.J.D.; Jahoor, A.; Jensen, J.J.D. Genomic Prediction and GWAS of Yield, Quality and Disease-Related Traits in Spring Barley and Winter Wheat. Sci. Rep. 2020, 10, 3347. [Google Scholar] [CrossRef]
  36. Adunola, P.; Ferrão, L.F.V.; Benevenuto, J.; Azevedo, C.F.; Munoz, P.R. Genomic Selection Optimization in Blueberry: Data-driven Methods for Marker and Training Population Design. Plant Genome 2024, 17, e20488. [Google Scholar] [CrossRef]
  37. Bandillo, N.B.; Jarquin, D.; Posadas, L.G.; Lorenz, A.J.; Graef, G.L. Genomic Selection Performs as Effectively as Phenotypic Selection for Increasing Seed Yield in Soybean. Plant Genome 2022, 16, e20285. [Google Scholar] [CrossRef]
  38. Burke, R.; Felfernig, A.; Göker, M.H. Recommender Systems: An Overview. AI Mag. 2011, 32, 13–18. [Google Scholar] [CrossRef]
  39. Roy, D.; Dutta, M. A Systematic Review and Research Perspective on Recommender Systems. J. Big Data 2022, 9, 59. [Google Scholar] [CrossRef]
  40. Batmaz, Z.; Yurekli, A.; Bilge, A.; Kaleli, C. A Review on Deep Learning for Recommender Systems: Challenges and Remedies. Artif. Intell. Rev. 2019, 52, 1–37. [Google Scholar] [CrossRef]
  41. Jugovac, M.; Jannach, D. Interacting with Recommenders—Overview and Research Directions. ACM Trans. Interact. Intell. Syst. 2017, 7, 10. [Google Scholar] [CrossRef]
  42. Michel, S.; Löschenberger, F.; Ametz, C.; Bistrich, H.; Bürstmayr, H. Towards Streamlining the Choice of Crossing Combinations in Plant Breeding by Integrating Model-Based Recommendations and Plant Breeder’s Preferences. Crops 2025, 5, 5. [Google Scholar] [CrossRef]
  43. Gesesse, C.A.; Nigir, B.; de Sousa, K.; Gianfranceschi, L.; Gallo, G.R.; Poland, J.; Kidane, Y.G.; Abate Desta, E.; Fadda, C.; Pè, M.E.; et al. Genomics-Driven Breeding for Local Adaptation of Durum Wheat Is Enhanced by Farmers’ Traditional Knowledge. Proc. Natl. Acad. Sci. USA 2023, 120, 2017. [Google Scholar] [CrossRef] [PubMed]
  44. Mancini, C.; Kidane, Y.G.; Mengistu, D.K.; Melfa and Workaye Farmer Community; Pè, M.E.; Fadda, C.; Dell, M. Joining Smallholder Farmers’ Traditional Knowledge with Metric Traits to Select Better Varieties of Ethiopian Wheat. Sci. Rep. 2017, 7, 9120. [Google Scholar] [CrossRef]
  45. Teeken, B.; Olaosebikan, O.; Haleegoah, J.; Oladejo, E.; Madu, T.; Bello, A.; Parkes, E.; Egesi, C.; Kulakow, P.; Kirscht, H.; et al. Cassava Trait Preferences of Men and Women Farmers in Nigeria: Implications for Breeding. Econ. Bot. 2018, 72, 263–277. [Google Scholar] [CrossRef] [PubMed]
  46. Rattunde, H.F.W.; Michel, S.; Leiser, W.L.; Piepho, H.P.; Diallo, C.; Vom Brocke, K.; Diallo, B.; Haussmann, B.I.G.; Weltzien, E. Farmer Participatory Early-Generation Yield Testing of Sorghum in West Africa: Possibilities to Optimize Genetic Gains for Yield in Farmers’ Fields. Crop Sci. 2016, 56, 2493–2505. [Google Scholar] [CrossRef]
  47. Jin, H.; Tross, M.C.; Tan, R.; Newton, L.; Mural, R.V.; Yang, J.; Thompson, A.M.; Schnable, J.C. Imitating the “Breeder’s Eye”: Predicting Grain Yield from Measurements of Non-yield Traits. Plant Phenome J. 2024, 7, e20102. [Google Scholar] [CrossRef]
  48. Löschenberger, F.; Fleck, A.; Grausgruber, H.; Hetzendorfer, H.; Hof, G.; Lafferty, J.; Marn, M.; Neumayer, A.; Pfaffinger, G.; Birschitzky, J. Breeding for Organic Agriculture: The Example of Winter Wheat in Austria. Euphytica 2008, 163, 469–480. [Google Scholar] [CrossRef]
  49. Cowling, W.A. Sustainable Plant Breeding. Plant Breed. 2013, 132, 1–9. [Google Scholar] [CrossRef]
  50. Ceccarelli, S.; Grando, S. Return to Agrobiodiversity: Participatory Plant Breeding. Diversity 2022, 14, 126. [Google Scholar] [CrossRef]
  51. Reif, J.C.; Zhang, P.; Dreisigacker, S.; Warburton, M.L.; Van Ginkel, M.; Hoisington, D.; Bohn, M.; Melchinger, A.E. Wheat Genetic Diversity Trends during Domestication and Breeding. Theor. Appl. Genet. 2005, 110, 859–864. [Google Scholar] [CrossRef]
  52. Louwaars, N.P. Plant Breeding and Diversity: A Troubled Relationship? Euphytica 2018, 214, 114. [Google Scholar] [CrossRef]
  53. Swarup, S.; Cargill, E.J.; Crosby, K.; Flagel, L.; Kniskern, J.; Glenn, K.C. Genetic Diversity Is Indispensable for Plant Breeding to Improve Crops. Crop Sci. 2021, 61, 839–852. [Google Scholar] [CrossRef]
  54. Bernardo, R. Retrospective Index Weights Used in Multiple Trait Selection in a Maize Breeding Program. Crop Sci. 1991, 31, 1174–1179. [Google Scholar] [CrossRef]
  55. Akata, Z.; Balliet, D.; De Rijke, M.; Dignum, F.; Dignum, V.; Eiben, G.; Fokkens, A.; Grossi, D.; Hindriks, K.; Hoos, H.; et al. A Research Agenda for Hybrid Intelligence: Augmenting Human Intellect with Collaborative, Adaptive, Responsible, and Explainable Artificial Intelligence. Computer 2020, 53, 18–28. [Google Scholar] [CrossRef]
  56. Kamar, E. Directions in Hybrid Intelligence: Complementing AI Systems with Human Intelligence. In Proceedings of the 25th International Joint Conference on Artificial Intelligence, New York, NY, USA, 9–15 July 2016; pp. 4070–4073. [Google Scholar]
  57. Nyholm, S. Artificial Intelligence and Human Enhancement: Can AI Technologies Make Us More (Artificially) Intelligent? Cambridge Q. Healthc. Ethics 2024, 33, 76–88. [Google Scholar] [CrossRef] [PubMed]
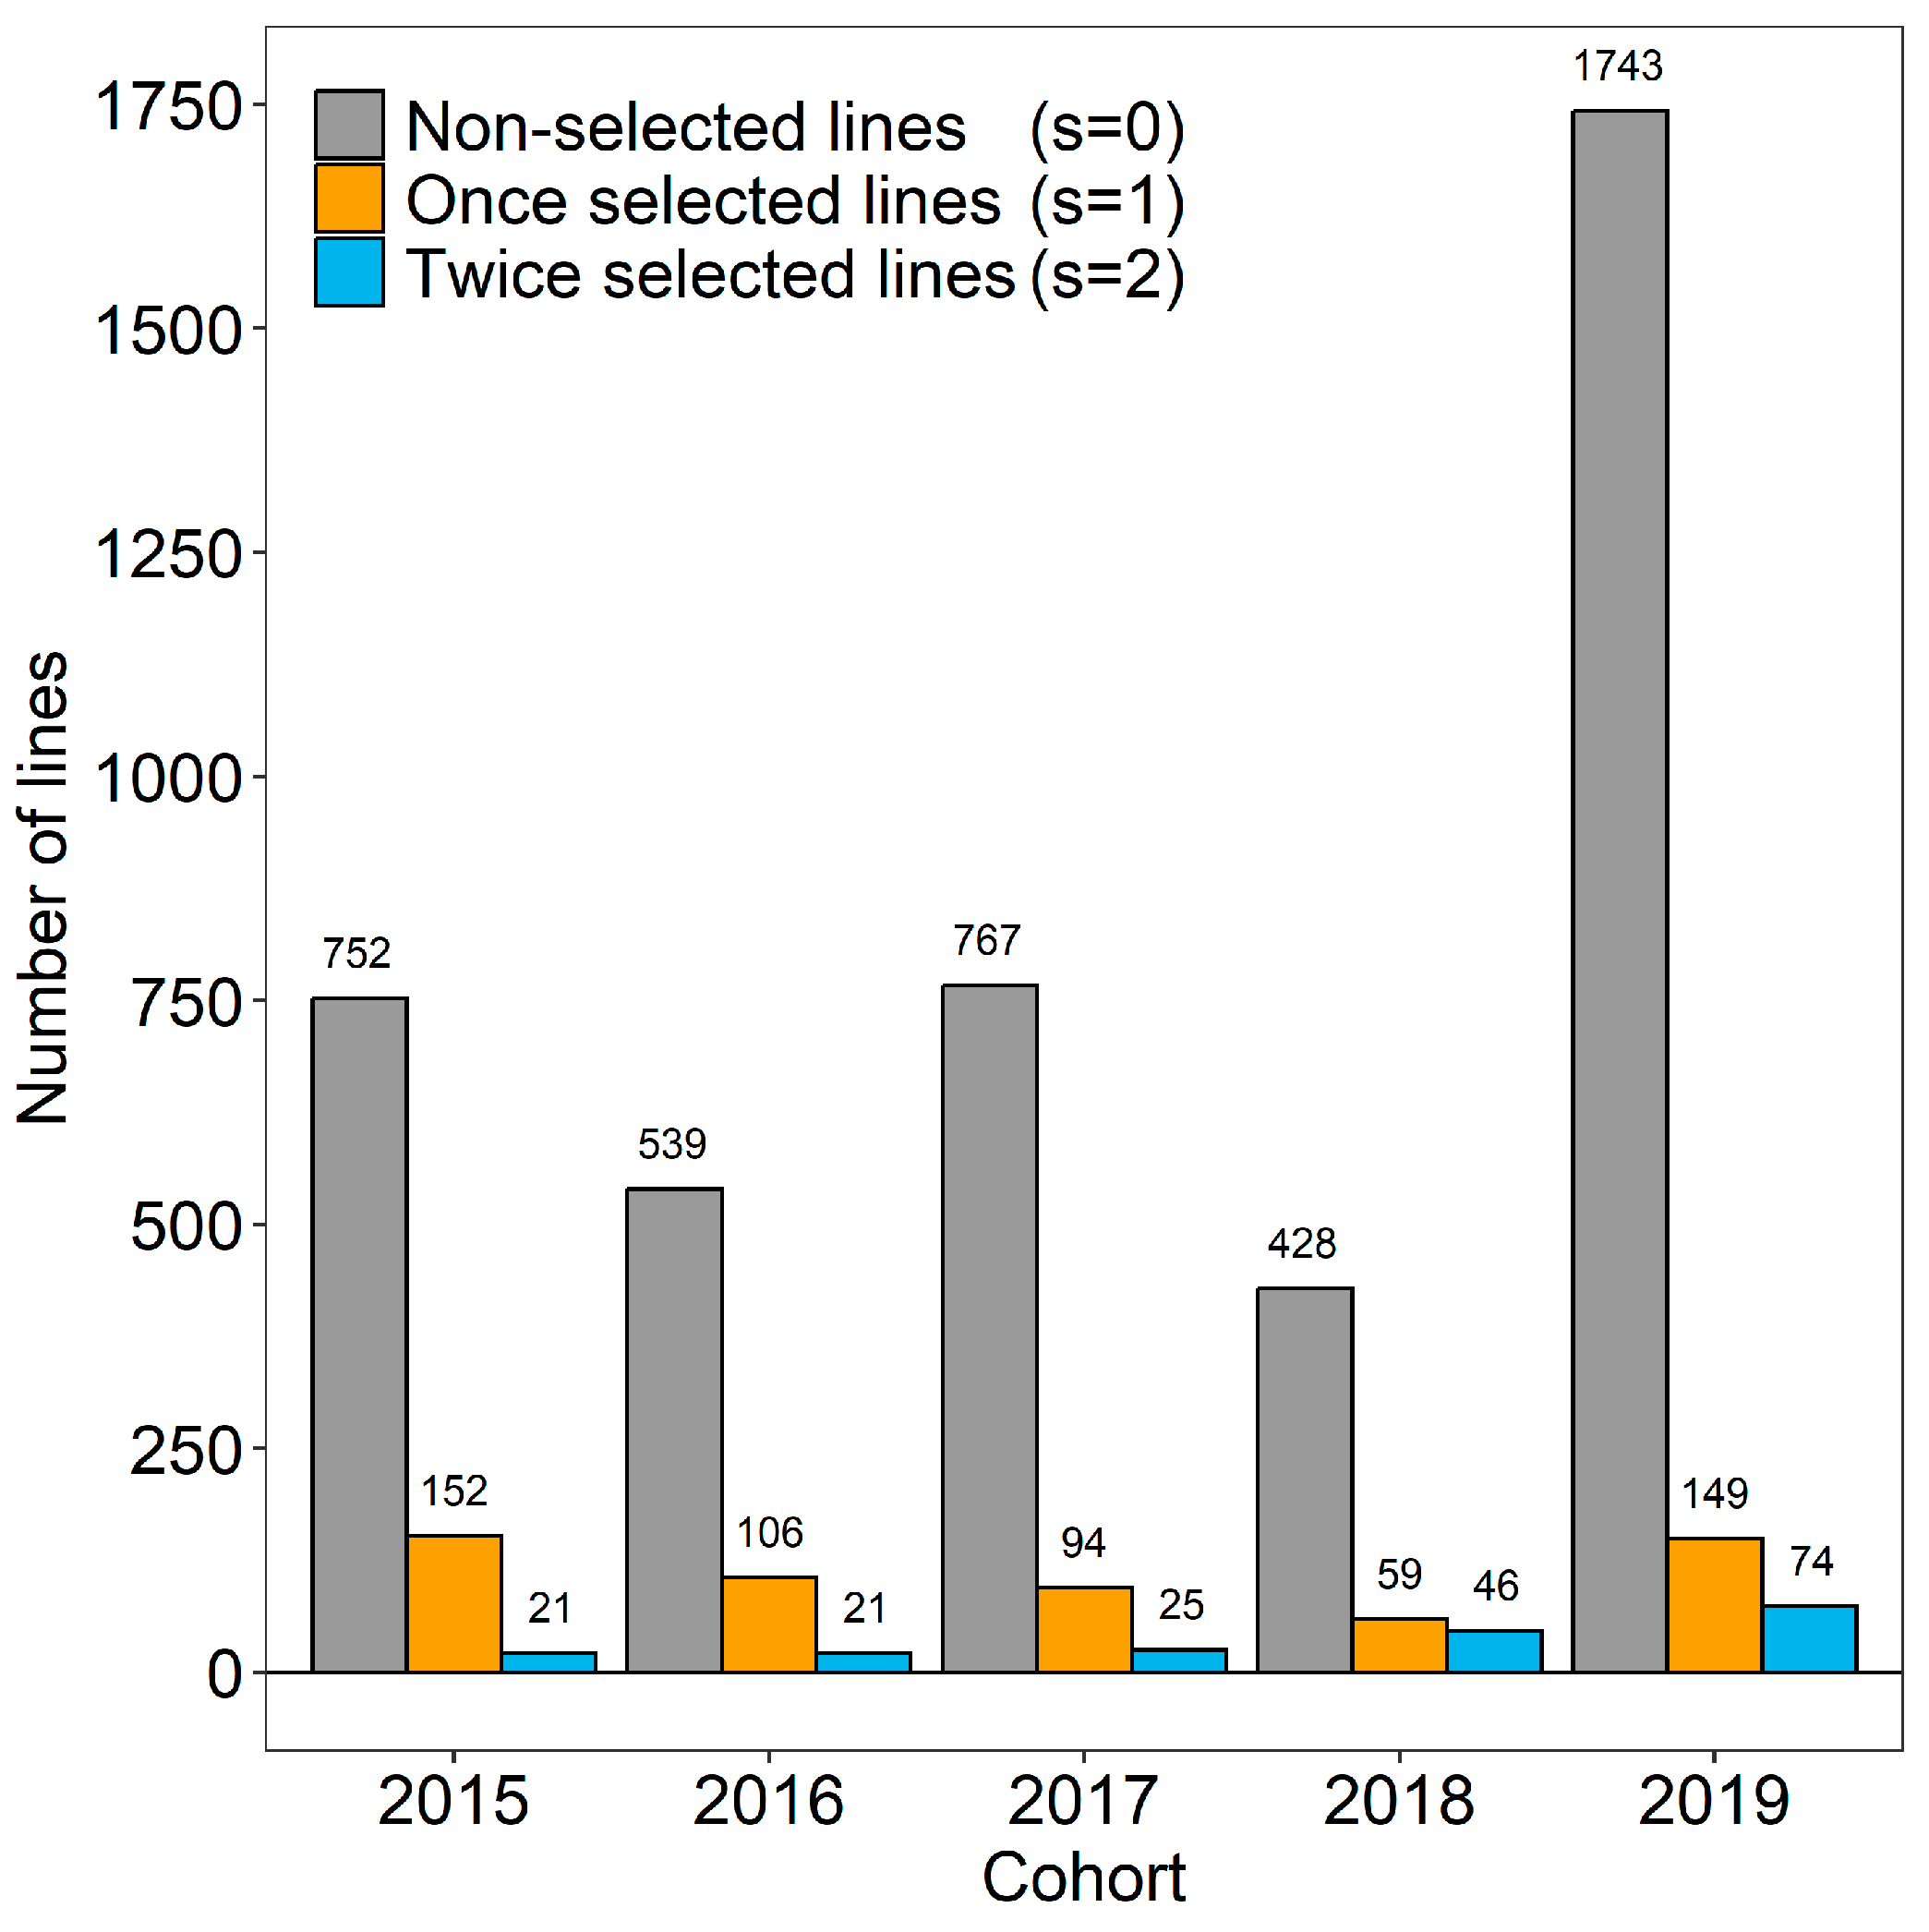
Figure 1. Number of non-selected lines ( s = 0 ) versus lines that were selected once ( s = 1 ) or twice ( s = 2 ) from each cohort in 2015–2019 based on the breeder’s decisions in the respective preliminary yield trials as well as two subsequent years of advanced and elite multi-environment trials.
Crops 05 00069 g001
Figure 2. Investigated scenarios of binary breeder’s decisions made during the multi-stage selection scheme with regard to non-selected lines ( s = 0 ) versus lines that were selected once ( s = 1 ) or twice ( s = 2 ), based on the breeder’s decisions in the respective preliminary yield trials ( P Y T s ) as well as two subsequent years of advanced and elite multi-environment trials ( A Y T s and E Y T s ). Note that a retrospective subset comparison was made in this study, i.e., the retrospective subset membership is highlighted, rather than trial progression. The scenarios included selection decisions made in the stage of preliminary yield trials concerning lines that were advanced to advanced multi-environment trials ( P Y T A Y T ) and selection decisions in advanced multi-environment trials concerning lines that were tested again in elite multi-environment trials ( A Y T E Y T ) . A retrospective comparison regarding all lines tested at the stage of preliminary yield trials and the subset of lines that finally entered elite multi-environment trials after passing advanced multi-environment trials was also made ( P Y T E Y T ) .
Crops 05 00069 g002
Figure 3. Precision (%) for the prediction of selection decisions made in the stage of preliminary yield trials concerning lines that were forwarded to advanced yield trials ( P Y T A Y T ) , selection decisions concerning lines that were tested again in elite yield trials ( A Y T E Y T ) as well as selection decisions concerning all lines tested in the stage of preliminary yield trials and the subset of lines that finally entered elite yield trials ( P Y T E Y T ) . Training populations for fitting elastic nets with SNP markers ( E L A S T I C N E T [ S N P S ] ) as well as a mixture of SNP markers and the genomic estimated breeding values (GEBVs) of major agronomic traits ( E L A S T I C N E T [ S N P S + G E B V S ] ) were built by using three cohorts preceding the cohort that was used for validation and compared with a random selection of lines ( R A N D O M ) .
Crops 05 00069 g003
Figure 4. Standardized selection differentials ( σ ) of grain yield, protein content, protein yield, protein quality (extensogram dough energy), and Fusarium head blight severity for the sets of lines chosen by the breeder ( B R E E D E R ) or recommended by the elastic net model ( E L A S T I C N E T ) . The standardized selection differential were regarded in the investigated multi-stage selection scheme for the stage of preliminary yield trials concerning lines that were forwarded to advanced yield trials ( P Y T A Y T ) , selection decisions concerning lines that were tested again in elite yield trials ( A Y T E Y T ) , as well as selection decisions concerning all lines tested at the stage of preliminary yield trials and the subset of lines that finally entered elite yield trials ( P Y T E Y T ) . Training populations for fitting elastic nets with SNP markers ( E L A S T I C N E T [ S N P S ] ) as well as a mixture of SNP markers and GEBVs of major agronomic traits ( E L A S T I C N E T [ S N P S + G E B V S ] ) were built using three cohorts preceding the cohort for which the recommendations for selection were made.
Crops 05 00069 g004
Figure 5. Modified Roger’s distance for the entire array of all selection candidates, the recommendations of the elastic net model ( E L A S T I C N E T ) as well as the actual selection decisions of the breeder ( B R E E D E R ) at the stage of preliminary yield trials concerning lines that were forwarded to advanced yield trials ( P Y T A Y T ) ; selection decisions concerning lines that were tested again in elite yield trials ( A Y T E Y T ) ; selection decisions concerning all lines tested at the stage of preliminary yield trials; and the subset of lines that finally entered elite yield trials ( P Y T E Y T ) . Training populations for fitting elastic nets with SNP markers ( E L A S T I C N E T [ S N P S ] ) as well as a mixture of SNP markers and genomic estimated breeding values (GEBVs) of major agronomic traits ( E L A S T I C N E T [ S N P S + G E B V S ] ) were built by using three cohorts preceding the cohort for which the recommendations for selection were made.
Crops 05 00069 g005
Disclaimer/Publisher’s Note: The statements, opinions and data contained in all publications are solely those of the individual author(s) and contributor(s) and not of MDPI and/or the editor(s). MDPI and/or the editor(s) disclaim responsibility for any injury to people or property resulting from any ideas, methods, instructions or products referred to in the content.