Manipulation of Phototactic Responses by Two-Spotted Spider Mites to Improve Performance of Miticides

 ,
, 
Abstract
1. Introduction
2. Materials and Methods
2.1. Spider Mite Colony
2.2. Plant Materials
2.3. Light Sources
2.4. Video Tracking and Analytical Approach
2.5. Phototactice Responses on Leaves
2.6. Validation of Light Source Combination with Miticide Application
2.7. Statistical Analyses
3. Results
3.1. Phototactic Response in Experimental Arena Without and With Shelter
3.2. Phototactice Responses on Leaves
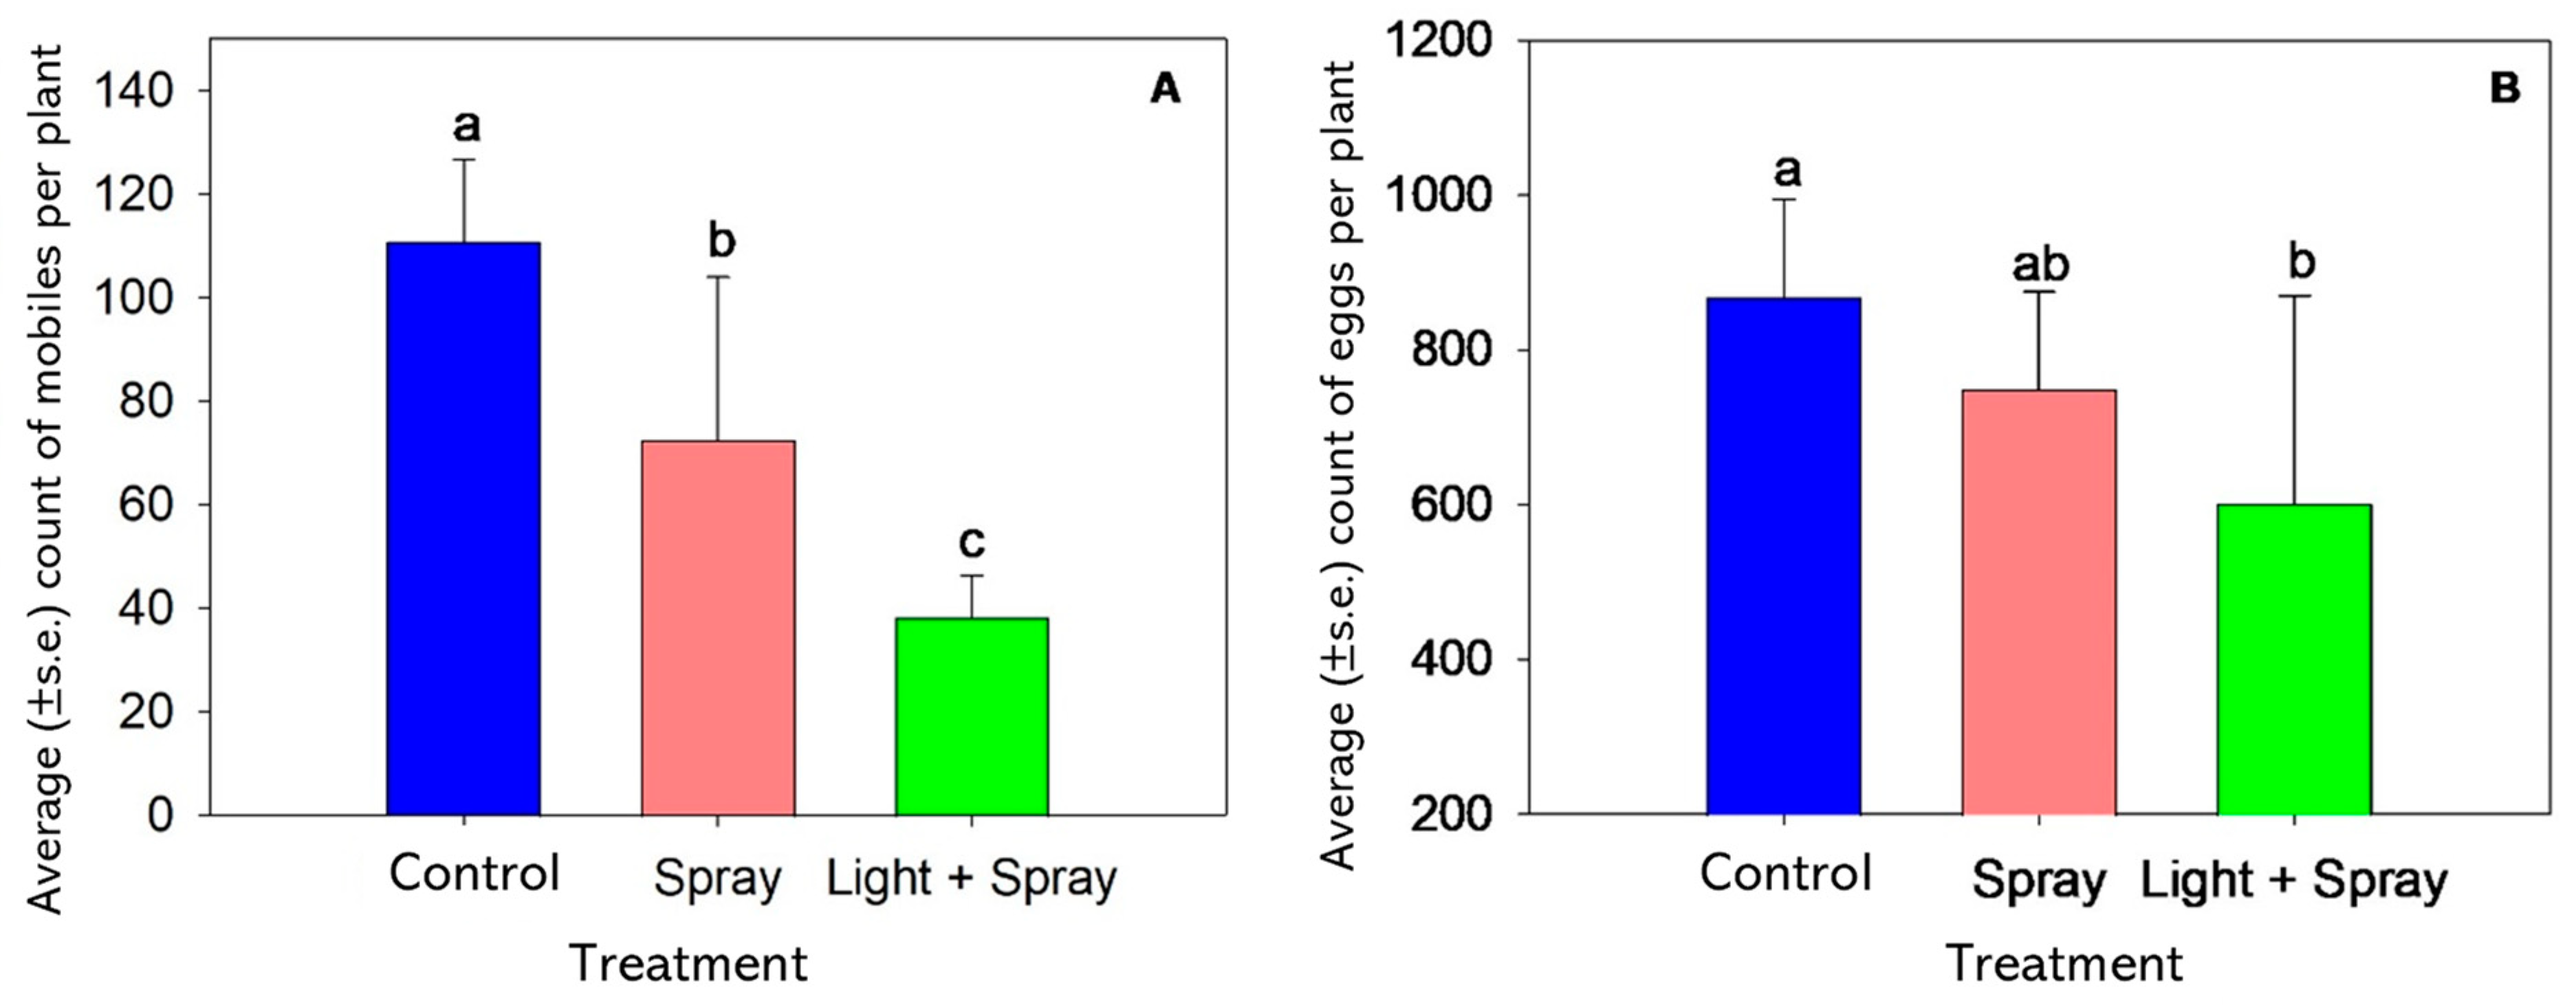
3.3. Validation of Light Source with Miticide Application
4. Discussion
4.1. Movement and Phototactic Responses
4.2. Phototactice Responses by Spider Mites on Crop Leaves
5. Conclusions
Author Contributions
Funding
Data Availability Statement
Conflicts of Interest
References
- Holt, E.B.; Lee, F.S. The theory of phototactic response. Am. J. Physiol. 1901, 4, 460–481. [Google Scholar] [CrossRef]
- Gest, H. Phototaxis and other sensory phenomena in purple photosynthetic bacteria. FEMS Microbiol. Rev. 1995, 16, 287–294. [Google Scholar] [CrossRef]
- Jékely, G. Evolution of phototaxis. Philos. Trans. R. Soc. B Biol. Sci. 2009, 364, 2795–2808. [Google Scholar] [CrossRef] [PubMed]
- Storey, C.; Allan, C.Y.; Fisher, P.R. Phototaxis: Microbial. eLS 2020, 1–17. [Google Scholar] [CrossRef]
- Varuni, P.; Menon, S.N.; Menon, G.I. Phototaxis as a Collective Phenomenon in Cyanobacterial Colonies. Sci. Rep. 2017, 7, 17799. [Google Scholar] [CrossRef]
- Bendix, S.W. Phototaxis. Bot. Rev. 1960, 26, 145–208. [Google Scholar] [CrossRef]
- Kreimer, G. Cell Biology of Phototaxis in Flagellate Algae. In International Review of Cytology; Jeon, K.W., Jarvik, J., Eds.; Academic Press: Cambridge, MA, USA, 1994; pp. 229–310. [Google Scholar]
- Witman, G.B. Chlamydomonas phototaxis. Trends Cell Biol. 1993, 3, 403–408. [Google Scholar] [CrossRef]
- Bennett, R.R.; Golestanian, R. A steering mechanism for phototaxis in Chlamydomonas. J. R. Soc. Interface 2015, 12, 20141164. [Google Scholar] [CrossRef]
- Kim, K.-N.; Huang, Q.-Y.; Lei, C.-L. Advances in insect phototaxis and application to pest management: A review. Pest Manag. Sci. 2019, 75, 3135–3143. [Google Scholar] [CrossRef]
- Muntz, W.R.A. The Development of Phototaxis in the Frog (Rana temporaria). J. Exp. Biol. 1963, 40, 371–379. [Google Scholar] [CrossRef]
- Randel, N.; Jékely, G. Phototaxis and the origin of visual eyes. Philos. Trans. R. Soc. B Biol. Sci. 2016, 371, 20150042. [Google Scholar] [CrossRef] [PubMed]
- Shirakashi, S.; Asai, N.; Miura, M. Phototactic responses in four monogenean oncomiracidia. Parasitol. Res. 2021, 120, 3173–3180. [Google Scholar] [CrossRef] [PubMed]
- Wei, H.; Li, H.-D.; Xia, Y.; Liu, H.-K.; Han, D.; Zhu, X.-M.; Yang, Y.-X.; Jin, J.-Y.; Xie, S.-Q. Effects of light intensity on phototaxis, growth, antioxidant and stress of juvenile gibel carp (Carassius auratus gibelio). Aquaculture 2019, 501, 39–47. [Google Scholar] [CrossRef]
- Naegele, J.A.; McEnroe, W.D.; Soans, A.B. Spectral sensitivity and orientation response of the two-spotted spider mite, Tetranychus urticae Koch, from 350 μm to 700 μm. J. Insect Physiol. 1966, 12, 1187–1195. [Google Scholar] [CrossRef] [PubMed]
- Yamaguchi, S.; Heisenberg, M. Photoreceptors and neural circuitry underlying phototaxis in insects. Fly 2011, 5, 333–336. [Google Scholar] [CrossRef]
- Suzuki, T.; Kojima, T.; Takeda, M.; Sakuma, M. Photo-orientation regulates seasonal habitat selection in the two-spotted spider mite, Tetranychus urticae. J. Exp. Biol. 2013, 216, 977–983. [Google Scholar]
- Forward, R.B. Negative phototaxis in crustacean larvae: Possible functional significance. J. Exp. Mar. Biol. Ecol. 1974, 16, 11–17. [Google Scholar] [CrossRef]
- Vandersar, T.J.D.; Borden, J.H. Role of Geotaxis and Phototaxis in the Feeding and Oviposition Behavior of Overwintered Pissodes strobi12. Environ. Entomol. 1977, 6, 743–749. [Google Scholar] [CrossRef]
- Horn, C.J.; Wasylenko, J.A.; Luong, L.T. Scared of the dark? Phototaxis as behavioural immunity in a host–parasite system. Biol. Lett. 2022, 18, 20210531. [Google Scholar] [CrossRef]
- Jékely, G.; Colombelli, J.; Hausen, H.; Guy, K.; Stelzer, E.; Nédélec, F.; Arendt, D. Mechanism of phototaxis in marine zooplankton. Zooplankton. Nat. 2008, 456, 395–399. [Google Scholar] [CrossRef]
- Kaltenrieder, M.; Labhart, T.; Hess, E. Spectral sensitivity, absolute threshold, and visual field of two tick species, Hyalomma dromedarii and Amblyomma variegatum. J. Comp. Physiol. A 1989, 165, 155–164. [Google Scholar] [CrossRef] [PubMed]
- Dimock, R.V., Jr.; Davids, C. Spectral Sensitivity and Photo-Behaviour of the Water Mite Genus Unionicola. J. Exp. Biol. 1985, 119, 349–363. [Google Scholar] [CrossRef]
- Mori, H. Seasonal Difference of Phototactic response in Three Species of Spider Mites (Acarina Tetranychidae). J. Fac. Agric. Hokkaido Univ. 1962, 52, 1–9. [Google Scholar]
- Shimoda, M.; Honda, K.-I. Insect reactions to light and its applications to pest management. Appl. Entomol. Zool. 2013, 48, 413–421. [Google Scholar] [CrossRef]
- Park, J.-H.; Lee, H.-S. Phototactic behavioral response of agricultural insects and stored-product insects to light-emitting diodes (LEDs). Appl. Biol. Chem. 2017, 60, 137–144. [Google Scholar] [CrossRef]
- Guo, Z.-G.; Wang, M.-X.; Cui, L.; Han, B.-Y. Advance in insect phototaxis and the development and application of colored sticky boards. Ying Yong Sheng Tai Xue Bao = J. Appl. Ecol. 2019, 30, 3615–3626. [Google Scholar]
- Johansen, N.S.; Vänninen, I.; Pinto, D.M.; Nissinen, A.I.; Shipp, L. In the light of new greenhouse technologies: 2. Direct effects of artificial lighting on arthropods and integrated pest management in greenhouse crops. Ann. Appl. Biol. 2011, 159, 1–27. [Google Scholar] [CrossRef]
- Celina, G.; Luigi Gennaro, I. Increasing efficiency of crop production with LEDs. AIMS Agric. Food 2018, 3, 135–153. [Google Scholar]
- Xu, Y.; Chang, Y.; Chen, G.; Lin, H. The research on LED supplementary lighting system for plants. Optik 2016, 127, 7193–7201. [Google Scholar] [CrossRef]
- Viršilė, A.; Olle, M.; Duchovskis, P. LED Lighting in Horticulture. In Light Emitting Diodes for Agriculture: Smart Lighting; Dutta Gupta, S., Ed.; Springer: Singapore, 2017; pp. 113–147. [Google Scholar]
- Paradiso, R.; Proietti, S. Light-Quality Manipulation to Control Plant Growth and Photomorphogenesis in Greenhouse Horticulture: The State of the Art and the Opportunities of Modern LED Systems. J. Plant Growth Regul. 2022, 41, 742–780. [Google Scholar] [CrossRef]
- Singh, D.; Basu, C.; Meinhardt-Wollweber, M.; Roth, B. LEDs for energy efficient greenhouse lighting. Renew. Sustain. Energy Rev. 2015, 49, 139–147. [Google Scholar] [CrossRef]
- Bourget, C.M. An Introduction to Light-emitting Diodes. HortScience Horts 2008, 43, 1944–1946. [Google Scholar] [CrossRef]
- Van Leeuwen, T.; Vontas, J.; Tsagkarakou, A.; Dermauw, W.; Tirry, L. Acaricide resistance mechanisms in the two-spotted spider mite Tetranychus urticae and other important Acari: A review. Insect Biochem. Mol. Biol. 2010, 40, 563–572. [Google Scholar] [CrossRef] [PubMed]
- Au-Cazaux, M.; Navarro, M.; Bruinsma, K.A.; Zhurov, V.; Negrave, T.; Van Leeuwen, T.; Grbic, V.; Grbic, M. Application of Two-spotted Spider Mite Tetranychus urticae for Plant-pest Interaction Studies. JoVE 2014, 89, e51738. [Google Scholar]
- Attia, S.; Grissa-Lebdi, K.; Lognay, G.; Bitume, E.; Hance, T.; Mailleux, A.C. A review of the major biological approaches to control the worldwide pest Tetranychus urticae (Acari: Tetranychidae) with special reference to natural pesticides. J. Pest Sci. 2013, 86, 361–386. [Google Scholar] [CrossRef]
- Whalon, M.E.; Hollingworth, R.M.; Duynslager, L. Arthropod Pesticide Resistance Database (APRD); Michigan State University: East Lansing, MI, USA, 2008. [Google Scholar]
- Osakabe, M. Biological impact of ultraviolet-B radiation on spider mites and its application in integrated pest management. Appl. Entomol. Zool. 2021, 56, 139–155. [Google Scholar] [CrossRef]
- Osakabe, M.; Hongo, K.; Funayama, K.; Osumi, S. Amensalism via webs causes unidirectional shifts of dominance in spider mite communities. Oecologia 2006, 150, 496–505. [Google Scholar] [CrossRef]
- Ohtsuka, K.; Osakabe, M. Deleterious Effects of Uv-B Radiation on Herbivorous Spider Mites: They Can Avoid It by Remaining on Lower Leaf Surfaces. Environ. Entomol. 2009, 38, 920–929. [Google Scholar] [CrossRef]
- Sakai, Y.; Osakabe, M. Spectrum-specific Damage and Solar Ultraviolet Radiation Avoidance in the Two-spotted Spider Mite. Photochem. Photobiol. 2010, 86, 925–932. [Google Scholar] [CrossRef]
- Krainacker, D.A.; Carey, J.R. Spatial and temporal dynamics of two spotted spider mites, Tetranychus urticae Koch (Acari, Tetranychidae). J. Appl. Entomol. 1990, 109, 481–489. [Google Scholar] [CrossRef]
- So, P.-M. Distribution patterns of and sampling plans forTetranychus urticae Koch (Acarina: Tetranychidae) on roses. Res. Popul. Ecol. 1991, 33, 229–243. [Google Scholar] [CrossRef]
- Zhang, Z.-Q.; Sanderson, J.P. Twospotted Spider Mite (Acari: Tetranychidae) and Phytoseiulus persimilis (Acari: Phytoseiidae) on Greenhouse Roses: Spatial Distribution and Predator Efficacy. J. Econ. Entomol. 1995, 88, 352–357. [Google Scholar] [CrossRef]
- Martini, X.; Kincy, N.; Nansen, C. Quantitative impact assessment of spray coverage and pest behavior on contact pesticide performance. Pest Manag. Sci. 2012, 68, 1471–1477. [Google Scholar] [CrossRef] [PubMed]
- Lewis, M.T.; Hamby, K.A. Optimizing Caneberry Spray Coverage for Drosophila suzukii (Diptera: Drosophilidae) Management on Diversified Fruit Farms. J. Econ. Entomol. 2020, 113, 2820–2831. [Google Scholar] [CrossRef] [PubMed]
- Nansen, C.; Del Villar, G.; Recalde, A.; Alvarado, E.; Chennapragada, K. Phone app to perform quality control of pesticide spray applications in field crops. Agriculture 2021, 11, 916. [Google Scholar] [CrossRef]
- Schmidt-Jeffris, R.A.; Beers, E.H. Potential impacts of orchard pesticides on Tetranychus urticae: A predator-prey perspective. Crop Prot. 2018, 103, 56–64. [Google Scholar] [CrossRef]
- Mills, L.R. Structure of the visual system of the two-spotted spider-mite, Tetranychus urticae. J. Insect Physiol. 1974, 20, 795–808. [Google Scholar] [CrossRef]
- Goto, S.G. Physiological and molecular mechanisms underlying photoperiodism in the spider mite: Comparisons with insects. J. Comp. Physiol. B 2016, 186, 969–984. [Google Scholar] [CrossRef]
- McEnroe, W.D. The red photoresponse of the spider mite Tetranychus urticae (Acarina:Tetranychidae). Acarologia 1971, 13, 113–118. [Google Scholar]
- Suzuki, T.; Watanabe, M.; Takeda, M. UV tolerance in the two-spotted spider mite, Tetranychus urticae. J. Insect Physiol. 2009, 55, 649–654. [Google Scholar] [CrossRef]
- Shelton, A.M.; Badenes-Perez, F.R. Concepts and applications of trap cropping in pest management. Annu. Rev. Entomol. 2006, 51, 285–308. [Google Scholar] [CrossRef] [PubMed]
- Fechine, G.J.M.; Rabello, M.S.; Maior, R.S.; Catalani, L.H. Surface characterization of photodegraded poly(ethylene terephthalate). The effect of ultraviolet absorbers. Polymer 2004, 45, 2303–2308. [Google Scholar] [CrossRef]
- Gyuris, E.; Szép, E.; Kontschán, J.; Hettyey, A.; Tóth, Z. Behavioural responses of two-spotted spider mites induced by predator-borne and prey-borne cues. Behav. Process 2017, 144, 100–106. [Google Scholar] [CrossRef] [PubMed]
- Suiter, K.A.; Gould, F. Physiological resistance and behavioral avoidance responses to residues of four pesticides by six spider mite populations. Entomol. Exp. Et Appl. 1994, 71, 1–14. [Google Scholar] [CrossRef]
- Gyawali, P.; Kim, H.; Vance, D.R.; Khodaverdi, H.; Mantri, A.; Nansen, C. Can insects assess environmental risk? movement responses and nymph emergence in response to insecticides. Agriculture 2023, 13, 723. [Google Scholar] [CrossRef]
- Otálora-Luna, F.; Dickens, J.C. Spectral preference and temporal modulation of photic orientation by Colorado potato beetle on a servosphere. Entomol. Exp. Et Appl. 2011, 138, 93–103. [Google Scholar] [CrossRef]
- Shindo, Y.; Witt, E.; Han, D.; Packer, L. Dose-response effects of acute ultraviolet irradiation on antioxidants and molecular markers of oxidation in murine epidermis and dermis. J. Investig. Dermatol. 1994, 102, 470–475. [Google Scholar] [CrossRef]
- Montemayor, J.D.; Smith, H.A.; Peres, N.A.; De Marchi, B.R.; Lahiri, S. Is UV-C light compatible with biological control of twospotted spider mite? Biol. Control 2023, 183, 105269. [Google Scholar] [CrossRef]
- Gala, J.-L.; Rebane, O.; Ambroise, J.; Babichenko, S.; Nyabi, O.; Hance, T. Acaricidal efficacy of ultraviolet-C irradiation of Tetranychus urticae adults and eggs using a pulsed krypton fluoride excimer laser. Parasites Vectors 2021, 14, 1–8. [Google Scholar] [CrossRef]
- Øyri, C.E. Ultraviolet Radiation as a Tool to Control Tetranychus Urticae in Greenhouse Production. Master’s Thesis, Norwegian University of Life Sciences, Ås, Norway, 2017. [Google Scholar]
- Stukenberg, N.; Pietruska, M.; Waldherr, A.; Meyhöfer, R. Wavelength-Specific Behavior of the Western Flower Thrips (Frankliniella occidentalis): Evidence for a Blue-Green Chromatic Mechanism. Insects 2020, 11, 423. [Google Scholar] [CrossRef]
- Romero, G.Q.; Benson, W.W. Biotic interactions of mites, plants and leaf domatia. Curr. Opin. Plant Biol. 2005, 8, 436–440. [Google Scholar] [CrossRef] [PubMed]
- Tsolakis, H.; Ragusa, E.; Sinacori, M.; Lombardo, A. On the perception of leaf morphology and visible light by Tetranychus urticae Koch (Acariformes, Tetranychidae). Acarologia 2022, 62, 404–417. [Google Scholar] [CrossRef]
- Athanasiadou, M.; Meyhöfer, R. Blue and UV light-emitting diodes (LEDs) disturb the greenhouse whitefly (Trialeurodes vaporariorum) from its host. J. Pest Sci. 2024, 97, 1355–1367. [Google Scholar] [CrossRef]


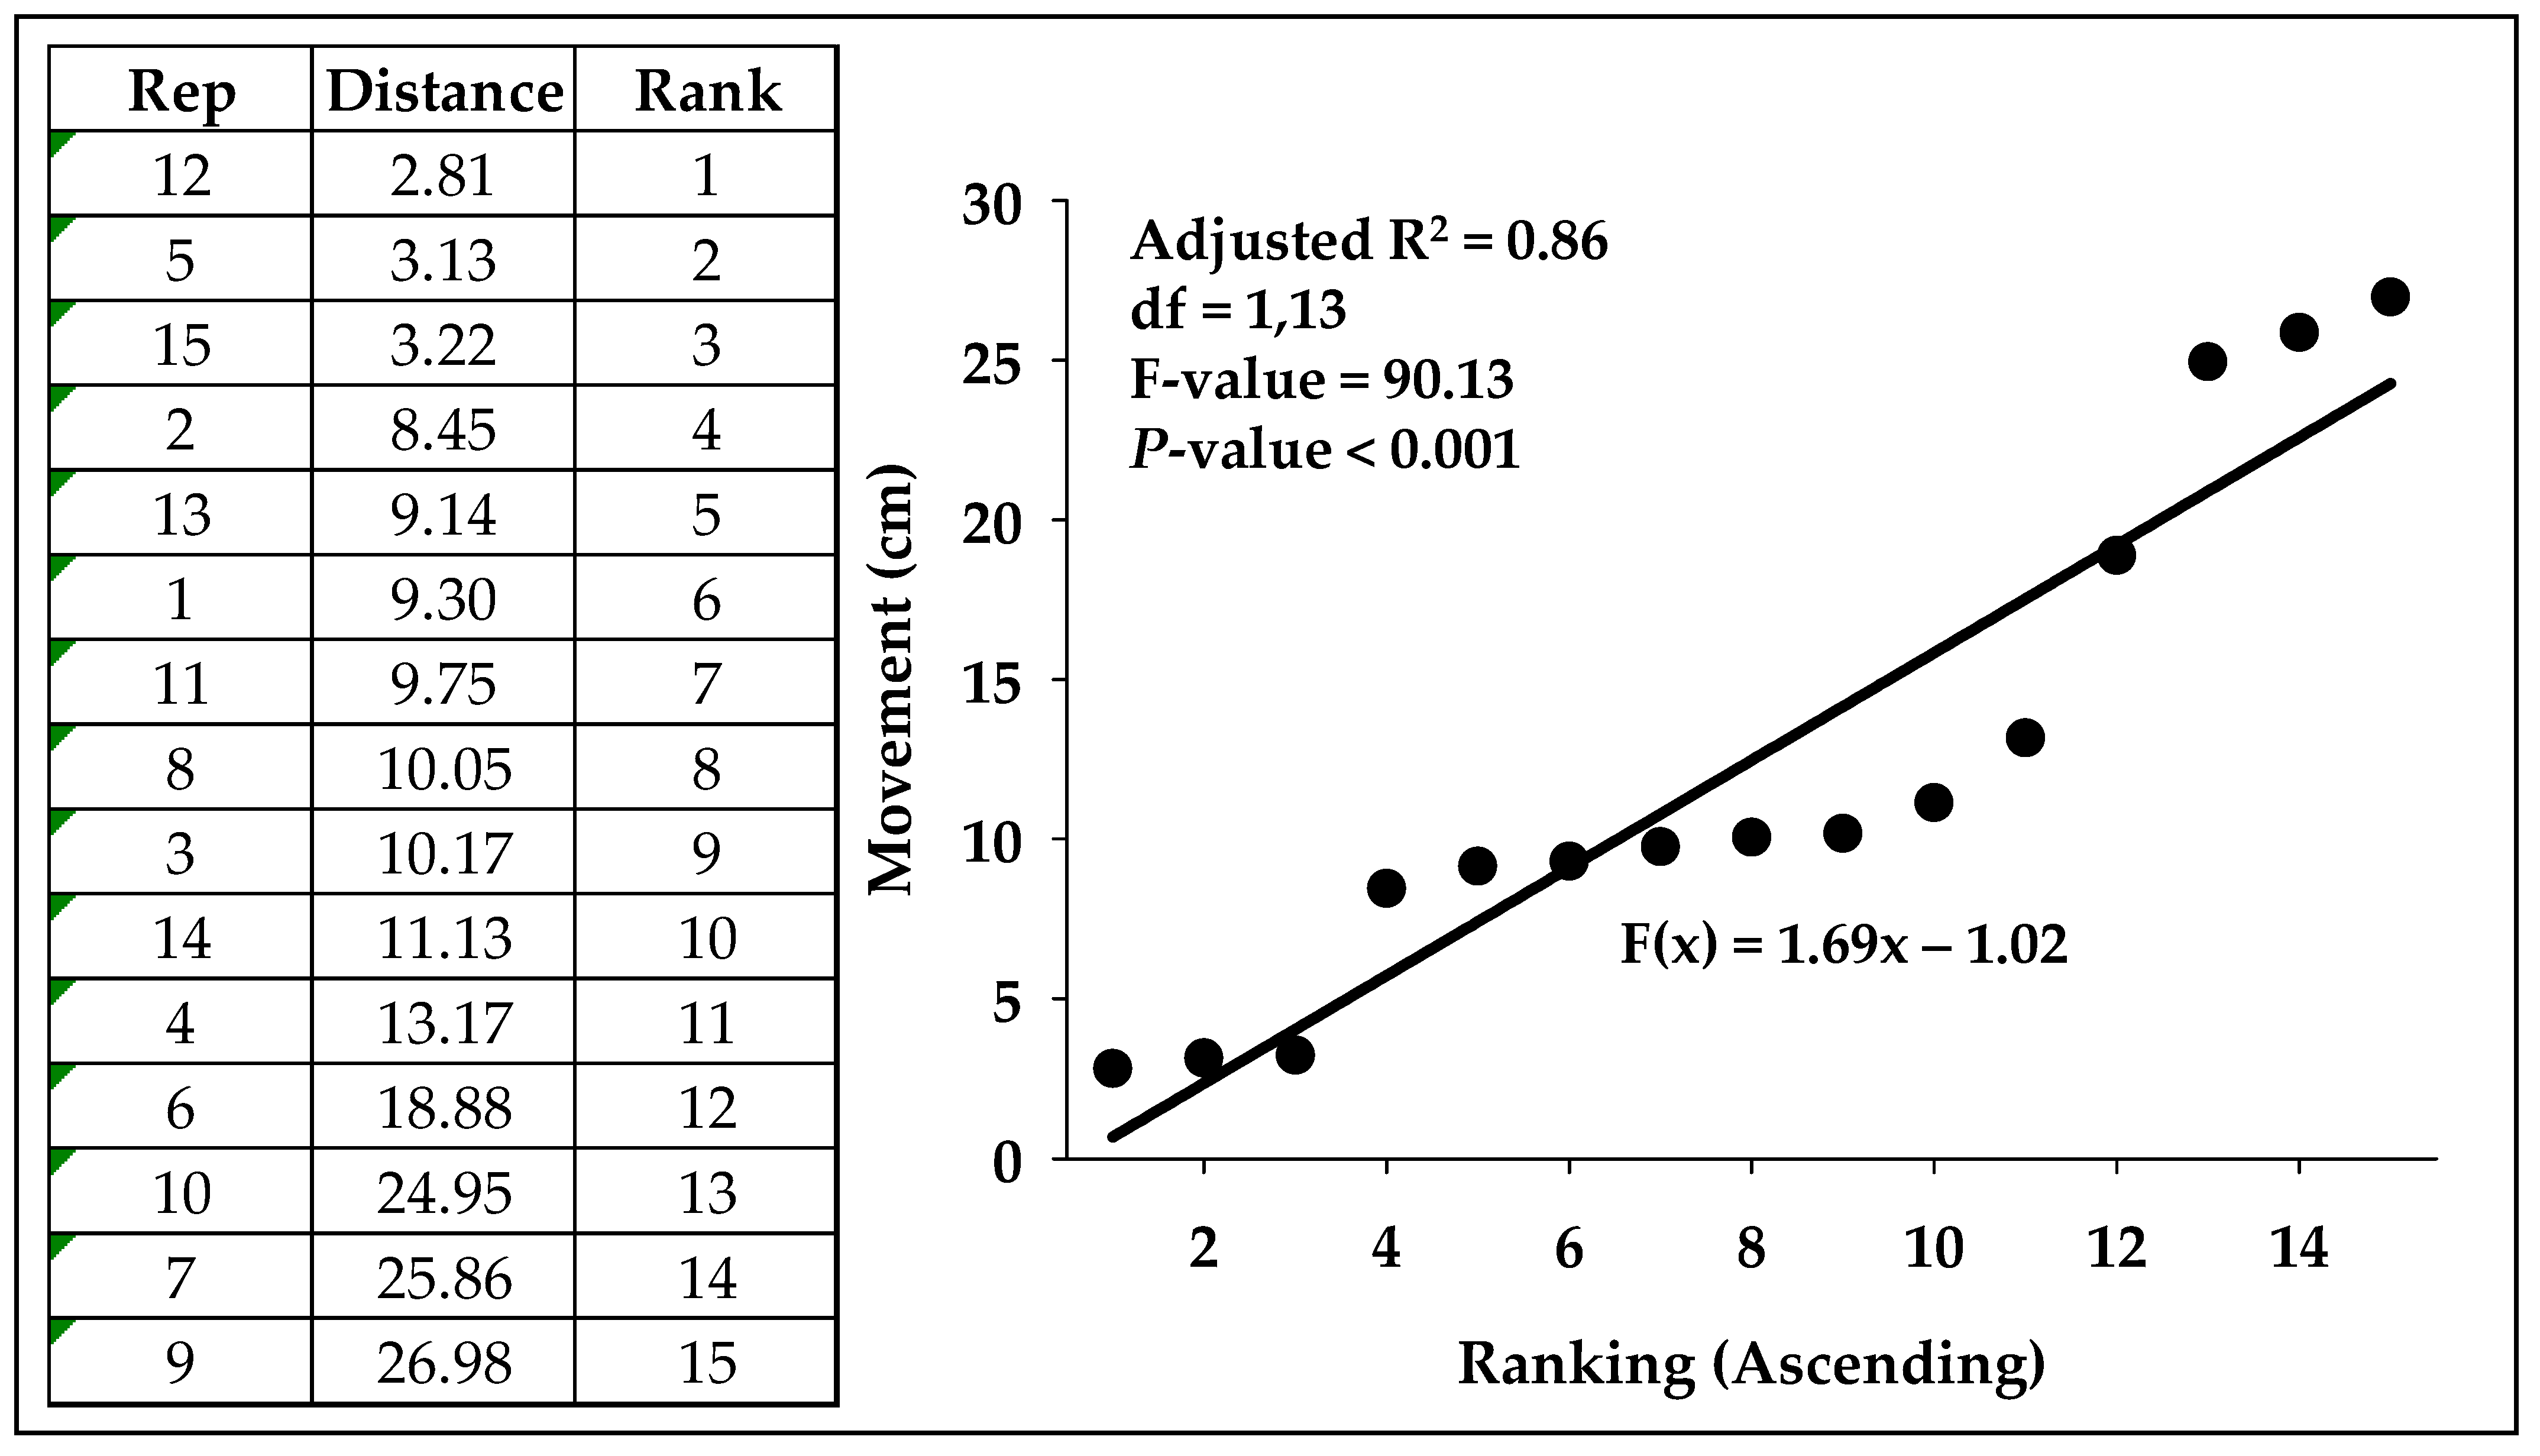
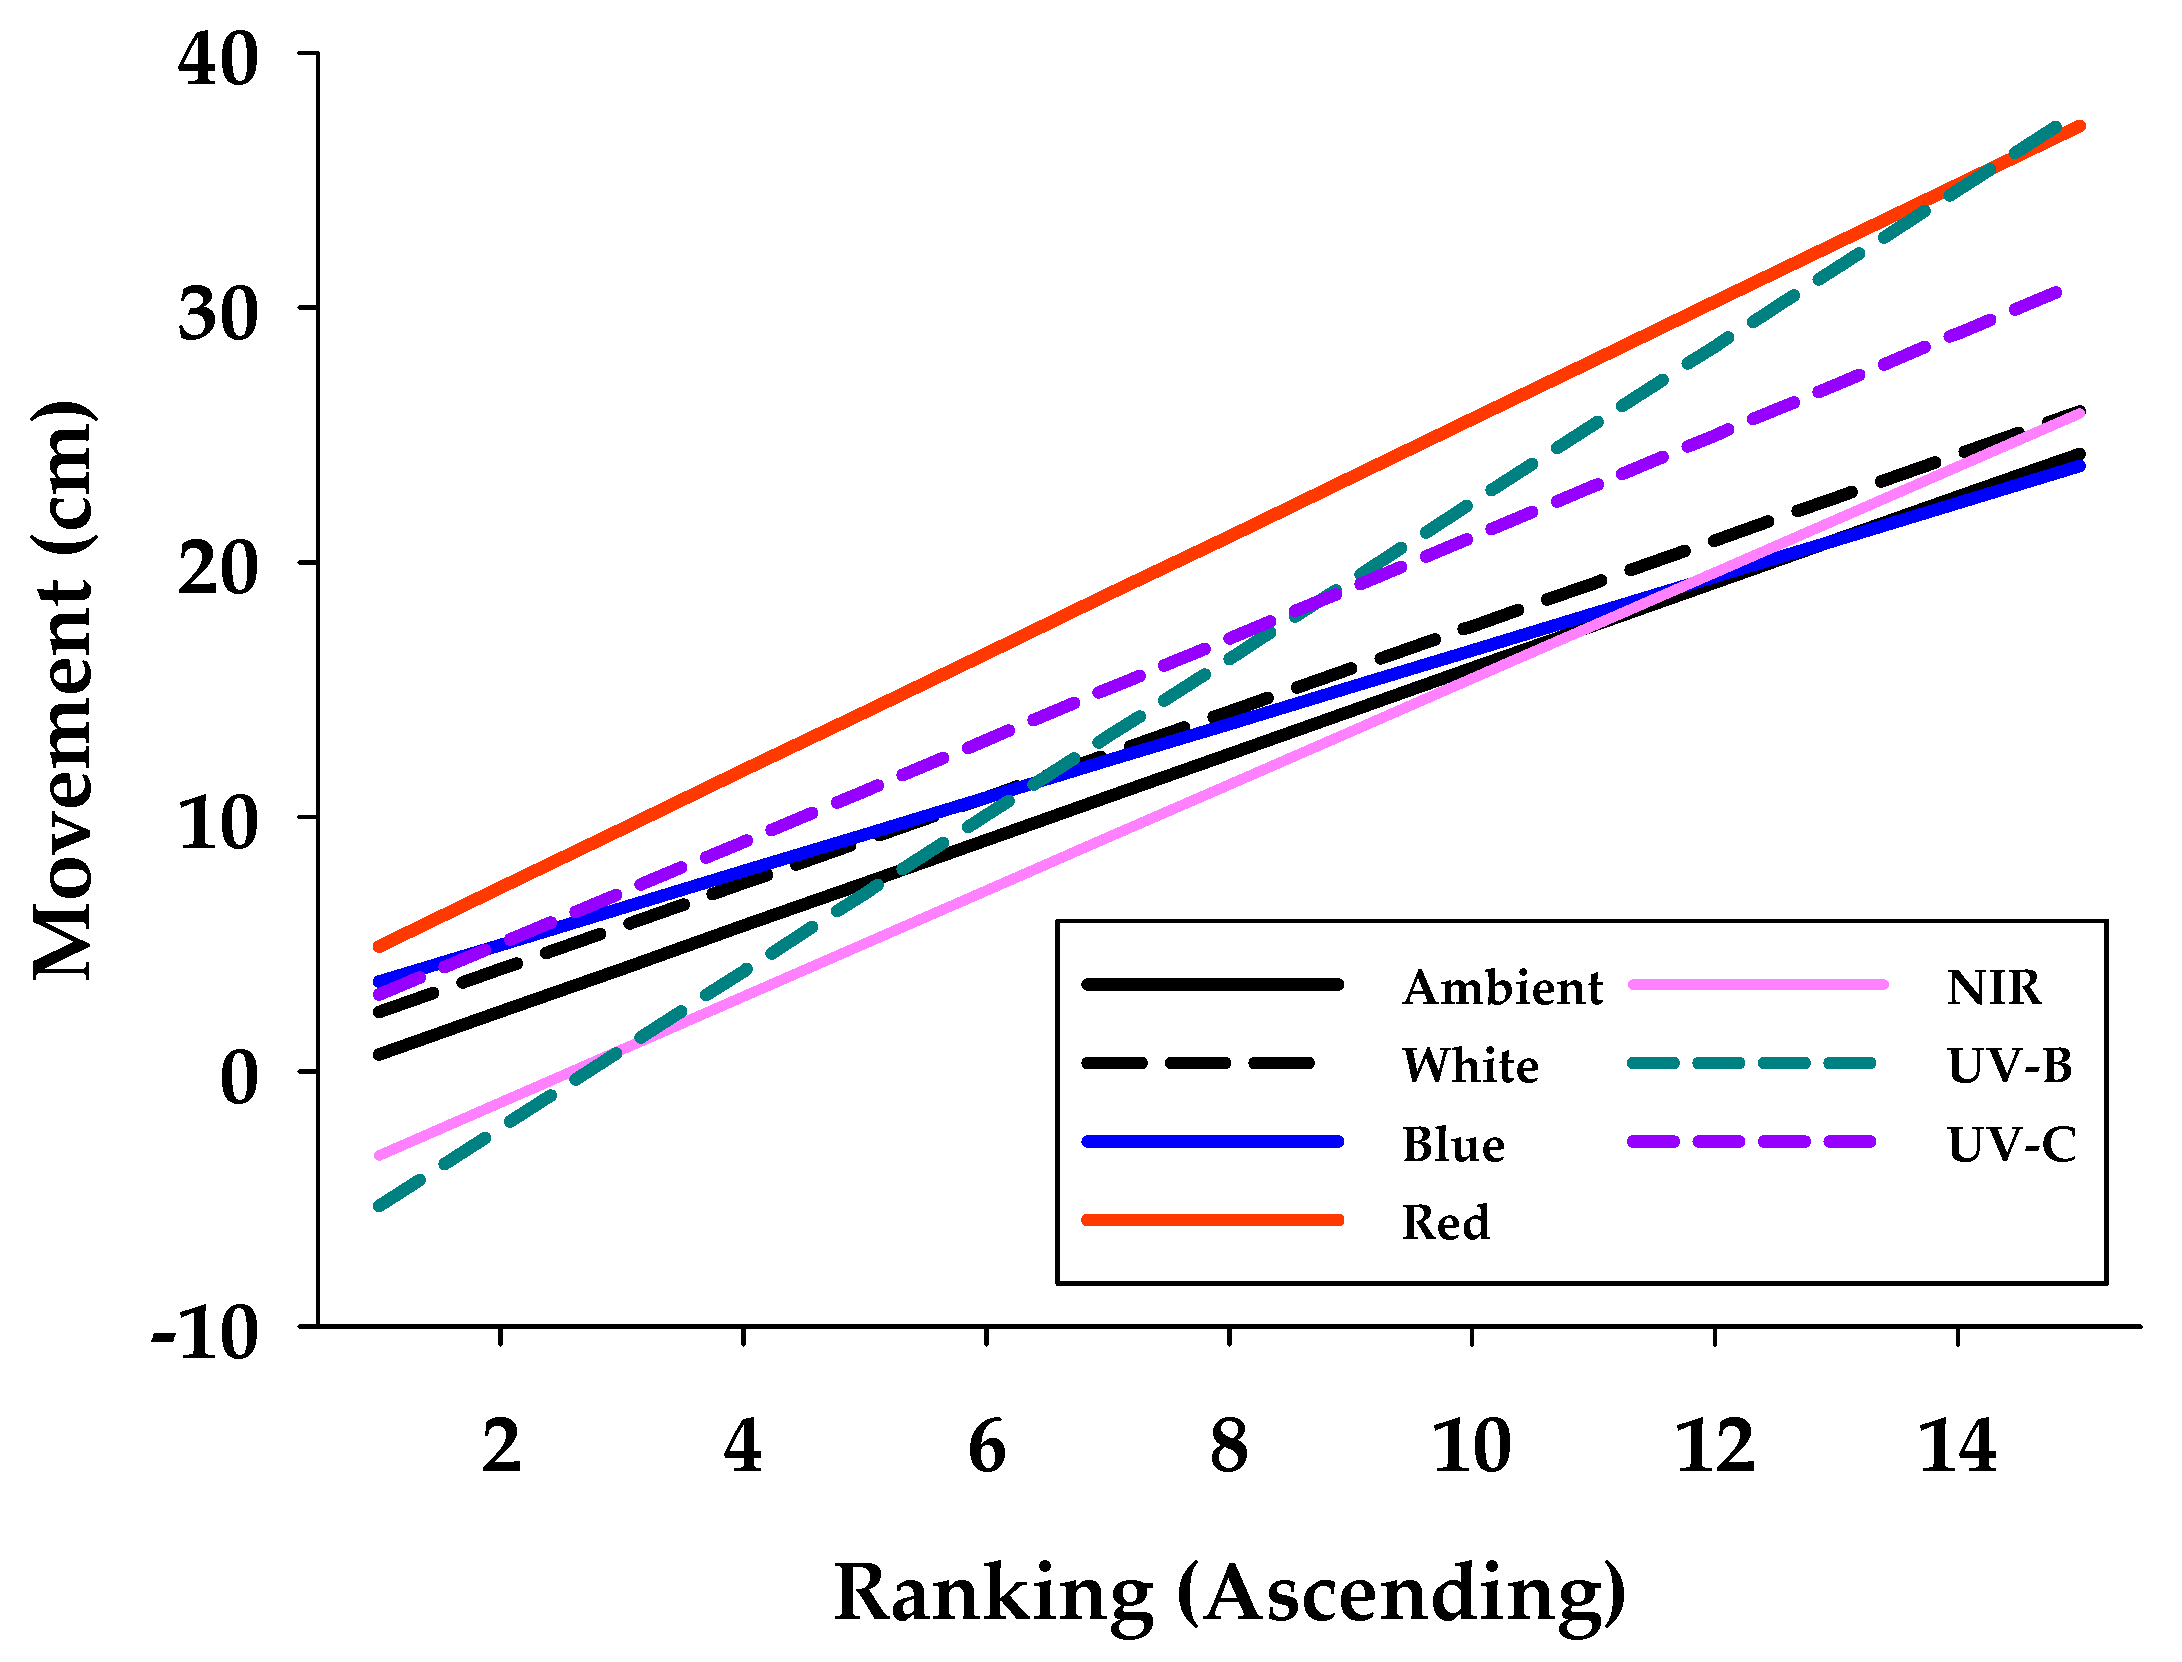
| Variable | Ambient | UV-C | UV-B | Blue | Red | White | NIR |
|---|---|---|---|---|---|---|---|
| Min | 2.81 | 0.43 | 0.43 | 2.21 | 6.39 | 4.63 | 0.50 |
| Max | 26.98 | 30.74 | 32.72 | 25.13 | 32.11 | 33.69 | 26.44 |
| Average (s.e.) | 12.47 ± 2.08 | 17.01 ± 2.35 | 13.14 ± 3.24 | 13.65 ± 1.72 | 16.43 ± 2.03 | 13.29 ± 2.05 | 11.27 ± 2.48 |
| Adj R2-value | 0.86 | 0.96 | 0.9 | 0.94 | 0.94 | 0.77 | 0.93 |
| Intercept (Int) | −1.02 | 1.02 | −8.36 | 2.07 | 2.61 | 0.65 | −5.38 |
| Slope (Slo) | 1.69 | 2.00 | 3.07 | 1.45 | 2.30 | 1.69 | 2.08 |
| Z-value (Int) | −1.10 | 2.61 ** | −1.69 * | −1.79 * | −0.63 | 2.07 * | |
| Z-value (Slo) | −1.52 | −4.08 *** | 1.19 | −2.43 ** | 0.00 | −1.71 |
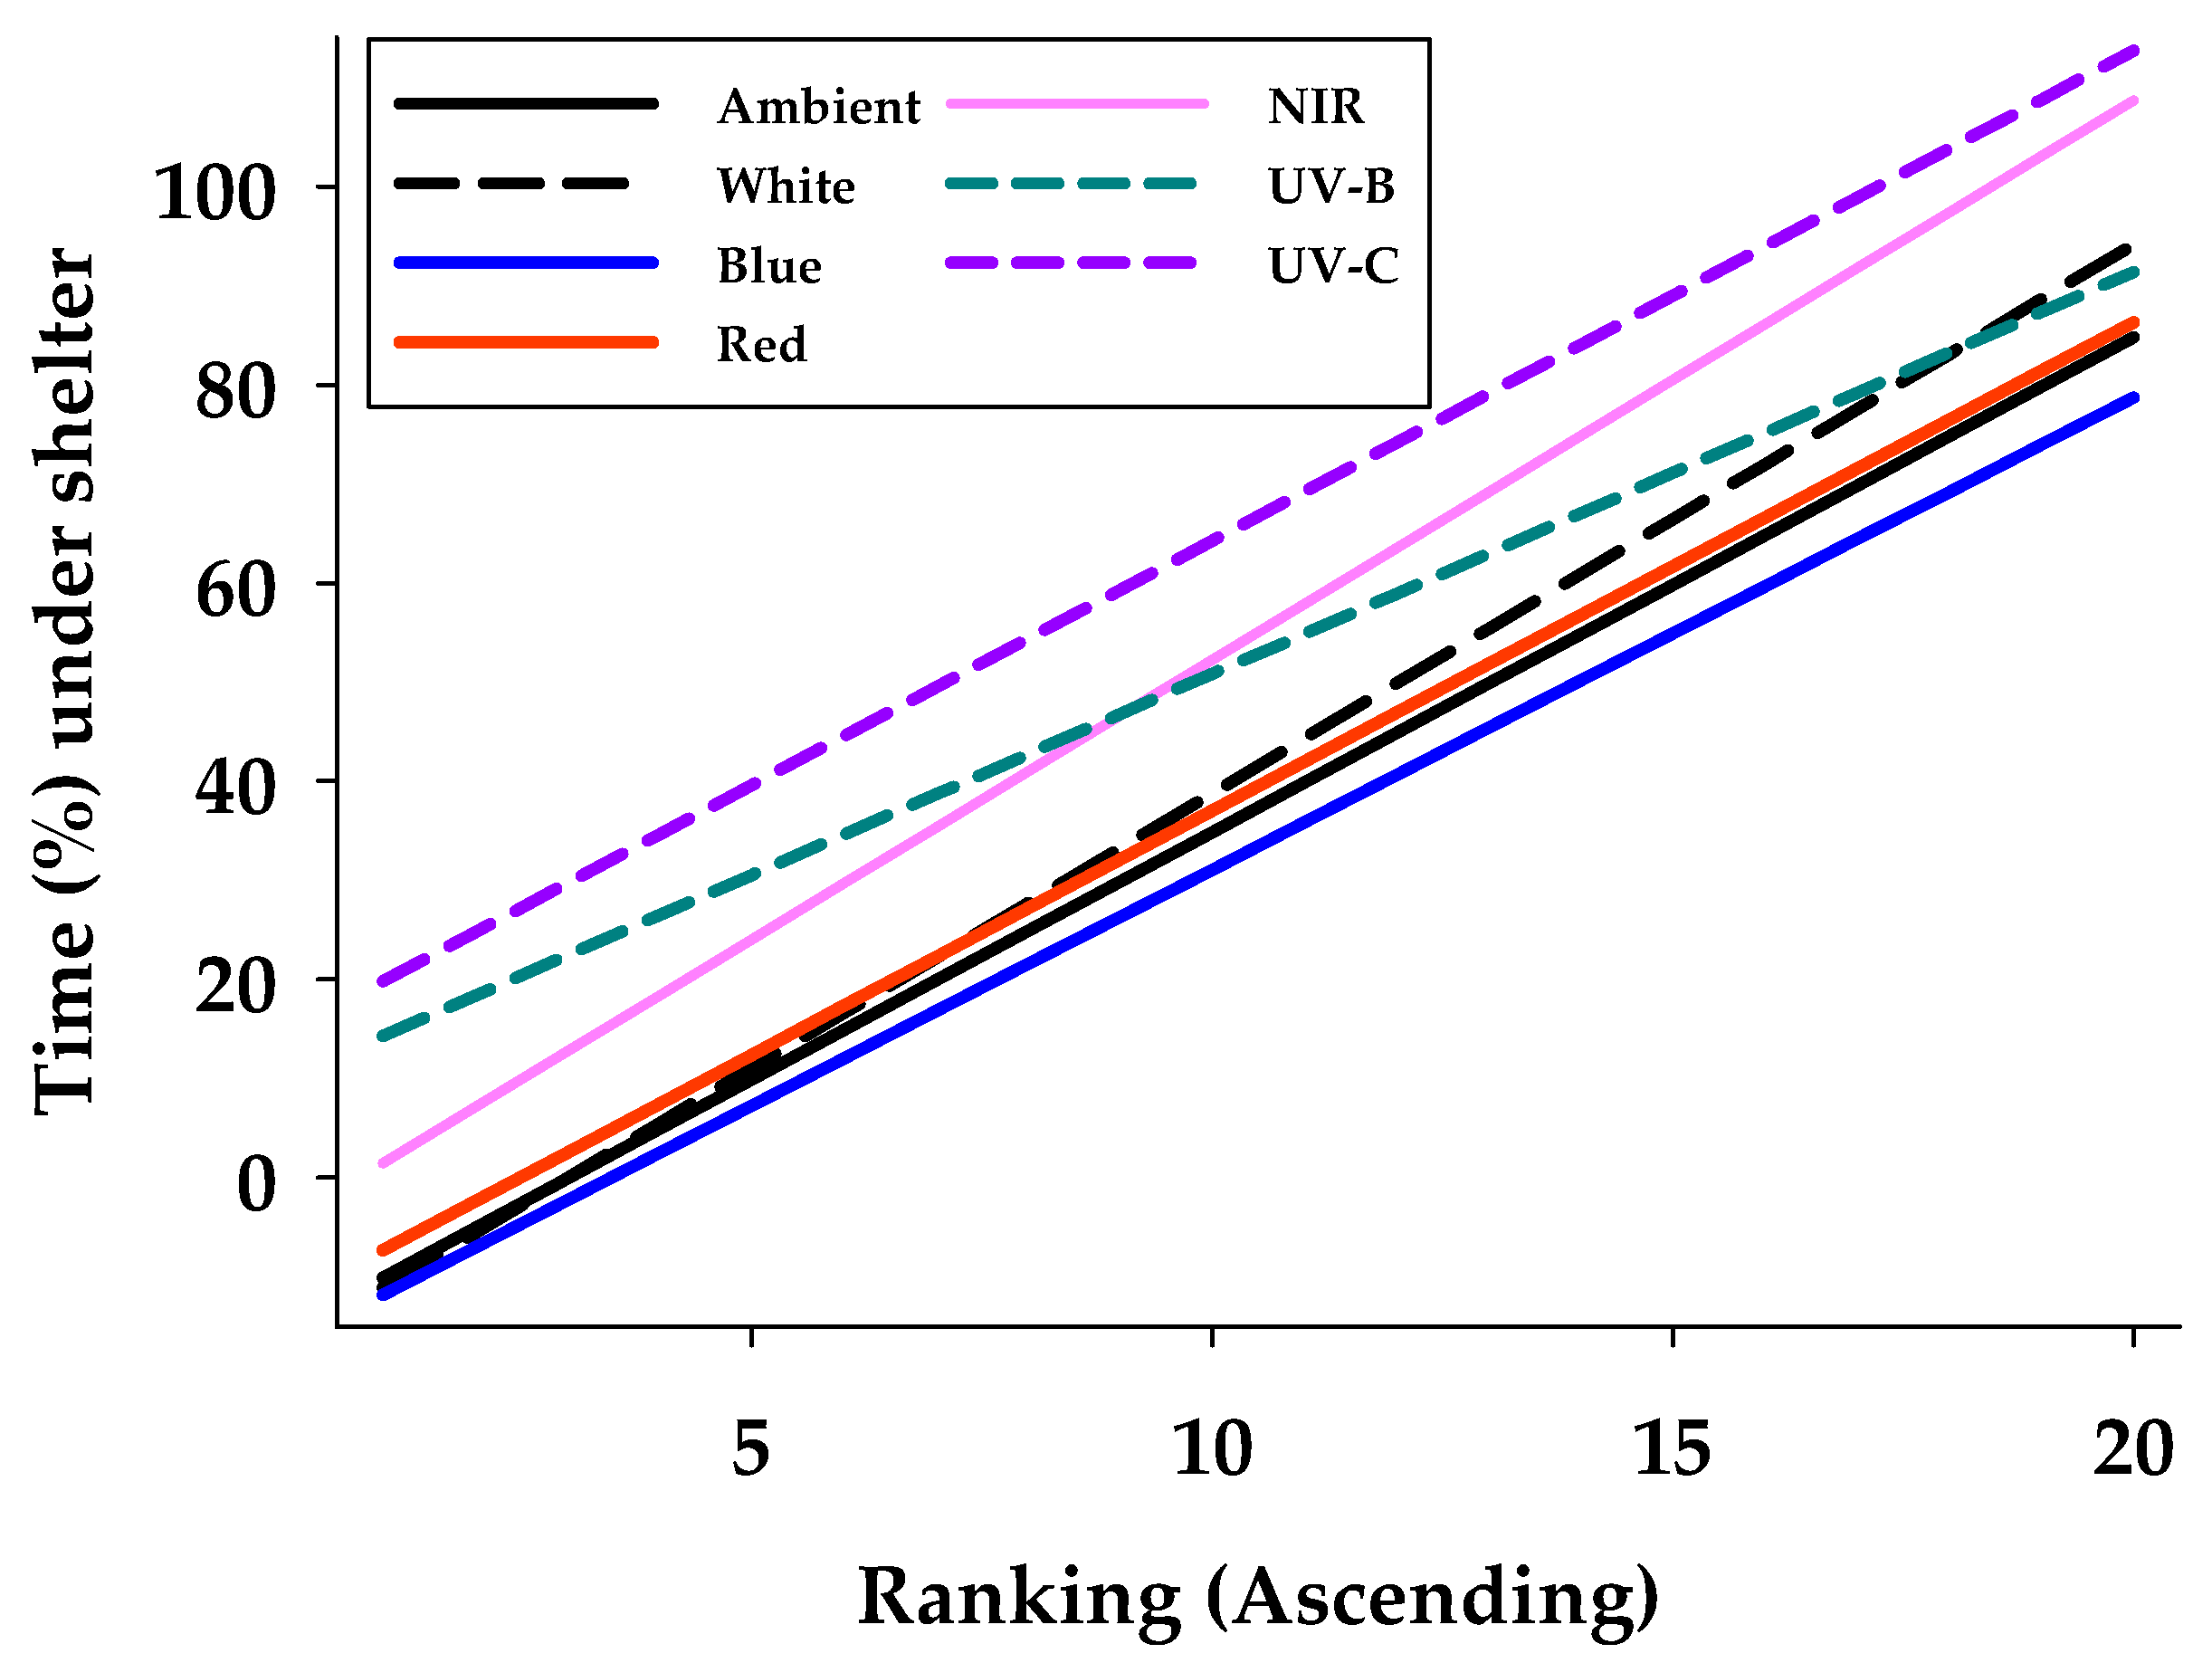
| Variable | Ambient | UVC | UVB | Blue | Red | White | NIR |
|---|---|---|---|---|---|---|---|
| Min | 0.00 | 0.00 | 3.65 | 0.00 | 0.00 | 0.00 | 0.00 |
| Max | 96.14 | 99.52 | 84.28 | 86.81 | 98.96 | 92.41 | 100.00 |
| Average (s.e.) | 37.38 ± 6.83 | 64.30 ± 6.46 | 50.83 ± 5.29 | 33.47 ± 6.46 | 39.51 ± 6.68 | 38.77 ± 7.07 | 55.08 ± 7.58 |
| Adj R2-value | 0.93 | 0.92 | 0.93 | 0.95 | 0.95 | 0.97 | 0.97 |
| Intercept (Int) | −15.04 | 14.87 | 10.25 | −16.56 | −12.23 | −16.64 | −4.17 |
| Slope (Slo) | 4.99 | 4.94 | 4.06 | 4.76 | 4.93 | 5.54 | 5.64 |
| Z-value (Int) | −5.58 *** | −5.26 *** | 0.31 | −0.57 | 0.35 | −2.31 ** | |
| Z-value (Slo) | 0.11 | 2.28 ** | 0.56 | 0.16 | −1.43 | −1.66 * |
Disclaimer/Publisher’s Note: The statements, opinions and data contained in all publications are solely those of the individual author(s) and contributor(s) and not of MDPI and/or the editor(s). MDPI and/or the editor(s) disclaim responsibility for any injury to people or property resulting from any ideas, methods, instructions or products referred to in the content. |
© 2024 by the authors. Licensee MDPI, Basel, Switzerland. This article is an open access article distributed under the terms and conditions of the Creative Commons Attribution (CC BY) license (https://creativecommons.org/licenses/by/4.0/).
Share and Cite
Nansen, C.; Savi, P.J.; Ward, T.; Khodaverdi, H.; Lieth, J.H.; Mantri, A.V. Manipulation of Phototactic Responses by Two-Spotted Spider Mites to Improve Performance of Miticides. Crops 2024, 4, 568-583. https://doi.org/10.3390/crops4040040
Nansen C, Savi PJ, Ward T, Khodaverdi H, Lieth JH, Mantri AV. Manipulation of Phototactic Responses by Two-Spotted Spider Mites to Improve Performance of Miticides. Crops. 2024; 4(4):568-583. https://doi.org/10.3390/crops4040040
Chicago/Turabian StyleNansen, Christian, Patrice Jacob Savi, Tora Ward, Haleh Khodaverdi, Johann Heinrich Lieth, and Anil V. Mantri. 2024. "Manipulation of Phototactic Responses by Two-Spotted Spider Mites to Improve Performance of Miticides" Crops 4, no. 4: 568-583. https://doi.org/10.3390/crops4040040
APA StyleNansen, C., Savi, P. J., Ward, T., Khodaverdi, H., Lieth, J. H., & Mantri, A. V. (2024). Manipulation of Phototactic Responses by Two-Spotted Spider Mites to Improve Performance of Miticides. Crops, 4(4), 568-583. https://doi.org/10.3390/crops4040040