Article

Molecular Discrimination and Phylogenetic Relationships of Physalis Species Based on ITS2 and rbcL DNA Barcode Sequence

1
Department of Biochemistry, University of Nairobi, Nairobi P.O. Box 30197-00100, Kenya
2
Department of Life Sciences, South Eastern Kenya University, Kitui P.O. Box 170-90200, Kenya
3
Department of Biology, University of Nairobi, Nairobi P.O. Box 30197-00100, Kenya
*
Author to whom correspondence should be addressed.
Crops 2023, 3(4), 302-319; https://doi.org/10.3390/crops3040027
Submission received: 7 September 2023 / Revised: 21 October 2023 / Accepted: 31 October 2023 / Published: 17 November 2023

Abstract

:
Plants of the genus Physalis are of economic interest because of their fleshy edible fruits with high nutritional value. Some species have high medicinal value with a long history of ethno-medicinal use to treat diverse diseases. There is therefore a need to correctly discriminate the different species of Physalis for proper utilization. Although most Physalis species have unique morphologies, their vegetative stages are identical, making it difficult to accurately identify them based on morphological characteristics. DNA barcoding has the potential to discriminate species accurately. In this study, ribulose bisphosphate carboxylase large (rbcL) and internal transcribed spacer 2 (ITS2) regions were used to discriminate Physalis species and to reveal their phylogenetic relationships and genetic diversity. Physalis plant samples were collected from seven counties in Kenya based on the availability of the germplasm. The voucher specimens were identified using the botanical taxonomy method and were deposited in the University of Nairobi herbarium. Genomic DNA was isolated from leaf samples of 64 Physalis accessions and used for PCR amplification and the sequencing of rbcL and ITS2 barcode regions. The discriminatory ability of the barcodes was based on BLASTn comparison, phylogenetic reconstruction and cluster analysis, and the determination of inter- and intra-specific distances. The nucleotide polymorphism, genetic diversity and distance of the identified Physalis species were determined using DnaSP and MEGA 11.0 software. Species discrimination was more robust using ITS2 sequences. The species identified and discriminated by ITS2 sequences were Physalis purpurea, Physalis peruviana and Physalis cordata. The rbcL sequences were only able to identify Physalis to the genus level. There was high interspecific and low intraspecific divergence within the identified Physalis species based on ITS2 sequences. The ITS2 barcode is an ideal DNA barcode for use in the discrimination of species, as well as in genetic diversity studies of Physalis accessions in Kenya.

1. Introduction

The genus Physalis has many species that grow in a wide array of habitats and ecologies, a common feature of the Solanaceae family [1]. This plant is native to the Andean region of South America with Colombia being the main producer and exporter [2]. The economic value of Physalis in Colombia is linked to the high demand of fruits from mainly European countries [3,4]. Other exporters of Physalis include Australia, New Zealand, Great Britain, Egypt, South Africa, Uganda, Zimbabwe, Kenya, Madagascar, and Southeast Asian countries [5,6,7]. Physalis are useful for income generation and have a wide range of nutritional and medicinal applications [7,8]. Nutritionally, several Physalis species are rich in water- and fat-soluble vitamins (A, E, K, C and B-complex), minerals (magnesium, potassium, calcium and zinc), fatty acids (such as palmitate and linoleic acid), proteins and sugars [5,9]. The increased consumption of Physalis fruits has been associated with a decreased risk of chronic degenerative diseases [10]. The fruits are also rich in soluble solids, such as sugars like fructose, which are valuable for diabetic sugar control [7]. Physalis peruviana and Physalis angulata are rich in flavonoids, physaloids and other phytochemicals, and have been utilized in ethno-medicine. These phytochemicals have been applied in wound healing and the treatment of various ailments such as jaundice caused by hepatotoxicity, asthma, arthritis and hepatitis [11,12,13]. Phytochemicals like polyphenols have also contributed to the antioxidant, anti-inflammatory, antidiabetic, antihypertension and anticancer activities of Physalis crude extracts [14,15,16,17]. In addition, Physalis ixocarpa, commonly referred to as tomatillo, is a source of nutrients used in the preparation of sauces and salads [18]. Due to the wide diversity of Physalis species and species-specific applications, there is a need to authenticate and discriminate the different Physalis species in particular regions for efficient utilization, genetic resource conservation, and effective utilization in breeding programs [19].
The identification of Physalis species using morphological properties has resulted in misidentifications due to similarities in the phenotypic characteristics of the different species [19]. For example, Physalis minima and Physalis pubescens are morphologically similar, which presents a challenge in their differentiation using their phenotypic characteristics [19]. Morphological identification is also affected by the environmental/physiological factors, stage of growth and development of plants [20,21]. The misidentification of Physalis species can lead to losses of genetic information due to a lack of genetic conservation [22]. Since the morphological identification of Physalis species has proven to be inefficient, there is a need to use robust and accurate means of species identification [23]. Molecular identification is more accurate as it is based on unique nucleotide sequences that are not affected by the morphological characteristics of the species, the development stage (growth phase) or environmental/physiological factors [24]. To this end, DNA barcoding is one of the molecular techniques that can be used to identify and specify species accurately [25].
DNA barcoding is a rapid and reliable method of species identification and discrimination using short universal standardized DNA sequences [26]. It has been widely utilized and accepted in the identification of plants and animals as an effective taxonomic tool [23,27,28]. Several DNA barcodes can be utilized in the identification of plants, based on the chloroplast-plastid (ribulose bisphosphate carboxylase large (rbcL), maturase (matK), psbA-trnH among others) and nuclear ITS (internal transcriber spacer (ITS1) and (ITS2)) regions. However, factors such as universality, success in amplification and specificity variation need to be considered. These factors influence the efficiency of particular DNA barcodes in the identification and discrimination of plant species, and need to be taken into consideration in the selection of a DNA barcode [29]. rbcL is one of the universal barcode genes that is ideal for plant species discrimination studies, due to its high amplification and low mutation rate [30]. The low level of mutation in the rbcL gene implies that it can be used in detailed studies on intra-species genetic and phylogenetic variation [31]. In addition, it is also a commonly used DNA barcode because it is conserved across a wide range of plant species [32]. Conversely, the nuclear DNA barcode, ITS2 gene is considered the best marker for DNA barcoding due to its high species discrimination power, inter- and intra-species level diversity, and high success rate in amplification and sequencing in plants [30]. Therefore, this suggests the combination of chloroplast–plastids and nuclear regions as an efficient barcode tool to explore plant species discrimination [33].
To the best of our knowledge, no barcoding study has been conducted on the Physalis species present in Kenya. Similarly, no study has been conducted to assess the genetic diversity among Physalis accessions. The current study aimed at identifying the Kenyan Physalis species using rbcL and ITS2 barcodes and assessing the efficiency of the two candidate DNA barcodes to identify Physalis species. In addition, the phylogenetic relatedness of Physalis species was determined using rbcL and ITS2 sequences.

2. Materials and Methods

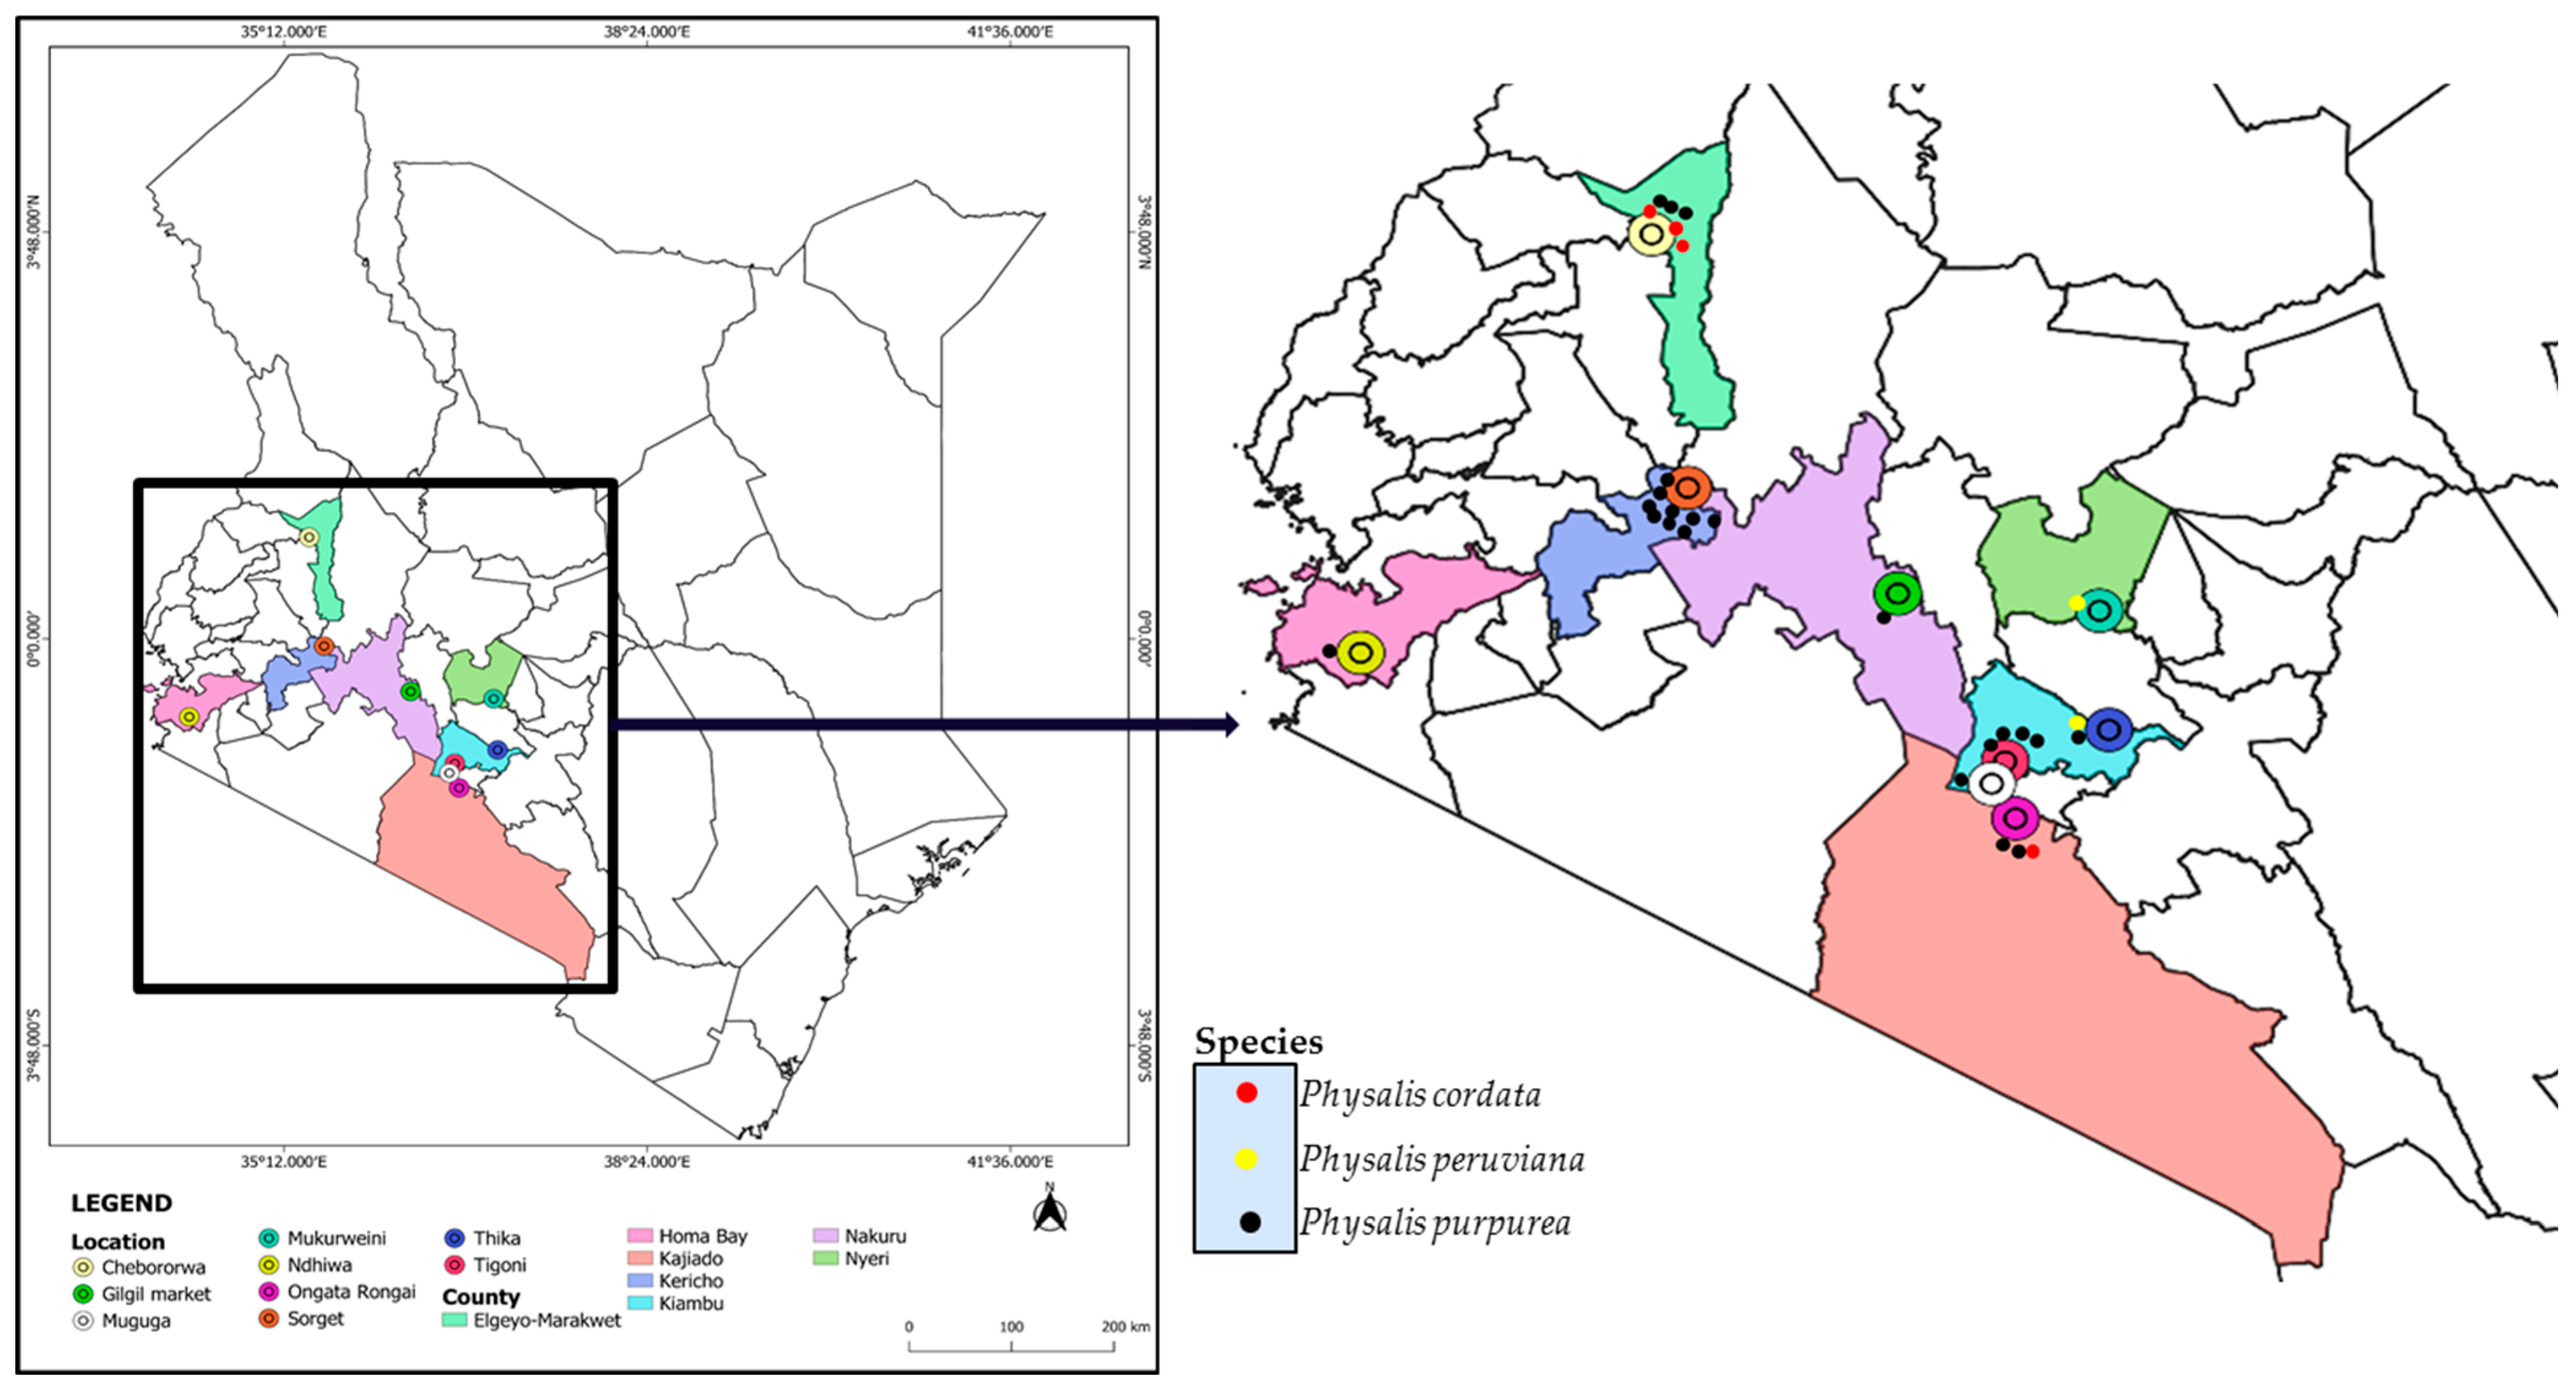
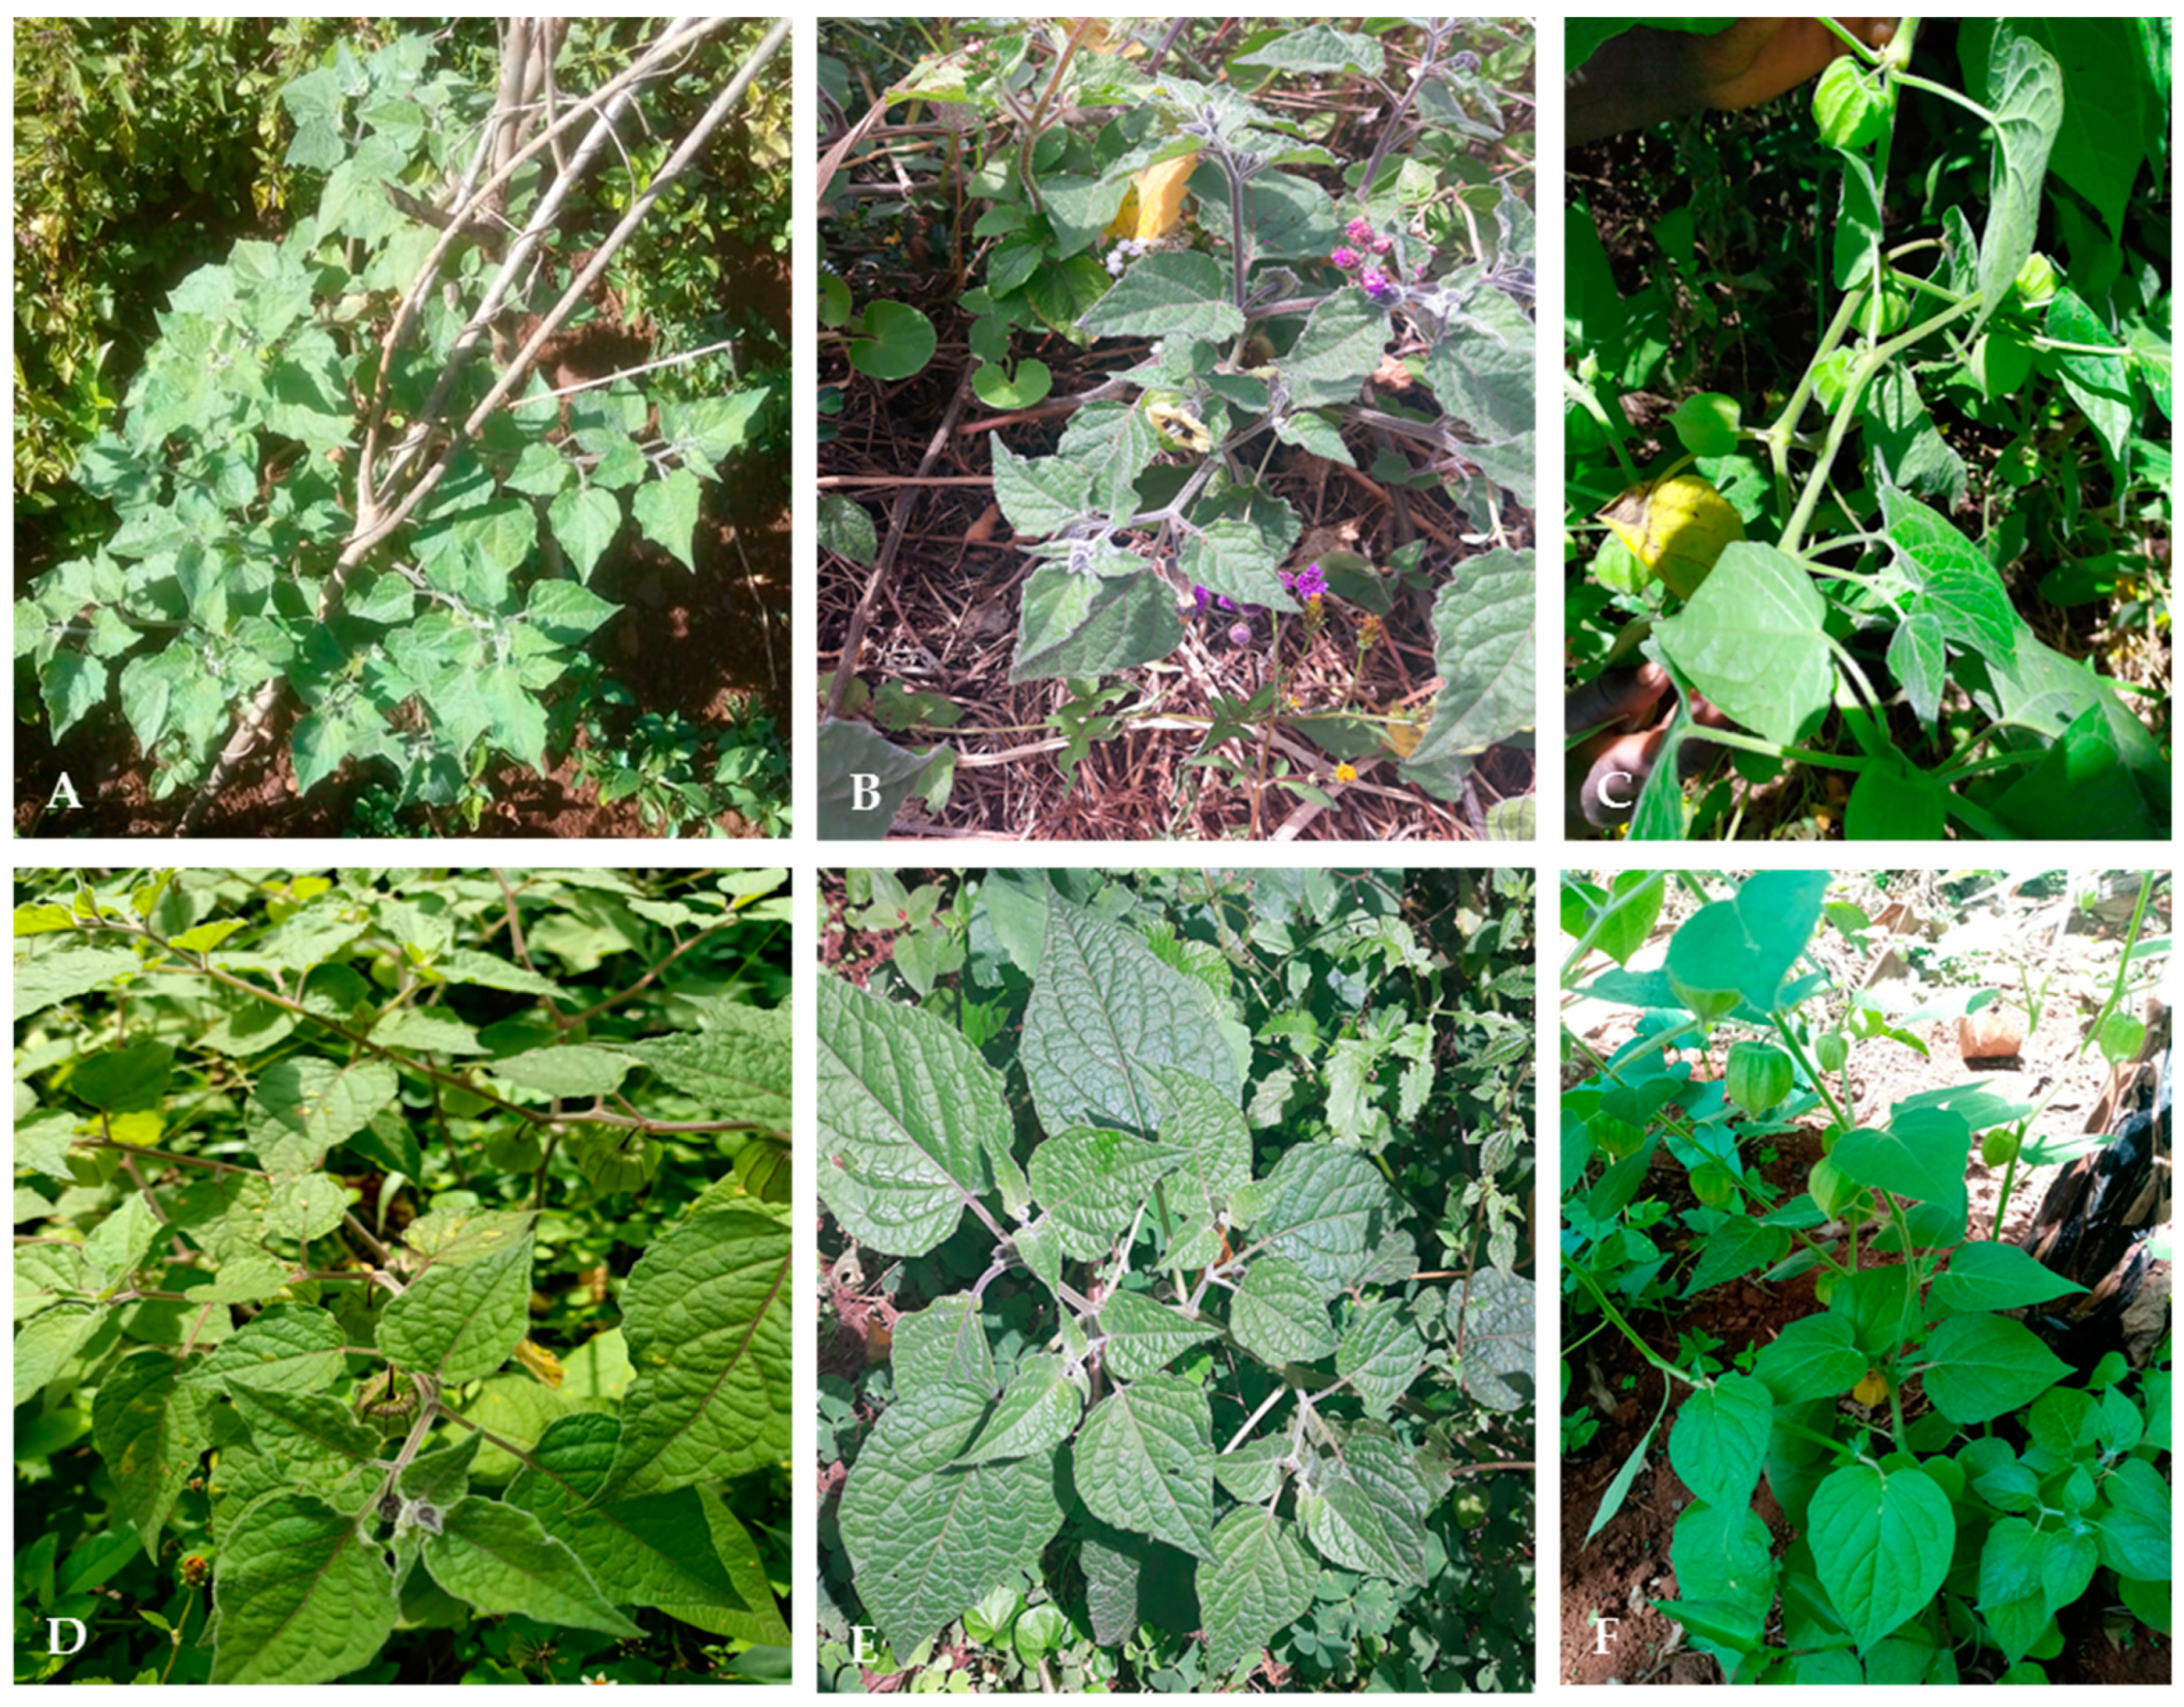
2.1. Study Area and Collection of Plant Samples

Leaves of the genus Physalis were randomly collected from different locations of Kericho, Elgeyo-Marakwet, Homa Bay, Nakuru, Kajiado, Nyeri and Kiambu Counties of Kenya (Figure 1). The leaves were purposively sampled based on the availability, as most of the samples were wild plants growing without human intervention. Within specific locations of sampling in the different counties, leaves and ripe fruits were collected and labeled after being placed in collection bags. The collected Physalis plant samples were identified by the taxonomist Mr. Patrick Mutiso and the samples were preserved in the University of Nairobi herbarium in the Department of Biology (Codes of Voucher Specimens: KP/UON2019/001- KP/UON2019/064). A Global Positioning System (GPS) device was used to record the location where the samples were collected in different counties; the altitude of the location of sampling was also noted and the assigned species name based on morphological appearance was also recorded (Supplementary Table S1). Leaves of sixty-four (64) Physalis plants (Supplementary Table S2) were collected between April and June 2019 in triplicate in zip-lock bags. Since it was difficult to identify the samples morphologically, each set of triplicate plants was given a specific unique identification name based on the location at which they were collected, and a number (Supplementary Table S2). The leaf samples from all the counties were collected from the wild except for Elgeyo-Marakwet, where samples were obtained from a gooseberry farmer. Representative images of plants of some of the collected samples are presented in Figure 2. The samples were transported within 24 h post-sampling in a cool box with icepacks to the Department of Biochemistry at the University of Nairobi, and kept in the laboratory for genomic DNA extraction.

2.2. Genomic DNA Extraction

The isolation of genomic DNA from leaves was done using the Cetyl trimethylammonium bromide (CTAB) method [34]. RibonucleaseA (RNase, 0.6 mg/mL) was added to the DNA samples followed by incubation in a water bath at 37 °C for 30 min to degrade any contaminating RNA. The integrity of the extracted genomic DNA was verified using 0.8% (w/v) agarose gel stained with ethidium bromide (0.5 µg/mL) and viewed under a gel documentation system with a UV transilluminator (BioRad, Hercules, Carlifornia, USA). DNA concentration and purity were checked using a Nanodrop Spectrophotometer (Thermo Scientific, Carlsbad, CA, USA) and then stored at −20 °C.

2.3. PCR Amplification and Sequencing

Polymerase chain reaction (PCR) amplification was performed using ITS2 and rbcL DNA barcode markers. The ITS2 region was amplified with primers ITS-2-F (5′-CCTTATCATTTAGAGGAAGGAG-3′) and ITS-2-R (5′-TCCTCCGCTTATTGATATGC-3′) [35]. The rbcL forward (rbcL-1-F) and reverse (rbcL-74-R) primers were 5′-ATGTCACCACAAACAGAA-3′ and 5′-TCGCATGTACCTGCAGTAGC-3′, respectively [36]. PCR amplification was carried out in a 25 µL reaction mixture with 2 µL of 25 ng of DNA template, 12.5 µL One Taq®® Hot Start 2× master mix with standard buffer (New England Biolabs, Ipswich, MA, USA), 0.5 µL of 10 µM forward and reverse primers (Macrogen, The Netherlands) and 9.5 µL nuclease-free water. The optimization of annealing temperature was done in order to determine the best conditions for amplification. The annealing temperature for the primer was optimized based on six different temperature regimes (50 °C, 51 °C, 52 °C, 54 °C, 56 °C and 58 °C). Amplification was conducted in a Veriti 96-well Thermal Cycler (Thermo Fischer Scientific, Waltham, MA, USA) under cycling conditions of 94 °C for 5 min followed by 30 cycles of 94 °C for 30 s, 58 °C for 45 s and 72 °C 1 min (for both ITS2 and rbcL), and a final elongation at 72 °C for 7 min. The amplicons were confirmed using 1% agarose gel stained with ethidium bromide (0.5 µg/mL) and viewed under a gel documentation system with a UV transilluminator. The amplicons were cleaned using a gel clean-up kit (Applied Biosystems, Thermo Fischer Scientific, Waltham, MA, USA) and sequenced in both directions at the University of Nairobi (UoN) Center of Excellence in HIV Medicine (CoEHM) using an ABI 3730XL automated sequencer (Thermo Fischer Scientific Co., Waltham, MA, USA).

2.4. Sequence Alignment, Phylogenetic and Data Analysis

The sequences of only 28 Physalis accessions that were successfully sequenced for both ITS2 and rbcL primers were used. The raw sequences were assembled and edited to form contigs using BioEdit software [37]. A similarity search for each sequence was verified using the BLASTn program (https://blast.ncbi.nlm.nih.gov/Blast.cgi; accessed on 11 February 2023) to confirm the identities of the sequences. Sequences with the highest similarity were downloaded from the GenBank for alignment with the sequences obtained in this study. The assessment of sequence similarity was based on the percentage identity of Physalis accessions and the E-value of the sequence from the GenBank. The multiple sequence alignment (MSA) was carried out using MUltiple Sequence Comparison by Log-Expectation (MUSCLE) [38] and compressed using ESPript 3 (http://espript.ibcp.fr; accessed on 15 February 2023) [39]. Multiple sequence alignments for the genetic diversity, nucleotide polymorphism, neutrality test and Automatic Barcode Gap Discovery (ABGD) analysis were also generated by MUSCLE. The obtained sequences devoid of primer sequences used during PCR amplification were deposited in the National Center for Biotechnology Information (NCBI)-GenBank.
Phylogenetic trees were constructed based on the Bayesian inference (BI) method using MrBayes version 3.2.7 (https://nbisweden.github.io/MrBayes/; accessed on 12 February 2023) [40]. Statistical analysis was done using the posterior distribution of the model parameter, which was estimated using the Markov Chain Monte Carlo (MCMC) method [40,41,42]. This method assesses the relatedness of species through probability distribution to describe the uncertainty of all unknowns, including model parameters [43]. The Bayesian inference of phylogeny is a character-based method that uses Markov Chain Monte Carlo (MCMC) sampling to calculate the posterior probabilities of distribution during phylogenetic analysis. The MCMC sampling was performed over 18,000,000 generations at a sampling frequency of 1000 and the first 25% (relburnin = yes burninfrac = 0.25) of samples were discarded when estimating the posterior probabilities of the trees. After 18,000,000 generations, the analysis was stopped when the average standard deviation of split frequencies was less than 0.01, and tree parameters were summarized. The constructed phylogenetic trees were visualized and modified using FigTree software version 1.4.4 (http://tree.bio.ed.ac.uk/software/figtree/; accessed on 12 February 2023).

2.5. Analysis of Genetic Divergence

The DNA divergence between Physalis accessions based on ITS2 sequences was assessed using DnaSP software version 6.12.03 [44]. The MSA for ITS2 sequences of 28 Physalis accessions was used. Nucleotide diversity (Pi), average nucleotide substitution per site between populations (Dxy) and number of nucleotide substitutions per site between populations (Da) were determined using the Jukes and Cantor algorithm on DnaSP. For DNA divergence within Physalis accessions, the number of polymorphic segregating sites (S), nucleotide diversity and total number of substitutions were also determined using the Jukes and Cantor algorithm on DnaSP.

2.6. Determination of Intraspecific and Interspecific Genetic Distance

The intra- and interspecific genetic distances and overall mean distance of Physalis accessions based on the ITS2 sequences were calculated using the Kimura-2-parameter (K2P) model with gamma distribution and a gamma parameter of 0.27 using MEGA version 11.0 [45]. Intraspecific genetic distance based on the rbcL sequences was determined as explained above for the ITS2 sequences.

2.7. Nucleotide Polymorphism and Neutrality Tests

DNA Sequence Polymorphism (DnaSP) software version 6.12.03 was used in the polymorphism analysis. The two MSAs for 28 Physalis accessions based on ITS2 and rbcL sequences were used. The estimated DNA polymorphism parameters were polymorphic segregating sites, singleton and parsimony informative sites, nucleotide diversity and average number of nucleotide differences.
Tajima’s neutrality test for ITS2 and rbcL sequences was performed to assess the frequency of mutations among species and to determine selection in the populations [46]. Tajima’s neutrality test was assessed using the MEGA 11.0 software [47]. The analysis involved 28 nucleotide sequences for the DNA barcode gene sequences analyzed. The codon positions included were the 1st + 2nd + 3rd + Noncoding for the rbcL gene sequences. All ambiguous positions were removed for each sequence pair (pairwise deletion option) in both analyses based on ITS2 and rbcL genes. There were totals of 532 and 716 positions for the ITS2 and rbcL genes, respectively, in the final dataset.

2.8. Barcoding Gap Analysis

In order to delimit Physalis species based on their intraspecific divergence within a population and group species into operational taxonomic groups (OTUs), the Automatic Barcode Gap Discovery (ABGD) method was used [48]. The MSA utilized in the genetic diversity analysis was used for the ABDG analysis of ITS2 and rbcL sequences. The ITS2 and rbcL multiple sequence alignments were separately uploaded to the ABGD website (https://bioinfo.mnhn.fr/abi/public/abgd/abgdweb.html; accessed on 20 February 2023) and distance analysis was performed based on the K80 Kimura measure of distance. The default value for relative gap width (X) was set at 1.5. The P values of intraspecific divergence were set at the prior minimum (Pmin) and prior maximum (Pmax) divergence of intraspecific diversity at 0.001 and 0.1, respectively. Default settings were maintained for all other parameters.

3. Results

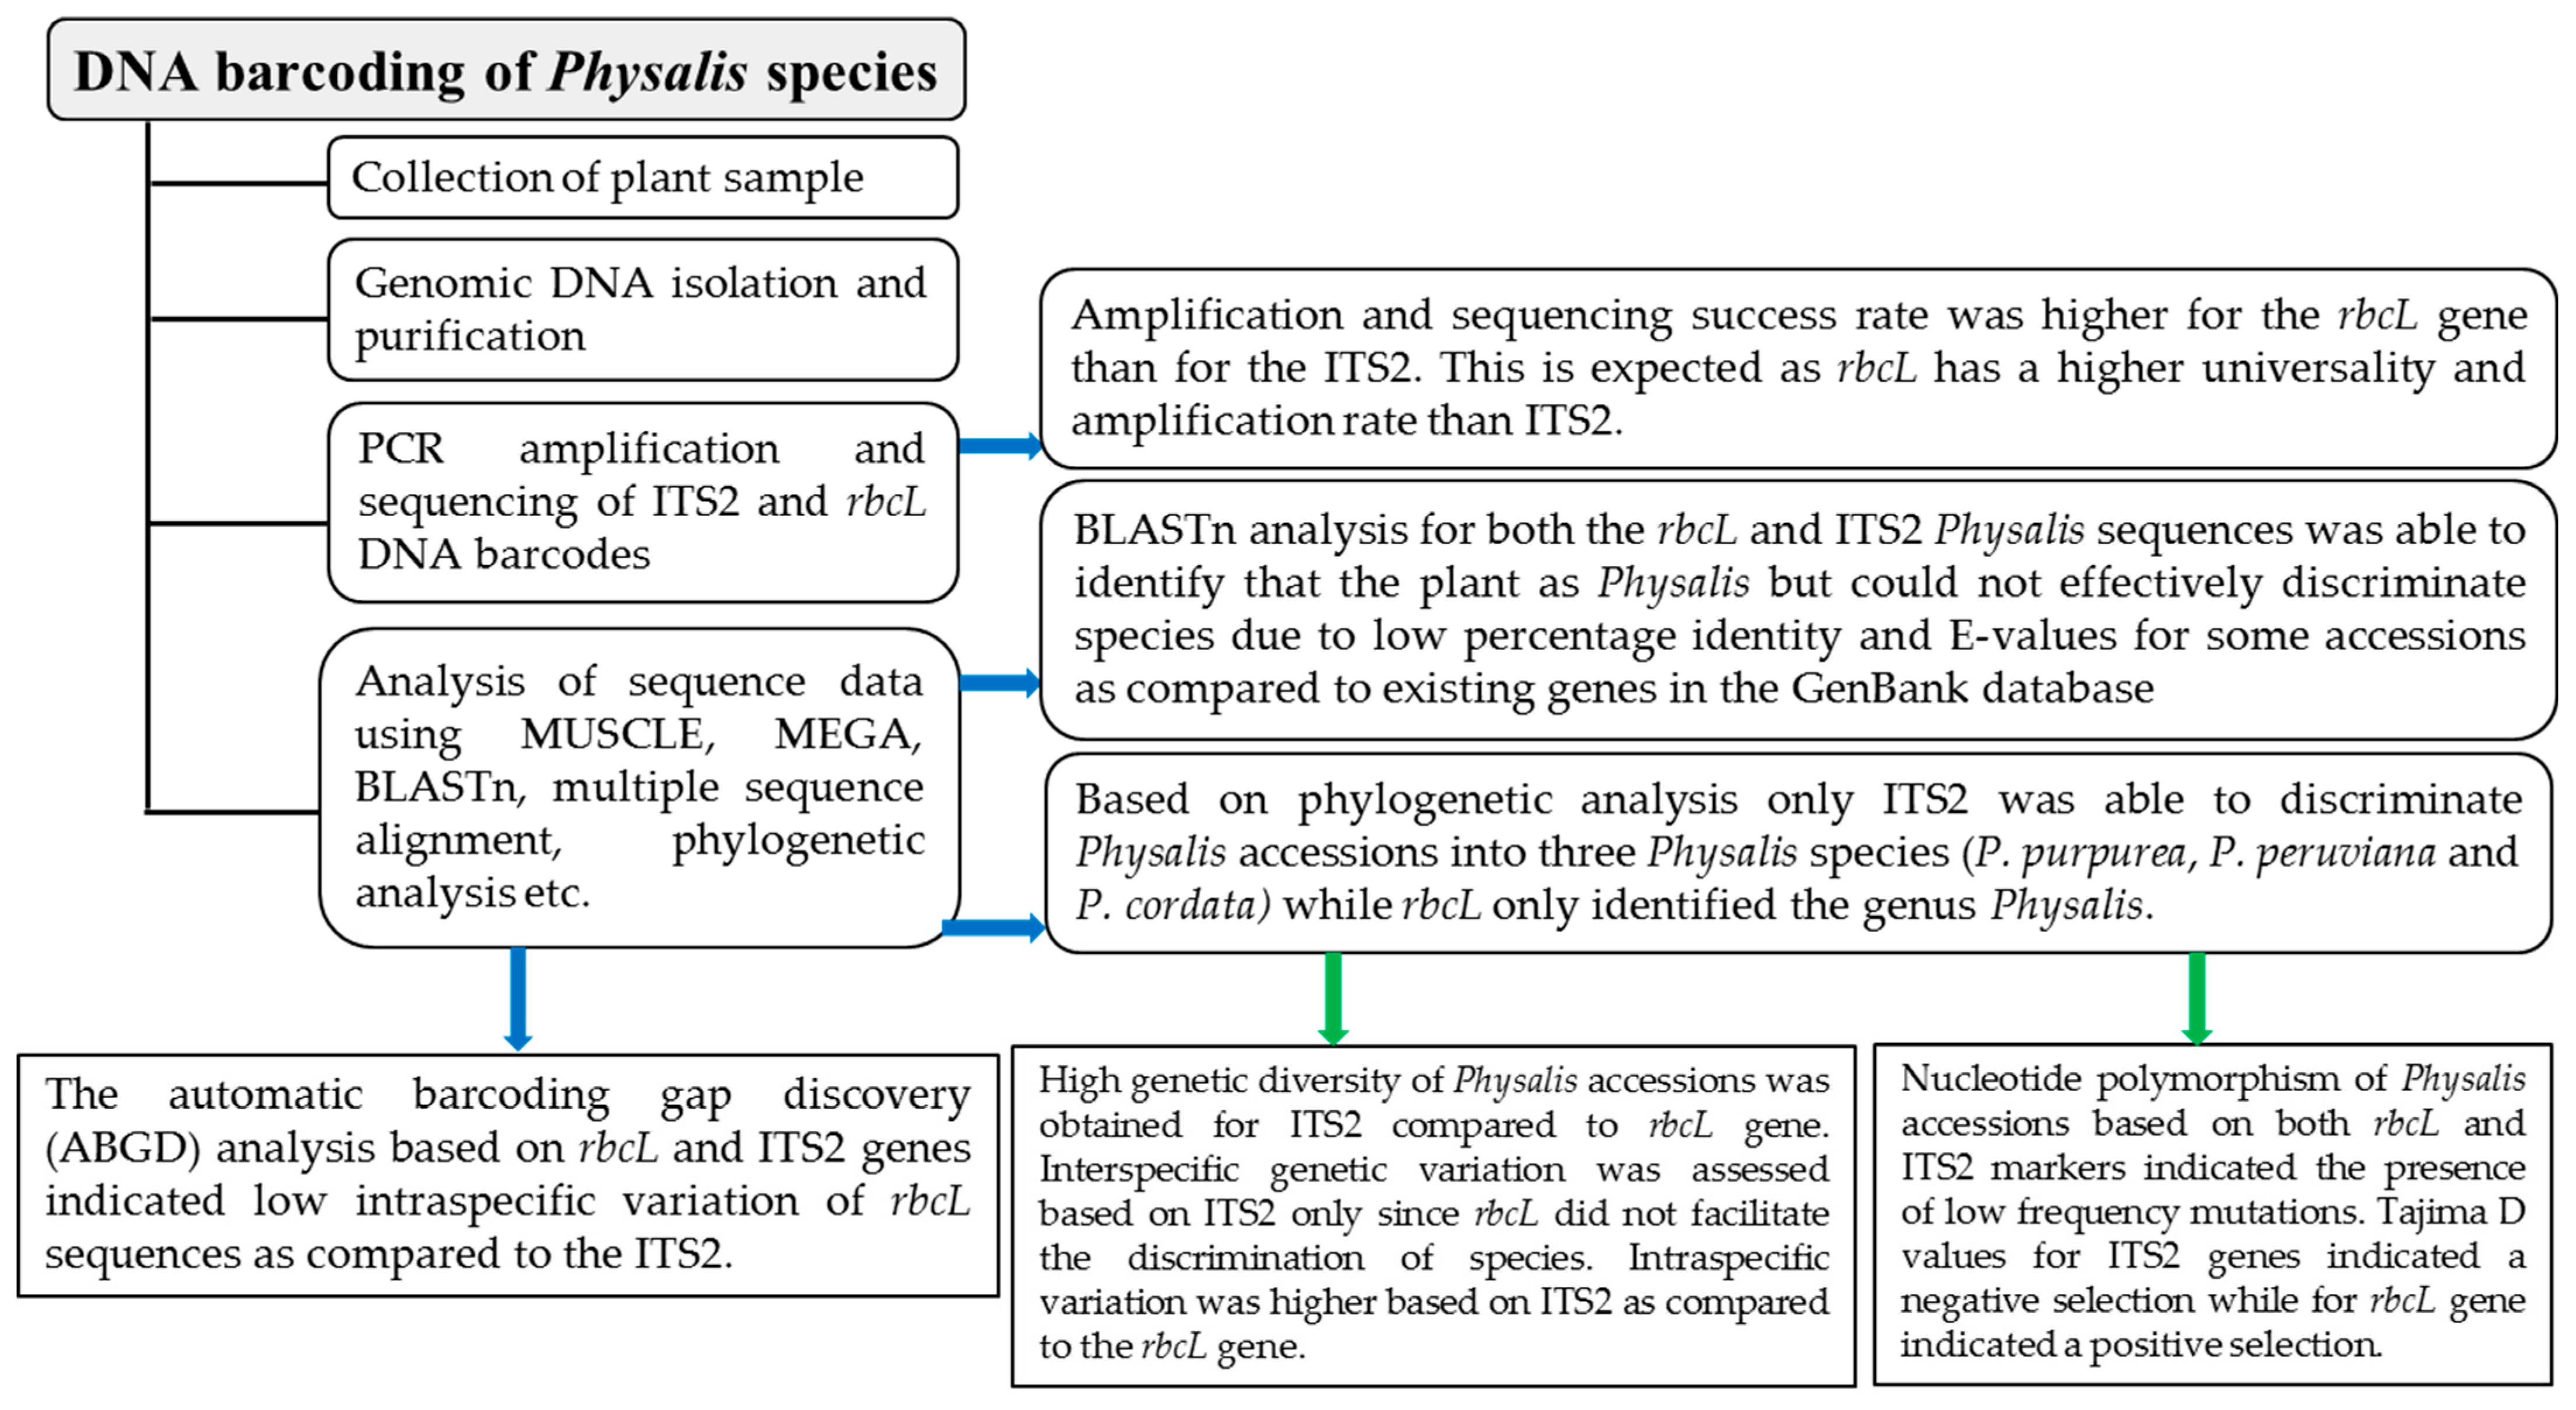
3.1. Success Rates of PCR Amplification and Sequencing

The success rates of PCR amplification for ITS2 and rbcL were 77% and 84%, respectively, while the sequencing success rates were high for rbcL (89%) and moderate for ITS2 (65%). The lengths of the ITS2 sequences were in the range of 237–707 bp, with an average of 525 bp and mean GC content of 61%, with a range of 55.7–66.9%. Similarly, the lengths of the rbcL sequences were in the range of 463–854 bp, with an average of 690 bp and mean GC content of 43.4%, with a range of 42.1–45.5% (Table 1, Supplementary Tables S3 and S4).
The nucleotide base frequencies at different coding positions in Physalis accessions for ITS2 and rbcL sequences are indicated in Table 2. The percentage GC contents of ITS2 sequences were significantly higher than those of rbcL sequences for the Physalis accessions used in this study.

3.2. Species Discrimnation of Physalis Accessions Using BLASTn Analysis

Species discrimination used a similarity-based approach based on BLASTn. The results show a high similarity of ITS2 and rbcL with other sequences in the GenBank by BLASTn sequence similarity searches. The percentage identity based on ITS2 loci ranged from 80.36 to 97.41%, and the Physalis species identified were Physalis cordata, P. peruviana, Physalis microcarpa, Physalis aff. philadelphica, Physalis minimaculata and Physalis purpurea (Supplementary Table S5). None of the Physalis accessions had 100% identity based on ITS2 sequences for the BLASTn analysis.
BLASTn analysis of the rbcL sequences identified that all 28 Physalis accessions belonged to the genus Physalis. Out of the 28 Physalis accessions, 7 had 100% identity as Physalis minima, while the rest had percentage identities ranging from 91.10 to 99.86 and were identified as P. peruviana, P. virginiana, P. angulata and P. minima (Supplementary Table S5).

3.3. Multiple Sequence Alignments

The multiple sequence alignment (MSA) of cleaned ITS2 and rbcL sequences based on MUSCLE had a sequence length of 841 bp. The multiple sequence alignment was compressed using ESPript 3 (Supplementary Figure S1) (https://espript.ibcp.fr/ESPript/temp/1032964064/0-0-1680466160-esp.pdf; accessed on 15 February 2023). This MSA had a high rate of nucleotide substitutions, deletions and insertions among and between Physalis species based on the ITS2 marker (Supplementary Figure S1). The MSA also shows a high rate of nucleotide sequence conservation among and between the Physalis species based on the rbcL marker with very few deletions, insertions and substitutions. Substitution transition mutations can be noted at positions 304 and 368 (Supplementary Figure S1). At position 304, we see a transition substitution mutation for the Physalis accession OQ507184.1 whereby this sequence has an adenine, but all other rbcL sequences and reference sequences have a guanine. At position 368, there is another substitution point mutation for Physalis accession OQ507166.1, whereby guanine replaces an adenine base. A transversion point mutation is also noted at position 305 for the Physalis accession OQ507184.1, whereby a guanine replaces cytosine (Supplementary Figure S1). Other transversion point mutations are noted at positions 369 and 419 of the Physalis accession OQ507166.1, whereby adenine replaces thymine in both cases (Supplementary Figure S1). An insertion macro-lesion is noted between positions 579 and 580 for Physalis accession OQ507166.1, whereby five nucleotides are inserted (Supplementary Figure S1). A deletion macro-lesion is noted for Physalis accession OQ507184.1 between positions 530 and 536 whereby seven nucleotides are deleted (Supplementary Figure S1).
The MSA of the 28 ITS2 sequences based on MUSCLE, trimmed and edited by Jalview version 1.11.2.0, had a sequence length of 532 bp. It was compressed using ESPript (Supplementary Figure S2) (https://espript.ibcp.fr/ESPript/temp/1440398212/0-0-1688383904-esp.pdf; accessed on 15 February 2023). This MSA has many substitution, deletion and insertion mutations (Supplementary Figure S2). The substitution mutations in this MSA are composed of transition and transversion point mutations (Supplementary Figure S2). The MSA of 28 rbcL sequences based on MUSCLE, trimmed and edited by Jalview, had a sequence length of 716 bp. It was compressed using ESPript (Supplementary Figure S3) (https://espript.ibcp.fr/ESPript/temp/1848737578/0-0-1688384397-esp.pdf; accessed on 15 February 2023). This MSA is relatively conserved and does not have any insertion or deletion mutations, but it has quite a high number of substitution point mutations; for example, at positions 40, 170, 171, 180, 181, and many others (Supplementary Figure S3). The substitution mutations are composed of transition and transversion point mutations (Supplementary Figure S3).
The sequence alignments reveal a wide dispersal of sequence similarity for ITS2 sequences and homologous sequences for rbcL sequences among the tested Physalis accessions.

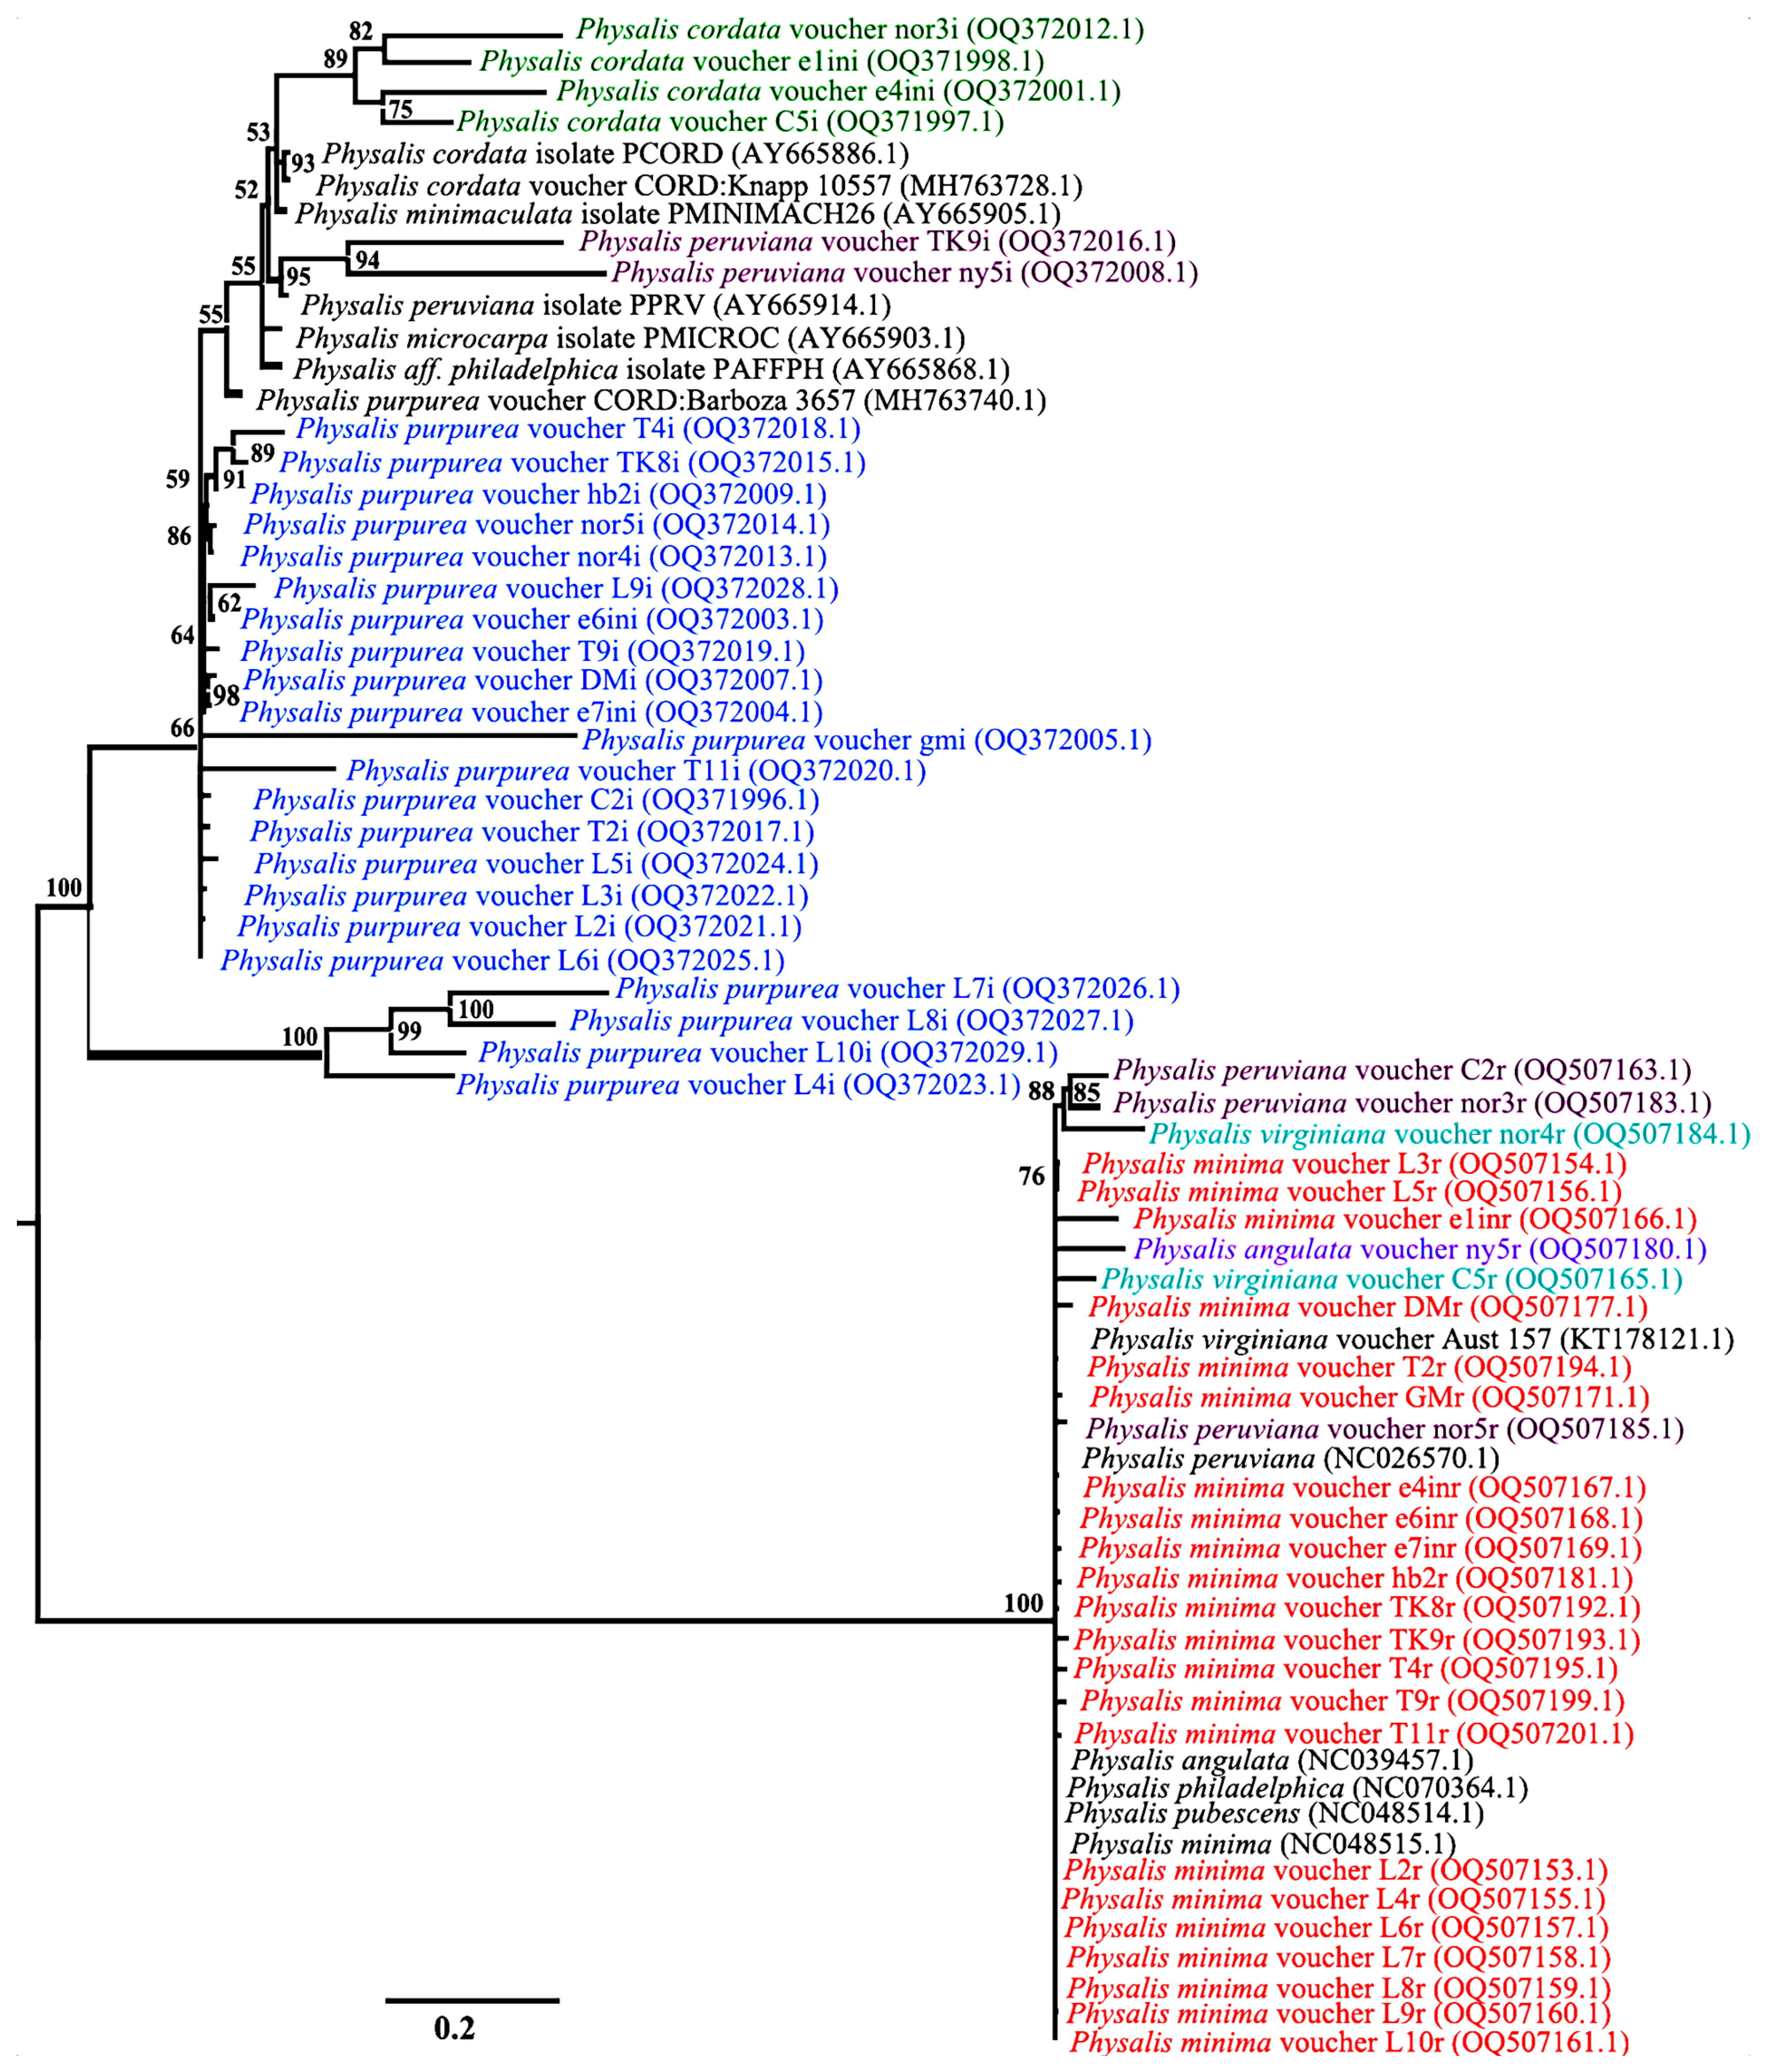
3.4. Species Discrimnation of Physalis Species Based on Phylogenetic Analysis

A phylogenetic tree constructed using combined ITS2 and rbcL sequences yielded two major clusters from the BI phylogeny that were robust with 100% posterior probability values (Figure 3), with each of the clusters separated based on the ITS2 and rbcL nucleotide data matrix. Species discrimination was only possible with the ITS2 marker, while the discriminatory power of rbcL was low and inefficient. The rbcL region showed the lowest level of genetic differentiation, with the species samples P. minima, P. peruviana, P. angulata and P. virginiana forming a distinct cluster (Figure 3). The nucleotide data matrix from rbcL reflects the close genetic relationships of these species (Figure 3). The nucleotide data matrix of ITS2 splits the Physalis accessions into three clades representing three Physalis species, namely, P. cordata (OQ5372012.1, OQ371998.1, OQ372001.1 and OQ371998.1), P. peruviana (OQ372016.1 and OQ372008.1) and P. purpurea (OQ371996.1, OQ372003.1, OQ372004.1, OQ372005.1, OQ372007.1, OQ372009.1, OQ372013.1, OQ372014.1, OQ372015.1, OQ372017.1, OQ372018.1- OQ372029) (Figure 3).
The clades formed by the ITS2 sequences show longer branch lengths among the P. peruviana species, with a posterior probability percentage of 94. The P. cordata species is associated with moderate branch lengths on the phylogenetic tree, with a posterior probability percentage of 89. The shortest branch lengths among the ITS2 sequences on the phylogenetic tree are those associated with P. purpurea, with a posterior probability percentage of 66.

3.5. Genetic Divergence Analysis between and within Physalis Species Based on ITS2 Sequences

The ITS2 sequence was the only barcode that could be used to differentiate the accessions into Physalis species (Figure 3).

3.5.1. DNA Divergence between Populations Based on ITS2 Sequences

Varying shared mutations were observed between the Physalis populations (Table 3). The nucleotide diversity was highest (0.33208) between P. peruviana and P. cordata and the lowest (0.14821) between P. cordata and P. purpurea. The average number of nucleotide substitutions per site between populations ranged from 0.24621 to 0.38915. The number of net nucleotide substitutions per site between nucleotides ranged from 0.01299 to 0.12343 (Table 3). The total number of fixed (base) differences between populations was: six for P. peruviana and P. cordata, one for P. peruviana and P. purpurea, and zero for P. cordata and P. purpurea (Table 3). The number of fixed differences was determined from the total polymorphic sites between populations, and it was observed that the higher the number of polymorphic differences between populations was, the higher the fixed difference would be, and vice versa (Table 3).

3.5.2. DNA Divergence within Populations Based on ITS2 Sequences

DNA divergence within each Physalis species was assessed using ITS2 sequences by determining the number of polymorphic (segregating) sites (S), the nucleotide diversity and the total number of substitutions (Table 4). The nucleotide diversity was highest (0.31250) and lowest (0.14898) within P. peruviana and P. purpurea, respectively (Table 4). The highest (101) and the lowest (26) total numbers of nucleotide substitutions were observed in P. cordata and P. purpurea, respectively. The numbers of polymorphic segregating sites were highest (83) and lowest (20) within P. cordata and P. purpurea, respectively (Table 4).

3.6. Genetic Distance between and within Physalis Species Based on ITS2 and rbcL Sequences

The average inter-specific distance between Physalis species was determined based on the ITS2 gene sequences only because the rbcL marker was not able to facilitate species discrimination. The analysis showed that the highest mean genetic distance (1589.41) was between P. purpurea and P. cordata (Table 5). The lowest mean genetic distance (9.53) was between P. cordata and P. peruviana (Table 5).
The average intra-specific distance within Physalis species was determined based on ITS2 sequences. The highest mean intraspecific distance was noted for P. purpurea (9.98 ± 12.73), followed by P. peruviana (1.31 ± 0.46), while the lowest mean intraspecific distance (0.72 ± 0.13) was recorded for P. cordata. The divergence was higher within P. purpurea and lowest within P. cordata. The average intraspecific distance within Physalis accessions was also determined based on rbcL sequences. The intraspecific distance within Physalis species based on rbcL sequences was 0.03 ± 0.00.

3.7. Nucleotide Polymorphism and Neutrality Tests

In total, 4 segregation sites (S) were identified within the ITS2 sequences, while 59 segregation sites were identified within the rbcL gene sequences (Table 6). The nucleotide diversity (Pi) of ITS2 sequences was 0.15917, which is higher than that of rbcL sequences (0.01632) (Table 6). For the ITS2 sequences, the four polymorphic sites identified had 1 singleton and 3 parsimony informative bases, while the rbcL sequences had 48 singletons and 11 parsimony informative sites (Table 6).
Tajima’s neutrality test was conducted on the ITS2 and rbcL barcode sequences in order to establish the existence of a population selection based on the Tajima D value and nucleotide diversity. The Tajima D value of ITS2 sequences (0.870515) was higher compared to that of rbcL (−2.73462). The nucleotide diversity based on Tajima’s test was also significantly higher for ITS2 sequences (π = 0.176498) compared to rbcL (π = 0.067832).

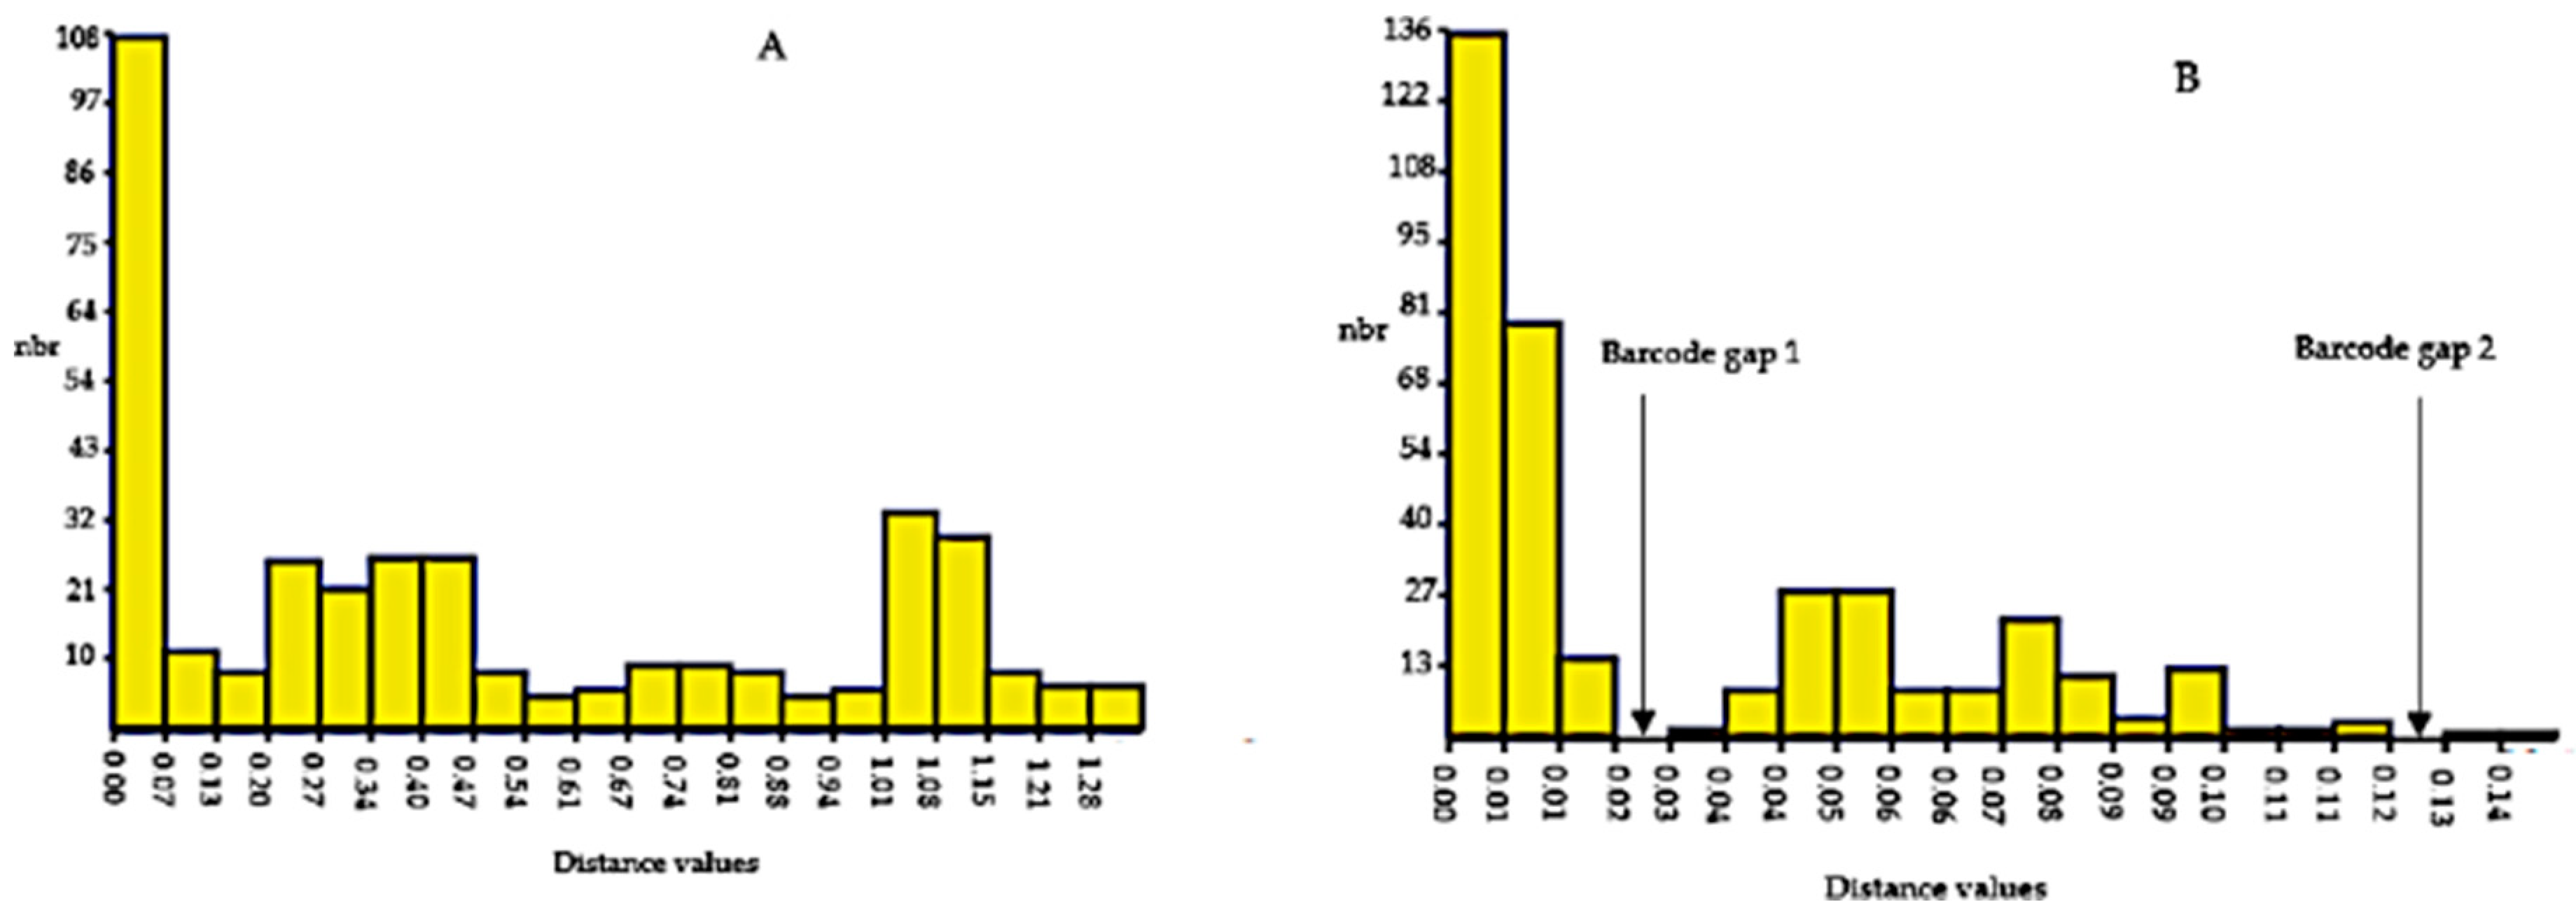
3.8. Barcoding Gap Analysis

The Automatic Barcode Gap Discovery (ABGD) results generated by the K80 Kimura measure of distance based on ITS2 and rbcL markers for Physalis accessions were used to determine the presence of a barcoding gap (Figure 4). The histogram ranked pairwise distances by increasing distance values from 0.02 to 1.28 and 0.02 to 0.14 for ITS2 and rbcL gene sequences, respectively (Figure 4). No barcode gap was detected via ITS2 ABGD analysis, while two barcode gaps were detected by the rbcL ABGD analysis (Figure 4). The first barcode gap for the rbcL gene sequence was detected between distances of 0.02 (2%) and 0.03 (3%), while the second barcode gap was between a distance of 0.12 (12%) and 0.13 (13%).

4. Discussion

DNA barcoding is a novel approach for identifying and discriminating species based on the nucleotide diversity of target/specific conserved sequences. Several studies have indicated that the DNA barcodes rbcL and ITS2, based on the chloroplast–plastid and nuclear regions, respectively, have been used to identify various plant families with similar morphological traits [1]. This study aimed at species discrimination in Physalis genotypes collected from different regions in Kenya by deploying both rbcL and ITS2 barcodes, and evaluated the efficiency of these markers in the barcoding of Physalis species. This is the first report to identify Physalis in Kenya using chloroplast–plastid and nuclear regions.
In previous studies, DNA barcoding markers, rbcL, psbA-trnH and ITS2 have been proven to be efficient in discriminating Physalis species from China and India [1,19,22]. These barcode genes were identified as potential candidates for the barcoding of Physalis plants. In the current study, the amplification was not universal because 16% and 23% of the samples did not amplify for rbcL and ITS2, respectively. Amplification failure can be attributed to DNA degradation during the transit of samples from the field to the laboratory. In addition, failures of DNA amplification and sequencing could also be linked to poor quality DNA due to the presence of large amounts of secondary metabolites, such as phenolic compounds released during DNA isolation, which are common in Physalis species [30,49].
The rbcL region of Physalis in this study was amplified more effectively compared to the ITS2 region. This concurs with previous studies, which showed higher amplification and sequencing success rate for rbcL compared to ITS2 [30,50]. The high success rate of rbcL amplification is attributed to the high conservation of the gene and its low frequency rates of mutation [30]. Conversely, the lower amplification and sequencing success rate of the ITS2 barcode could be attributed to its incomplete concerted evolution process, as reported in other species [51,52,53].
Basic Local Alignment Search Tool (BLAST) results have been used to identify the genus and facilitate species differentiation. Taxonomic assignments of Physalis accessions through BLASTn analyses against publicly available accessions in the databases did not give reliable results. This was probably because of the limited sequence data, since the available sequences in the databases mostly represent the most well-known and broadly studied species with a larger distribution, and to a lesser extent, species from insufficiently studied regions [54]. Therefore, much more information and richer databases are necessary for the reliable application of the BLAST analysis to the Kenyan Physalis species.
The levels of genetic discrimination of Physalis accessions based on genetic distances differed between the two DNA barcode regions. All rbcL sequences and their reference sequences from the database formed a distinct cluster with no differentiation of species, indicating low levels of genetic differentiation in the Physalis species. The nucleotide data matrix from the rbcL region reflects the close genetic relationships of these species. This indicates the inefficiency of using rbcL in discriminating plant species, and thus we consider this region to offer little information relevant to the taxonomic classification of Physalis. The inefficiency of rbcL in discriminating plant species compared to other barcodes has also been noted in other studies [30,50,55]. Similar results were presented in other studies, where the phylogenetic tree-based method could not effectively identify species of plants based on rbcL sequences [50]. A study that used over 10,000 rbcL sequences from the GenBank to identify plant species also came up with similar conclusions to this study—that rbcL can only discriminate at the genus level [56]. Chloroplast rbcL had higher universality but narrow inter-specific genetic divergence, and its species discrimination power was restricted. It is recommended that when rbcL is used as a first-tier barcode in species discrimination, a supplement barcode is also used as a secondary locus to increase the efficiency of species discrimination due to the limitations of the rbcL barcode [56].
However, the phylogenetic tree constructed based on ITS2 sequences demarcated the Physalis accessions into three distinct clades, with each representing a different Physalis species, namely, P. peruviana, P. cordata and P. purpurea. This could be due to the fact that the ITS2 region possesses high interspecific and low intraspecific divergence [57]. The clades had varying branch lengths, an indication that there was divergence of the ITS2 sequences among the identified Physalis species [58]. The branch lengths of the ITS2 sequences were much longer than those of the rbcL sequences—an indication that the ITS2 gene was more divergent, while the rbcL gene was more conserved among Physalis accessions. This concurs with the results of the genetic diversity studies, which showed a higher divergence among ITS2 as compared to rbcL sequences. The phylogenetic tree also showed longer branch lengths among the P. peruviana species, an indication that the two P. peruviana identified had a high intraspecific divergence. The more divergent the DNA barcode is, the better its ability to provide plant species discrimination among the targeted species [44]. Therefore, comparatively, the ITS2 sequences enabled better Physalis species discrimination based on Bayesian inference.
Higher nucleotide diversity was obtained for ITS2 compared to rbcL, an indication that the rbcL barcode is more conserved than ITS2. Therefore, the ITS2 barcode is useful to the interspecific divergence analysis of the Physalis accessions used in this study, which is also indicated by its ability to discriminate Physalis species. The interspecific divergence analysis of the ITS2 sequences in this study showed the highest nucleotide diversity between P. peruviana and P. cordata and the lowest between P. cordata and P. purpurea. One study postulated that a barcode has to exhibit high interspecific divergence so as to achieve the discrimination of species, especially amongst closely related sister species, while having low intraspecific variation [59]. The current study showed that ITS2 was less conserved and possessed higher interspecific divergence than rbcL, indicating the level of species divergence among Physalis accessions used in this study.
Genetic distance, a measure of the genetic divergence between species or populations within a species [60], was significantly higher for the ITS2 barcode compared to that of rbcL. This is an indication that there is high genetic divergence and variation among Physalis species based on the ITS2 barcode. Based on the genetic distance, ITS2 was able to discriminate Physalis accessions into various species. The highest and lowest intraspecific distances were obtained within the P. purpurea and P. cordata populations, respectively. The low genetic distance for rbcL sequences is also a confirmation that the barcode is highly conserved in Physalis accessions used in this study.
The results of the nucleotide polymorphism analysis for the ITS2 and rbcL sequences concur with those of the nucleotide divergence analysis, where ITS2’s nucleotide diversity was higher than that of rbcL. A higher number of singleton and parsimony mutations in the rbcL gene indicates higher low-frequency mutations, concurring with the Tajima D value confirming the high level of conservation of the rbcL barcode [61,62]. The nucleotide polymorphism of the ITS2 sequences showed fewer low-frequency mutations compared to rbcL, and this explains the higher divergence among ITS2 sequences. The Automatic Barcode Gap Discovery (ABDG) was also able to show the intraspecific divergence between ITS2 and rbcL sequences of Physalis accessions used in this study. The maximum intraspecific distance, Pmax, was much higher at 0.1 for ITS2 than 0.0219 for rbcL. This is an indication that ITS2 is not only more divergent between species, but is also more divergent within species, compared to rbcL, which is highly conserved between and within Physalis species.
An ideal DNA barcode has significantly smaller intraspecific than interspecific distances, with a clear boundary between the two, referred to as the DNA barcoding gap [63], which can help in the identification of species [64]. This study confirmed that rbcL is highly conserved in Physalis plants, as its maximum intraspecific distance based on the automatic barcode gap discovery (ABGD) analysis was Pmax = 0.0129. On the other hand, for the ITS2 marker, the maximum intraspecific distance based on the ABGD analysis was Pmax = 0.1. This confirms that rbcL sequences cannot be used to group the Physalis accessions into species, and were indeed unable to discriminate Physalis species. This has also been reported in studies of other plant species, such as cinnamon, where not only rbcL but also other chloroplast-based barcodes such as matK and the intergenic sequence psbA-trnH were unable to discriminate and identify species of cinnamon [65]. In other studies, matK and psbA-trnH have been shown to have better and higher potential as barcodes for the identification of tropical cloud forest trees than rbcL [50]. However, other studies have shown that rbcL is useful in the species discrimination of yams [66]. This suggests that rbcL species discrimination might differ from one genus of plants to another. The ITS2 sequences of the Physalis plants used in this study recorded high intraspecific divergence, as seen in the ABDG analysis (Pmax = 0.1), probably due to its high variation. The ITS2 sequences were able to discriminate the Physalis accessions into three species, and the barcoding gap could be identified for all the three of these species. Their interspecific distance was much higher than that yielded by the ITS2 marker. The presence of a barcoding gap in different species is also an indication that ITS2 is an ideal candidate barcode for use in the discrimination of Physalis species and the determination of species diversity. A schematic diagram that summarizes the findings of this study is presented in Figure 5.

5. Conclusions

The results regarding sequence characteristics, genetic distance and phylogenetic relationships show that ITS2 is a reliable marker for use in the discrimination of Physalis species, whereby the accessions used were identified and discriminated into three species, namely, P. purpurea, P. peruviana and P. cordata. The ITS2 barcode was found to possess a sufficient variable region between the different species and accessions for the determination of genetic divergence with high discriminatory ability. These results expand our knowledge of genetic relationships that will benefit future crop improvement strategies in the areas of food, nutrition and therapeutics.

Supplementary Materials

The following supporting information can be downloaded at: https://www.mdpi.com/article/10.3390/crops3040027/s1, Table S1: Geographical coordinates and number of Physalis samples collected from seven counties in Kenya; Table S2: Physalis accessions collected from various counties in Kenya; Table S3: Physalis accessions that were successfully amplified and sequenced for the ITS2 gene; Table S4: Physalis accessions that were successfully amplified and sequenced for the rbcL gene; Table S5: BLASTn analysis results for the Physalis accessions based on ITS2 and rbcL sequences; Figure S1: Multiple alignment sequence for ITS2 and rbcL Physalis accessions gene sequence as well as reference sequences; Figure S2: Multiple sequence alignment for 28 Physalis accessions based on ITS2 marker; Figure S3: Multiple sequence alignment for 28 Physalis accessions based on rbcL marker.

Author Contributions

Conceptualization, K.P., K.M., E.K.M., J.M.W. and E.N.N.; methodology, K.P. and E.N.N.; software, K.P.; validation, K.M., E.K.M., J.M.W. and E.N.N.; formal analysis, K.P.; investigation, K.P.; resources, K.M. and E.N.N.; data curation, K.P.; writing—original draft preparation, K.P.; writing—review and editing, K.M., E.K.M., J.M.W. and E.N.N.; supervision, K.M., E.K.M., J.M.W. and E.N.N.; funding acquisition, K.M. and E.N.N. All authors have read and agreed to the published version of the manuscript.

Funding

This research received no external funding.

Data Availability Statement

The nucleotide sequences of ITS2 and rbcL regions for Physalis accessions used in this study were deposited in Genebank through the online submission portal and were assigned the following accession numbers: OQ371996.1 to OQ372029.1 for ITS2 and OQ507153.1 to OQ507201.1 for rbcL.

Acknowledgments

We would like to thank the Department of Biochemistry and Center for Biotechnology and Bioinformatics (CEBIB), University of Nairobi for allowing us to use their research facilities for this work. We would also like to acknowledge Anne Awiti, Pheris Namakwa and Nicholas Kipkorir for their technical assistance. The results reported in this study are part of the PhD work of the first author.

Conflicts of Interest

The authors declare no conflict of interest.

References

  1. Ralte, L.; Singh, Y.T. Use of rbcL and ITS2 for DNA barcoding and identification of Solanaceae plants in hilly state of Mizoram, India. Res. Crops 2021, 22, 616–623. [Google Scholar]
  2. Cháves-Gómez, J.L.; Becerra-Mutis, L.M.; Chávez-Arias, C.C.; Restrepo-Díaz, H.; Gómez-Caro, S. Screening of different Physalis genotypes as potential rootstocks or parents against vascular wilt using physiological markers. Front. Plant Sci. 2020, 11, 806. [Google Scholar] [CrossRef] [PubMed]
  3. Álvarez-Flórez, F.; López-Cristoffanini, C.; Jáuregui, O.; Melgarejo, L.M.; López-Carbonell, M. Changes in ABA, IAA and JA levels during calyx, fruit and leaves development in cape gooseberry plants (Physalis peruviana L.). Plant Physiol. Biochem. 2017, 115, 174–182. [Google Scholar] [CrossRef] [PubMed]
  4. Ordoñez, C.; Ana, Y.; Estrada Mesa, E.M.; Cortés Rodríguez, M. The influence of drying on the physiological quality of cape gooseberry (Physalis peruviana L.) fruits added with active components. Acta Agron. 2017, 66, 512–518. [Google Scholar] [CrossRef]
  5. Ramadan, M.F.; Mörsel, J.T. Oil goldenberry (Physalis peruviana L.). J. Agric. Food Chem. 2003, 51, 969–974. [Google Scholar] [CrossRef]
  6. Zhang, Y.J.; Deng, G.F.; Xu, X.R.; Wu, S.; Li, S.; Li, H.B. Chemical components and bioactivities of Cape gooseberry (Physalis peruviana). Int. J. Food Nutr. Saf. 2013, 3, 15–24. [Google Scholar]
  7. Barirega, A. Potential for value chain improvement and commercialization of cape gooseberry (Physalis peruviana L.) for livelihood improvement in Uganda. Ethnobot. Res. Appl. 2014, 12, 131–140. [Google Scholar]
  8. Afroz, M.; Akter, S.; Ahmed, A.; Rouf, R.; Shilpi, J.A.; Tiralongo, E.; Sarker, S.D.; Göransson, U.; Uddin, S.J. Ethnobotany and antimicrobial peptides from plants of the solanaceae family: An update and future prospects. Front. Pharmacol. 2020, 11, 565. [Google Scholar] [CrossRef]
  9. Puente, L.A.; Pinto-Muñoz, C.A.; Castro, E.S.; Cortés, M. Physalis peruviana Linnaeus, the multiple properties of a highly functional fruit: A review. Food Res. Int. 2011, 44, 1733–1740. [Google Scholar] [CrossRef]
  10. Reddy, C.V.; Sreeramulu, D.; Raghunath, M. Antioxidant activity of fresh and dry fruits commonly consumed in India. Food Res. Int. 2010, 4, 285–288. [Google Scholar] [CrossRef]
  11. Arun, M.; Asha, V.V. Preliminary studies on antihepatotoxic effect of Physalis peruviana Linn. (Solanaceae) against carbon tetrachloride induced acute liver injury in rats. J. Ethnopharmacol. 2007, 111, 110–114. [Google Scholar] [CrossRef]
  12. Zhang, W.N.; Tong, W.Y. Chemical constituents and biological activities of plants from the genus Physalis. Chem. Biodivers. 2016, 13, 48–65. [Google Scholar] [CrossRef]
  13. Abdul-Nasir-Deen, A.Y.; Boakye, Y.D.; Osafo, N.; Agyare, C.; Boamah, D.; Boamah, V.E.; Agyei, E.K. Anti-inflammatory and wound healing properties of methanol leaf extract of Physalis angulata L. S. Afr. J. Bot. 2020, 133, 124–131. [Google Scholar] [CrossRef]
  14. Franco, L.A.; Matiz, G.E.; Calle, J.; Pinzón, R.; Ospina, L.F. Antiinflammatory activity of extracts and fractions obtained from Physalis peruviana L. calyces. Biomedica 2007, 27, 110–115. [Google Scholar] [CrossRef]
  15. Wu, S.J.; Tsai, J.Y.; Chang, S.P.; Lin, D.L.; Wang, S.S.; Huang, S.N.; Ng, L.T. Supercritical carbon dioxide extract exhibits enhanced antioxidant and anti-inflammatory activities of Physalis peruviana. J. Ethnopharmacol. 2006, 108, 407–413. [Google Scholar] [CrossRef]
  16. Pinto, M.D.; Ranilla, L.G.; Apostolidis, E.; Lajolo, F.M.; Genovese, M.I.; Shetty, K. Evaluation of antihyperglycemia and antihypertension potential of native Peruvian fruits using in vitro models. J. Med. Food. 2009, 12, 278–291. [Google Scholar] [CrossRef]
  17. Lan, Y.H.; Chang, F.R.; Pan, M.J.; Wu, C.C.; Wu, S.J.; Chen, S.L.; Wang, S.S.; Wu, M.J.; Wu, Y.C. New cytotoxic withanolides from Physalis peruviana. Food Chem. 2009, 116, 462–469. [Google Scholar] [CrossRef]
  18. Shenstone, E.; Lippman, Z.; Van Eck, J. A review of nutritional properties and health benefits of Physalis species. Plant Foods Hum. Nutr. 2020, 75, 316–325. [Google Scholar] [CrossRef]
  19. Feng, S.; Jiang, M.; Shi, Y.; Jiao, K.; Shen, C.; Lu, J.; Ying, Q.; Wang, H. Application of the ribosomal DNA ITS2 region of Physalis (Solanaceae): DNA barcoding and phylogenetic study. Front. Plant Sci. 2016, 7, 1047. [Google Scholar] [CrossRef]
  20. Menzel, M.Y. The cytotaxonomy and genetics of Physalis. Proc. Am. Philos. Soc. 1951, 95, 132–183. [Google Scholar]
  21. Vargas-Ponce, O.; Pérez-Álvarez, L.F.; Zamora-Tavares, P.; Rodríguez, A. Assessing genetic diversity in Mexican husk tomato species. Plant Mol. Biol. Rep. 2011, 29, 733–738. [Google Scholar] [CrossRef]
  22. Feng, S.; Jiao, K.; Zhu, Y.; Wang, H.; Jiang, M.; Wang, H. Molecular identification of species of Physalis (Solanaceae) using a candidate DNA barcode: The chloroplast psbA–trnH intergenic region. Genome 2018, 61, 15–20. [Google Scholar] [CrossRef] [PubMed]
  23. Yu, J.; Wu, X.I.; Liu, C.; Newmaster, S.; Ragupathy, S.; Kress, W.J. Progress in the use of DNA barcodes in the identification and classification of medicinal plants. Ecotoxicol. Environ. Saf. 2021, 208, 111691. [Google Scholar] [CrossRef] [PubMed]
  24. Schindel, D.E.; Miller, S.E. DNA barcoding a useful tool for taxonomists. Nature 2005, 435, 17. [Google Scholar] [CrossRef]
  25. Qian, Z.H.; Munywoki, J.M.; Wang, Q.F.; Malombe, I.; Li, Z.Z.; Chen, J.M. Molecular Identification of African Nymphaea Species (Water Lily) Based on ITS, trnT-trnF and rpl16. Plants 2022, 11, 2431. [Google Scholar] [CrossRef]
  26. Saddhe, A.A.; Kumar, K. DNA barcoding of plants: Selection of core markers for taxonomic groups. Plant Sci. Today 2018, 5, 9–13. [Google Scholar] [CrossRef]
  27. Kress, W.J. Plant DNA barcodes: Applications today and in the future. J. Syst. Evol. 2017, 55, 291–307. [Google Scholar] [CrossRef]
  28. Dormontt, E.E.; Van Dijk, K.J.; Bell, K.L.; Biffin, E.; Breed, M.F.; Byrne, M.; Caddy-Retalic, S.; Encinas-Viso, F.; Nevill, P.G.; Shapcott, A.; et al. Advancing DNA barcoding and metabarcoding applications for plants requires systematic analysis of herbarium collections—An Australian perspective. Front. Ecol. Evol. 2018, 6, 134. [Google Scholar] [CrossRef]
  29. Li, H.; Xiao, W.; Tong, T.; Li, Y.; Zhang, M.; Lin, X.; Zou, X.; Wu, Q.; Guo, X. The specific DNA barcodes based on chloroplast genes for species identification of Orchidaceae plants. Sci. Rep. 2021, 11, 1424. [Google Scholar] [CrossRef]
  30. Kang, Y.; Deng, Z.; Zang, R.; Long, W. DNA barcoding analysis and phylogenetic relationships of tree species in tropical cloud forests. Sci. Rep. 2017, 7, 12564. [Google Scholar] [CrossRef]
  31. Nurhasanah; Sundari; Papuangan, N. Amplification and analysis of Rbcl gene (Ribulose-1, 5-Bisphosphate Carboxylase) of clove in Ternate Island. IOP Conf. Ser. Earth Environ. 2019, 276, 12061. [Google Scholar] [CrossRef]
  32. Manzara, T.; Gruissem, W. Organization and expression of the genes encoding ribulose-1, 5-bisphosphate carboxylase in higher plants. Mol. Biol. Photosyn. 1988, 621–643. [Google Scholar] [CrossRef]
  33. CBOL Plant Working Group 1; Hollingsworth, P.M.; Forrest, L.L.; Spouge, J.L.; Hajibabaei, M.; Ratnasingham, S.; van der Bank, M.; Chase, M.W.; Cowan, R.S.; Erickson, D.L.; et al. A DNA barcode for land plants. PNAS 2009, 106, 12794–12797. [Google Scholar]
  34. Dellaporta, S.L.; Wood, J.; Hicks, J.B. A plant DNA mini-preparation: Version II. Plant Mol. Biol. Rep. 1983, 1, 19–21. [Google Scholar] [CrossRef]
  35. Yao, H.; Song, J.; Liu, C.; Luo, K.; Han, J.; Li, Y.; Pang, X.; Xu, H.; Zhu, Y.; Xiao, P.; et al. Use of ITS2 region as the universal DNA barcode for plants and animals. PLoS ONE 2010, 5, e13102. [Google Scholar] [CrossRef] [PubMed]
  36. Lledo, M.D.; Crespo, M.B.; Cameron, K.M.; Fay, M.F.; Chase, M.W. Systematics of Plumbaginaceae based upon cladistic analysis of rbcL sequence data. Syst. Bot. 1998, 23, 21–29. [Google Scholar] [CrossRef]
  37. Hall, T.A. BioEdit: A user-friendly biological sequence alignment editor and analysis program for Windows 95/98/NT. Nucleic Acids Symp. Ser. 1999, 41, 95–98. [Google Scholar]
  38. Edgar, R.C. MUSCLE: Multiple sequence alignment with high accuracy and high throughput. Nucleic Acids Res. 2004, 32, 1792–1797. [Google Scholar] [CrossRef]
  39. Robert, X.; Gouet, P. Deciphering key features in protein structures with the new ENDscript server. Nucleic Acids Res. 2014, 42, 20–24. [Google Scholar] [CrossRef]
  40. Ronquist, F.; Huelsenbeck, J.P. MrBayes 3: Bayesian phylogenetic inference under mixed models. Bioinformatics 2003, 19, 1572–1574. [Google Scholar] [CrossRef]
  41. Ronquist, F.; Teslenko, M.; Van Der Mark, P.; Ayres, D.L.; Darling, A.; Höhna, S.; Larget, B.; Liu, L.; Suchard, M.A.; Huelsenbeck, J.P. MrBayes 3.2: Efficient Bayesian phylogenetic inference and model choice across a large model space. Syst. Biol. 2012, 61, 539–542. [Google Scholar] [CrossRef] [PubMed]
  42. Huelsenbeck, J.P.; Ronquist, F. MRBAYES: Bayesian inference of phylogenetic trees. Bioinformatics 2001, 17, 754–755. [Google Scholar] [CrossRef] [PubMed]
  43. Nascimento, F.F.; dos Reis, M.; Yang, Z. A biologist’s guide to Bayesian phylogenetic analysis. Nat. Ecol. Evol. 2017, 1, 1446–1454. [Google Scholar] [CrossRef] [PubMed]
  44. Kartavtsev, Y.P. Divergence at Cyt-b and Co-1 mtDNA genes on different taxonomic levels and genetics of speciation in animals. Mitochondrial DNA 2011, 22, 55–65. [Google Scholar] [CrossRef]
  45. Kumar, S.; Stecher, G.; Li, M.; Knyaz, C.; Tamura, K. MEGA X: Molecular evolutionary genetics analysis across computing platforms. Mol. Biol. Evol. 2018, 35, 1547. [Google Scholar] [CrossRef]
  46. Tajima, F. The effect of change in population size on DNA polymorphism. Genetics 1989, 123, 597–601. [Google Scholar] [CrossRef]
  47. Tamura, K.; Stecher, G.; Kumar, S. MEGA11: Molecular evolutionary genetics analysis version 11. Mol. Biol. Evol. 2021, 38, 3022–3027. [Google Scholar] [CrossRef]
  48. Puillandre, N.; Lambert, A.; Brouillet, S.; Achaz, G.J. ABGD, Automatic Barcode Gap Discovery for primary species delimitation. Mol. Ecol. 2012, 21, 1864–1877. [Google Scholar] [CrossRef]
  49. Medina-Medrano, J.R.; Almaraz-Abarca, N.; González-Elizondo, M.S.; Uribe-Soto, J.N.; González-Valdez, L.S.; Herrera-Arrieta, Y. Phenolic constituents and antioxidant properties of five wild species of Physalis (Solanaceae). Bot. Stud. 2015, 56, 24. [Google Scholar] [CrossRef]
  50. Huang, X.C.; Ci, X.Q.; Conran, J.G.; Li, J. Application of DNA barcodes in Asian tropical trees–a case study from Xishuangbanna Nature Reserve, Southwest China. PLoS ONE 2015, 10, e129295. [Google Scholar] [CrossRef]
  51. Simeone, M.C.; Piredda, R.; Papini, A.; Vessella, F.; Schirone, B. Application of plastid and nuclear markers to DNA barcoding of Euro-Mediterranean oaks (Quercus, Fagaceae): Problems, prospects and phylogenetic implications. Bot. J. Linn. Soc. 2013, 172, 478–499. [Google Scholar] [CrossRef]
  52. Denk, T.; Grimm, G.W. The oaks of western Eurasia: Traditional classifications and evidence from two nuclear markers. Taxon 2010, 59, 351–366. [Google Scholar] [CrossRef]
  53. Abeysinghe, P.D.; Wijesinghe, K.G.; Tachida, H.; Yoshda, T.; Thihagoda, M. Molecular characterization of Cinnamon (Cinnamomum verum Presl) accessions and evaluation of genetic relatedness of Cinnamon species in Sri Lanka based on trnL intron region, intergenic spacers between trnT-trnL, trnL-trnF, trnH-psbA and nuclear ITS. J. Agric. Biol. Sci. 2009, 5, 1079–1088. [Google Scholar]
  54. Ross, H.A.; Murugan, S.; Sibon Li, W.L. Testing the reliability of genetic methods of species identification via simulation. Syst. Biol. 2008, 57, 216–230. [Google Scholar] [CrossRef]
  55. Tripathi, A.M.; Tyagi, A.; Kumar, A.; Singh, A.; Singh, S.; Chaudhary, L.B.; Roy, S. The internal transcribed spacer (ITS) region and trnhH-psbA are suitable candidate loci for DNA barcoding of tropical tree species of India. PLoS ONE 2013, 8, e57934. [Google Scholar] [CrossRef]
  56. Newmaster, S.G.; Fazekas, A.J.; Ragupathy, S.D. DNA barcoding in land plants: Evaluation of rbcL in a multigene tiered approach. Botany 2006, 84, 335–341. [Google Scholar] [CrossRef]
  57. Chen, S.; Yao, H.; Han, J.; Liu, C.; Song, J.; Shi, L.; Zhu, Y.; Ma, X.; Gao, T.; Pang, X.; et al. Validation of the ITS2 region as a novel DNA barcode for identifying medicinal plant species. PLoS ONE 2010, 5, e8613. [Google Scholar] [CrossRef]
  58. Binet, M.; Gascuel, O.; Scornavacca, C.; P Douzery, E.J.; Pardi, F. Fast and accurate branch lengths estimation for phylogenomic trees. BMC Bioinform. 2016, 17, 1–24. [Google Scholar] [CrossRef] [PubMed]
  59. Rach, J.; DeSalle, R.; Sarkar, I.N.; Schierwater, B.; Hadrys, H. Character-based DNA barcoding allows discrimination of genera, species and populations in Odonata. Proc. Royal Soc. B-Biol. Sci. 2008, 275, 237–247. [Google Scholar] [CrossRef] [PubMed]
  60. Beaumont, M.A.; Ibrahim, K.M.; Boursot, P.; Bruford, M.W. Measuring genetic distance. In Molecular Tools for Screening Biodiversity: Plants and Animals; Springer Science & Business Media: Berlin/Heidelberg, Germany, 1998; pp. 315–325. [Google Scholar]
  61. Carlson, C.S.; Thomas, D.J.; Eberle, M.A.; Swanson, J.E.; Livingston, R.J.; Rieder, M.J.; Nickerson, D.A. Genomic regions exhibiting positive selection identified from dense genotype data. Genome Res. 2005, 15, 1553–1565. [Google Scholar] [CrossRef]
  62. Tajima, F. Statistical method for testing the neutral mutation hypothesis by DNA polymorphism. Genetics 1989, 123, 585–595. [Google Scholar] [CrossRef] [PubMed]
  63. Meyer, C.P.; Paulay, G. DNA barcoding: Error rates based on comprehensive sampling. PLoS Biol. 2005, 3, e422. [Google Scholar] [CrossRef] [PubMed]
  64. Ge, Y.; Xia, C.; Wang, J.; Zhang, X.; Ma, X.; Zhou, Q. The efficacy of DNA barcoding in the classification, genetic differentiation, and biodiversity assessment of benthic macro-invertebrates. Ecol. Evol. 2021, 11, 5669–5681. [Google Scholar] [CrossRef]
  65. Chandrasekara, C.B.; Naranpanawa, D.N.; Bandusekara, B.S.; Pushpakumara, D.K.; Wijesundera, D.S.; Bandaranayake, P.C. Universal barcoding regions, rbc L, mat K and trn H-psb A do not discriminate Cinnamomum species in Sri Lanka. PLoS ONE 2021, 16, e245592. [Google Scholar] [CrossRef]
  66. Kipkiror, N.; Muge, E.K.; Ochieno, D.M.; Nyaboga, E.N. DNA barcoding markers provide insight into species discrimination, genetic diversity and phylogenetic relationships of yam (Dioscorea spp.). Biologia 2023, 78, 689–705. [Google Scholar] [CrossRef]
Figure 1. The locations of Physalis sampling sites in seven counties of Kenya. The spatial distribution of the Physalis species discriminated based on ITS2 barcoding is also indicated on the map.
Crops 03 00027 g001
Figure 2. Plant morphology of Physalis species ((A) Physalis purpurea—OQ372009.1; (B) Physalis microcarpa—OQ372018.1; (C) Physalis purpurea—OQ372013.1; (D) Physalis purpurea—OQ372019.1; (E) Physalis purpurea—OQ372020.1 and (F) Physalis cordata—OQ372012.1) in their natural habits. The Physalis species were discriminated based on their ITS2 barcode sequence.
Crops 03 00027 g002
Figure 3. Consensus MrBayes phylogenetic tree for Physalis accessions based on a combination of ITS2 and rbcL DNA barcodes. Black represents different Physalis species reference sequences retrieved from GenBank after BLASTn analysis, green represents Physalis cordata, plum represents Physalis peruviana, blue represents Physalis purpurea, teal represents Physalis virginiana, purple represents Physalis angulata and orange represents Physalis minima. Numbers above branches indicate the posterior probability percentage statistic for the MrBayes phylogenetic tree.
Crops 03 00027 g003
Figure 4. Histogram for the hypothetical distribution of pairwise differences of ITS2 (A) and rbcL (B) gene sequences for twenty-eight Physalis accessions. Low divergence is presumably intraspecific divergence, whereas higher divergence indicates interspecific divergence. The abbreviation nbr on the y-axis of the histogram stands for number of pairwise comparisons.
Crops 03 00027 g004
Figure 5. A flow chart showing a summary of the findings related to Physalis species discrimination and genetic diversity analysis based on ITS2 and rbcL barcodes.
Crops 03 00027 g005
Table 1. Efficiency of PCR amplification and sequencing for Physalis accessions for ITS2 and rbcL barcodes.
Barcode RegionSamples Tested (n)Number of Amplicons ProducedNumber of Sequences ProducedPercentage of Amplification Efficiency Percentage of Sequencing Efficiency Alignment Length (bp)Mean Sequence Length (bp)Mean GC Content (%)
ITS2644932776584152561.00
rbcL645448848984169043.40
Table 2. The nucleotide base frequencies of candidate nucleotide sequences at different coding positions in Physalis accessions.
Barcode LocusBase Contents (%)
ATGCATGC
ITS219.4219.3929.7831.4139.0061.00
rbcL28.2228.4023.1020.2856.5843.42
Table 3. DNA divergence between (interspecific) Physalis species populations based on ITS2 sequences.
PopulationP.
peruviana (P1)
P. cordata (P2)P. peruviana (P1)P.
purpurea (P2)
P.
purpurea (P1)
P. cordata (P2)
Polymorphic sites in each population1421121824
Total number of polymorphic sites35234
Average number of nucleotide differences17.6006.3510.889
Nucleotide diversity Pi (t)0.332080.181470.14821
Number of fixed differences610
Polymorphic mutations in population 1 (P1) but monomorphic ones in population 2 (P2)13102
Polymorphic mutations in P2 but monomorphic ones in P128221
Shared mutations122
Average number of nucleotide differences between populations20.62510.1581.477
Average nucleotide substitution per site between populations (Dxy)0.389150.290260.24621
Number of net nucleotide substitutions per site between populations (Da)0.123430.038810.01299
Table 4. Polymorphism and divergence within (intraspecific) Physalis species based on ITS2 sequences.
Physalis SpeciesP. peruvianaP. cordataP. purpurea
Total number of sequences2422
Number of polymorphic (segregating) sites (S)708320
Nucleotide diversity Pi (Total)0.312500.180950.14898
Nucleotide diversity Pi (JC-Total)0.404250.207080.16609
Theta (Total)0.312500.196750.17396
Total number of substitutions7010126
Table 5. Mean genetic distance between (interspecific) Physalis species based on ITS2 sequences.
GroupsP. purpureaP. peruvianaP. cordata
P. purpurea 198.921589.41
P. peruviana9.58 357.92
P. cordata21.999.53
Table 6. DNA polymorphism of Physalis accessions based on ITS2 and rbcL sequences.
ITS2rbcL
Polymorphic Sites/Segregation Sites (S)4Position in the GeneVariants59Positions in the GeneVariants
Singleton1177248141,272,273,276,280,283,284,293,298,
301,308,309,310,322,325,327,331,334,
335,337,339,340,345,346,347,348,350,
353,357,365,366,373,375,376,386,395,
396,398,413,414,416,419,436,441,447,
457

344,359
2


3
Parsimony informative sites3179

176
178
2

3
4
11302,336,341,355,358,362,401,430,444

282,363
2

3
Nucleotide diversity (Pi)0.159170.01632
Average number of nucleotide differences (k)0.9555.844
Sequence length (base pairs)532716
Number of sequences2828
Disclaimer/Publisher’s Note: The statements, opinions and data contained in all publications are solely those of the individual author(s) and contributor(s) and not of MDPI and/or the editor(s). MDPI and/or the editor(s) disclaim responsibility for any injury to people or property resulting from any ideas, methods, instructions or products referred to in the content.

