Article

Fraction of Genome Altered, Age, Microsatellite Instability Score, Tumor Mutational Burden, Cancer Type, Metastasis Status, and Choice of Cancer Therapy Predict Overall Survival in Multiple Machine Learning Models

by
Guillaume Mestrallet
Division of Hematology and Oncology, Hess Center for Science & Medicine, Tisch Cancer Institute, Icahn School of Medicine at Mount Sinai, New York, NY 10029, USA
Submission received: 15 January 2025 / Revised: 6 February 2025 / Accepted: 11 February 2025 / Published: 13 February 2025

Simple Summary

We developed machine learning models to predict overall survival (OS) in cancer patients using clinical and mutational data from 25,508 individuals. Key features included tumor mutational burden (TMB), microsatellite instability (MSI), fraction of genome altered (FGA), copy number alterations (CNA), age, sex, race, cancer type, and metastasis status. Using Random Forest, Gradient Boosting, and Ensemble models, we achieved 74% accuracy for OS classification and a C-Index of 0.76 with a Random Survival Forest. Major predictors of OS were FGA, age, MSI score, TMB, cancer type, and metastasis status. We further analyzed treatment data from 16,603 patients, finding that therapies like platinum, carboplatin, and taxanes impacted survival predictions, while some regimens had a minimal effect. Our study demonstrates the potential of machine learning in OS prediction, integrating clinical and genomic data to enhance patient outcomes, with further validation needed for clinical implementation.

Abstract

Background/Objectives: The accurate prediction of overall survival (OS) in cancer patients is crucial for personalized treatment strategies. Methods: In this study, we developed machine learning models to predict OS by integrating clinical and mutational features from a cohort of 25,508 cancer patients. Key features included tumor mutational burden (TMB), microsatellite instability (MSI), fraction of genome altered (FGA), copy number alterations (CNA), age, sex, race, cancer type, and metastasis status. Results: We applied multiple Random Forest, Gradient Boosting, and Ensemble models, achieving an accuracy of 74% for overall survival status, and a C-Index of 0.76 using the Random Survival Forest model. Importantly, FGA, age, MSI score, TMB, cancer type, and metastasis status were identified as major predictors of OS across all models. We also integrated treatment data from 16,603 patients, demonstrating that therapies like platinum, carboplatin, and taxanes are associated with differences in survival predictions, with some therapeutic regimens showing minimal impact. Conclusions: Our findings highlight the potential of using machine learning to predict OS by incorporating both clinical and mutational features. These models offer a promising approach for improving patient outcomes and could be further validated in prospective studies for clinical use.

1. Introduction

Cancer remains one of the leading causes of mortality worldwide, with diverse tumor types, molecular subtypes, and treatment responses making it challenging to predict patient outcomes. Despite significant advances in cancer treatment and diagnosis, the ability to predict overall survival (OS) and identify optimal therapeutic strategies for individual patients remains limited [1,2,3,4,5,6,7,8]. Clinical features, mutational profiles, and other molecular characteristics have been shown to correlate with cancer prognosis, but integrating these data into predictive models capable of guiding personalized treatment decisions has been an ongoing challenge.
Recent advances in high-throughput sequencing technologies, coupled with the growing availability of large-scale genomic and clinical datasets, have opened up new avenues for predicting patient outcomes. In particular, tumor mutational burden (TMB), microsatellite instability (MSI), copy number alterations (CNA), and fraction of the genome altered (FGA) are emerging as key biomarkers in cancer prognosis [9]. However, the potential of these biomarkers to predict survival across diverse tumor types, and how they interact with clinical variables such as age, sex, and race, remains underexplored.
The rapid progress of artificial intelligence (AI) in healthcare has further opened new avenues for improving patient care and clinical decision-making. AI-based methods such as machine learning and deep learning have been employed across a wide range of healthcare applications, including image analysis, diagnostics, and personalized treatment strategies. For example, AI has been used to develop tools for early cancer detection through radiographic imaging [10], to predict disease progression in chronic conditions [11], and to identify biomarkers for various diseases [5,12,13]. In oncology, AI models have shown promise in analyzing genomic and clinical data to predict treatment outcomes, providing physicians with decision-support tools for personalized therapies [1,2,3,7,8]. These advancements in AI are not only revolutionizing the way healthcare providers approach patient care but also advancing the precision of predictive models, particularly in cancer prognosis.
In this study, we leverage a cohort of 25,508 cancer patients and apply state-of-the-art machine learning algorithms, including Random Forest, Gradient Boosting, and Ensemble models, to identify features associated with OS. We focus on integrating both clinical and mutational features to build predictive models capable of forecasting survival outcomes. By training models on these factors, we aim to uncover important prognostic markers and provide a framework for predicting OS. Additionally, we explore the impact of treatment-related data on the prediction of survival outcomes. Our approach aims to provide novel insights into cancer prognosis based on molecular and clinical data.

2. Methods

2.1. Patient Data

This study analyzed data from solid tumor samples collected from 25,508 patients at Memorial Sloan Kettering Cancer Center between 18 November 2013 and 6 January 2020, which were included in the AACR Project Genomics Evidence Neoplasia Information Exchange (GENIE) 9.0-public database (AACR Project GENIE Consortium, 2017) [14]. All patient data are openly available on cBioPortal website (https://www.cbioportal.org/study/summary?id=msk_met_2021 (accessed on 1 January 2025), https://www.cbioportal.org/study/summary?id=msk_ch_2020) (accessed on 1 January 2025) and were reported and analyzed in original studies [14,15]. According to these authors, tumors were profiled using the MSK-IMPACT assay, a next-generation sequencing platform based on hybridization capture. Tumor types were classified according to unique categories as well as further specific details. Samples that met the following exclusion criteria were not considered: absence of matched normal tissue; sequencing coverage below 100×; insufficient tumor purity; pediatric patients; patients with more than one unique tumor type sequenced; cancers of unknown origin; rare metastases; missing molecular subtype data for breast cancer; and tumor types with insufficient sample sizes. For each patient, one sample was selected based on the following priority order: a FACETS fit that passed quality control, followed by the highest purity, highest sample coverage, and most recent gene panel. A total of 25,508 samples across 50 tumor types were used in the analysis.
These samples were sequenced using the MSK-IMPACT panel, which includes at least 341 genes. We selected mutations shared by at least 5 patients. Genomic and clinical analysis was performed by the authors of the original study [14]. TMB for each sample was calculated by dividing the total number of nonsynonymous mutations by the total number of sequenced bases. The fraction of the genome altered (FGA) was determined by calculating the percentage of the genome with absolute log2 copy ratios greater than 0.2. Clinical data were obtained from the institutional electronic health records (EHR) databased on 5 November 2020. Information on metastatic events was extracted from the pathology reports of the sequenced samples as well as the patients’ EHR. The anatomical location of the samples was described in the pathology reports by the pathologists using free-text descriptions. The EHR contains International Classification of Diseases (ICD) billing codes, which categorize a wide range of diseases, disorders, injuries, and other health conditions, including metastatic events. These metastatic events from the pathology reports and ICD billing codes in the EHR were systematically aligned with a curated list of 21 organs. Overall survival (OS) was measured from the time of sequencing to death and was censored at the last time the patient was known to be alive, with OS status defined as a binary variable (0 for living, 1 for deceased).

2.2. Statistics

Cancer patient features associated with an increased or decreased hazard ratio were identified using Cox regression, and features associated with longer or shorter overall survival were identified using Pearson and Spearman correlations. Features include clinical variables, mutations shared by at least 5 patients, structural variants, and copy number alterations. N = 25,508 patients.

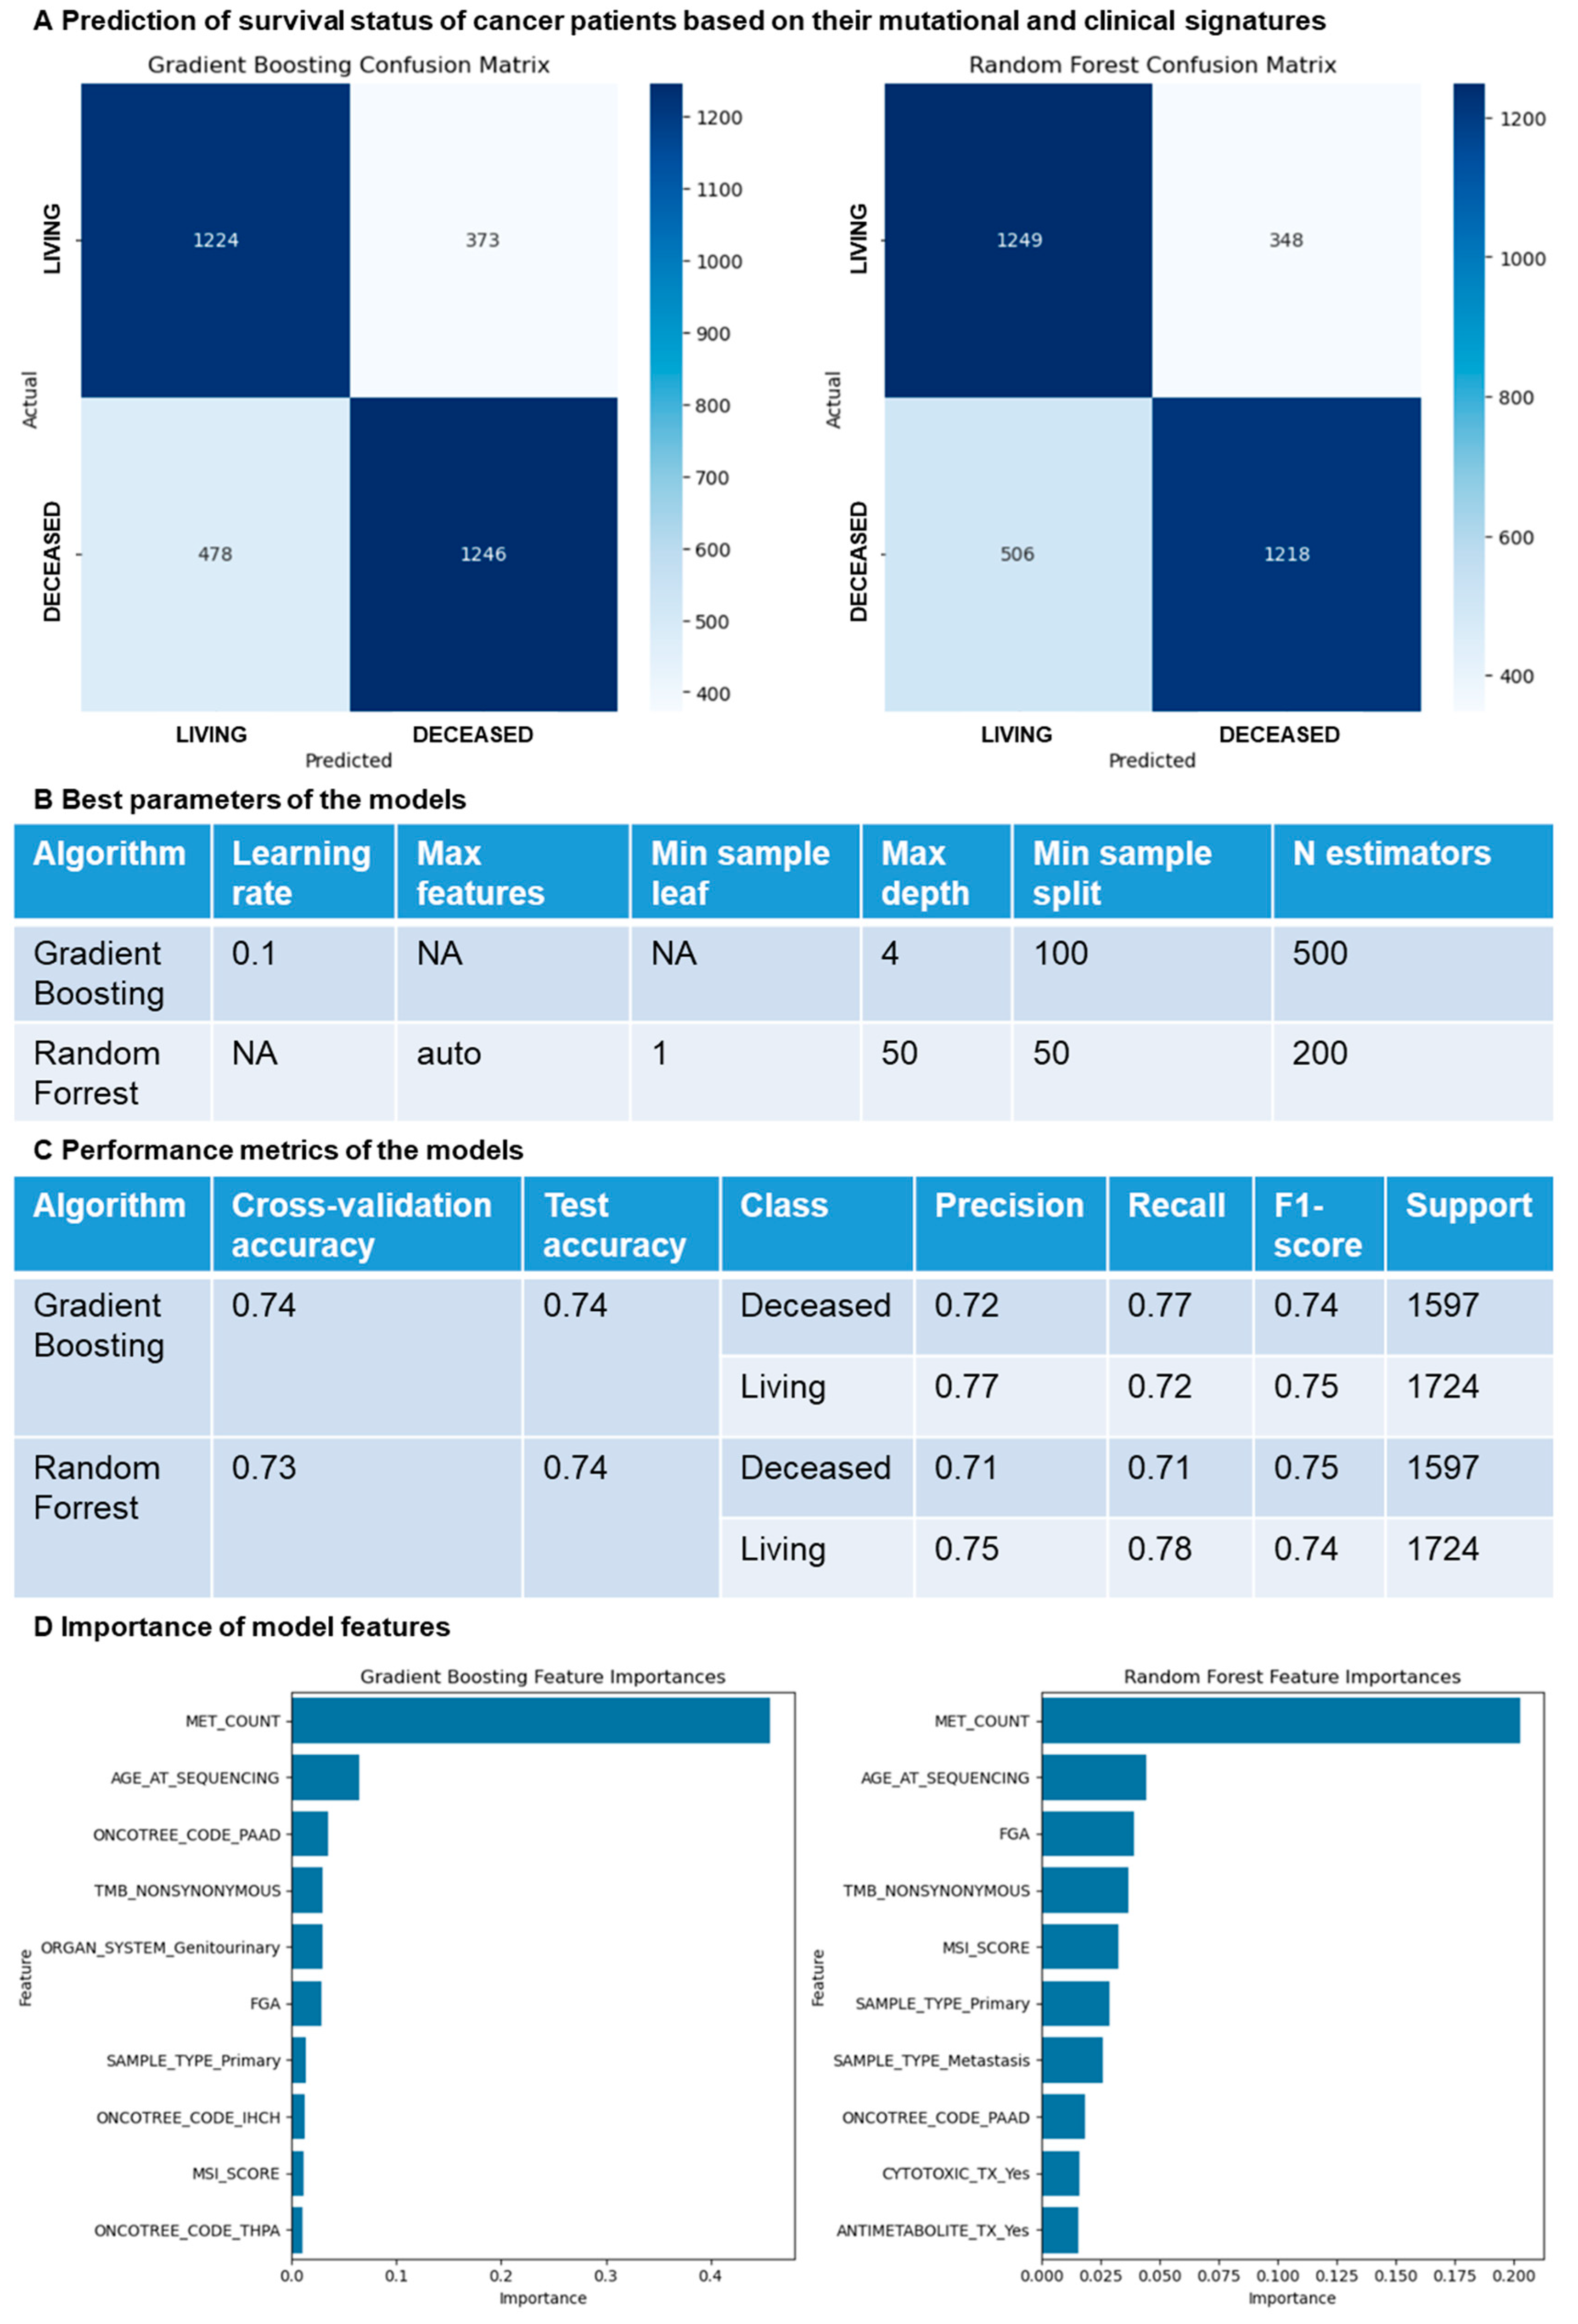
2.3. Machine Learning Models

To predict cancer patient overall survival, we trained multiple machine learning models using a range of clinical and mutational features identified as associated with survival in the previous analyses (Figure 1). These features included clinical variables such as age; sex; race; cancer type; metastasis status; as well as mutational and genomic characteristics like fraction of genome altered (FGA), tumor mutational burden (TMB), microsatellite instability (MSI) score, and copy number alterations.
We employed multiple machine learning algorithms to build predictive models: Random Forest, Gradient Boosting, and Ensemble models. For the classification of overall status (alive vs. deceased), we treated this as a binary classification problem, where the target variable is categorical. The models were trained to predict the binary outcome of whether a patient is alive or deceased. Performance was assessed using classification metrics such as accuracy, precision, recall, and F1-scores. Finally, to combine both overall survival status and in months predictions, we used a Random Survival Forest model.
Each model was trained using the aforementioned features, and performance was assessed using 5-fold cross-validation. During training, we optimized the model parameters to improve accuracy and reduce overfitting. For Random Forest, hyperparameters were tuned to determine the optimal number of estimators, maximum depth of trees, and minimum samples required for splits. Gradient Boosting models were similarly optimized by adjusting the learning rate, maximum depth of trees, and number of estimators. The Ensemble model was constructed by combining the predictions of the Random Forest and Gradient Boosting models, aiming to leverage the strengths of each. We evaluated model performance using various metrics, including Concordance Index (C-Index), accuracy, precision, recall, and F1-scores for predicting deceased and living patients. To further interpret the models and identify key drivers of survival predictions, we calculated feature importances.
We expanded our models to incorporate treatment data from the MSK MetTropism cohort and the Cancer Therapy and Clonal Hematopoiesis cohort, which included treatment information for 16,603 patients. Using the same machine learning models (Random Forest, Gradient Boosting, and Ensemble), we incorporated treatment variables such as platinum, carboplatin, or taxane therapy, along with the previously identified clinical and mutational features. Models were also trained with 5-fold cross-validation and hyperparameter optimization.

3. Results

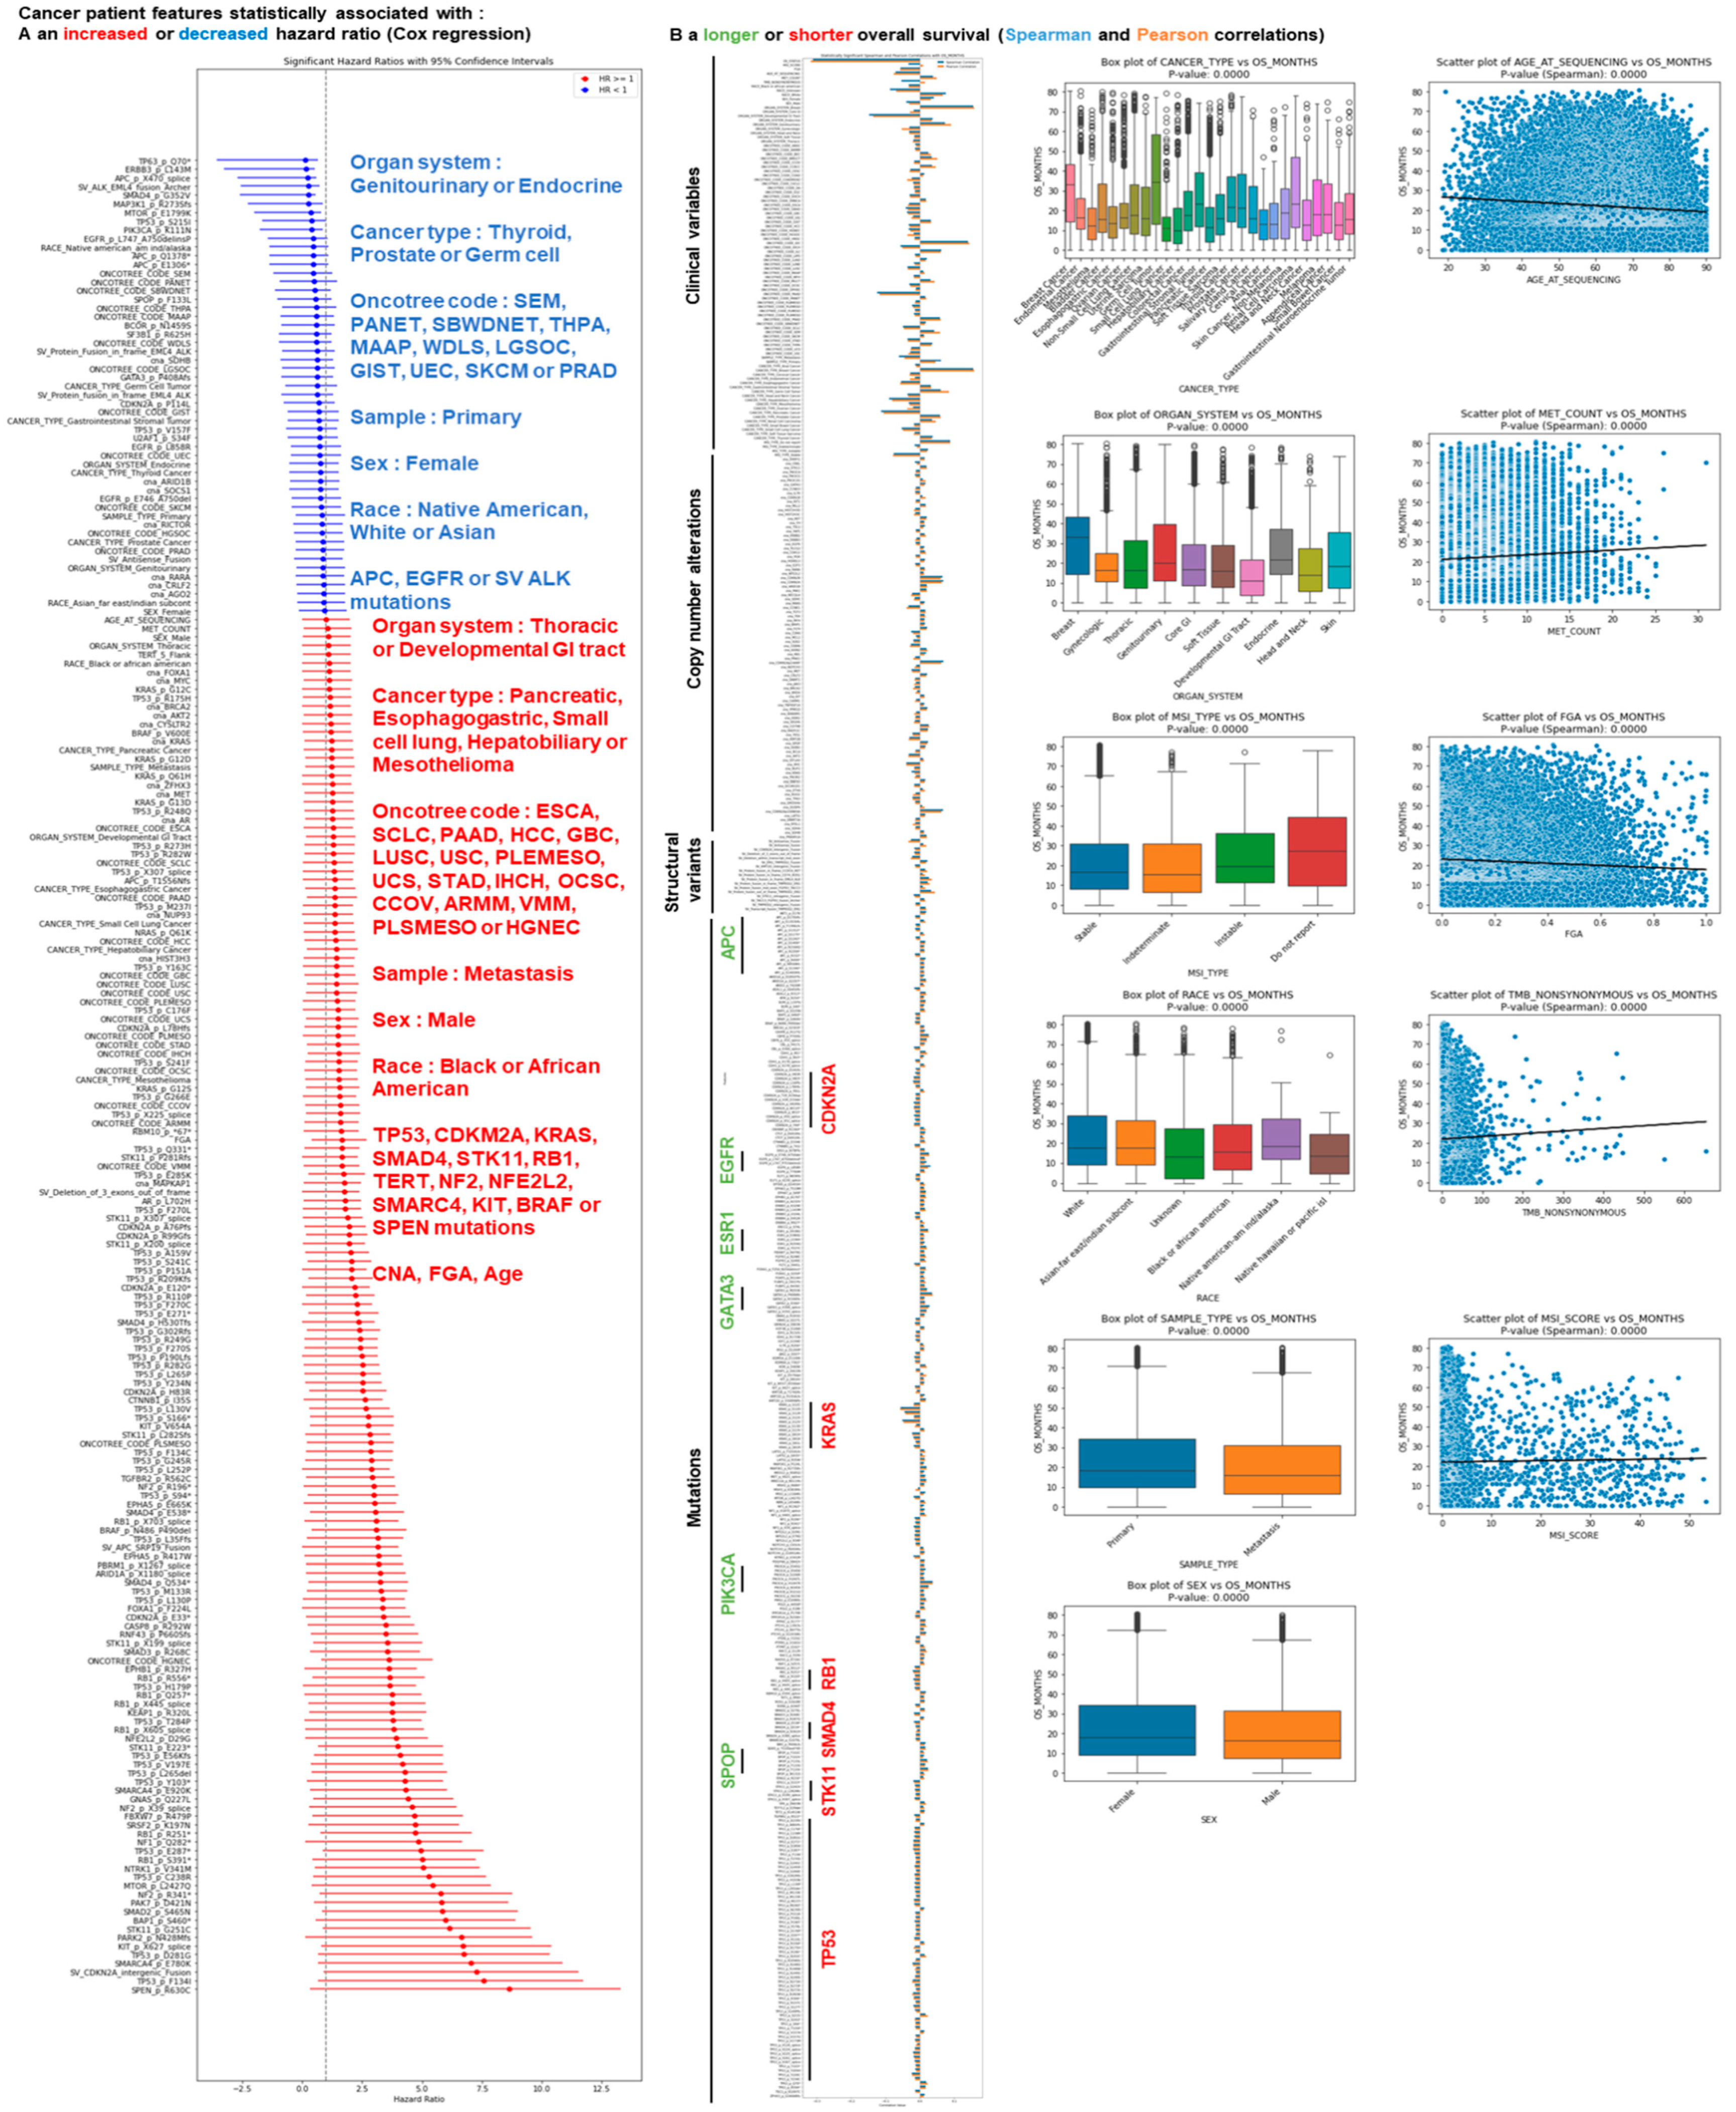
3.1. Identification of Cancer Patient Mutations Associated with a Difference in Survival

We investigated which mutational cancer patient features are associated with a difference in survival in a cohort of 25,508 patients. First, we looked at cancer patient mutations associated with an increased or decreased hazard ratio (Cox regression). Lower hazard ratios were observed in the presence of APC, EGFR, or structural variant ALK mutations, whereas increased hazard ratios were observed in presence of TP53, CDKN2A, KRAS, SMAD4, STK11, RB1, TERT, NF2, NFE2L2, SMARC4, KIT, BRAF, or SPEN mutations (Figure 1A). Moreover, elevated CNA and FGA were also associated with increased risk (Figure 1A). Similar observations were noticed when looking at cancer patient features associated with longer or shorter overall survival with Pearson and Spearman correlations (Figure 1B). Overall, APC, EGFR, or structural variant ALK mutations were associated with decreased risk, while elevated CNA and FGA scores, and mutations in TP53, CDKN2A, KRAS, SMAD4, STK11, RB1, TERT, NF2, NFE2L2, SMARC4, KIT, BRAF, or SPEN genes, were associated with increased risk.

3.2. Identification of Cancer Patient Clinical Features Associated with a Difference in Survival

Next, we investigated which clinical cancer patient features are associated with a difference in survival. First, we looked at cancer patient clinical features associated with an increased or decreased hazard ratio (Cox regression). Being a female; being identified as Native American, White or Asian; and having a primary sample were also associated with a lower risk, while being a male, being identified as Black or African American, and having a metastasis sample were associated with an elevated risk (Figure 1A). Finally, elevated age was also associated with increased risk (Figure 1A). Similar observations were noticed when looking at cancer patient features associated with longer or shorter overall survival with Pearson and Spearman correlations (Figure 1B).

3.3. Identification of Cancer Types Associated with a Difference in Survival

Finally, we investigated which cancer types are associated with a difference in survival by looking at increased or decreased hazard ratios (Cox regression). Having a thyroid, prostate, or germ cell cancer; a cancer in the genitourinary or endocrine organ system; or a SEM, PANET, SBWDNET, THPA, MAAP, WDLS, LGSOC, GIST, UEC, SKCM, or PRAD oncotree code were associated with lower risk, while having a pancreatic, esophagogastric, small cell lung, hepatobiliary, or mesothelioma cancer; a cancer in the thoracic or developmental GI tract organ system; or a ESCA, SCLC, PAAD, HCC, GBC, LUSC, USC, PLEMESO, UCS, STAD, IHCH, OCSC, CCOV, ARMM, VMM, PLSMESO, or HGNEC oncotree code were associated with elevated risk (Figure 1A). Similar observations were noticed when looking at cancer patient features associated with longer or shorter overall survival with Pearson and Spearman correlations (Figure 1B). Overall, multiple clinical and mutational features are important to predict the overall survival of cancer patients.
Metastase count, FGA, age, MSI score, TMB, and cancer type predict overall survival status after treatment.
We investigated if we could incorporate the treatment information of the patients to predict their overall survival status. To do this, we merged the MSK MetTropism cohort [14] that we used in the first part of this work with the Cancer Therapy and Clonal Hematopoiesis cohort [15] that contains the treatment information for 16,603 of these patients. Random Forest and Gradient Boosting models were trained on these features with 5 cross-validation and parameter optimization (Figure 2A). The best parameters of the models are a learning rate of 0.1 for Gradient Boosting, maximum features set as auto, and a minimum sample leaf set as 1 for Random Forest (Figure 2B). In addition, the best parameters are a maximum depth of 4 vs. 50; a minimum sample split of 100 vs. 50; and a n estimators of 500 vs. 200 for Gradient Boosting vs. Random Forest, respectively.
By looking at the confusion matrix and the performance metrics, we evaluated the performance of these best models (Figure 2A,C). We obtained a cross-validation accuracy and a test accuracy of 0.74 for the models, meaning that the algorithms managed to correctly predict the survival status for 74% of the patients (Figure 2C). More specifically, for deceased patients, Gradient Boosting precision, denoting the accuracy of positive predictions, is equal to 0.72; recall, which gauges the model’s ability to identify all the relevant instances of a class, is equal to 0.77; F1-score, representing the harmonic mean of precision and recall, is equal to 0.74; and support, indicating the number of samples in each class within the test set, is equal to 1597. For living patients, Gradient Boosting precision is equal to 0.77, recall is equal to 0.72, F1-score is equal to 0.75, and support is equal to 1724. For deceased patients, Random Forest precision is equal to 0.71, recall is equal to 0.71, F1-score is equal to 0.75, and support is equal to 1597. For living patients, Random Forest precision is equal to 0.75, recall is equal to 0.78, F1-score is equal to 0.74, and support is equal to 1724. Overall, both models managed to predict each class outcome with similar efficiency.
We further investigated which features drive the prediction of survival in these models. To do this, we calculated the feature importance for each model. Importantly, metastase count, FGA, age, MSI score, TMB, and cancer type predict overall survival status in both machine learning models (Figure 2D). Thus, training machine learning models on clinical and mutational features could predict overall survival with an accuracy of 74%, and these predictions are led by metastase count, FGA, age, MSI score, TMB, and cancer type.
To better investigate the drug choice and smoker status impact on survival, we looked at features associated with an increased or decreased hazard ratio (Cox regression) in this 16,603 patient dataset. The use of Carboplatin (Hazard Ratio = 1.1281), Taxane (Hazard Ratio = 1.1816), Topo1 TX (Hazard Ratio = 1.2224), or Microtubule TX (Hazard Ratio = 1.3498) were associated with increased risk, together with a current smoker status (Hazard Ratio = 1.1401), while a never smoker status was associated with decreased risk (Hazard Ratio = 0.9198) (Figure 3A).

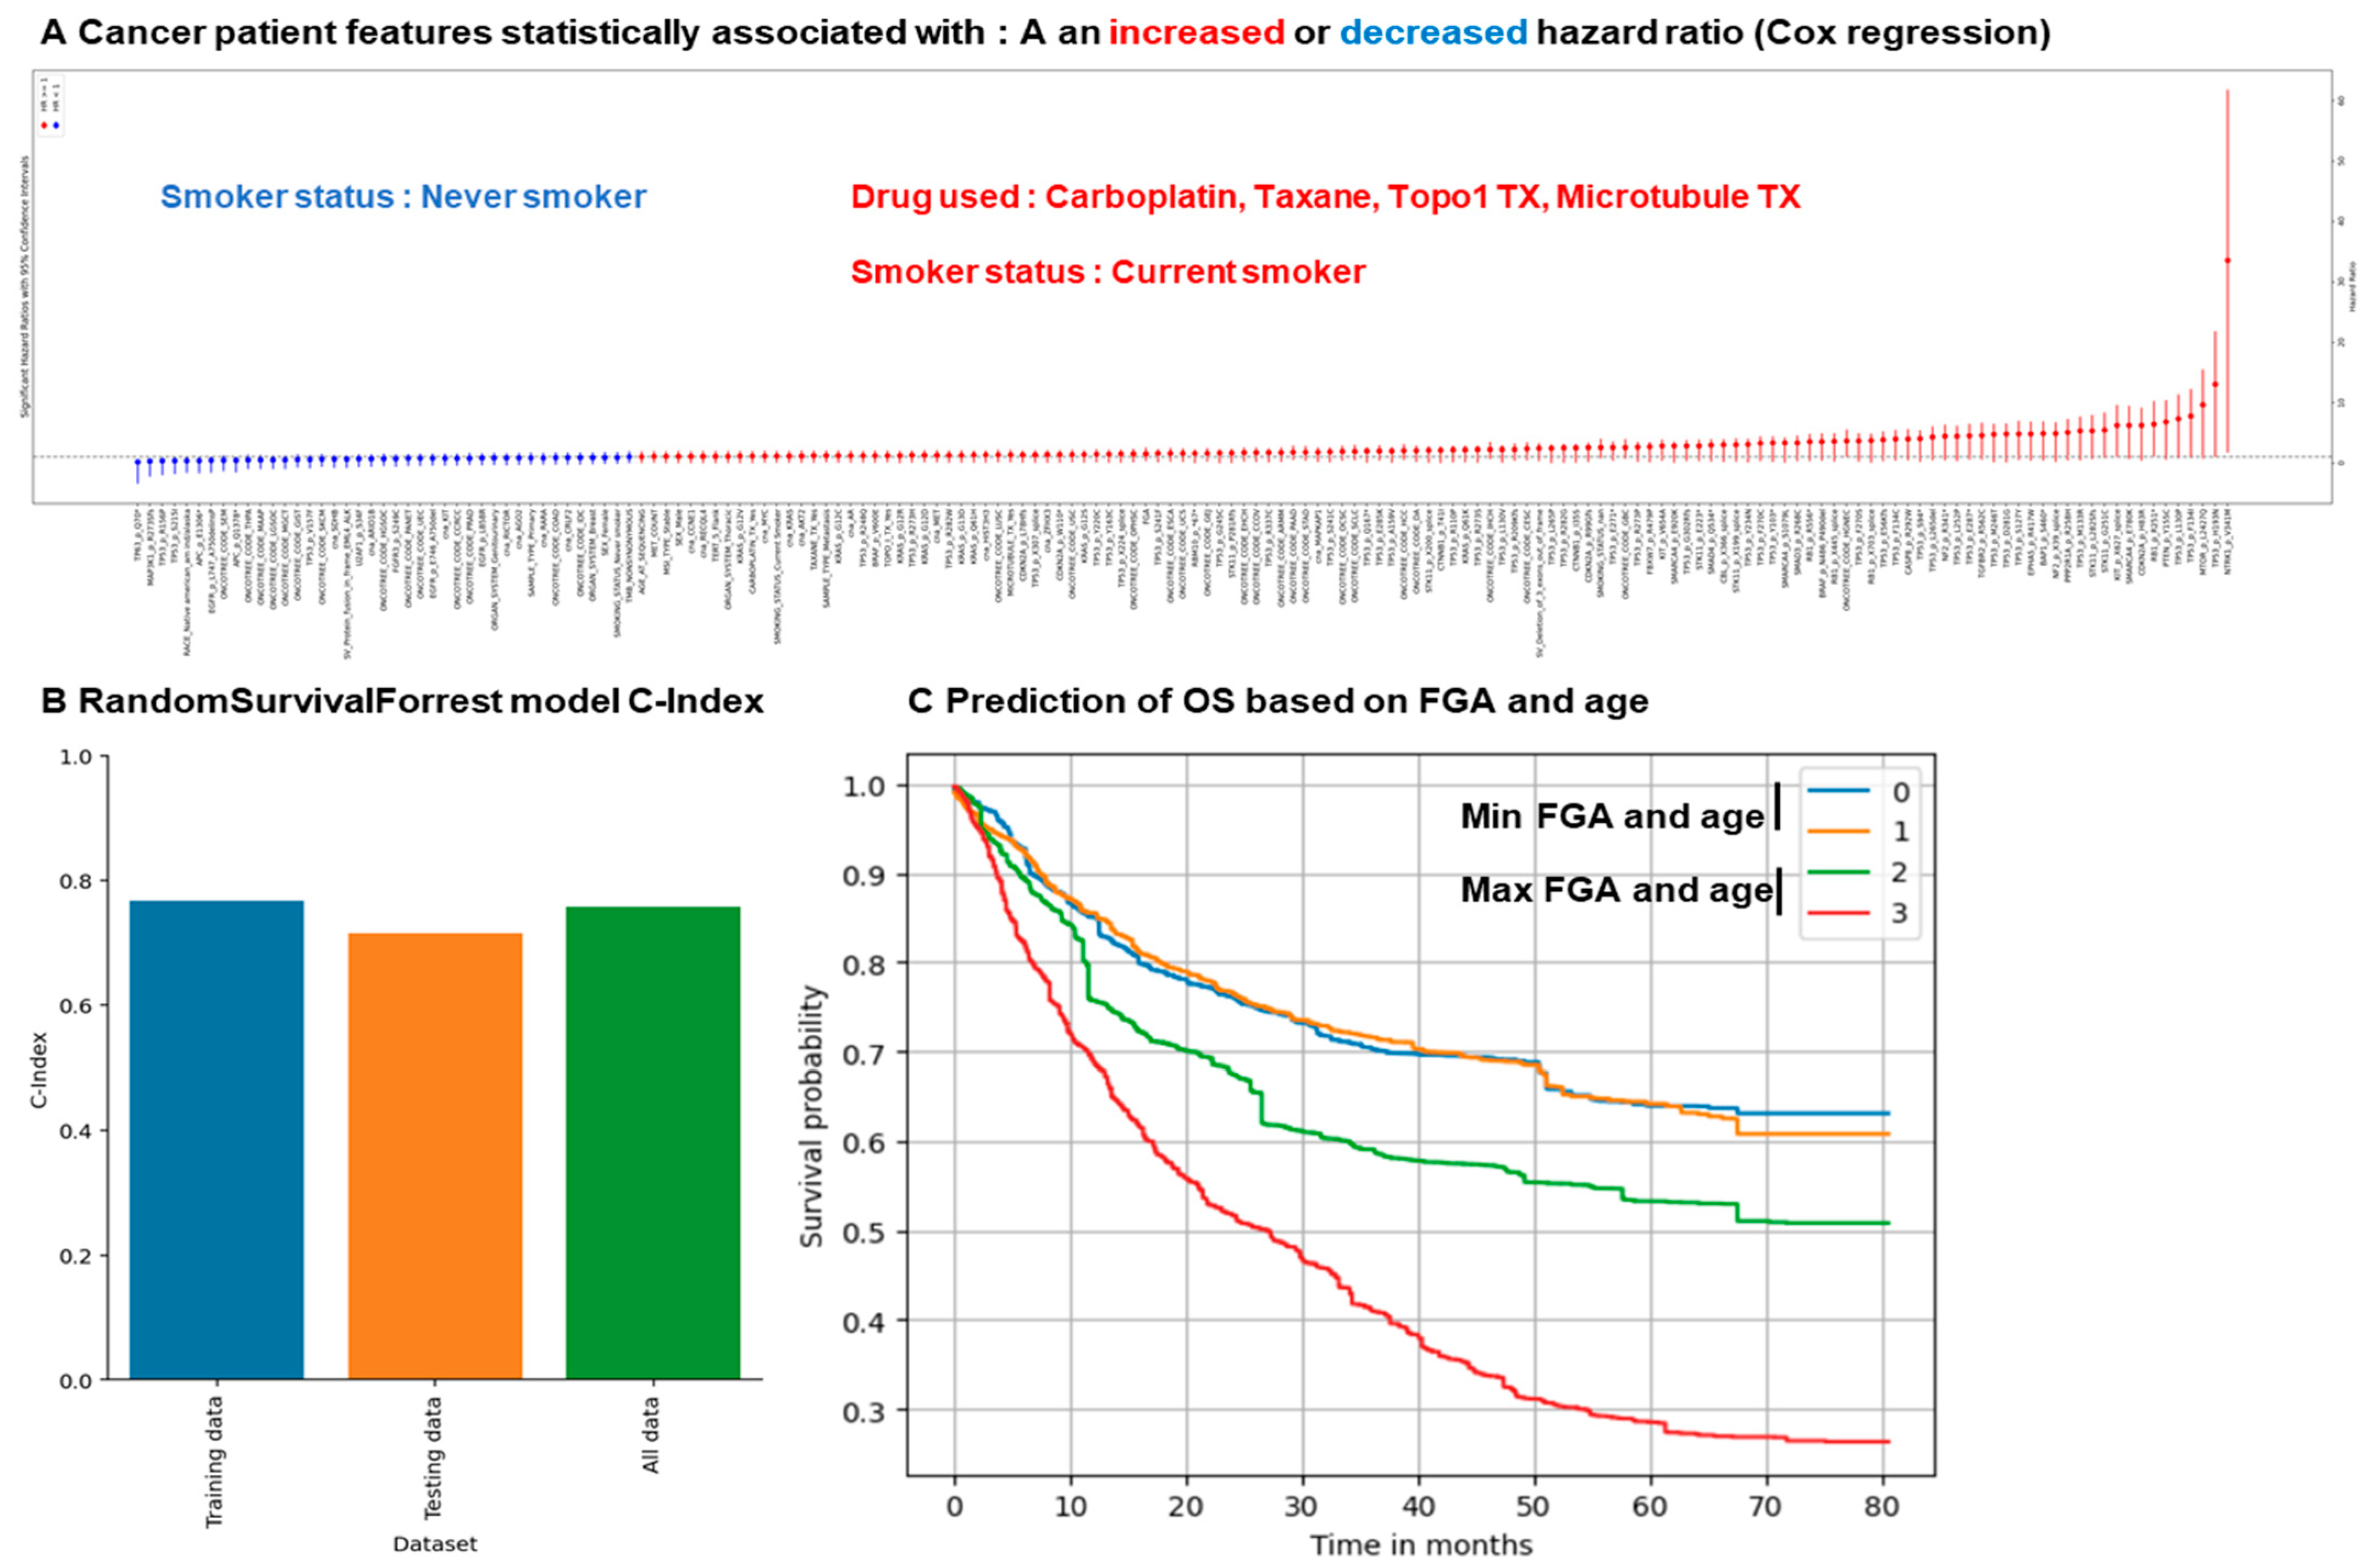
3.4. Random Survival Forest Approach Predicts Overall Survival Based on Clinical and Mutational Data

Finally, we investigated if we could combine both time and event approaches to predict survival. Indeed, overall survival could be considered as an event (status living/deceased) and as a time (overall survival in months). To do so, we used a Random Survival Forest model to perform a time-to-event analysis. We merged the MSK MetTropism cohort [14] containing clinical and mutational features with the Cancer Therapy and Clonal Hematopoiesis cohort [15] that contains the treatment information for 16,603 of these patients. Then, we leveraged machine learning algorithms trained on the features that we identified in Figure 1 as associated with a decreased or lower risk and incorporated the treatment data. The Random Survival Forest model was trained on these features with 5 cross-validation and parameter optimization.
We obtained a Concordance Index (C-Index) of 0.76, meaning that the model was efficient to predict overall survival (Figure 3B). This indicates that in 76% of cases, the model correctly predicts that a patient with a shorter predicted survival time indeed has a shorter observed survival time compared to another patient. As an example, we plotted the prediction of OS based on FGA and age for 4 patients (patients 0 and 1 are young and have a low FGA score, while patients 2 and 3 are old and have a high FGA score) (Figure 3C). This shows that as expected, patients with a higher FGA score and age have an increased predicted risk compared to younger patients with a low FGA score.

4. Discussion

In this study, we sought to develop and evaluate machine learning models to predict the OS of cancer patients using a combination of clinical and molecular features. Our findings highlight the significant potential of integrating the tumor mutational burden; microsatellite instability; the fraction of genome altered; the copy number alterations; and clinical variables such as age, sex, race, and cancer type in predicting survival outcomes. The use of advanced machine learning techniques, including Random Forest, Gradient Boosting, and Ensemble models, demonstrated robust predictive performance, achieving an accuracy of 74% for overall survival status, and a C-Index of 0.76 for the Random Survival Forest. These results underscore the importance of molecular and clinical data integration in improving patient outcome predictions, potentially guiding personalized therapeutic strategies. The clinical and mutational features identified in our models are consistent with current knowledge of cancer biology and survival outcomes. Notably, the presence of certain mutations, such as TP53 and KRAS, was associated with poorer survival outcomes [16,17], while a higher MSI score or TMB was linked to better survival [9,18].
We further investigated the predictive power of machine learning models incorporating treatment-related data, including information on therapies like platinum, carboplatin, and taxane. Our models suggest that treatment data can improve survival predictions, with certain therapies impacting survival outcomes. Our study highlights the importance of incorporating a broad range of features (clinical, mutational, and treatment-related) into predictive models for OS. The combination of clinical data, such as demographic information and cancer type, with genomic features, such as TMB, MSI, FGA, and CNA, has the potential to provide a more comprehensive understanding of a patient’s prognosis. Moreover, our approach offers insights into how specific mutations and cancer types can serve as biomarkers for survival, allowing for more personalized and effective treatment strategies.
One of the key strengths of this study, compared to previous studies [1,2,3], is the large and diverse cohort of 25,508 cancer patients, which increases the generalizability of our findings across a wide range of cancer types. Additionally, the integration of multiple machine learning models provides a robust framework for predicting survival outcomes. By using cross-validation and parameter optimization, we were able to fine-tune the models for optimal performance, ensuring that our predictions are both reliable and accurate.
However, there are some limitations to this study that should be considered. First, while our models were trained on a large cohort, the data were derived from a single institution, which may introduce potential biases in patient demographics, treatment protocols, and cancer types. Expanding the cohort to include data from multiple institutions or diverse populations could further improve the generalizability of the models. Second, while our study included a comprehensive set of clinical and genomic features, additional factors, such as immune microenvironment markers [1,3,19], tumor heterogeneity, and longitudinal treatment data, could further enhance prediction accuracy. These algorithms may be also incorporated in user-friendly software to be used by more clinicians [20,21,22,23,24,25,26]. Finally, although we demonstrated the ability to predict survival outcomes, the clinical utility of these models in real-world settings will require further validation in prospective studies and clinical trials.

5. Conclusions

In conclusion, our study demonstrates that machine learning models trained on clinical and mutational data can provide valuable insights into OS predictions for cancer patients. Future work will focus on further refining these models, incorporating additional data types, and validating their clinical utility to ensure that they can be effectively integrated into clinical practice.

Funding

This research received no external funding.

Institutional Review Board Statement

Not applicable as data were already published in previous original studies.

Informed Consent Statement

Not applicable.

Data Availability Statement

All data are openly available on cBioPortal website. https://www.cbioportal.org/study/summary?id=msk_met_2021 (accessed on 1 January 2025); https://www.cbioportal.org/study/summary?id=msk_ch_2020 (accessed on 1 January 2025). Code is available on Github. https://github.com/gmestrallet/Cancer_mutation (accessed on 1 January 2025).

Conflicts of Interest

The author declares no conflicts of interest.

References

  1. Mestrallet, G. Predicting Immunotherapy Outcomes in Glioblastoma Patients through Machine Learning. Cancers 2024, 16, 408. [Google Scholar] [CrossRef]
  2. Mestrallet, G. Prediction of Glioma Resistance to Immune Checkpoint Inhibitors Based on Mutation Profile. Neuroglia 2024, 5, 145–154. [Google Scholar] [CrossRef]
  3. Mestrallet, G. Predicting Resistance to Immunotherapy in Melanoma, Glioblastoma, Renal, Stomach and Bladder Cancers by Machine Learning on Immune Profiles. Onco 2024, 4, 192–206. [Google Scholar] [CrossRef]
  4. Sung, J.-Y.; Cheong, J.-H. Machine Learning Predictor of Immune Checkpoint Blockade Response in Gastric Cancer. Cancers 2022, 14, 3191. [Google Scholar] [CrossRef] [PubMed]
  5. Tonneau, M.; Phan, K.; Mane Tonneau, M.; Phan, K.; Manem, V.S.K.; Low-Kam, C.; Dutil, F.; Kazandjian, S.; Vanderweyen, D.; Panasci, J.; et al. Generalization optimizing machine learning to improve CT scan radiomics and assess immune checkpoint inhibitors’ response in non-small cell lung cancer: A multicenter cohort study. Front. Oncol. 2023, 13, 1196414. [Google Scholar] [CrossRef] [PubMed]
  6. Wiesweg, M.; Mairinger, F.; Reis, H.; Goetz, M.; Walter, R.F.H.; Hager, T.; Metzenmacher, M.; Eberhardt, W.E.E.; McCutcheon, A.; Köster, J.; et al. Machine learning-based predictors for immune checkpoint inhibitor therapy of non-small-cell lung cancer. Ann. Oncol. 2019, 30, 655–657. [Google Scholar] [CrossRef] [PubMed]
  7. Jee, J.; Fong, C.; Pichotta, K.; Tran, T.N.; Luthra, A.; Waters, M.; Fu, C.; Altoe, M.; Liu, S.Y.; Maron, S.B.; et al. Automated real-world data integration improves cancer outcome prediction. Nature 2024, 636, 728–736. [Google Scholar] [CrossRef]
  8. Mestrallet, G. Leveraging Tumor Mutation Profiles to Forecast Immune Checkpoint Blockade Resistance in Melanoma, Lung, Head and Neck, Bladder and Renal Cancers. Onco 2024, 4, 439–457. [Google Scholar] [CrossRef]
  9. Mestrallet, G.; Brown, M.; Bozkus, C.C.; Bhardwaj, N. Immune escape and resistance to immunotherapy in mismatch repair deficient tumors. Front. Immunol. 2023, 14, 1210164. [Google Scholar] [CrossRef] [PubMed]
  10. Gillies, R.J.; Schabath, M.B. Radiomics Improves Cancer Screening and Early Detection. Cancer Epidemiol. Biomark. Prev. Publ. Am. Assoc. Cancer Res. Cosponsored Am. Soc. Prev. Oncol. 2020, 29, 2556–2567. [Google Scholar] [CrossRef]
  11. Zhu, Y.; Bi, D.; Saunders, M.; Ji, Y. Prediction of chronic kidney disease progression using recurrent neural network and electronic health records. Sci. Rep. 2023, 13, 22091. [Google Scholar] [CrossRef] [PubMed]
  12. Carrasco-Zanini, J.; Pietzner, M.; Koprulu, M.; Wheeler, E.; Kerrison, N.D.; Wareham, N.J.; Langenberg, C. Proteomic prediction of diverse incident diseases: A machine learning-guided biomarker discovery study using data from a prospective cohort study. Lancet Digit. Health 2024, 6, e470-9. [Google Scholar] [CrossRef]
  13. Feretzakis, G.; Sakagianni, A.; Loupelis, E.; Kalles, D.; Skarmoutsou, N.; Martsoukou, M.; Christopoulos, C.; Lada, M.; Petropoulou, S.; Velentza, A.; et al. Machine Learning for Antibiotic Resistance Prediction: A Prototype Using Off-the-Shelf Techniques and Entry-Level Data to Guide Empiric Antimicrobial Therapy. Healthc. Inform. Res. 2021, 27, 214–221. [Google Scholar] [CrossRef]
  14. Nguyen, B.; Fong, C.; Luthra, A.; Smith, S.A.; DiNatale, R.G.; Nandakumar, S.; Walch, H.; Chatila, W.K.; Madupuri, R.; Kundra, R.; et al. Genomic characterization of metastatic patterns from prospective clinical sequencing of 25,000 patients. Cell 2022, 185, 563–575.e11. [Google Scholar] [CrossRef]
  15. Bolton, K.L.; Ptashkin, R.N.; Gao, T.; Braunstein, L.; Devlin, S.M.; Kelly, D.; Patel, M.; Berthon, A.; Syed, A.; Yabe, M.; et al. Cancer therapy shapes the fitness landscape of clonal hematopoiesis. Nat. Genet. 2020, 52, 1219–1226. [Google Scholar] [CrossRef]
  16. Zhu, G.; Pei, L.; Xia, H.; Tang, Q.; Bi, F. Role of oncogenic KRAS in the prognosis, diagnosis and treatment of colorectal cancer. Mol. Cancer 2021, 20, 143. [Google Scholar] [CrossRef]
  17. Robles, A.I.; Harris, C.C. Clinical Outcomes and Correlates of TP53 Mutations and Cancer. Cold Spring Harb. Perspect. Biol. 2010, 2, a001016. [Google Scholar] [CrossRef] [PubMed]
  18. Samstein, R.M.; Lee, C.-H.; Shoushtari, A.N.; Hellmann, M.D.; Shen, R.; Janjigian, Y.Y.; Barron, D.A.; Zehir, A.; Jordan, E.J.; Omuro, A.; et al. Tumor mutational load predicts survival after immunotherapy across multiple cancer types. Nat. Genet. 2019, 51, 202–206. [Google Scholar] [CrossRef]
  19. Cheng, S.; Han, Z.; Dai, D.; Li, F.; Zhang, X.; Lu, M.; Lu, Z.; Wang, X.; Zhou, J.; Li, J.; et al. Multi-omics of the gut microbial ecosystem in patients with microsatellite-instability-high gastrointestinal cancer resistant to immunotherapy. Cell Rep. Med. 2024, 5, 101355. [Google Scholar] [CrossRef] [PubMed]
  20. Mestrallet, G. Software development for severe burn diagnosis and autologous skin substitute production. Comput. Methods Programs Biomed. Update 2022, 2, 100069. [Google Scholar] [CrossRef]
  21. Breiman, L. Random Forests. Mach. Learn. 2001, 45, 5–32. [Google Scholar] [CrossRef]
  22. Liaw, A.; Wiener, M. Classification and Regression by randomForest. R News 2002, 2, 18–22. [Google Scholar]
  23. Cutler, D.R.; Edwards, T.C., Jr.; Beard, K.H.; Cutler, A.; Hess, K.T.; Gibson, J.; Lawler, J.J. Random Forests for Classification in Ecology. Ecology 2007, 88, 2783–2792. [Google Scholar] [CrossRef]
  24. Prasad, A.M.; Iverson, L.R.; Liaw, A. Newer Classification and Regression Tree Techniques: Bagging and Random Forests for Ecological Prediction. Ecosystems 2006, 9, 181–199. [Google Scholar] [CrossRef]
  25. Pal, M.; Mather, P.M. An assessment of the effectiveness of decision tree methods for land cover classification. Remote Sens. Environ. 2003, 86, 554–565. [Google Scholar] [CrossRef]
  26. Rodriguez-Galiano, V.F.; Ghimire, B.; Rogan, J.; Chica-Olmo, M.; Rigol-Sanchez, J.P. An assessment of the effectiveness of a random forest classifier for land-cover classification. ISPRS J. Photogramm. Remote Sens. 2012, 67, 93–104. [Google Scholar] [CrossRef]
Figure 1. Cancer patient features associated with a difference in survival. (A) Cancer patient features associated with an increased (red) or decreased (blue) hazard ratio (Cox regression). (B) Cancer patient features associated with longer or shorter overall survival (Pearson and Spearman correlations). Features include clinical variables, mutations shared by at least 5 patients, structural variants, and copy number alterations. N = 25,508 patients.
Onco 05 00008 g001
Figure 2. Metastase count, FGA, age, MSI score, TMB, and cancer type predict overall survival status after treatment in multiple machine learning models. (A) Prediction of overall survival status of cancer patients based on their mutational and clinical features identified in Figure 1 when adding the data about the therapy that they received. Random Forest and Gradient Boosting were used with 5 cross-validation. Predicted vs. actual overall survival were plotted for each model. (B) Best parameters for each model. (C) Performance of each model. (D) Features predicting response in both models (feature importance). N = 16,603 patients.
Onco 05 00008 g002
Figure 3. Random Survival Forest approach to predict overall survival based on clinical and mutational data. (A) Cancer patient features associated with an increased (red) or decreased (blue) hazard ratio (Cox regression). We highlighted the smoker status and drug status present in this dataset. (B,C) Prediction of overall survival (months and status) of cancer patients based on their mutational and clinical features identified in Figure 1 when adding the data about the therapy that they received. Random Survival Forest model was used with 5 cross-validation. (B) Concordance Index (C-Index) of the best model was plotted for the training dataset, the testing dataset, and the total dataset. N = 16,603 patients. (C) For prediction, a sample is dropped down each tree in the forest until it reaches a terminal node. Data in each terminal are used to non-parametrically estimate the survival using the Kaplan–Meier estimator. The final prediction is the average across all trees in the forest. As an example, we plotted the prediction of OS based on FGA and age for 4 patients (patients 0 and 1 are young and have a low FGA score, while patients 2 and 3 are old and have a high FGA score).
Onco 05 00008 g003
Disclaimer/Publisher’s Note: The statements, opinions and data contained in all publications are solely those of the individual author(s) and contributor(s) and not of MDPI and/or the editor(s). MDPI and/or the editor(s) disclaim responsibility for any injury to people or property resulting from any ideas, methods, instructions or products referred to in the content.

