Article

Roe Deer as a Model Species for Aerial Survey-Based Ungulate Population Estimation in Agricultural Habitats

1
Institute of Wildlife Biology and Management, Faculty of Forestry, University of Sopron, H-9400 Sopron, Hungary
2
Institute of Geomatics and Civil Engineering, Faculty of Forestry, University of Sopron, H-9400 Sopron, Hungary
3
Department of Life Sciences, Sapientia Hungarian University of Transylvania, 520008 Sfântu Gheorghe, Romania
*
Author to whom correspondence should be addressed.
Geomatics 2025, 5(4), 53; https://doi.org/10.3390/geomatics5040053
Submission received: 30 July 2025 / Revised: 14 September 2025 / Accepted: 13 October 2025 / Published: 14 October 2025

Abstract

To achieve professional roe deer population management and to mitigate wildlife-related agricultural damage, a wildlife population estimation trial was conducted in Hungary using an ultralight aircraft with dual sensors (thermal and DSLR camera) to assess the method’s applicability, using the roe deer as a model species. The test took place in early spring, at an altitude of 400 m above ground level and a flight speed of 150 km/h. The survey targeted a total count of a 1040 hectare area using adjacent 200 m-wide strips. This strip-based design also allowed for a methodological comparison between total count and strip sample count approaches. Object-based image classification was applied, and species-level validation was performed. During the survey, a total of 213 roe deer were localised. The average group size was 9.17 ± 1.7 ( x ¯ ± SE), with two prominent outliers (28 and 34 individuals). Compared to the density value of 0.205 individuals/ha established through the full-area census, the simulated estimations (50% and 25%) showed considerable under- and overestimation, primarily due to the aggregative behaviour of roe deer. Based on the test, aerial population estimation using dual-sensor technology proved to be effective in agricultural habitats; however, the accuracy of the results is strongly influenced by the sampling design applied.

1. Introduction

Sustainable food production is one of the most significant economic challenges of our time, placing increasing pressure on the agricultural sector. The stability of the food chain is closely linked to the condition of arable land, the phytosanitary situation, and other biotic factors influencing production [1]. Among the latter is the presence and activity of wild ungulates, which represent an increasingly frequent and significant source of conflict in arable crop production [2]. In recent decades, increases in wildlife populations have led to economic overpopulation across various continents and species [3,4,5,6,7]. This trend is partly attributable to adaptation driven by intensive agricultural activity and habitat transformation, changing climatic conditions, insufficient hunting pressure—or its complete absence in the case of protected species—and the lack of natural predators [8].
Alongside population growth, the agricultural damage caused by wild ungulates also shows an increasing trend, particularly in areas where habitat fragmentation or the expansion of agricultural land use allows wildlife access to, or forces reliance on, agricultural food sources [9]. Deer species and wild boar (Sus scrofa) can cause damage to crops at various stages of development, as well as in orchards, through trampling, rooting, grazing and browsing [10], thereby affecting yields. Damage caused by wildlife can vary significantly over time and even spatially within individual agricultural fields [11,12]. In addition to crop production, the livestock sector may also be threatened in several cases by diseases transmitted by wild mammals [13]. These threats and types of damage not only cause direct economic losses for producers but may also contribute to the structural and functional transformation of agricultural systems.
As a result, there is a growing demand among producers for measures to keep animals away, such as the construction of fences [14] or the application of other protective methods [15]. In parallel, the need for the sustainable regulation of wildlife populations is also increasing; however, the effective implementation of such management is only possible when based on reliable data [16]. Monitoring the population size and spatial distribution of wildlife is, therefore, closely linked to the safety of both crop production and livestock farming. For this reason, accurate knowledge of the populations of species occurring in agricultural habitats is of fundamental importance for informed management decisions, conflict prevention, protecting agricultural production systems, and maintaining food chain security [17]. Estimating population size and spatial distribution provides essential information for planning population control and epidemiological measures. However, collecting precise and reliable field data is highly resource-intensive and subject to numerous influencing factors [18].
Numerous methods exist for estimating wildlife populations, which can be categorised as either direct or indirect approaches. Direct counts of individuals can be conducted either over entire areas or within sample plots, using various techniques [19]. Even when an appropriate method is chosen, the success of the estimation is influenced by habitat type and terrain conditions, as well as species-specific ecological characteristics, and seasonal and weather conditions [20]. However, most methods face common limitations: they are challenging to apply effectively over large areas, have a low level of automation, and are thus difficult to integrate into large-scale agricultural decision-support systems, for which there is growing economic demand [21].
In recent decades, technological advancements—particularly the proliferation of sensor-based and remote sensing systems and their deployment on aerial platforms—have opened new horizons in wildlife population estimation [22] and other wildlife biology applications [23,24]. The use of advanced mechatronic systems, thermal cameras, RGB and multispectral sensors, image processing and classification methods during aerial surveys enables more accurate detection of cryptic, patchily distributed, and gregarious species, especially in open habitats [25]. These methods require rapid, repeatable, and standardised data collection, even across large spatial scales. The application of sensor-based detection increases the probability of both locating and identifying individuals [26,27,28,29]. Future monitoring systems targeting agricultural habitats should incorporate changes in vegetation condition resulting from the presence of wildlife, whether in the form of yield loss or the need for plot-level interventions. However, this requires accurate mapping of the spatial and temporal patterns of wildlife populations.
The present study introduces field experiences with an aerial population estimation method using the roe deer (Capreolus capreolus) as a model species. Roe deer represent an ideal focal species because they are among the most widespread and abundant ungulates in European agricultural landscapes. Ecological characteristics, such as activity patterns, relatively small body size compared to other cervids, and the use of fragmented agricultural habitats, make the roe deer a suitable model species for evaluating the efficiency and limitations of aerial survey techniques. The application of sensor-based aerial monitoring to this species demonstrates how such an approach can overcome some of the constraints of traditional population estimation methods, providing a replicable framework that can be extended to other ungulate species and various agricultural habitats.

2. Materials and Methods

2.1. Study Area

The research was conducted in northwestern Hungary, within Győr-Moson-Sopron County, in the LAJTA Project area delineated by the settlements of Mosonszolnok, Jánossomorja, and Várbalog. The aerial survey of the roe deer population focused on a 1040 hectare area predominantly under agricultural cultivation, where arable land is dominant and there are no continuous forested regions present. The landscape is interspersed with scattered tree lines and shelterbelts, totalling 16.7 km in length (Figure 1).
The study area is a flat, agriculturally cultivated landscape with a moderately continental climate, characterised by chernozem soil types. The most significant large game species in the area is the roe deer, which served as the target species of the survey. Additionally, the area is inhabited by brown hare (Lepus europaeus), common pheasant (Phasianus colchicus), grey partridge (Perdix perdix), as well as red fox (Vulpes vulpes) and badger (Meles meles) [30].

2.2. Data Collection

The aerial survey was conducted at the end of March, before leaf emergence. The sunrise occurred at 05:46, with optimal visibility conditions (clear and sunny weather). The aircraft took off from Fertőszentmiklós Airport. The survey began at 08:45 and concluded at 09:45. During the survey period, the mean air temperature was 6.6 °C, with a minimum of 6 °C and a maximum of 7.2 °C, based on data from a 10 min interval automatic meteorological station (Jánossomorja) provided by the Hungarian Meteorological Service. Within the study area, 13 parallel transects were designated (Figure 1), ranging in length from 600 to 5200 m. The total length of the flown transects amounted to 52,000 m. The flight followed the centerlines of the transects at an altitude of 400 m above ground level, travelling at approximately 150 km/h. The test flights confirmed that a flight altitude of 400 m does not cause any disturbance to roe deer. The effective width of each transect was 200 m (without overlap), resulting in a total surveyed area of 1040 hectares.
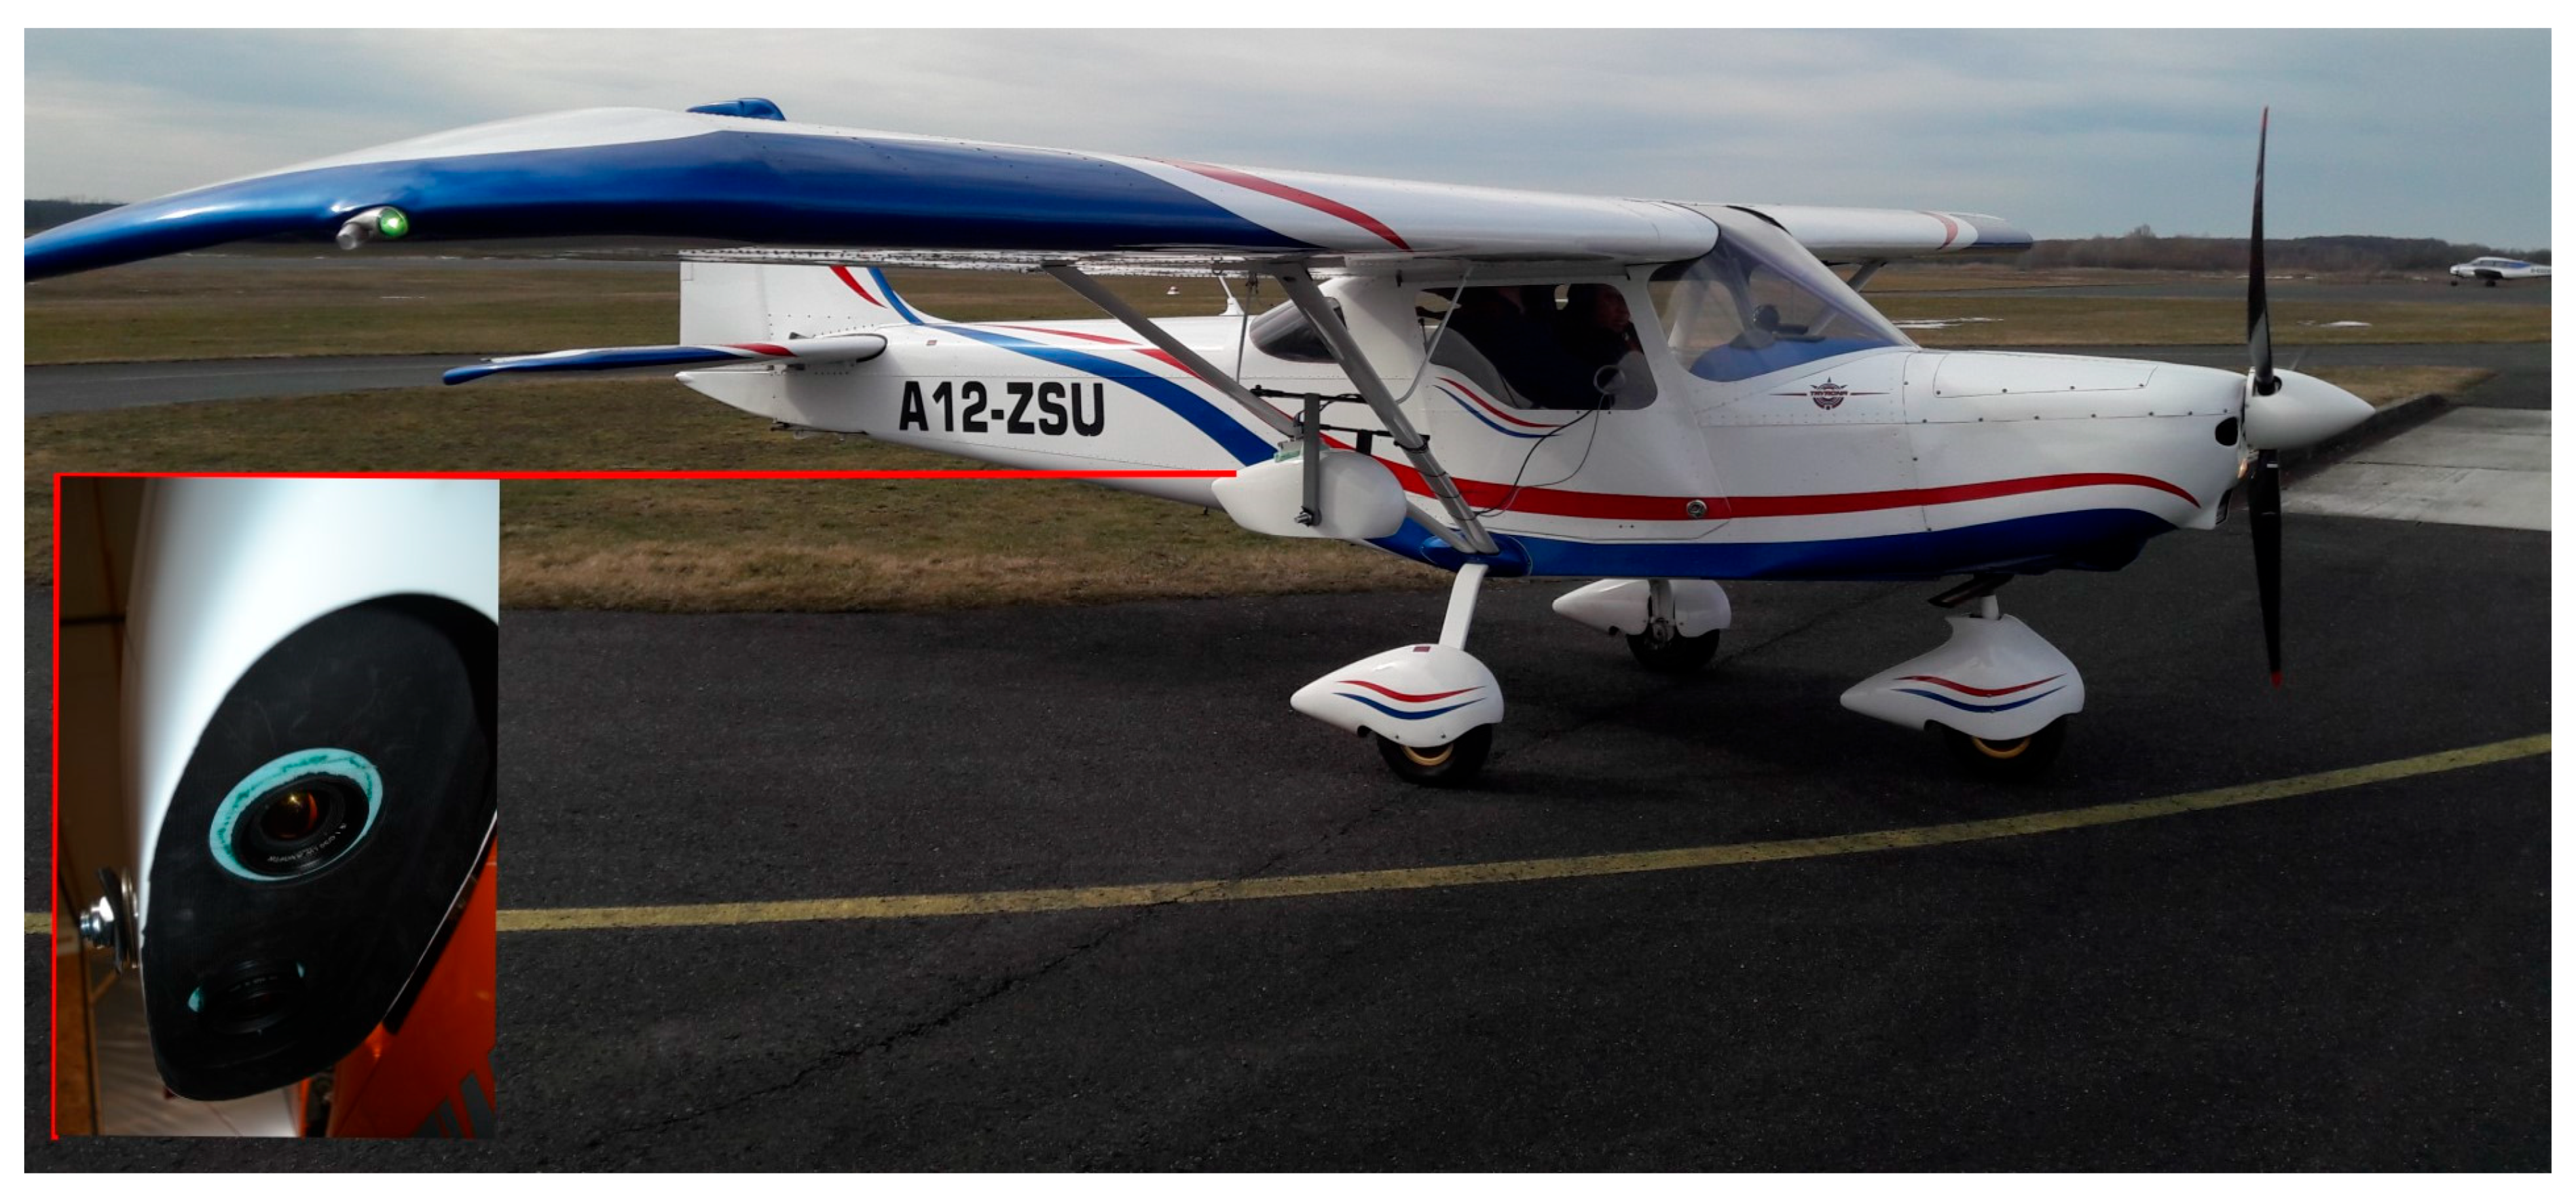
For the aerial surveys, a SILA 450C (Aero–East–Europe d.o.o., Kraljevo, Serbia) type two-seater ultralight aircraft was used. Owing to its stable flight characteristics and good manoeuvrability, it was well-suited for low-altitude, precision flights. A pilot and a sensor operator operated the aircraft. Navigation was carried out by following a pre-defined flight path using GPS tracking. The sensors were mounted in a vibration-dampened pod installed beneath the right wing (Figure 2).
Two devices were used during the flights. For thermographic measurements, a VarioCAM HD head 980 (InfraTec GmbH Infrarot-sen-sorik und Mess-technik, Dresden, Germany) real-time thermal imaging camera with a resolution of 3.15 megapixels was employed. Data acquisition was performed using an uncooled microbolometer detector unit (1024 × 768 pixels), with the option to activate hardware-based resolution enhancement (Micro-Scan function), allowing a maximum effective resolution of up to 2048 × 1536 pixels. The sampling frequency varied depending on the selected resolution (e.g., 30 Hz at 1024 × 768; 240 Hz at 1024 × 96). Focusing was motorised and automatic, while image magnification was achieved digitally, up to a maximum of eightfold. The thermal images were digitised using 16-bit A/D conversion. All camera functions were remotely controllable, and the device was housed in an IP54-rated metal enclosure.
For visual documentation and RGB image-based validation, a Canon EOS 550D (Canon Inc., Tokyo, Japan) digital single-lens reflex (DSLR) camera was used. The device is equipped with an 18-megapixel CMOS sensor, enabling a resolution of 5184 × 3456 pixels, which ensured high-detail imaging during the surveys. Image acquisition was performed using a Canon Ultrasonic EF 20 mm f/2.8 (Canon Inc., Tokyo, Japan) wide-angle lens, which, due to its fixed focal length and high light-gathering capability, proved particularly suitable for distortion-free, wide-angle imaging under varying light conditions. Images were recorded in both RAW and JPEG formats, allowing for detailed post-processing and calibration.

2.3. Image Processing and Classification

Image acquisition was conducted in an automated manner with a 3 s delay, with no human intervention. Settings such as exposure, focus, and white balance were automatically determined by the device’s built-in algorithms, which were adapted to the ambient lighting conditions. During image processing, exposure values and colour temperature data were also considered to standardise image quality.
Image processing and classification tasks were performed using the eCognition Developer v9 software [31]. The thermal images were processed using Object-Based Image Analysis (OBIA), rather than traditional pixel-based methods, considering the high geometric and radiometric resolution of the imagery. During the processing, image objects (segments) consisting of multiple pixels were created and classified.
The segmentation aimed to divide the images into homogeneous pixel regions, facilitating classification and object recognition. The segmentation process followed a bottom-up algorithm [32]: initially, each pixel formed an individual segment, which was then merged based on similarity within its local neighbourhood. The merging was based on homogeneity, calculated from the size of the objects and the standard deviation of their intensity values. Segment merging followed a local optimisation approach, where the pair of segments with the smallest change in homogeneity was always merged. As a result of the segmentation, numerous characteristics of the resulting objects became available, including statistical, spectral, and geometric features, which were used for classification.
During classification, features were selected, and a classifier was established based on training segments designated by the operator. Segments were classified based on their similarity to the training segments, using the Nearest Neighbour Classifer (NNC) method, not in the spectral space but in the normalised feature space. Before classification, the classifier’s accuracy was evaluated using test segments.
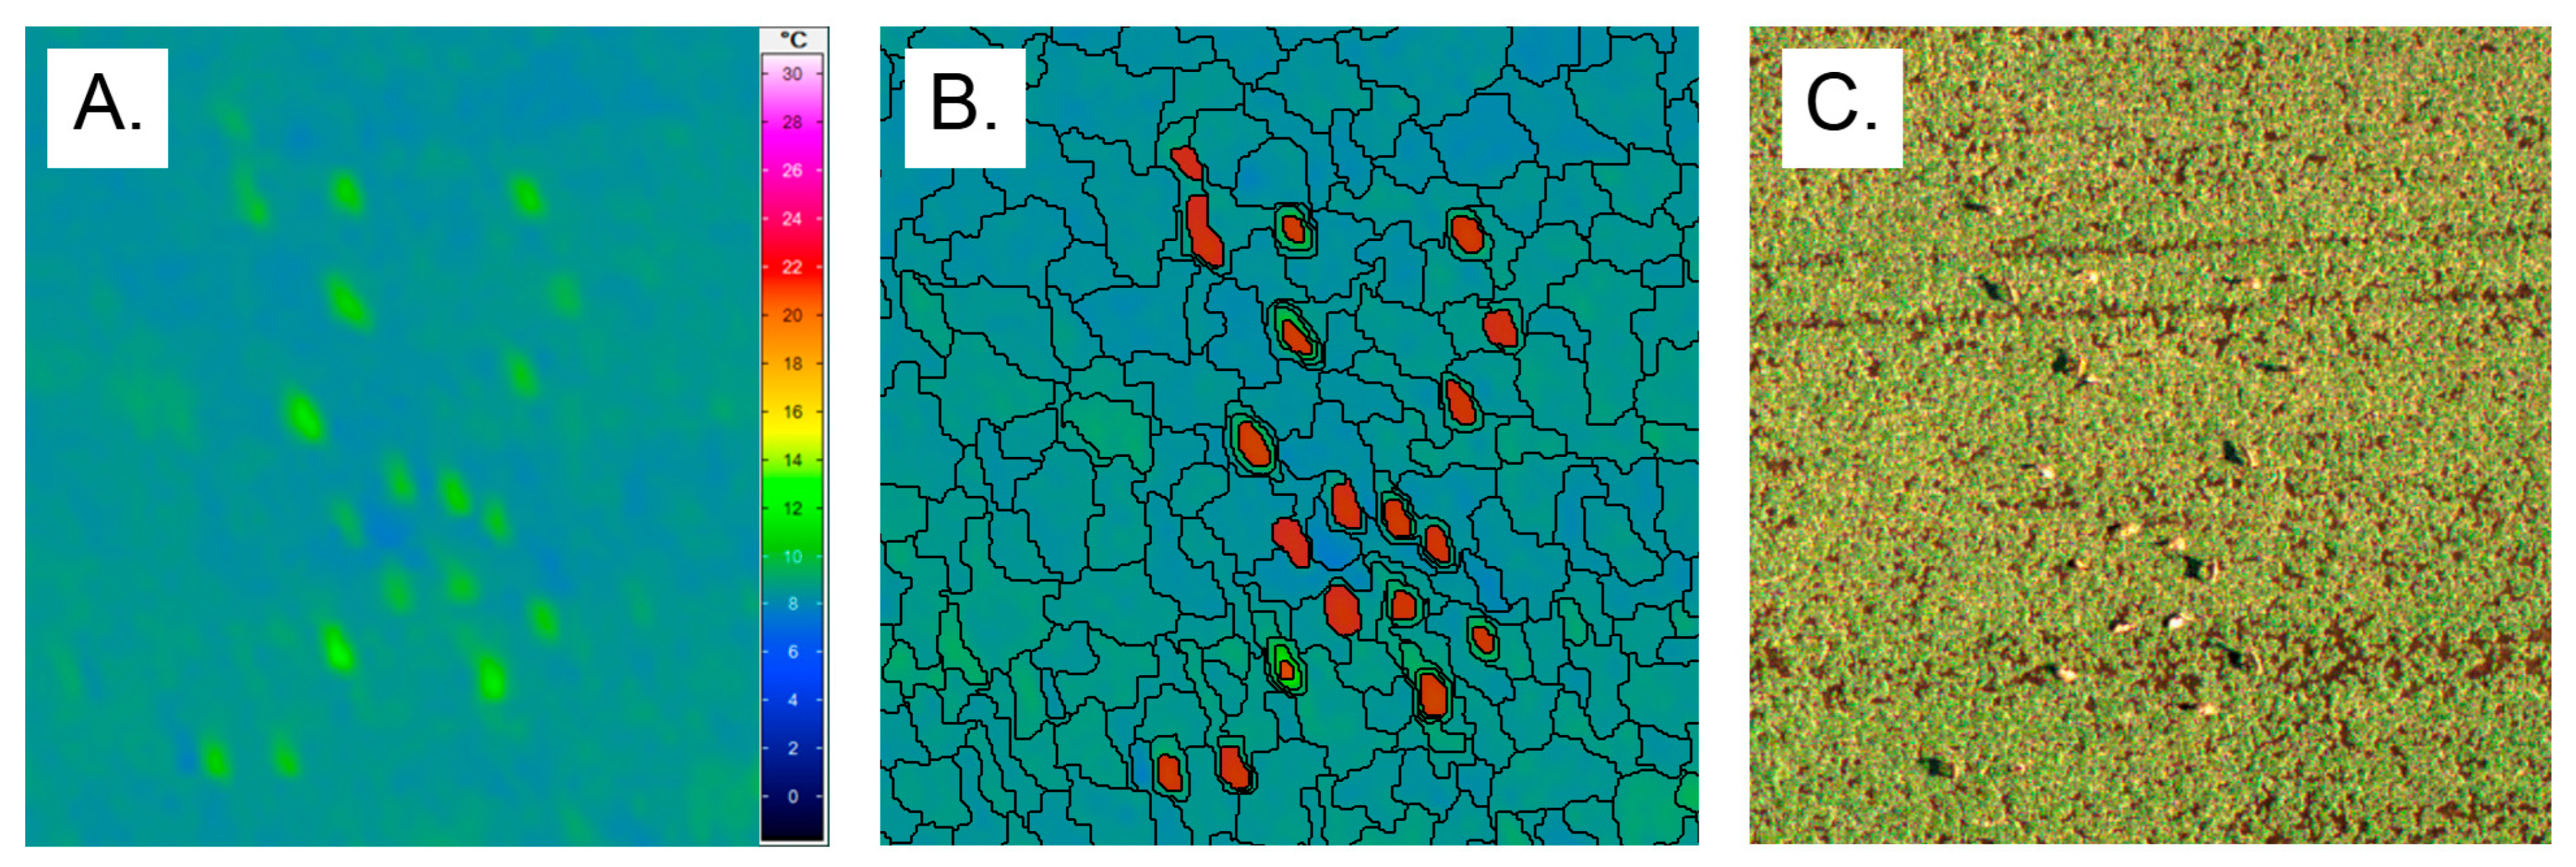
After classification, adjacent segments belonging to the same class were merged and then extracted as objects. Shape recognition was also performed based on the geometric features of the objects, with acceptance determined by comparison to validated reference shapes. eCognition Developer v9, with multiresolution segmentation, was used to produce image objects that placed a bit higher emphasis on shape (scale = 20, shape = 0.3, compactness = 0.5). After segmentation, the object was analysed for spectral and geometric parameters, and an expert classifier was set up, including conditions for the mean values of the heat image, object size, and shape index, to classify potential deer occurrences. An object was accepted if its similarity exceeded a predefined threshold. The applied software also allowed for the determination of the number of similar objects located near the recognised ones. This feature aided in both individual and group deer detection (Figure 3).

2.4. Data Analysis

All recognised objects underwent manual verification. Following validation, the spatial location of the objects (strip, quadrat number) was recorded, and species identification was carried out based on pairing with DSLR camera images.
Image evaluation was based on sample quadrants generated by dividing each transect into 200 m segments. During the delineation of the transects, the potential double-counting errors arising from within- and between-transect overlaps of the images were eliminated through manual verification. Group size and spatial distribution served as reference points for this process. For each quadrant, the number of observed roe deer individuals was recorded, along with spatial localisation: in the case of individual sightings, at the individual level; for groups, based on the centroid of the group.
The population estimation was conducted both in terms of absolute individual numbers and density. The following sampling simulations were performed:
  • S1: entire area (100%).
  • S2: odd transects (transects 1; 3; 5; 7; 9; 11; 13)—approximately 50%.
  • S3: even transects (transects 2; 4; 6; 8; 10; 12)—approximately 50%.
  • S4–S7: four different sampling combinations of approximately 25% each:
    S4: transects 1; 5; 9; 13.
    S5: transects 2; 6; 10.
    S6: transects 3; 7; 11.
    S7: transects 4; 8; 12.
During the simulations, population density values (mean and standard error) of scenarios (S2, S3, S4, S5, S6, S7, S8) were used to calculate the mean, minimum and maximum possible population sizes for the entire area (1040 ha).
To characterise the spatial distribution of individuals, the average group size, the mean distance between groups (pairwise distances), and the average nearest neighbour distance (NND) were also determined. To ensure the comparability of aerial population estimates, a ground-based control survey was conducted after the flight, using a vehicle-based visual count along the road network within the study area. A driver and an observer equipped with a spotting scope worked together. Visual observations and data recording were conducted along the survey route, stopping every 200 m. The number of observed individuals was verified from multiple observation points. During the ground survey, a total count was carried out [33], as the entire area was visually accessible from the road network. Data processing was performed using the PAST 4.3 statistical software [34]. Descriptive statistics were applied during the analyses, including mean, median, and standard error. Additionally, relative indicators such as occurrence frequency and percentage distribution were presented. Data visualisation was carried out using boxplots and histograms.

3. Results

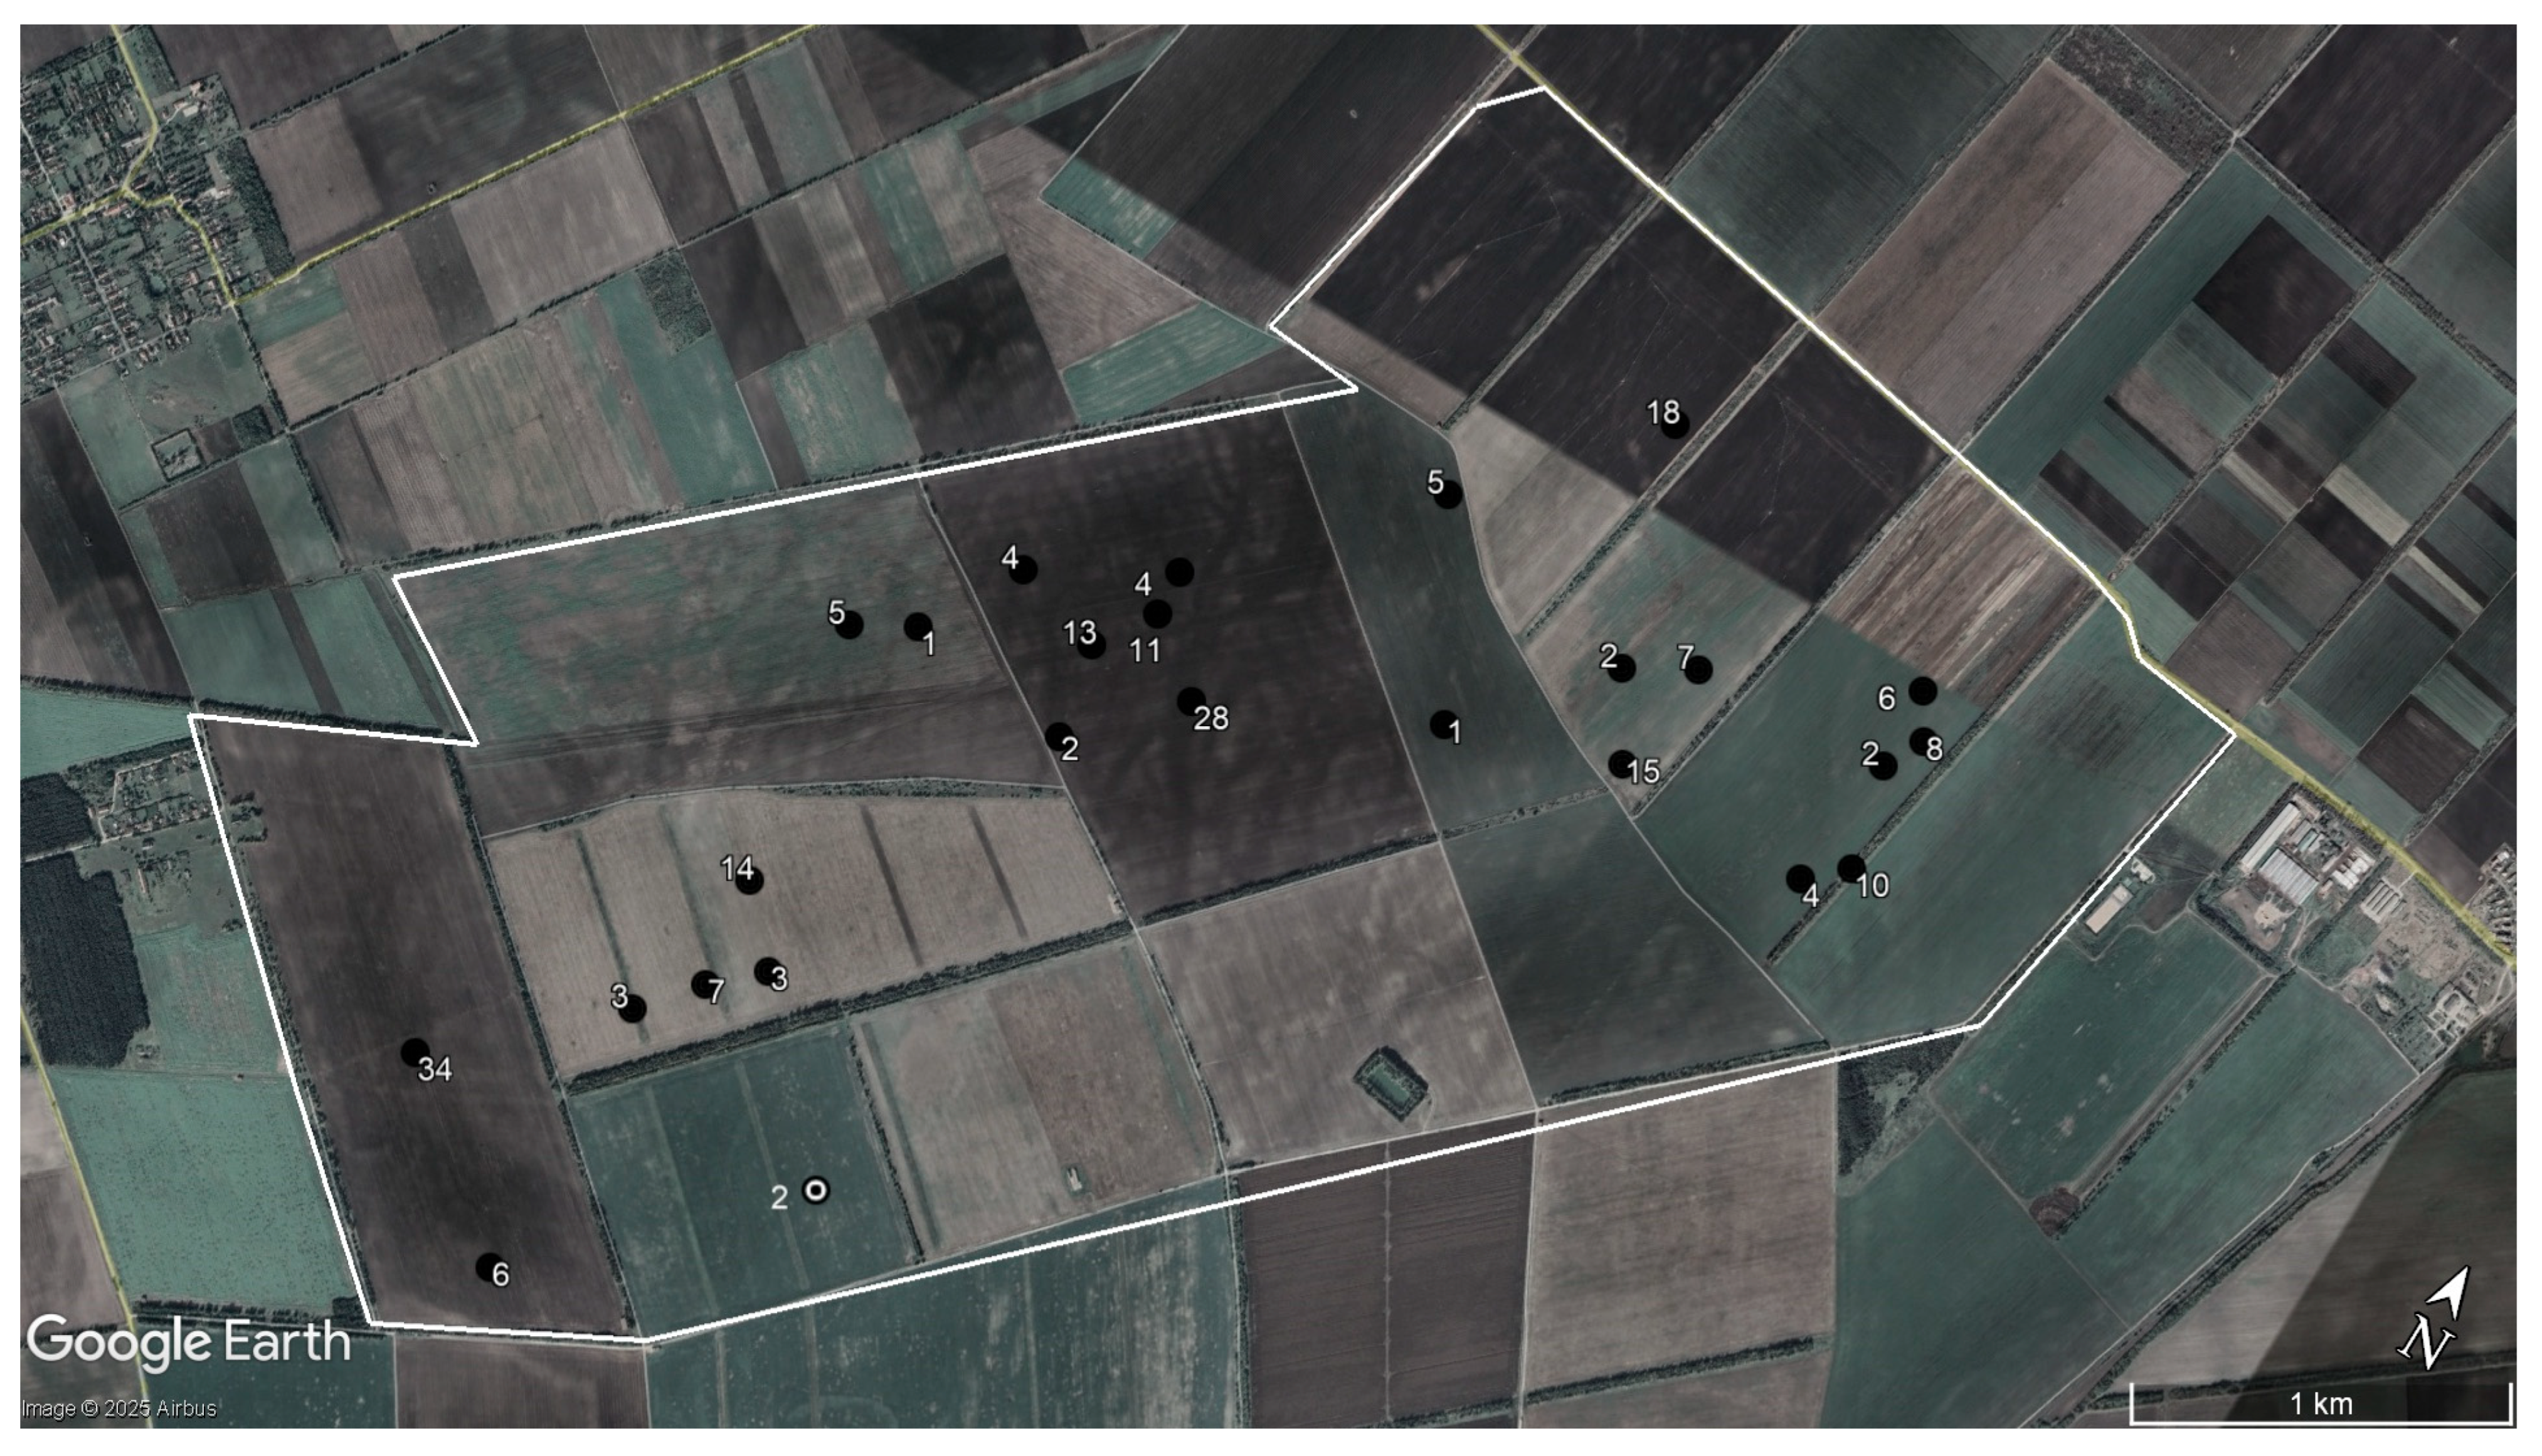
During the complete aerial survey (S1), roe deer presence was confirmed at a total of 25 locations within the 1040 hectare study area. Two stray dogs were confirmed in one location based on normal photographs. In the case of roe deer, based on the spatial distribution of the individuals, it was established that solitary individuals occurred in two cases. In comparison, in the remaining 23 cases, groups consisting of multiple individuals were observed (Figure 4).
Group sizes ranged from 2 to 34 individuals, with an average group size of 9.17 ± 1.7 ( x ¯ ± S.E.) individuals, and a median value of 6 (Figure 5).
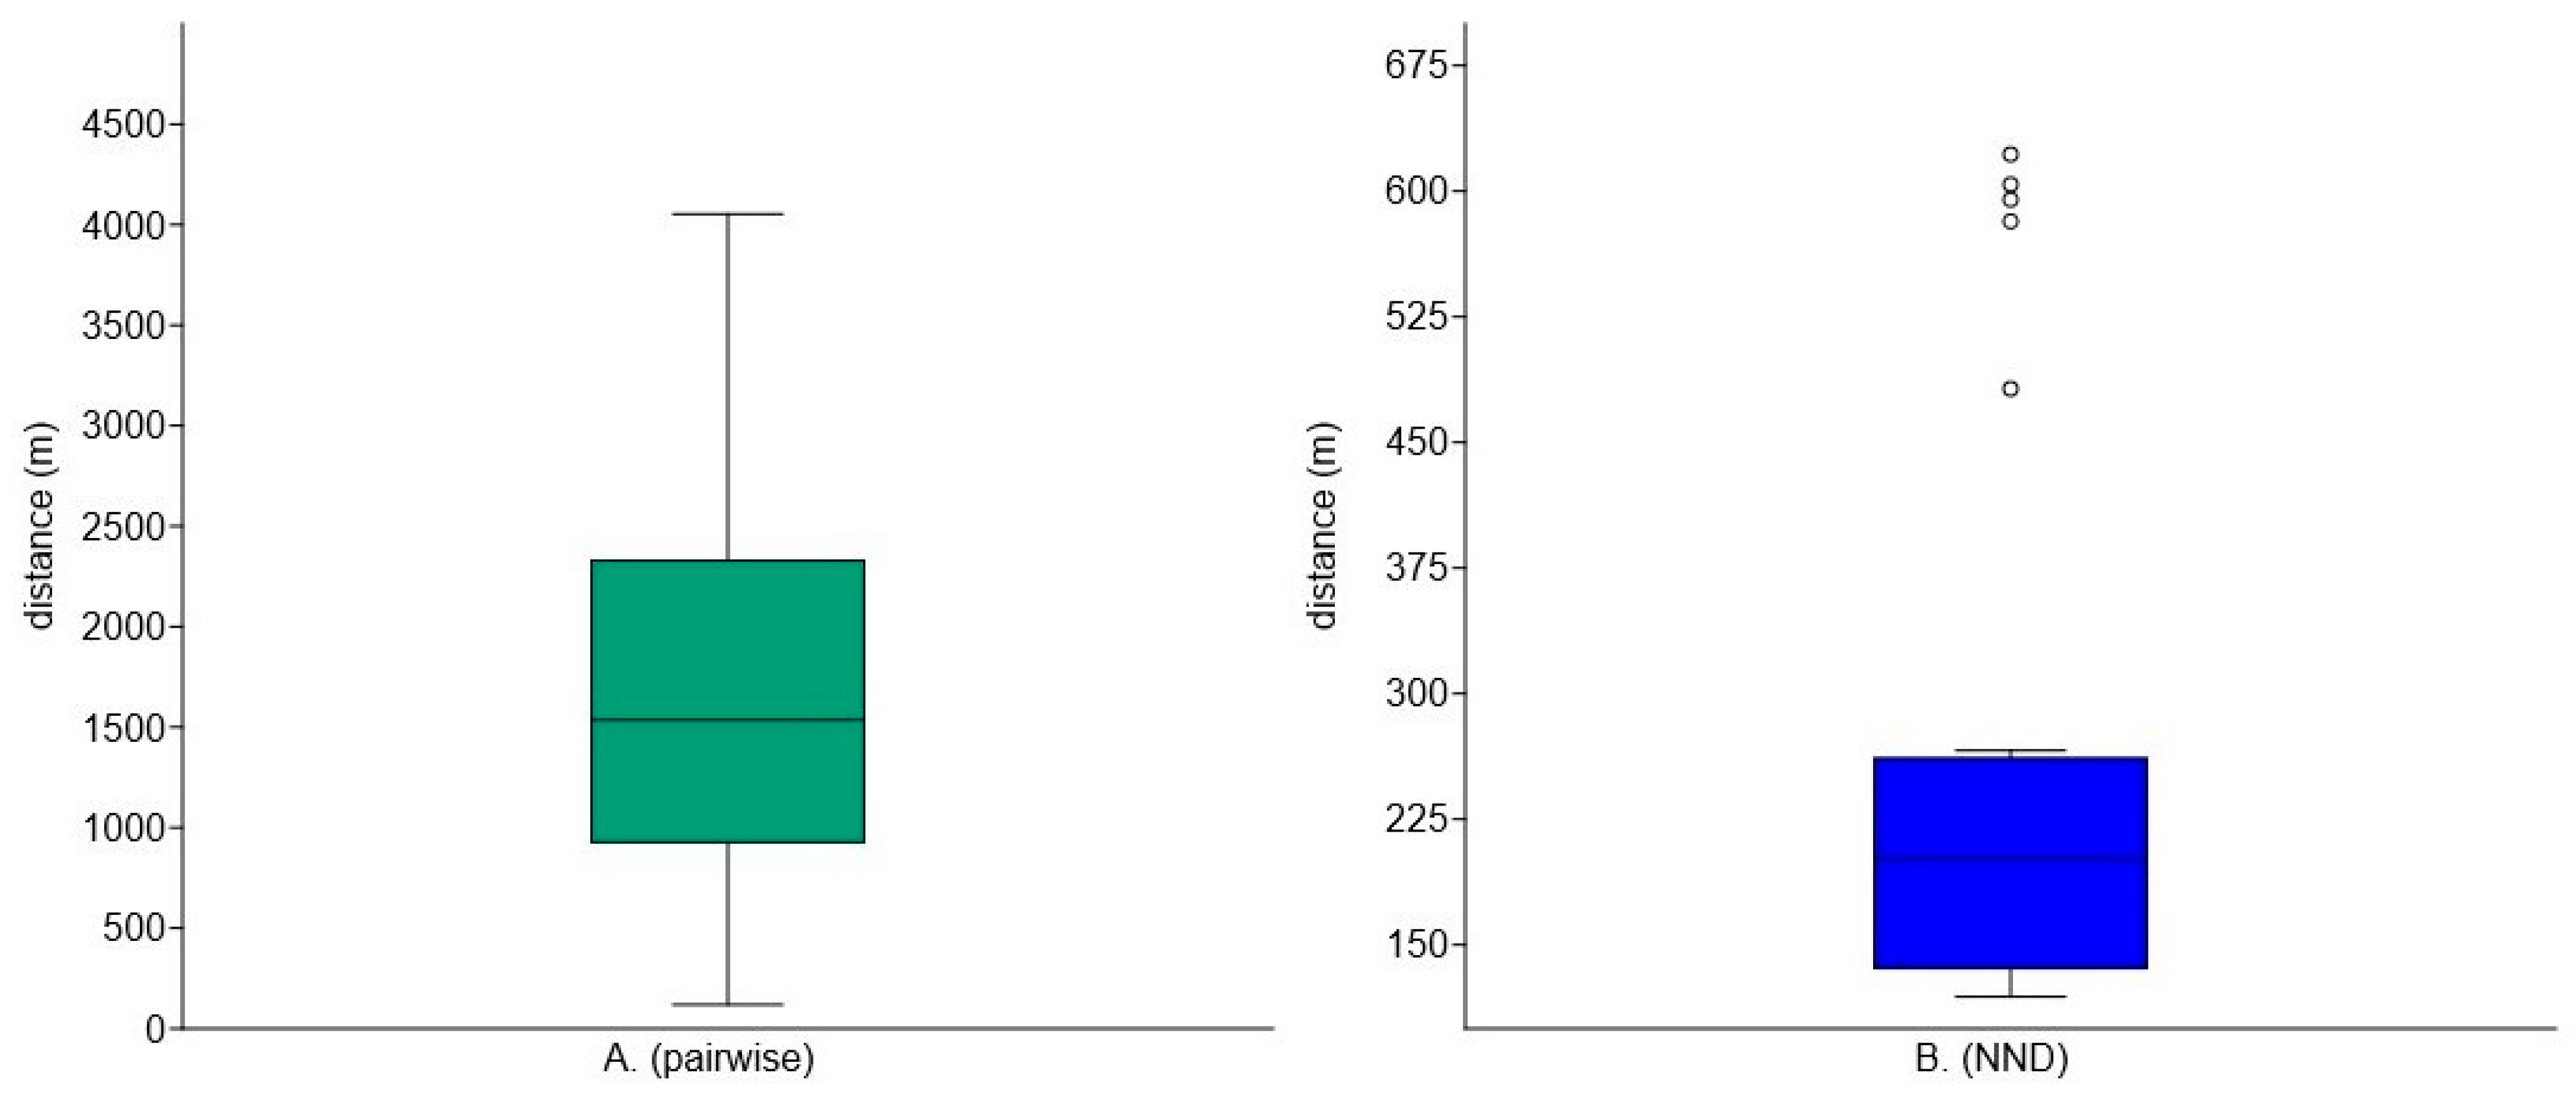
In the analysis of the spatial distribution of observed roe deer (including both solitary and group occurrences), the average pairwise distance was first calculated. The mean distance between observations (n = 300) was 1649.5 ± 57.1 m ( x ¯ ± S.E.), with a median of 1480.5 m, a minimum of 119 m, and a maximum of 4053 m. Subsequently, the average nearest neighbour distance (NND) was also determined. Based on this analysis (n = 25), the average NND was 260.9 ± 33.8 m ( x ¯ ± S.E.), with a median of 201 m, a minimum of 119 m, and a maximum of 622 m (Figure 6).
Furthermore, the frequency of occurrence was also determined for both distance metrics. It was found that 38% of the pairwise distances were within 1000 m, while in the case of NND, 48% of the values were within 200 m (Figure 7).
During the complete aerial population survey (S1), the presence of 213 roe deer was confirmed, corresponding to a population density of 0.205 ± 0.06 ( x ¯ ± S.E.) individuals/ha. This value was calculated based on the number of individuals counted within sampling quadrats located within the transects (4 ha/quadrat, n = 260). The result of the control ground count was 214 individuals. In the complete aerial population survey, 25 out of the 260 sampling quadrats contained roe deer observations, corresponding to a 9.6% occurrence rate.
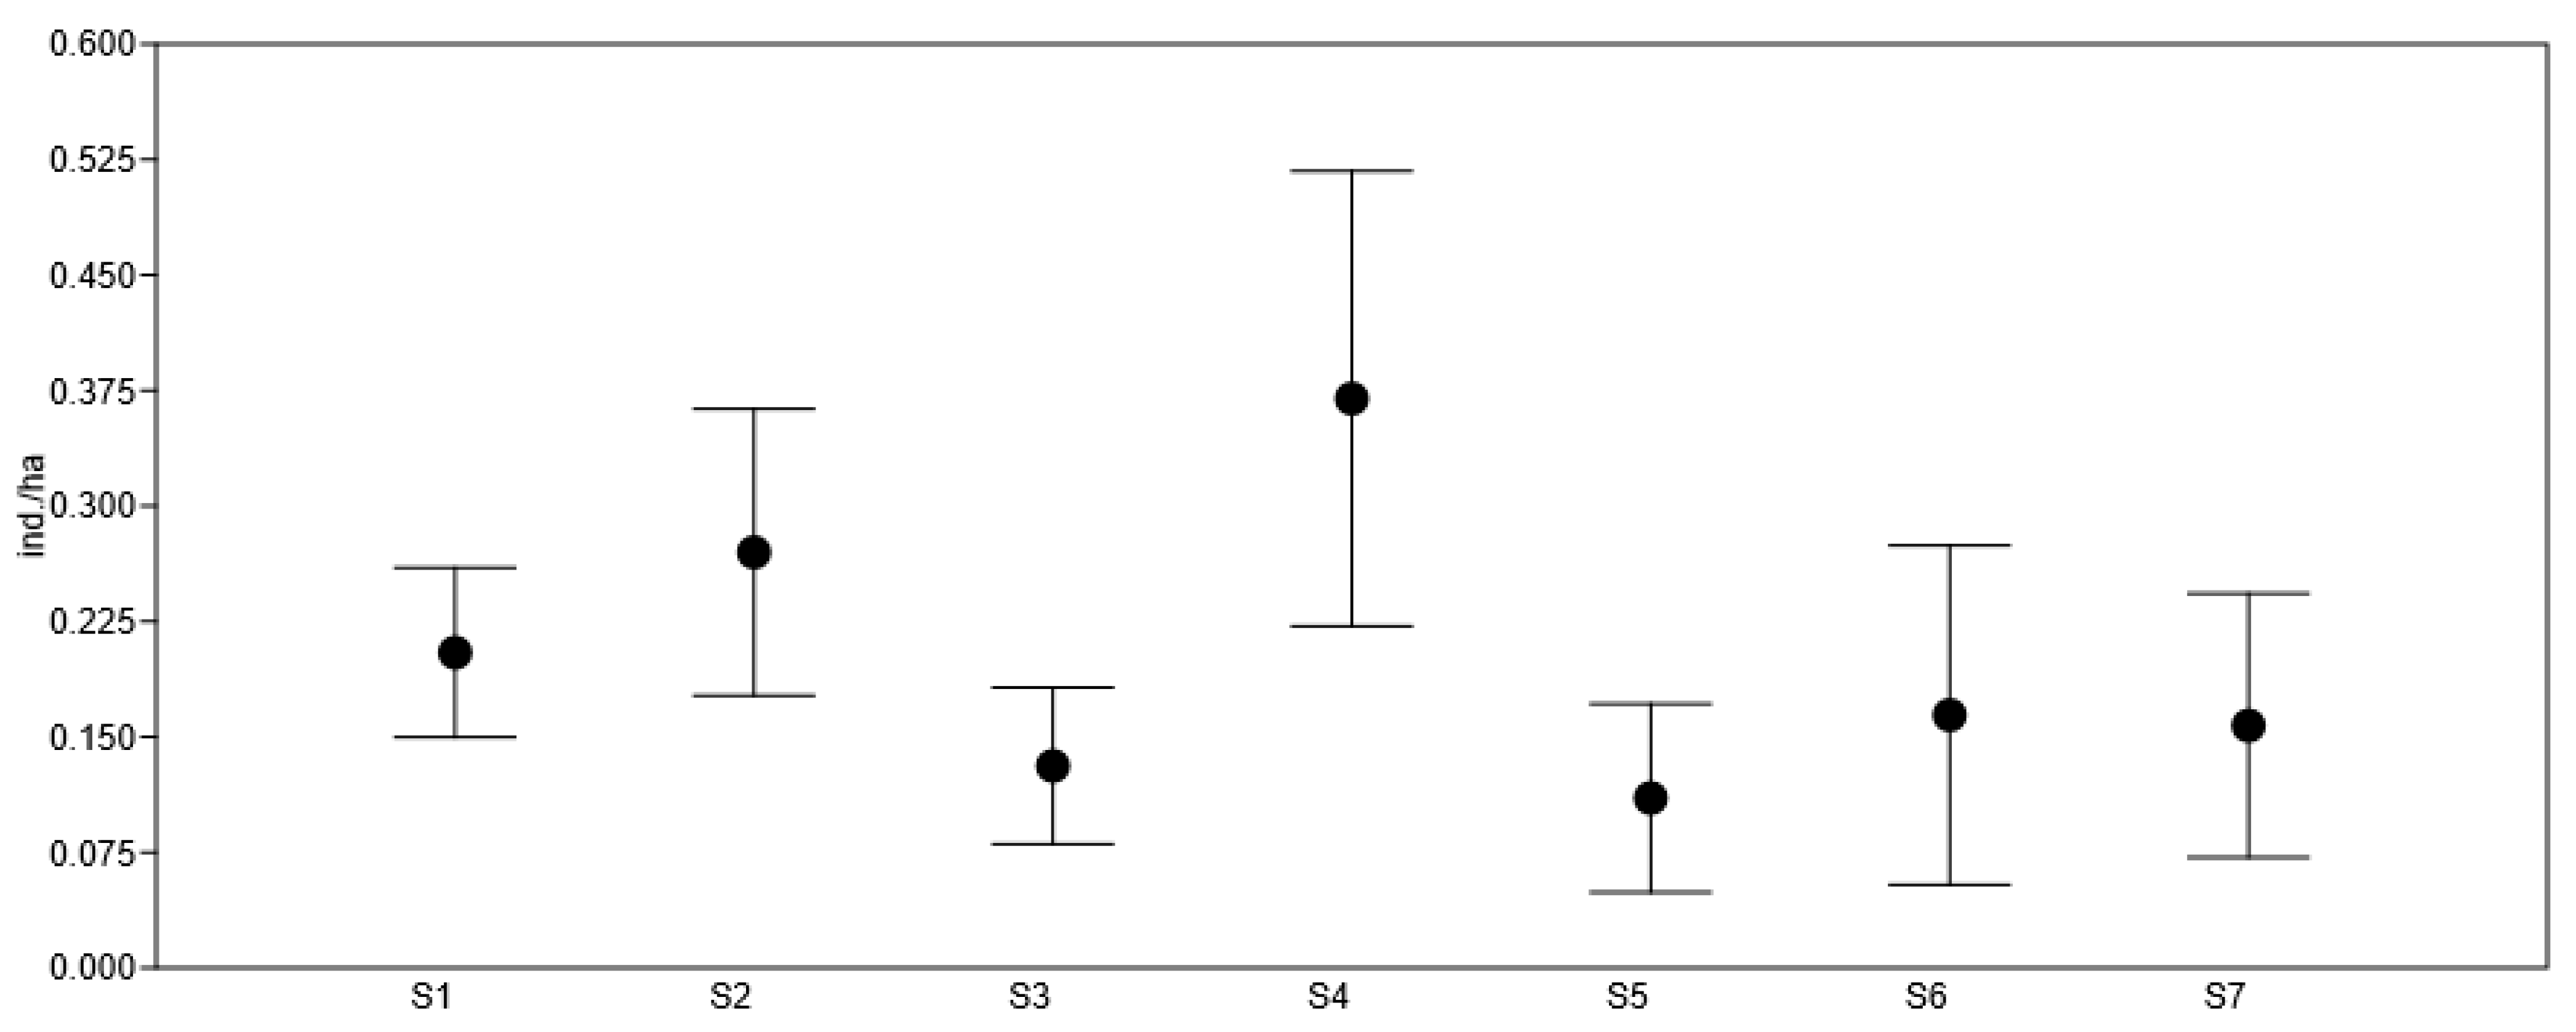
Density estimates derived from simulation of sampling designs covering approximately 50% of the total area were as follows: S2 (53%): 0.269 ± 0.09 ( x ¯ ± S.E.) individuals/ha and S3 (47%): 0.131 ± 0.06 ( x ¯ ± S.E.) individuals/ha (Figure 8). In S2, roe deer presence was confirmed in 16 of 138 quadrats (11.6%), while in S3, presence was confirmed in 9 of 122 quadrats (7.4%).
In simulations covering approximately 25% of the area, the density estimates were as follows: S4 (27%): 0.369 ± 0.15 ( x ¯ ± S.E.) individuals/ha, S5 (26%): 0.11 ± 0.06 ( x ¯ ± S.E.) individuals/ha, S6 (26%): 0.164 ± 0.11 ( x ¯ ± S.E.) individuals/ha, and S7 (21%): 0.086 ± 0.09 ( x ¯ ± S.E.) individuals/ha (Figure 8). Roe deer occurrence in the examined quadrats was as follows: S4: 12 of 71 quadrats (16.9%) confirmed presence, S5: 4 of 68 (7.4%), S6: 4 of 67 (5.9%), and S7: 4 of 54 (7.4%).
Based on the simulated estimates, the calculated mean, minimum and maximum possible population sizes for the entire area (1040 ha) showed substantial discrepancies compared to the roe deer population size, which was observed during the S1 complete aerial count (Table 1).
Among the eighteen estimated population sizes derived from the six estimation simulations performed for the three different sampling scenarios, when compared to the observed population size of 213 individuals, overestimation occurred in 7 cases. At the same time, underestimation was observed in 11 cases.

4. Discussion

The research aimed to examine the applicability of a thermal imaging camera and a DSLR camera mounted on a fixed-wing aircraft for estimating wildlife populations. The method was tested using roe deer, a medium-sized ungulate species, in an intensively cultivated agricultural landscape devoid of forest patches. The effectiveness of aerial population surveys using various types of aircraft is well-documented for large-bodied mammals [35,36,37]. Additionally, different aerial survey-based studies have been conducted for deer species [38,39,40,41,42]. For instance, in an earlier study, fixed-wing aircraft equipped with RGB and infrared cameras have also been successfully applied during winter surveys of red deer and fallow deer; however, roe deer populations were underestimated, likely due to the species’ smaller body size and the presence of partial vegetation cover [43].
Aerial survey techniques have been successfully applied to assess and rescue fawns in roe deer populations [44,45]. The results of the present study demonstrate that, in open habitats, despite the smaller body size of roe deer, individuals could be reliably detected at an altitude of 400 m at a flight speed of 150 km/h. And distinguished from similarly sized species. These findings are supported by the close correspondence between aerial estimates and the results of ground-based control surveys, as well as by the ability to clearly distinguish stray dogs from roe deer.
In addition to the open habitat characteristics, the successful detection was significantly supported by the use of two types of sensors during the survey—thermal imaging and high-resolution digital photography. The dual-camera system is capable of reducing detection errors [46]. The thermal camera enabled the reliable detection of individuals during the morning hours, when the contrast between the animals’ body temperature and the ambient background temperature can still reach its maximum under daylight conditions [47]. The DSLR camera images facilitated image-based validation, helping to eliminate potential overlaps or duplicate detections [43].
Despite the high detection probability, the spatial distribution and group size of the animals can significantly influence the estimation results [48], as confirmed by the various sampling simulations conducted. Based on previous VHF telemetry surveys, the average spring home range of roe deer in the study area was 142 hectares using the Minimum Convex Polygon (MCP) method [49]. In contrast, GPS telemetry studies conducted in other agricultural habitats in Hungary reported a spring home range of 324 hectares using the MCP method [50]. Therefore, it can be assumed that the survey covered the movement range of multiple individuals or groups within the area. For roe deer, home range sizes are known to vary seasonally [51]. Spring is among the seasons characterised by smaller home ranges, and thus, in this case, it can be considered a less influential factor on the estimation outcomes. At the same time, it should be taken into account that species with movement patterns differing from those of the roe deer, such as forest-dwelling red deer, may exert a stronger influence on the applicability of the method due to their more extensive home range [52], higher level of locomotory activity [53] and primarily the greater cover of their habitat. However, our results suggest that in open habitats, the method may be especially promising for estimating the population sizes of ungulate species, such as red deer in Scotland or various antelope species in Africa.
However, the type and height of vegetation may have a greater impact on the accuracy of the estimation [54]. The timing of the survey preceded spring sowing, and the development stage of autumn-sown crops had not yet reached a level that would obstruct the visibility of roe deer. In addition, budburst had not yet occurred, allowing for unobstructed observation of shelterbelts composed of deciduous species. Roe deer activity typically follows a bimodal pattern [55]; the survey was conducted after the early morning activity peak associated with sunrise, making the timing optimal, as the likelihood of double-counting due to high movement activity is reduced during this period. In light of these factors, the estimated total population size and density for the entire study area can be considered reliable. The calculated population density of 0.205 individuals per hectare (20.5 individuals/km2). In Hungarian agricultural habitats, surveys conducted using various ground-based estimation methods have yielded both lower and higher density values, ranging from 9.5 to 32 individuals/km2 [56].
The location and size of roe deer groups influenced the accuracy of the sample-area-based simulation estimates. Solitary individuals and small groups consisting of only two or three animals were negligible. The most frequent group size was six individuals, with an average group size of 9.17. Group size may be influenced by both the population density of the area [57] and the level of human disturbance [58]. The relatively low average group size observed here may be attributed to the undisturbed nature of the study site, which contained no paved roads or inhabited areas. Two huge groups were recorded, comprising 28 and 34 individuals, respectively, and these had a significant impact on the estimated density values derived from the sample-area simulations. Spatially uneven dispersion and local aggregation were reflected in the calculated pairwise and nearest-neighbour distances. While the mean pairwise distance exceeded 1600 m, the nearest-neighbour distance was only slightly above 260 m. This pattern of dispersion is likely driven by the distance-dependent grouping characteristics of roe deer [59] and habitat heterogeneity in agricultural landscapes. As the spatial distribution of shelterbelts, and the seasonal availability of food resources, all of which are known to influence roe deer habitat selection [58]. The results of the sample-area-based estimation simulations demonstrated that the spatial distribution of roe deer strongly influences the reliability of population estimates. Compared to the 100% survey coverage, all simulated sampling configurations exhibited either under- or overestimation errors, depending on whether the sampled transects contained larger group aggregations. For instance, the S4 sample (27%) yielded a density of 0.369 individuals/ha and a maximum estimated population size of 541, which significantly overestimated the actual population. In contrast, the S5 sample (26%) produced a density of only 0.11 individuals/ha, thus underestimating the population. These findings suggest that even with similar sampling proportions, significant variations in population estimates can arise due to underlying spatial patterns.

5. Conclusions

Based on the results, it can be concluded that the method and equipment used in this study are suitable for aerial surveying of ungulate populations in large, open agricultural habitats. At the given flight altitude and speed, the applied sensors were capable of detecting the presence of roe deer. This was achieved with high time efficiency, as surveying 1000 hectares required a net duration of only one hour, making the method both cost-effective and efficient. The object-based image analysis of the thermal camera footage contributed to improving both the accuracy and speed of image processing. The DSLR camera enabled species-level identification. The early spring season before leaf-out, as well as the morning survey timeframe, proved optimal for the study; ground-based control surveys confirmed the reliability of the results. It is important to emphasise that these conclusions pertain to the results of the full-area survey. Due to the aggregative behaviour of roe deer, the plot-based estimation simulations demonstrated substantial variability. Therefore, it is strongly recommended to employ full-coverage aerial surveys for detecting and localising ungulate species in agricultural habitats. Otherwise, estimation errors—both under- and overestimation—may arise due to uneven spatial distribution. Reliable and validated information on the spatial distribution and population characteristics of these animals can be effectively integrated into decision-support systems, which can be used to assess wildlife-related damages and health risks.
Based on the experiences gained during the study, several directions for future research have been identified, some of which are already in the implementation phase. Due to the time-consuming nature of manual validation using standard images, as well as the potential disturbance caused by environmental features (such as stones or water surfaces), nighttime flights conducted during the winter period have gained priority. To reduce double-counting, trial flights have also been conducted with the simultaneous deployment of multiple drones. The processing of recordings from devices equipped with RTK GNSS receivers has already involved the production of orthomosaics, as well as the development of automated image classification and evaluation algorithms. Another potential direction of the study is to conduct test flights over habitat types with higher vegetation cover.

Author Contributions

T.T.: data analysis, visualisation, methodology, and writing—original draft preparation; A.N.: conceptualisation, methodology, and writing—review, supervision; K.C.: methodology, data analysis, and writing—review; G.H., S.K. and G.S.: technical support, field investigation, and methodology; G.K.: field investigation; S.F.: supervision; All authors have read and agreed to the published version of the manuscript.

Funding

This research was funded by the NKFI Found, grant number “VKSZ_12-1-2013-0034”.

Data Availability Statement

Research data are not publicly available due to data protection restrictions. Further inquiries can be directed to the corresponding author.

Acknowledgments

Acknowledgements are due to all individuals who assisted in the research, as well as to the individual who managed the land of the study area, Lajta-Hanság Zrt.

Conflicts of Interest

The authors declare that the research was conducted in the absence of any commercial or financial relationships that could be construed as potential conflicts of interest.

References

  1. El Bilali, H.; Bassole, I.H.N.; Dambo, L.; Berjan, S. Climate change and food security. Agric. For. 2020, 66, 197–210. [Google Scholar] [CrossRef]
  2. Pascual-Rico, R.; Morales-Reyes, Z.; Aguilera-Alcalá, N.; Olszańska, A.; Sebastián-González, E.; Naidoo, R.; Moleón, M.; Botella, J.L.; von Wehrden, F.H.; Martín-López, B.; et al. Usually hated, sometimes loved: A review of wild ungulates’ contributions to people. Sci. Total Environ. 2021, 801, 149652. [Google Scholar] [CrossRef]
  3. Massei, G.; Kindberg, J.; Licoppe, A.; Gačić, D.; Šprem, N.; Kamler, J.; Baubet, E.; Hohmann, U.; Monaco, A.; Ozoliņš, J.; et al. Wild boar populations up, numbers of hunters down? A review of trends and implications for Europe. Pest. Manag. Sci. 2015, 71, 492–500. [Google Scholar] [CrossRef]
  4. Hone, J. How many feral pigs in Australia? An update. Aust. J. Zool. 2020, 67, 215–220. [Google Scholar] [CrossRef]
  5. Lewis, J.S.; Corn, J.L.; Mayer, J.J.; Jordan, T.R.; Farnsworth, M.L.; Burdett, C.L.; VerCauteren, K.C.; Sweeney, S.J.; Miller, R.S. Historical, current, and potential population size estimates of invasive wild pigs (Sus scrofa) in the United States. Biol. Invasions 2019, 21, 2373–2384. [Google Scholar] [CrossRef]
  6. VerCauteren, K.C. The Deer Boom: Discussions on Population Growth and Range Expansion of the White-Tailed Deer; USDA Wildlife Services—Staff Publications: Washington, DC, USA, 2003; p. 281. Available online: https://digitalcommons.unl.edu/icwdm_usdanwrc/281 (accessed on 29 June 2025).
  7. Burbaitė, L.; Csányi, S. Red deer population and harvest changes in Europe. Acta Zool. Litu. 2024, 20, 179–188. [Google Scholar] [CrossRef]
  8. Kiffner, C.; Lee, D.E. Population Dynamics of Browsing and Grazing Ungulates in the Anthropocene. In The Ecology of Browsing and Grazing II. Ecological Studies; Gordon, I., Prins, H., Eds.; Springer: Cham, Switzerland, 2019; Volume 239. [Google Scholar] [CrossRef]
  9. Reimoser, F.; Putman, R. Impacts of wild ungulates on vegetation: Costs and benefits. In Ungulate Management in Europe—Problems and Practices; Putman, R., Apollonio, M., Andersen, R., Eds.; Cambridge University Press: Cambridge, UK, 2011; pp. 144–191. [Google Scholar] [CrossRef]
  10. Marada, P.; Cukor, J.; Linda, R.; Vacek, Z.; Vacek, S.; Havránek, F. Extensive Orchards in the Agricultural Landscape: Effective Protection against Fraying Damage Caused by Roe Deer. Sustainability 2019, 11, 3738. [Google Scholar] [CrossRef]
  11. Bleier, N.; Kovács, I.; Schally, G.; Szemethy, L.; Csányi, S. Spatial and temporal characteristics of the damage caused by wild ungulates in maize (Zea mays L.) crops. Int. J. Pest Manag. 2016, 63, 92–100. [Google Scholar] [CrossRef]
  12. Tari, T.; Horváth, A. Temporospatial characteristics of wild boar rooting damage in maize fields. Rev. Agric. Rural Dev. 2022, 11, 121–125. [Google Scholar] [CrossRef]
  13. Bergmann, H.; Schulz, K.; Conraths, F.J.; Sauter-Louis, C. A Review of Environmental Risk Factors for African Swine Fever in European Wild Boar. Animals 2021, 11, 2692. [Google Scholar] [CrossRef]
  14. VerCauteren, K.C.; Lavelle, M.J.; Hygnstrom, S. From the Field: Fences and Deer-Damage Management: A Review of Designs and Efficacy. Wildl. Soc. Bull. 2006, 34, 191–200. [Google Scholar] [CrossRef]
  15. Geisser, H.; Reyer, H.U. Efficacy of hunting, feeding, and fencing to reduce crop damage by wild boars. J. Wildl. Manag. 2004, 68, 939–946. [Google Scholar] [CrossRef]
  16. Milner-Gulland, E.J.; Bunnefeld, N.; Proaktor, G. The Science of Sustainable Hunting. In Recreational Hunting, Conservation and Rural Livelihoods; Dickson, B., Hutton, B.J., Adams, W.M., Eds.; Blackwell Publishing Ltd.: Oxford, UK, 2009; pp. 73–93. [Google Scholar] [CrossRef]
  17. Jay-Russell, M.; Doyle, M.P. (Eds.) Food Safety Risks from Wildlife; Springer: Cham, Switzerland, 2015; p. 254. [Google Scholar] [CrossRef]
  18. Buckland, S.T.; Goudie, I.B.J.; Borchers, D.L. Wildlife Population Assessment: Past Developments and Future Directions. Biometrics 2000, 56, 1–12. [Google Scholar] [CrossRef] [PubMed]
  19. Enetwild Consortium; Keuling, O.; Sange, M.; Acevedo, P.; Podgorski, T.; Smith, G.; Scandura, M.; Apollonio, M.; Ferroglio, E.; Body, G.; et al. Guidance on estimation of wild boar population abundance and density: Methods, challenges, possibilities. EFSA J. 2018, 15, EN-1449. [Google Scholar] [CrossRef]
  20. Engeman, R.M.; Massei, G.; Sage, M.; Gentle, M.N. Monitoring wild pig populations: A review of methods. Environ. Sci. Pollut. Res. 2013, 20, 8077–8091. [Google Scholar] [CrossRef]
  21. Zhai, Z.; Martínez, J.F.; Beltran, V.; Martínez, N.L. Decision support systems for agriculture 4.0: Survey and challenges. Comput. Electron. Agric. 2020, 170, 105256. [Google Scholar] [CrossRef]
  22. Gonzalez, L.F.; Montes, G.A.; Puig, E.; Johnson, S.; Mengersen, K.; Gaston, K.J. Unmanned Aerial Vehicles (UAVs) and Artificial Intelligence Revolutionizing Wildlife Monitoring and Conservation. Sensors 2016, 16, 97. [Google Scholar] [CrossRef]
  23. Obermoller, T.R.; Norton, A.S.; Michel, E.S.; Haroldson, B.S. Use of drones with thermal infrared to locate white-tailed deer neonates for capture. Wildl. Soc. Bull. 2021, 45, 682–689. [Google Scholar] [CrossRef]
  24. Niwa, H. Assessing the activity of deer and their influence on vegetation in a wetland using automatic cameras and low altitude remote sensing (LARS). Eur. J. Wildl. Res. 2021, 67, 3. [Google Scholar] [CrossRef]
  25. Wang, D.; Shao, Q.; Yue, H. Surveying Wild Animals from Satellites, Manned Aircraft and Unmanned Aerial Systems (UASs): A Review. Remote Sens. 2019, 11, 1308. [Google Scholar] [CrossRef]
  26. Converse, R.L.; Lippitt, C.D.; Koneff, M.D.; White, T.P.; Weinstein, B.G.; Gibbons, R.; Stewart, D.R.; Fleishman, A.B.; Butler, M.J.; Sesnie, S.E.; et al. Remote sensing and machine learning to improve aerial wildlife population surveys. Front. Conserv. Sci. 2024, 5, 1416706. [Google Scholar] [CrossRef]
  27. Christiansen, P.; Steen, K.A.; Jørgensen, R.N.; Karstoft, H. Automated detection and recognition of wildlife using thermal cameras. Sensors 2014, 14, 13778–13793. [Google Scholar] [CrossRef]
  28. Brown, J.; Qiao, Y.; Clark, C.; Lomax, S.; Rafique, K.; Sukkarieh, S. Automated aerial animal detection when spatial resolution conditions are varied. Comput. Electron. Agrc. 2022, 193, 106689. [Google Scholar] [CrossRef]
  29. Xu, Z.; Wang, T.; Skidmore, A.K.; Lamprey, R.; Ngene, S. Bounding box versus point annotation: The impact on deep learning performance for animal detection in aerial images. ISPRS J. Photogramm. Remote Sens. 2025, 222, 99–111. [Google Scholar] [CrossRef]
  30. Faragó, S. A Lajta Project—Egy Tartamos Mezei vad és Ökoszisztéma Vizsgálat 20 Éve; Nyugat-magyarországi Egyetem Kiadó: Sopron, Hungary, 2012. [Google Scholar]
  31. eCognition, Ecognition Developer Reference Book (Ver. 8.9. 1); Trimble Germany GmbH: Munich, Germany, 2013; Available online: https://docs.ecognition.com/v9.5.0/Page%20collection/eCognition%20Suite%20Overview.htm (accessed on 29 June 2025).
  32. Baatz, M.; Schäpe, A. Multiresolution Segmentation: An optimization approach for high quality multi-scale image segmentation. In Angewandte Geogr. Informationsverarbeitung XII; Strobl, J., Blaschke, T., Eds.; Wichmann Verlag: Kalsruhe, Germany, 2000; pp. 12–23. [Google Scholar]
  33. Morellet, N.; Klein, F.; Solberg, E.; Andersen, R. The census and management of populations of ungulates in Europe. In Ungulate Management in Europe—Problems and Practices; Putman, R., Apollonio, M., Andersen, R., Eds.; Cambridge University Press: Cambridge, UK, 2011; pp. 106–143. [Google Scholar] [CrossRef]
  34. Hammer, Ø.; Harper, D.A.T.; Ryan, P.D. Paleontological statistics software package for education and data analysis. Palaeontol. Electron. 2001, 4, 9. [Google Scholar]
  35. Vermeulen, C.; Lejeune, P.; Lisein, J.; Sawadogo, P.; Bouché, P. Unmanned Aerial Survey of Elephants. PLoS ONE 2013, 8, e54700. [Google Scholar] [CrossRef] [PubMed]
  36. LeResche, R.E.; Rausch, R.A. Accuracy and Precision of Aerial Moose Censusing. J. Wildl. Manag. 1974, 38, 175–182. [Google Scholar] [CrossRef]
  37. Schlossberg, S.; Chase, M.J.; Griffin, C.R. Testing the Accuracy of Aerial Surveys for Large Mammals: An Experiment with African Savanna Elephants (Loxodonta africana). PLoS ONE 2016, 11, e0164904. [Google Scholar] [CrossRef]
  38. Zabel, F.; Findlay, M.A.; White, P.J. Assessment of the accuracy of counting large ungulate species (red deer Cervus elaphus) with UAV-mounted thermal infrared cameras during night flights. Wildl. Biol. 2023, 2023, e01071. [Google Scholar] [CrossRef]
  39. Preston, T.M.; Wildhaber, M.L.; Green, N.S.; Albers, J.L.; Debenedetto, G.P. Enumerating white-tailed deer using unmanned aerial vehicles. Wildl. Soc. Bull. 2021, 45, 97–108. [Google Scholar] [CrossRef]
  40. Chrétien, L.P.; Théau, J.; Ménard, P. Visible and thermal infrared remote sensing for the detection of white-tailed deer using an unmanned aerial system. Wildl. Soc. Bull. 2016, 40, 181–191. [Google Scholar] [CrossRef]
  41. Lyu, H.; Qiu, F.; An, L.; Stow, D.; Lewison, R.; Bohnett, E. Deer survey from drone thermal imagery using enhanced faster R-CNN based on ResNets and FPN. Ecol. Inform. 2024, 79, 102383. [Google Scholar] [CrossRef]
  42. Roca, A.; Torre, G.; Giribet, J.I.; Castro, G.; Colombo, L.; Mas, I.; Pereira, J. Efficient endangered deer species monitoring with uav aerial imagery and deep learning. In Proceedings of the 2024 IEEE Biennial Congress of Argentina (ARGENCON), San Nicolás de los Arroyos, Argentina, 18–20 September 2024; pp. 1–8. [Google Scholar] [CrossRef]
  43. Franke, U.; Goll, B.; Hohmann, U.; Heurich, M. Aerial ungulate surveys with a combination of infrared and high–resolution natural colour images. Anim. Biodivers. Conserv. 2012, 35, 285–293. [Google Scholar] [CrossRef]
  44. Israel, M. A UAV-based roe deer fawn detection system. ISPRS Arch. 2011, 38, 51–55. [Google Scholar] [CrossRef]
  45. Cukor, J.; Bartoška, J.; Rohla, J.; Sova, J.; Machálek, A. Use of aerial thermography to reduce mortality of roe deer fawns before harvest. PeerJ 2019, 7, e6923. [Google Scholar] [CrossRef]
  46. Delisle, Z.J.; McGovern, P.G.; Dillman, B.G.; Swihart, R.K. Imperfect detection and wildlife density estimation using aerial surveys with infrared and visible sensors. Remote Sens. Ecol. Conserv. 2023, 9, 222–234. [Google Scholar] [CrossRef]
  47. Havens, K.J.; Sharp, E.J. Properties of Thermal Signatures—Chapter 9. In Thermal Imaging Techniques to Survey and Monitor Animals in the Wild; Havens, K.J., Sharp, E.J., Eds.; Academic Press: New York, NY, USA, 2007; pp. 143–169. [Google Scholar] [CrossRef]
  48. Khaemba, W.M. Spatial point pattern analysis of aerial survey data to assess clustering in wildlife distributions. Int. J. Appl. Earth Obs. Geoinf. 2001, 3, 139–145. [Google Scholar] [CrossRef]
  49. Kocsis, M.; Faragó, S. Az őz (Capreolus capreolus) évszakos területhasználata a Lajta-projektben. In Erdészeti, Környezettudományi, Természetvédelmi és Vadgazdálkodási Tudományos Konferencia–Konferencia Kiadvány; Lakatos, F., Kui, B., Eds.; NymE Kiadó: Sopron, Hungary, 2007; pp. 94–96. [Google Scholar]
  50. Tóth, B.; Bleier, N.; Schally, G.; Lehoczki, R.; Csányi, S. Otthonterület-becslési módszerek összehasonlítása az őz területhasználatának elemzésében. Vadbiológia 2014, 16, 51–62. [Google Scholar]
  51. Morellet, N.; Bonenfant, C.; Börger, L.; Ossi, F.; Cagnacci, F.; Heurich, M.; Kjellander, P.; Linnell, J.D.C.; Nicoloso, S.; Sustr, P.; et al. Seasonality, weather and climate affect home range size in roe deer across a wide latitudinal gradient within Europe. J. Anim. Ecol. 2013, 82, 1326–1339. [Google Scholar] [CrossRef]
  52. Náhlik, A.; Sándor, G.; Tari, T.; Király, G. Space Use and Activity Patterns of Red Deer in a Highly Forested and in a Patchy Forest-Agricultural Habitat. Acta silv. Lignaria Hung. 2009, 5, 109–118. [Google Scholar] [CrossRef]
  53. Náhlik, A.; Heffenträger, G.; Pócza, G.; Sándor, G.; Tari, T. Daytime movements of red deer disturbed by human activity. In Proceedings of the 8th International Deer Biology Congress and International Wildlife Management Symposium, Harbin, China, 27–31 July 2014; pp. 57–59. [Google Scholar]
  54. Tracey, J.P.; Fleming, P.J.S.; Melville, G.J. Accuracy of some aerial survey estimators: Contrasts with known numbers. Wildl. Res. 2008, 35, 377–384. [Google Scholar] [CrossRef]
  55. Stache, A.; Heller, E.; Hothorn, T.; Heurich, M. Activity patterns of European roe deer (Capreolus capreolus) are strongly influenced by individual behaviour. Folia Zool. 2013, 62, 67–75. [Google Scholar] [CrossRef]
  56. Tóth, G.; Katona, K. Comparison of Population Density Estimation Methods for Roe Deer (Capreolus capreolus). Diversity 2024, 16, 500. [Google Scholar] [CrossRef]
  57. Gerard, J.F.; Le Pendu, Y.; Maublanc, M.L.; Vincent, J.P.; Poulle, M.L.; Cibien, C. Large group formation in European Roe deer: An adaptive feature ? Revue d’Écologie 1995, 50, 391–401. [Google Scholar] [CrossRef]
  58. Pays, O.; Fortin, D.; Gassani, J.; Duchesne, J. Group Dynamics and Landscape Features Constrain the Exploration of Herds in Fusion-Fission Societies: The Case of European Roe Deer. PLoS ONE 2012, 7, e34678. [Google Scholar] [CrossRef]
  59. Pays, O.; Benhamou, S.; Helder, R.; Gerard, J.F. The dynamics of group formation in large mammalian herbivores: An analysis in the European roe deer. Anim. Behav. 2007, 74, 1429–1441. [Google Scholar] [CrossRef]
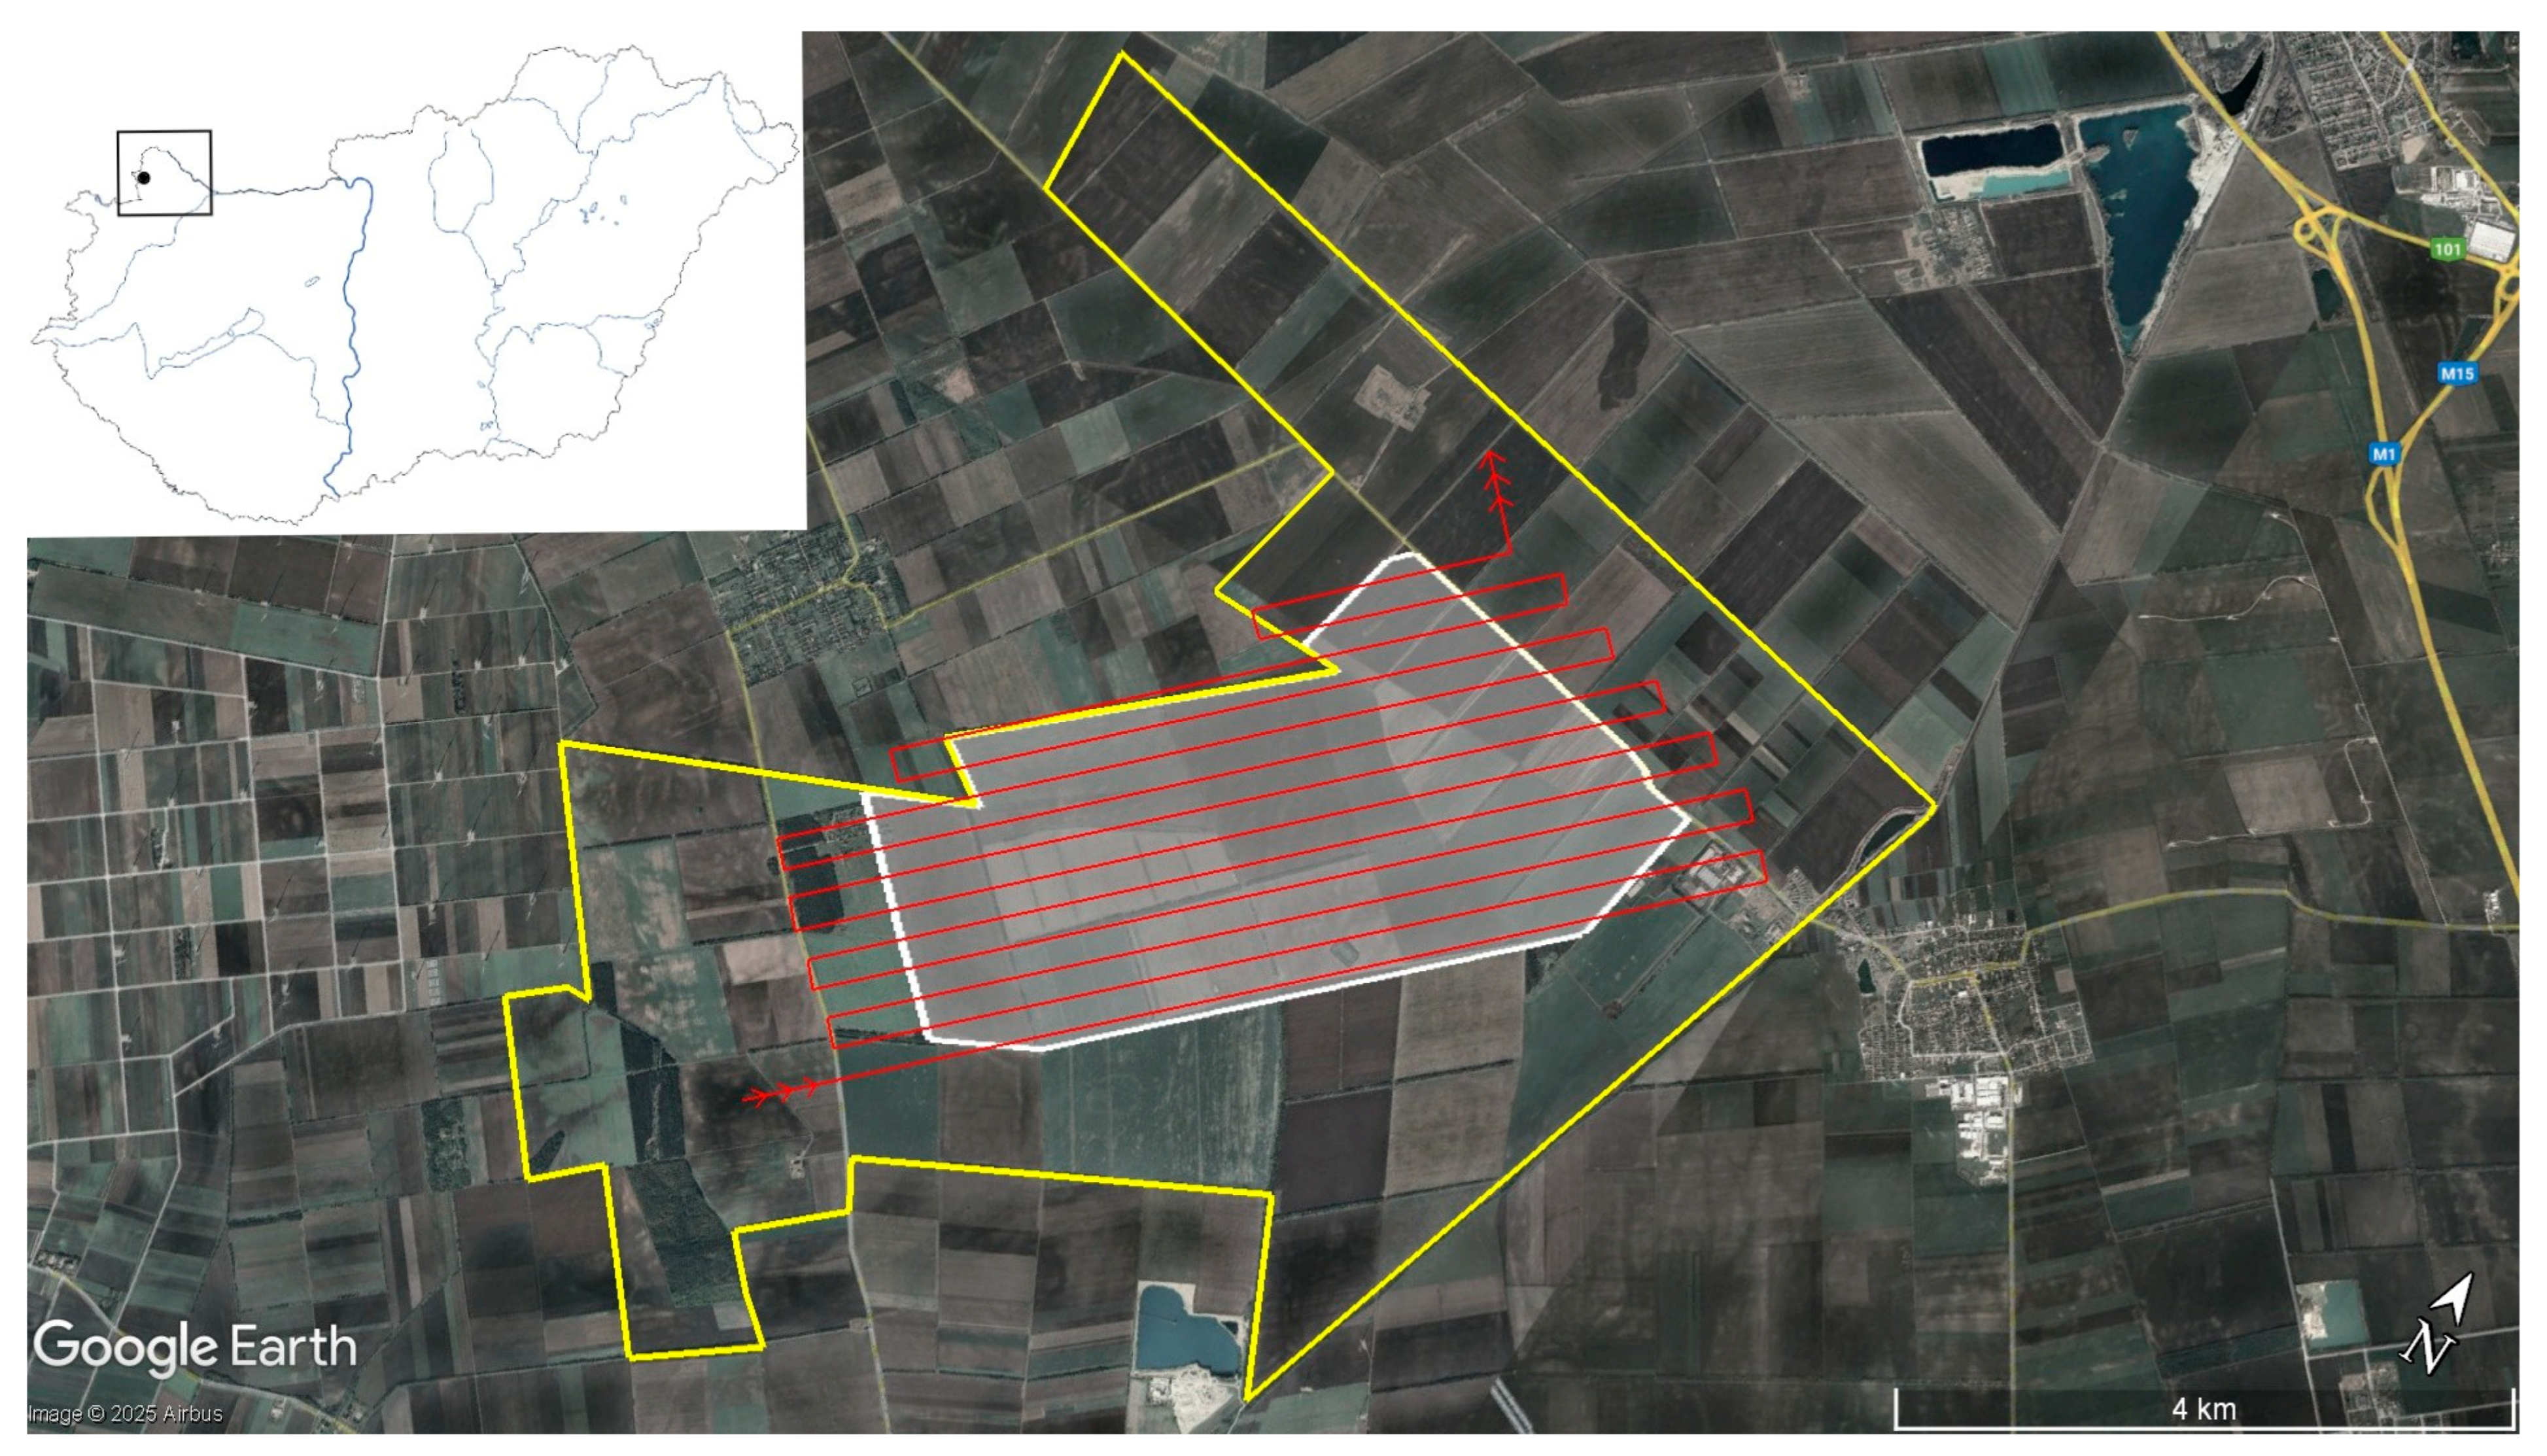
Figure 1. Map of the research area. The yellow line indicates the boundary of the Lajta Project research area, the white area shows the zone monitored by the aerial survey, and the red line represents the aircraft’s route.
Geomatics 05 00053 g001
Figure 2. Survey aircraft equipped with a vibration-dampened pod containing cameras, mounted on the right wing.
Geomatics 05 00053 g002
Figure 3. An example of image processing. (A) thermal image; (B) classified and object-recognised image; (C) DSLR camera image of the validated roe deer group.
Geomatics 05 00053 g003
Figure 4. Map of the survey results. Black circles indicate roe deer locations, white circles indicate stray dog locations, white numbers represent the number of individuals, and white lines delineate the boundaries of the surveyed area.
Geomatics 05 00053 g004
Figure 5. The number of individuals in the observed groups is presented as box plots. Boxes represent the interquartile range (Q1–Q3), the line indicates the median, whiskers show the non-outlier minimum and maximum values, and circles denote statistical outliers.
Geomatics 05 00053 g005
Figure 6. Results of the pairwise distance analysis (A, green) and nearest neighbour distance analysis (B, blue). Boxes represent the interquartile range (Q1–Q3), the line indicates the median, whiskers show the non-outlier minimum and maximum values, and circles denote statistical outliers.
Geomatics 05 00053 g006
Figure 7. The frequency of occurrences of the pairwise distance (A, green) and nearest neighbour distance (B, blue).
Geomatics 05 00053 g007
Figure 8. Results of the various estimation simulations. The black dot indicates the mean value, whiskers represent the ±S.E., and the x-axis displays the different estimation simulations (S1–S7).
Geomatics 05 00053 g008
Table 1. Population estimates calculated from various simulation scenarios.
S2S3S4S5S6S7
Estimated minimum population number187 **74 **229 *52 **56 **70 **
Estimated mean population number281 *136 **385 *115 **171 **164 **
Estimated maximum population number374 *199 **541 *177 **285 *257 *
* overestimated, ** underestimated.
Disclaimer/Publisher’s Note: The statements, opinions and data contained in all publications are solely those of the individual author(s) and contributor(s) and not of MDPI and/or the editor(s). MDPI and/or the editor(s) disclaim responsibility for any injury to people or property resulting from any ideas, methods, instructions or products referred to in the content.