Article

Statistical and Geomatic Approaches to Typological Characterization and Susceptibility Mapping of Mass Movements in Northwestern Morocco’s Alpine Zone

1
Department of Geomorphology and Geomatics, Scientific Institute, Mohammed V University in Rabat, Avenue Ibn Batouta, BP 703, Agdal, Rabat 10080, Morocco
2
School of Public Management, Governance and Public Policy, College of Business & Economics, University of Johannesburg, Auckland Park Kingsway Campus, Johannesburg 2001, South Africa
3
Department of Geology, Faculty of Science, University Abdelmalek Essaâdi, M’Hannech II, P.O. Box 2121, Tetouan 93030, Morocco
4
Geotechnical and Georisks Engineering Laboratory, National Engineering School of Tunis (ENIT), University of Tunis El Manar, P.O. Box 37, Tunis 1002, Tunisia
5
Multidisciplinary Research and Innovation Laboratory, FP Khouribga, Sultan Moulay Slimane University of Beni Mellal, BP. 145, Khouribga 25000, Morocco
6
Superior School of Technology, Sultan Moulay Slimane University, Fkih Ben Salah 23200, Morocco
*
Author to whom correspondence should be addressed.
Geomatics 2025, 5(4), 51; https://doi.org/10.3390/geomatics5040051
Submission received: 20 August 2025 / Revised: 29 September 2025 / Accepted: 1 October 2025 / Published: 3 October 2025

Abstract

The Rif Mountains in northern Morocco are highly exposed to geohazards, particularly earthquakes and mass movements. In this context, the Zoumi region is most affected, showing various mass movement types involving both unconsolidated and solid materials. This study evaluates the region’s susceptibility to mass movements using logistic regression (LR), applied for the first time in this area. The model incorporates eight key predisposing factors known to influence mass movement: slope gradient, slope aspect, land use, drainage density, elevation, lithology, fracturing density, and earthquake isodepths. Historical mass movements were mapped using remote sensing and field surveys, and statistical analysis calculation was conducted to analyze their spatial correlation with these environmental conditioning factors. A mass movement susceptibility (MMS) map was produced, classifying the region into four susceptibility levels, ranging from low to very high. Landslides were the most frequent movement type (36%). The LR model showed strong predictive performance, with an AUC of 88%, confirming its robustness. The final map reveals that 42% of the Zoumi area falls within the high to very high susceptibility zones. These results highlight the importance of using advanced modeling approaches to support risk mitigation and land use planning in environmentally sensitive mountain regions.

1. Introduction

In the annual United Nations reports on disaster risk reduction (UNDRR), the statistics present various data on the damage and losses related to disaster risks considered the most dominant and dangerous. Among these, mass movements represent a natural phenomenon that can threaten various element whether environmental, social, or economic through multifactorial anomalies of climatic, geological, or sometimes both origins [1].
The geological literature indicates that Morocco, particularly its northern part, is characterized by high exposure to hazards related to mass movements. This situation is mainly due to the intraplate convergence between Africa and Eurasia, which generates seismic activity likely to increase the occurrence of ground instability [2,3,4]. Furthermore, the lithological diversity of this mountainous region also contributes to the existence of various types of deformations, ranging from rockfalls to landslides. In addition, the humid climate of the Rif Mountain range, part of the Moroccan Alpine arc, plays a significant role in these terrestrial morphological deformations. Periods of intense or torrential rainfall lead to the reconfiguration of the soil’s mechanical properties, resulting in a loss of stability. The combination of these natural factors with other topographic and anthropogenic factors increases the frequency and severity of these hazards, thus representing a major threat to the population, economic activities, and infrastructure [5].
Establishing a classification typology of mass movements in mountainous region proves to be particularly challenging, primarily due to the significant heterogeneity in geological materials, the variety of movement processes, and the increasingly intricate landforms associated with larger-scale events [6]. Differentiating between various types of slope failures necessitates the analysis of multiple factors, including the velocity and dynamics of movement, the nature of the displaced material, the deformation behavior, and the structural configuration of the mobilized mass [7]. As a result, it is unsurprising that numerous classification schemes have been proposed over the years, often leading to inconsistencies or overlapping terminologies. One of the earliest and most influential systems was introduced by Sharpe in 1938 [8], laying foundational groundwork that continues to inform modern approaches. Since then, several updated and more nuanced classification models have emerged [7,9,10,11,12,13].
Despite significant efforts in recent years to prevent mass movements in the Rif, the frequency of such events continues to rise, causing damage even in areas previously classified as having low or negligible susceptibility [14,15,16]. This increase can be attributed to several factors:
  • Lack of consideration for the broader geodynamic context: Many assessments fail to integrate factors such as seismicity, active tectonics, and irregular, intense rainfall within the watershed’s dynamics.
  • Use of inadequate methods: Many studies rely on approaches based solely on expert opinion or experience, rather than rigorous quantitative methods [17].
  • Poor selection of the mapping scale and predisposing factors: Incorrect methodological choices, including inappropriate scale and factor selection, lead to inaccurate susceptibility assessments.
The objective of this study was to assess the mass movement susceptibility of the Zoumi region. This area, located in the heart of the Rif Mountain range, is characterized by the presence of numerous factors predisposing it to mass instability, as well as a long history marked by various types of such hazards. The development of the susceptibility map is based on the use of logistic regression, which highlights the correlation between eight geological, topographic, hydrological, and environmental variables and a database of recorded historical MMs, classified according to their typology. Furthermore, this study also aims to analyze the typological distribution of mass movements in relation to the studied variables, with the goal of better understanding the dominant type and its natural characteristics.
The issue of MM in the studied region, as well as the assessment of their susceptibility level, is not a new subject. The Zoumi area has indeed experienced a notable frequency of such hazards, and several previous studies have already addressed this issue using various methods and approaches [18]. However, the innovation of this work lies in the application of one of the machine learning models, logistic regression, as an advanced classification model. This model is well known for its ability to process and classify data related to this type of issue, as well as for its performance in delivering reliable and credible results. Its effectiveness has been verified and validated in numerous research studies focusing on assessment, hazard, susceptibility, and vulnerability to natural risks in various national regions and countries at the international level [19,20,21]. Additionally, an analytical approach is integrated into the results to provide a deeper understanding of the spatial distribution of mass movements, statistics related to their typology, and the characteristics that favor the occurrence of each type of mass movement.
At the global scale, natural hazard management is based on four fundamental concepts: hazard, vulnerability, susceptibility, and risk. Each of these principles plays a crucial role in the understanding of, management of, prevention, and of reduction in the impacts of natural disasters. The MMS map generated through LR can serve as a valuable tool for the local community, NGOs, and stakeholders involved in natural risk management [22]. It allows for the identification of high-risk areas, thereby facilitating the implementation of prevention strategies and intervention plans aimed at protecting infrastructure, the environment, and socio-economic activities.

2. Study Area

The study focuses on a small town situated in the province of Ouezzane, in the Tanger-Tétouan-Al Hoceima region, in the north of Morocco. It is about 70 km south of the city of Tanger and an equivalent distance from Tétouan (Figure 1). Zoumi is ideally positioned between the Rif mountains and the coastal plain, giving it a unique natural wealth. In this context, Zoumi benefits from fertile agricultural lands due to its temperate climate and rich soils, which allow for significant olive production, especially since agriculture is one of the main economic activities. Furthermore, the surrounding mountains and the proximity to the Mediterranean coast offer tourism potential, particularly for ecotourism, thanks to the beauty of its landscapes and the diversity of its wildlife and flora.
In terms of geology, the Moroccan Rif forms part of the extensive Alpine orogenic system, which stretches from the Betic Cordillera in southern Spain, arcs across the Strait of Gibraltar, and continues into northern regions of Africa. The movement of tectonic thrust sheets in this area describes a curved pattern spanning roughly 180°, with compressional forces pushing northward in Spain, westward near the Gibraltar region and northwestern Rif, and southward in the eastern Rif as well as the Tell mountains of Algeria and Tunisia. Numerous geological studies have linked this distinctive arc-shaped deformation to a Tertiary-era convergence involving a small lithospheric block the Alboran domain, alongside the Iberian and African tectonic plates [23].
The specific region under investigation lies along the northern fringe of the central Rif in northwestern Morocco. This structural unit is positioned between two major tectonic domains: the external thrust systems to the west, referred to as the Mesorif, and the internal thrust sheets to the east, known as the Intrarif. The prevailing thrusting direction in this segment trends toward the west-southwest. Stratigraphically, the Zoumi thrust complex begins with a basal layer of white marine Eocene deposits, varying between 0 and 100 m in thickness, overlain by a significant accumulation (1000–1500 m) of Zoumi Sandstone, dated from the Late Early Oligocene to the Middle Miocene. This stratigraphic sequence is topped by around 50 m of mid-Miocene olistostromal deposits and fine-grained turbiditic beds [24]. Sandstone formations dominate roughly 95% of the Zoumi region and were formerly assigned to the inner Mesorif division. The key structural units identified in the Zoumi area include: (a) the Intra-Rif formations, namely the Loukkos and external Tangier sectors, (b) the Meso-Rif represented by the Zoumi sandstone complex, and (c) the Pre-Rif, consisting of the Ouazzane thrust sheet.

3. Materials and Methods

3.1. Data Preparation

Mass movements, in all their forms of deformation, manifest through numerous geological, topographical, and climatic anomalies. The study or assessment of these geomorphological deformations relies on the definition of all predisposed parameters, which are then treated as numerical variables. Furthermore, the preparation processes follow distinct approaches that vary from one factor to another due to the diversity of data sources.
The following subsections provide a general overview of the approaches adopted to identify the parameters included in this study, considered as the most predisposing factors to MM, as well as the necessary guidelines for inventorying historically deformed points.

3.1.1. Data Used

Determining and mapping a relevant set of predisposing factors associated with mass movement events (the dependent variable) requires a foundational understanding of the primary mechanisms that drive such phenomena. The methodological approach adopted follows a widely accepted geological concept: “Past and present processes inform predictions of future behavior” [5]. Central to the assessment of mass movement susceptibility is the idea that the spatial and physical characteristics of historical slope failures can serve as indicators for identifying areas likely to experience similar events in the future. In alignment with this concept, comprehensive datasets were compiled, incorporating records of known mass movements along with corresponding conditioning variables (independent factors).
The eight factors selected to assess the susceptibility of mass movements in this study area were collected from various sources, namely the digital elevation model, which provides information mainly related to local topographic characteristics such as elevation, slope, exposure, and the hydrographic network. During the process of extracting these variables, the resolution of the digital terrain model plays a crucial role in the quality of the information obtained. Indeed, the higher the resolution, the greater the accuracy and level of detail of the spatial information. In this study, the digital terrain model used has a generally high resolution of 30 m. Although other models with finer resolutions exist, this resolution (30 m) is the only data available for the study area’s territory.
The regional geological map also provides two key parameters responsible for mass movements: soil type (lithology) and the distribution of tectonic structures (Faults). Additionally, the satellite image effectively contributes to extracting spatial information from the soil, particularly regarding land use, and facilitates fieldwork during the inventory phase of mass movements (Table 1). This last phase is of paramount importance for the objective of this work, which allows for the inventory and quantification of the four types of mass movements (landslides, rockfalls, creep, and debris flow.), thereby facilitating the extraction of specific characteristics for each type (Table 2).

3.1.2. Inventory and Description of Mass Movements

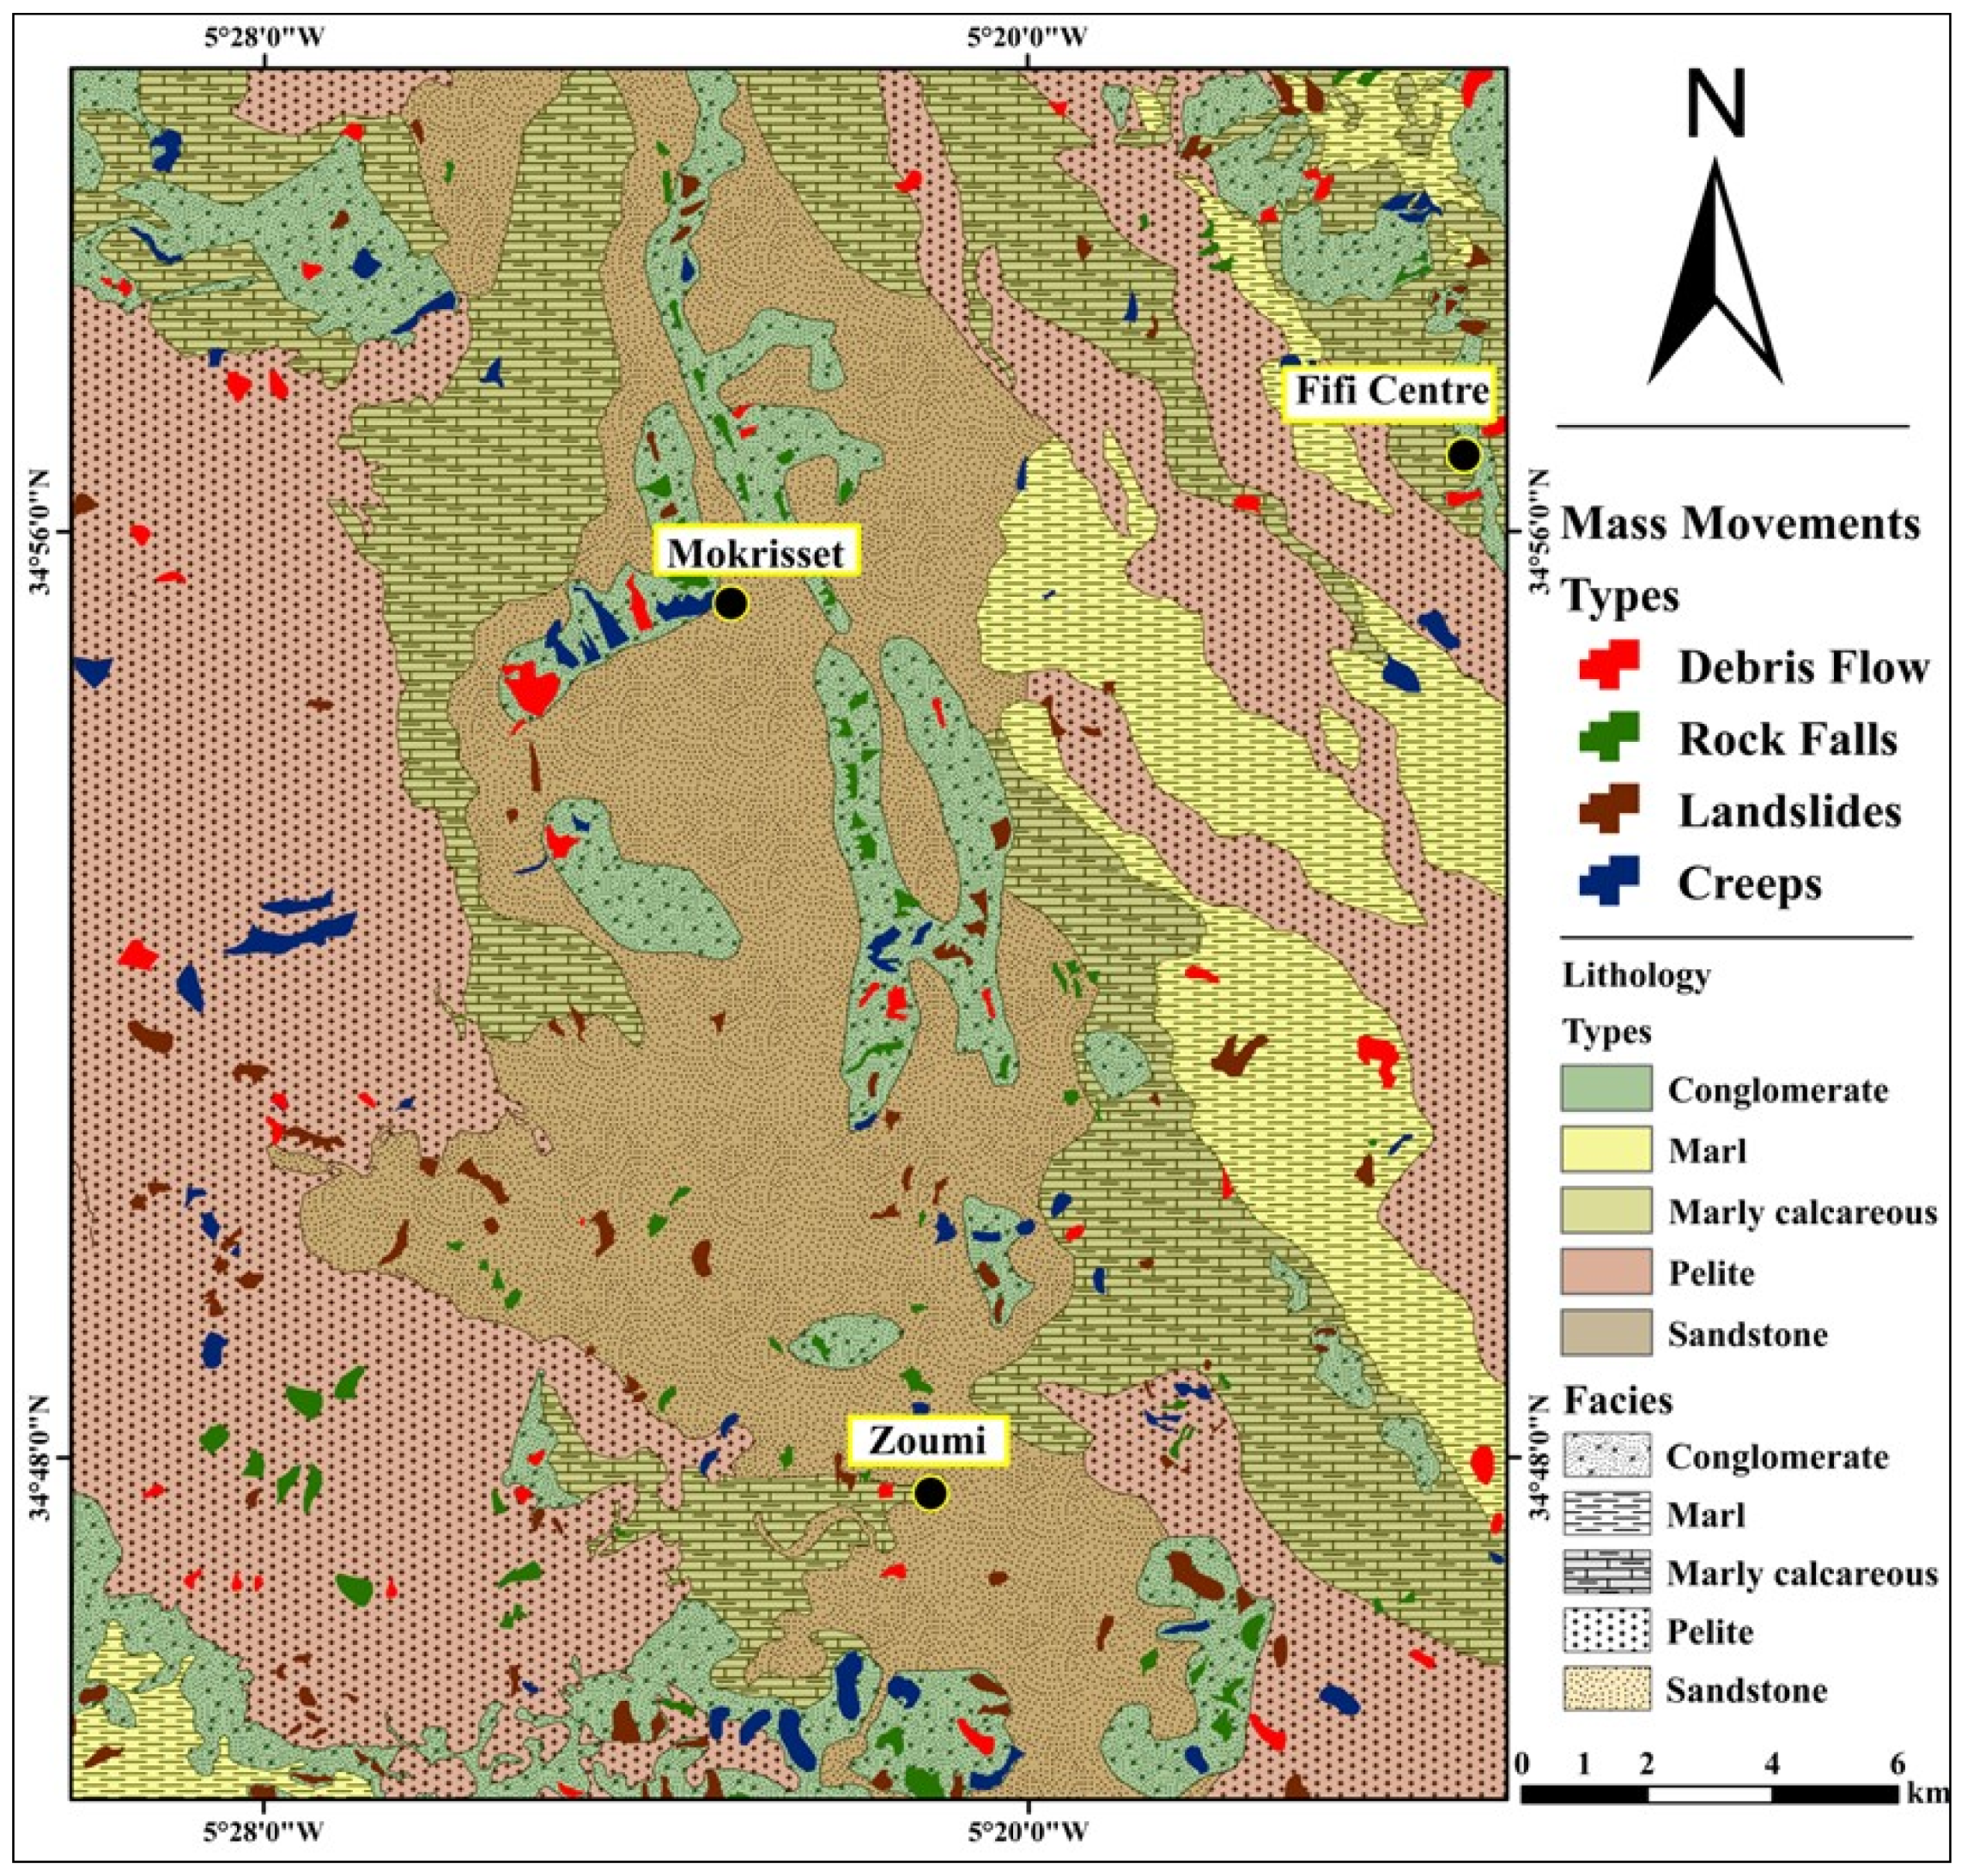
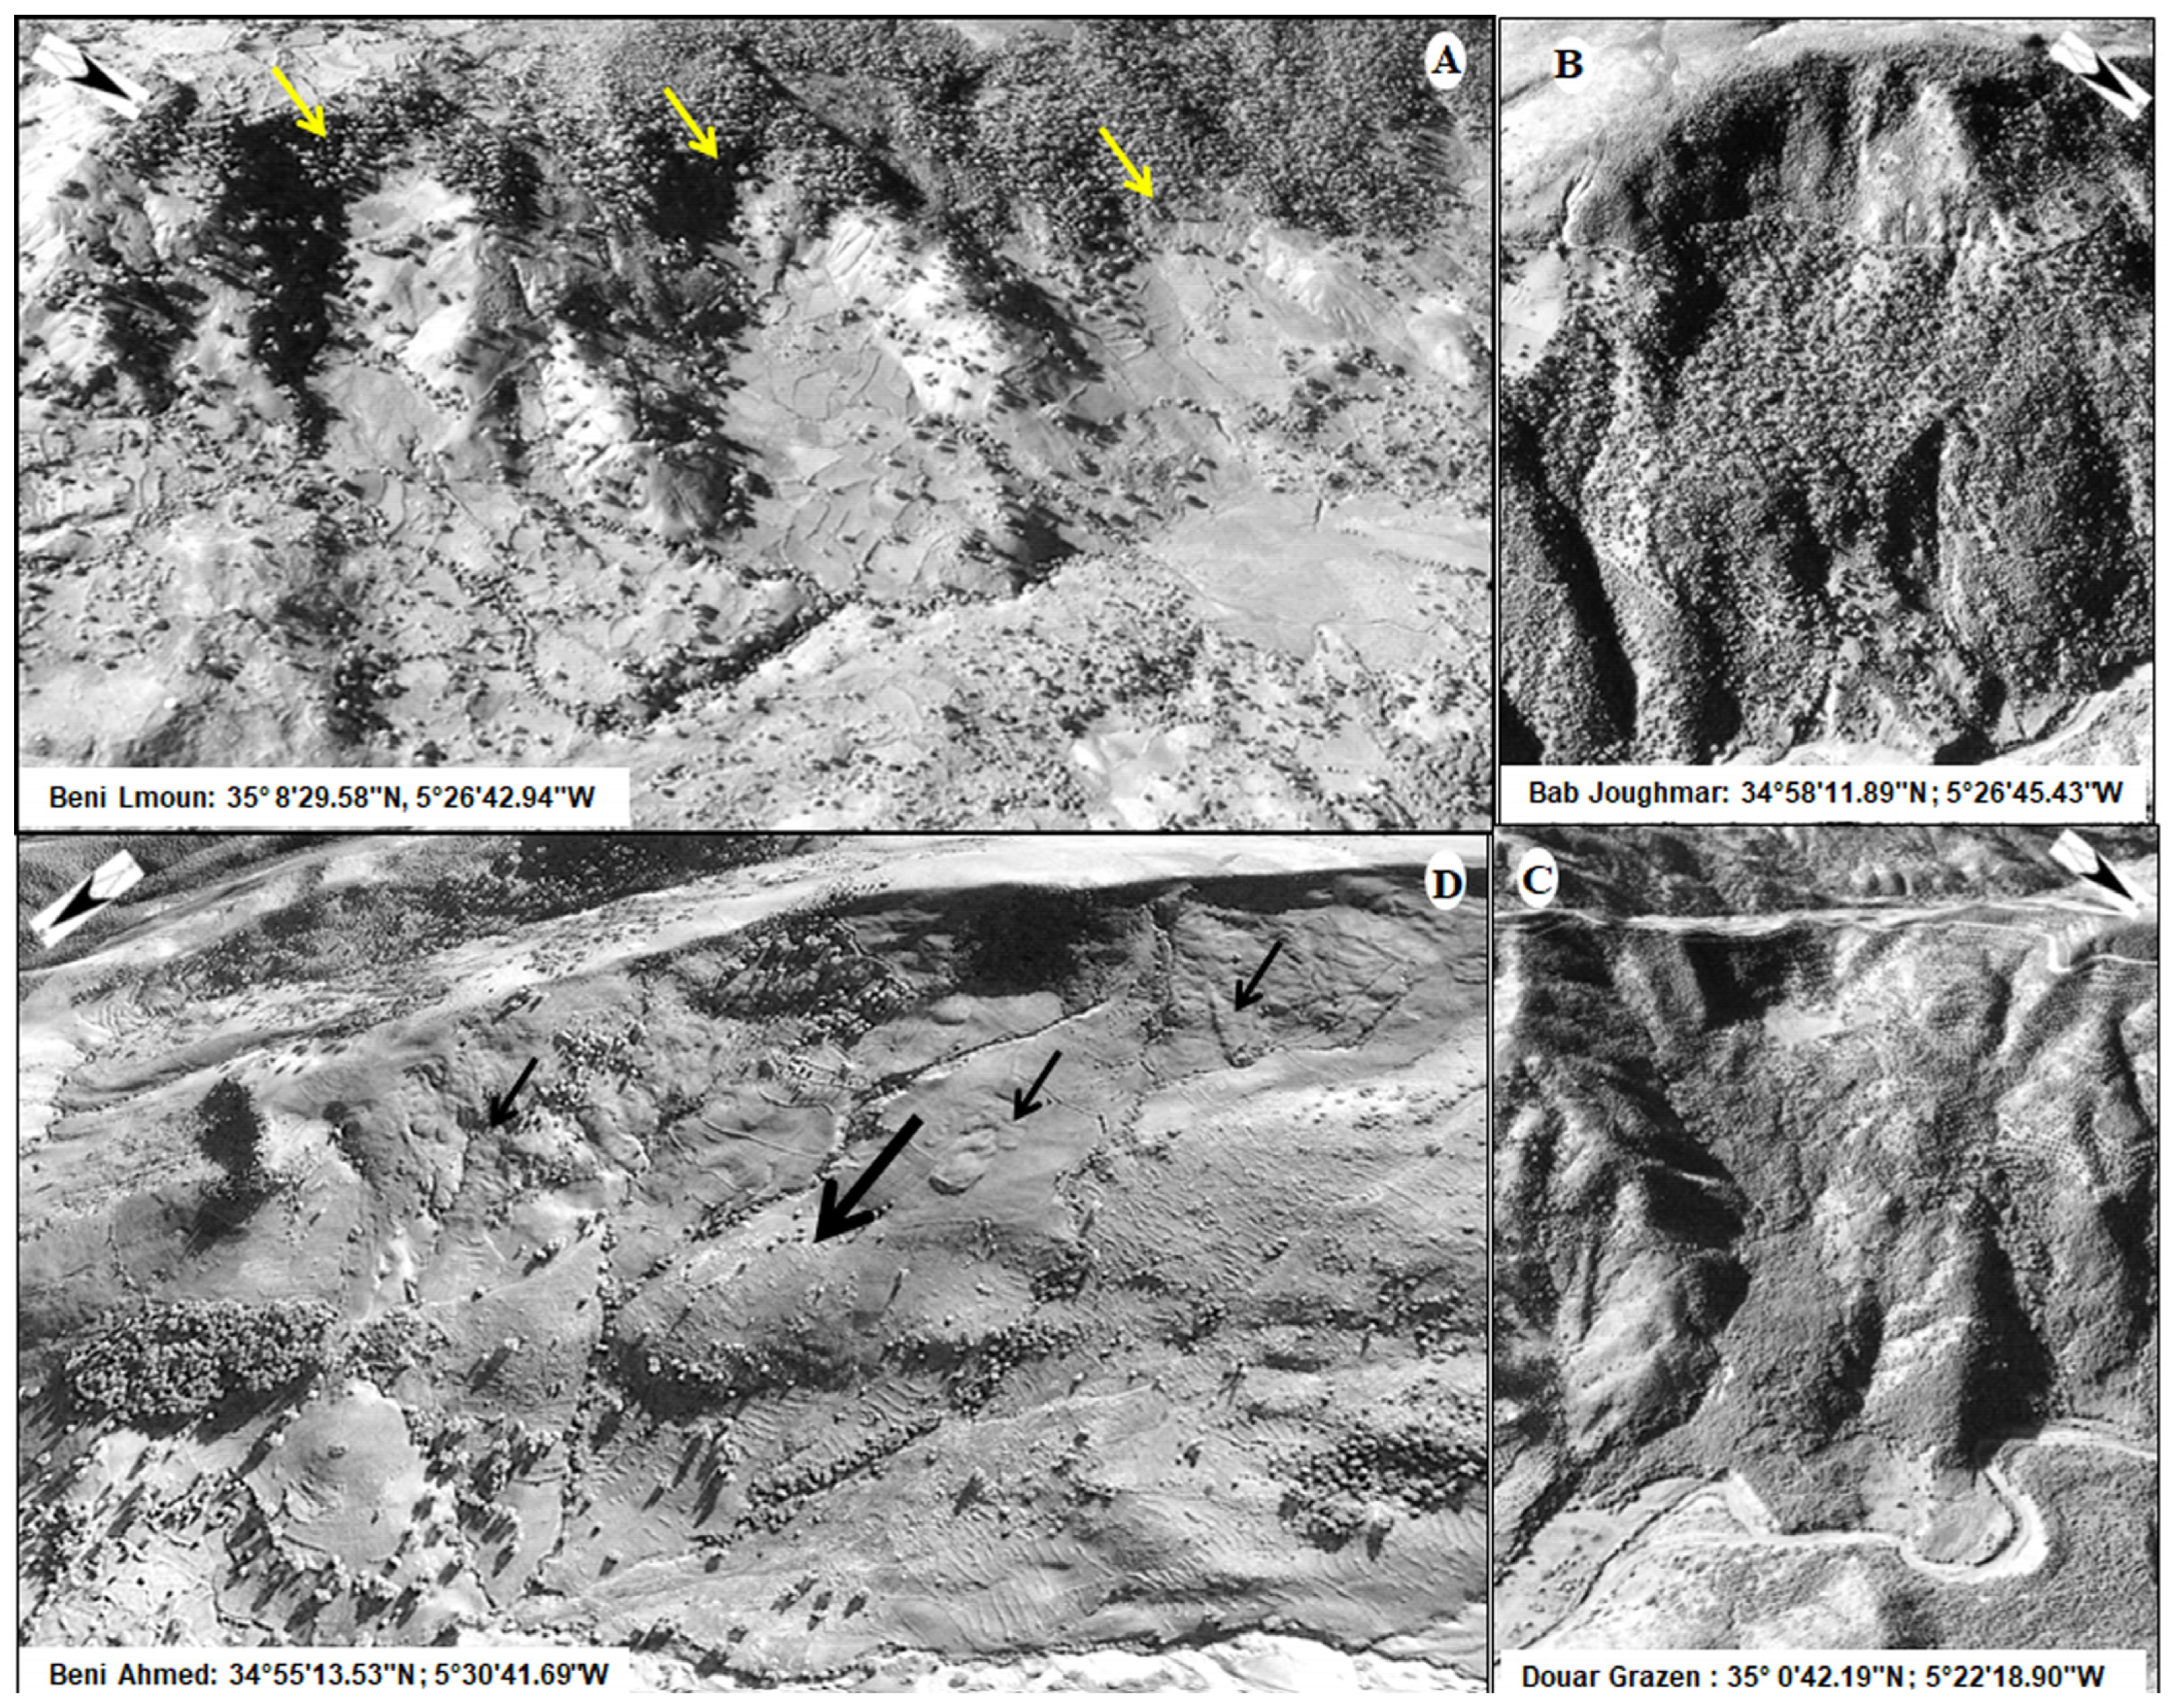
To inventory and map the mass movement activity in the Zoumi region, a combination of aerial imagery at scales of 1:17,000 and 1:20,000, high-resolution satellite data, and existing geomorphological maps were utilized. This remote sensing technics was further supported and confirmed through on-site field investigations. In total, 286 individual mass movement events were identified (Figure 2 and Figure 3), collectively spanning an area of 24 square kilometers. This accounts for roughly 0.04% of the entire study region, which encompasses 610 square kilometers. The recorded landslide areas varied in size, ranging from a minimum of 0.007 km2 to a maximum of 0.578 km2, with an average area of 0.082 km2.

3.2. Research Methodology

In general, the assessment of susceptibility to mass movements in the territory of the Zoumi region, as well as the understanding of the geomorphological models of these hazards, relies on the monitoring of interconnected steps and processes, starting with the collection of data and predisposing parameters from various sources, such as geological maps, digital terrain models, etc., along with a thorough survey and inventory of landslides with a detailed classification of their typologies (Figure 4).
The collected data undergo an analytical approach that allows the deduction of the frequency and spatial density of each type of movement within the study area, as well as the identification of the environmental characteristics most favorable to each type of movement. The experimental component of this research methodology is mainly based on the application of the logistic regression model to determine the influence weights of the predisposing parameters and to develop the LSM (Landslide Susceptibility Map).

3.2.1. Logistic Regression Model

Logistic regression (LR) remains one of the most widely employed statistical techniques in geosciences, particularly effective when the dependent variable is binary typically represented as presence vs. absence, 0 vs. 1, or true vs. false [27]. It accommodates both numerical and categorical explanatory variables, allowing for flexible modeling of complex natural phenomena. In the context of mass movement susceptibility analysis, LR aims to develop an optimal and interpretable model that describes the relationship between the occurrence (or absence) of mass movements and a series of predisposing factors, such as drainage patterns, slope gradient, aspect, and geological substrate. The logistic model produces statistical outputs and regression coefficients that are used to compute a logit a logarithmic transformation expressing the odds of an event occurring (i.e., the likelihood of a landslide taking place). While LR does not directly quantify susceptibility, it allows such an interpretation through calculated probabilities. Typically, the LR model is formulated as a linear equation applied to the logit function Equation (1).
log y = a + b 1 x 1 + b 2 x 2 + b 3 x 3 + e
In this context, “y” denotes the binary response variable, while x1, x2, and x3 represent the explanatory or predisposing factors influencing the occurrence of mass movements. The parameter a refers to the intercept (constant term), and b1, b2, b3 are the regression coefficients that quantify the influence of each respective triggering factor. The term e accounts for the model’s residual error. The log(y), which is the natural logarithm of the odds of the event occurring Equation (2): Moreover, in this formulation, p represents the probability that the event y occurs, while the ratio p (1 − p) expresses the odds of occurrence. To revert the logit transformation and retrieve the actual probability value, Equation (2) can be reformulated as follows Equation (3):
log y = ln p 1 p
p = e x p ( a + b 1 x 1 + b 2 x 2 + b 3 x 3 + ) 1 + e x p ( a + b 1 x 1 + b 2 x 2 + b 3 x 3 +
A key strength of logistic regression lies in its ability to incorporate both continuous and categorical variables, individually or in combination, by applying a suitable link function to the standard linear regression framework. Additionally, it does not require the input variables to follow a normal distribution.

3.2.2. Correlational Analysis of Predisposing Factors

Research utilizing logistic regression models has not yielded a standardized set of predictors (independent) variables to be universally applied in mass movement susceptibility assessments [27,28]. In some areas, topographic features emerge as the dominant influencing factors, whereas in other regions, geological and environmental characteristics are considered equally or more relevant. In the present study, the chi-square test (χ2) Equation (4) was employed to evaluate the statistical relationship between each explanatory variable and the presence of mass movements. To further assess the strength and nature of these associations, Cramer’s V statistic Equation (5) was calculated based on the chi-square results [29,30].
x 2 = i = 1 r j = 1 c ( o i j T i j ) 2 T i j
In this context, (Oij) denotes the observed frequency within cell ij, whereas (Tij) represents the expected frequency under the assumption of independence for the same cell. The variables r and c correspond to the total number of rows and columns in the contingency table, respectively.
V = x 2 n ( L 1 )
In the last equation, n refers to the total number of observations, and L is defined as the smaller value between the number of rows and columns. Cramer’s V coefficient, which ranges from 0 to 1 [31], offers a normalized measure of association. It quantifies the divergence between the observed data distribution and what would be expected if no association existed, while adjusting for the influence of sample size and the table’s dimensions.
To ensure the absence of multicollinearity among the explanatory variables included in our model, we performed an analysis of the Variance Inflation Factor (VIF). This method quantifies the degree of linear correlation between each independent variable and the set of other explanatory variables in the model [32,33]. High VIF values indicate that a variable is strongly correlated with one or more other variables, which may undermine the stability and interpretability of the estimated coefficients. In this study, a conservative threshold of VIF < 5 was adopted, in line with commonly accepted methodological recommendations in the literature [34].
Generally, the application of numerical models in the physical, chemical, and natural domains can expose uncertainties and margins of error primarily associated with the nature and size of the datasets used, as well as the model’s performance in processing this type of data. To assess the capability of the LR model in handling the collected data, the receiver operating characteristic (ROC) curve offers the advantage of allowing the performance of a model to be deduced from two key concepts integrated into its equation: sensitivity is the true positive rate, representing the number of correctly identified positive cases Equation (6), and specificity is the true negative rate, representing the number of correctly identified negative cases Equation (7) [35]. Although the literature suggests that model performance is considered acceptable if the AUC value exceeds 0.5 or 50%, in areas related to natural risks, the AUC value should be greater than 0.75 or 75% [36,37].
S e n s i t i v i t y = T r u e   P o s i t v e T r u e   P o s i t v e + F a l s e   N e g a t i v e
S p e c i f i c i t y = T r u e   N e g a t i v e T r u e   N e g a t i v e + F a l s e   N e g a t i v e

4. Results

4.1. Analysis of Mass Movements Predisposing Factors

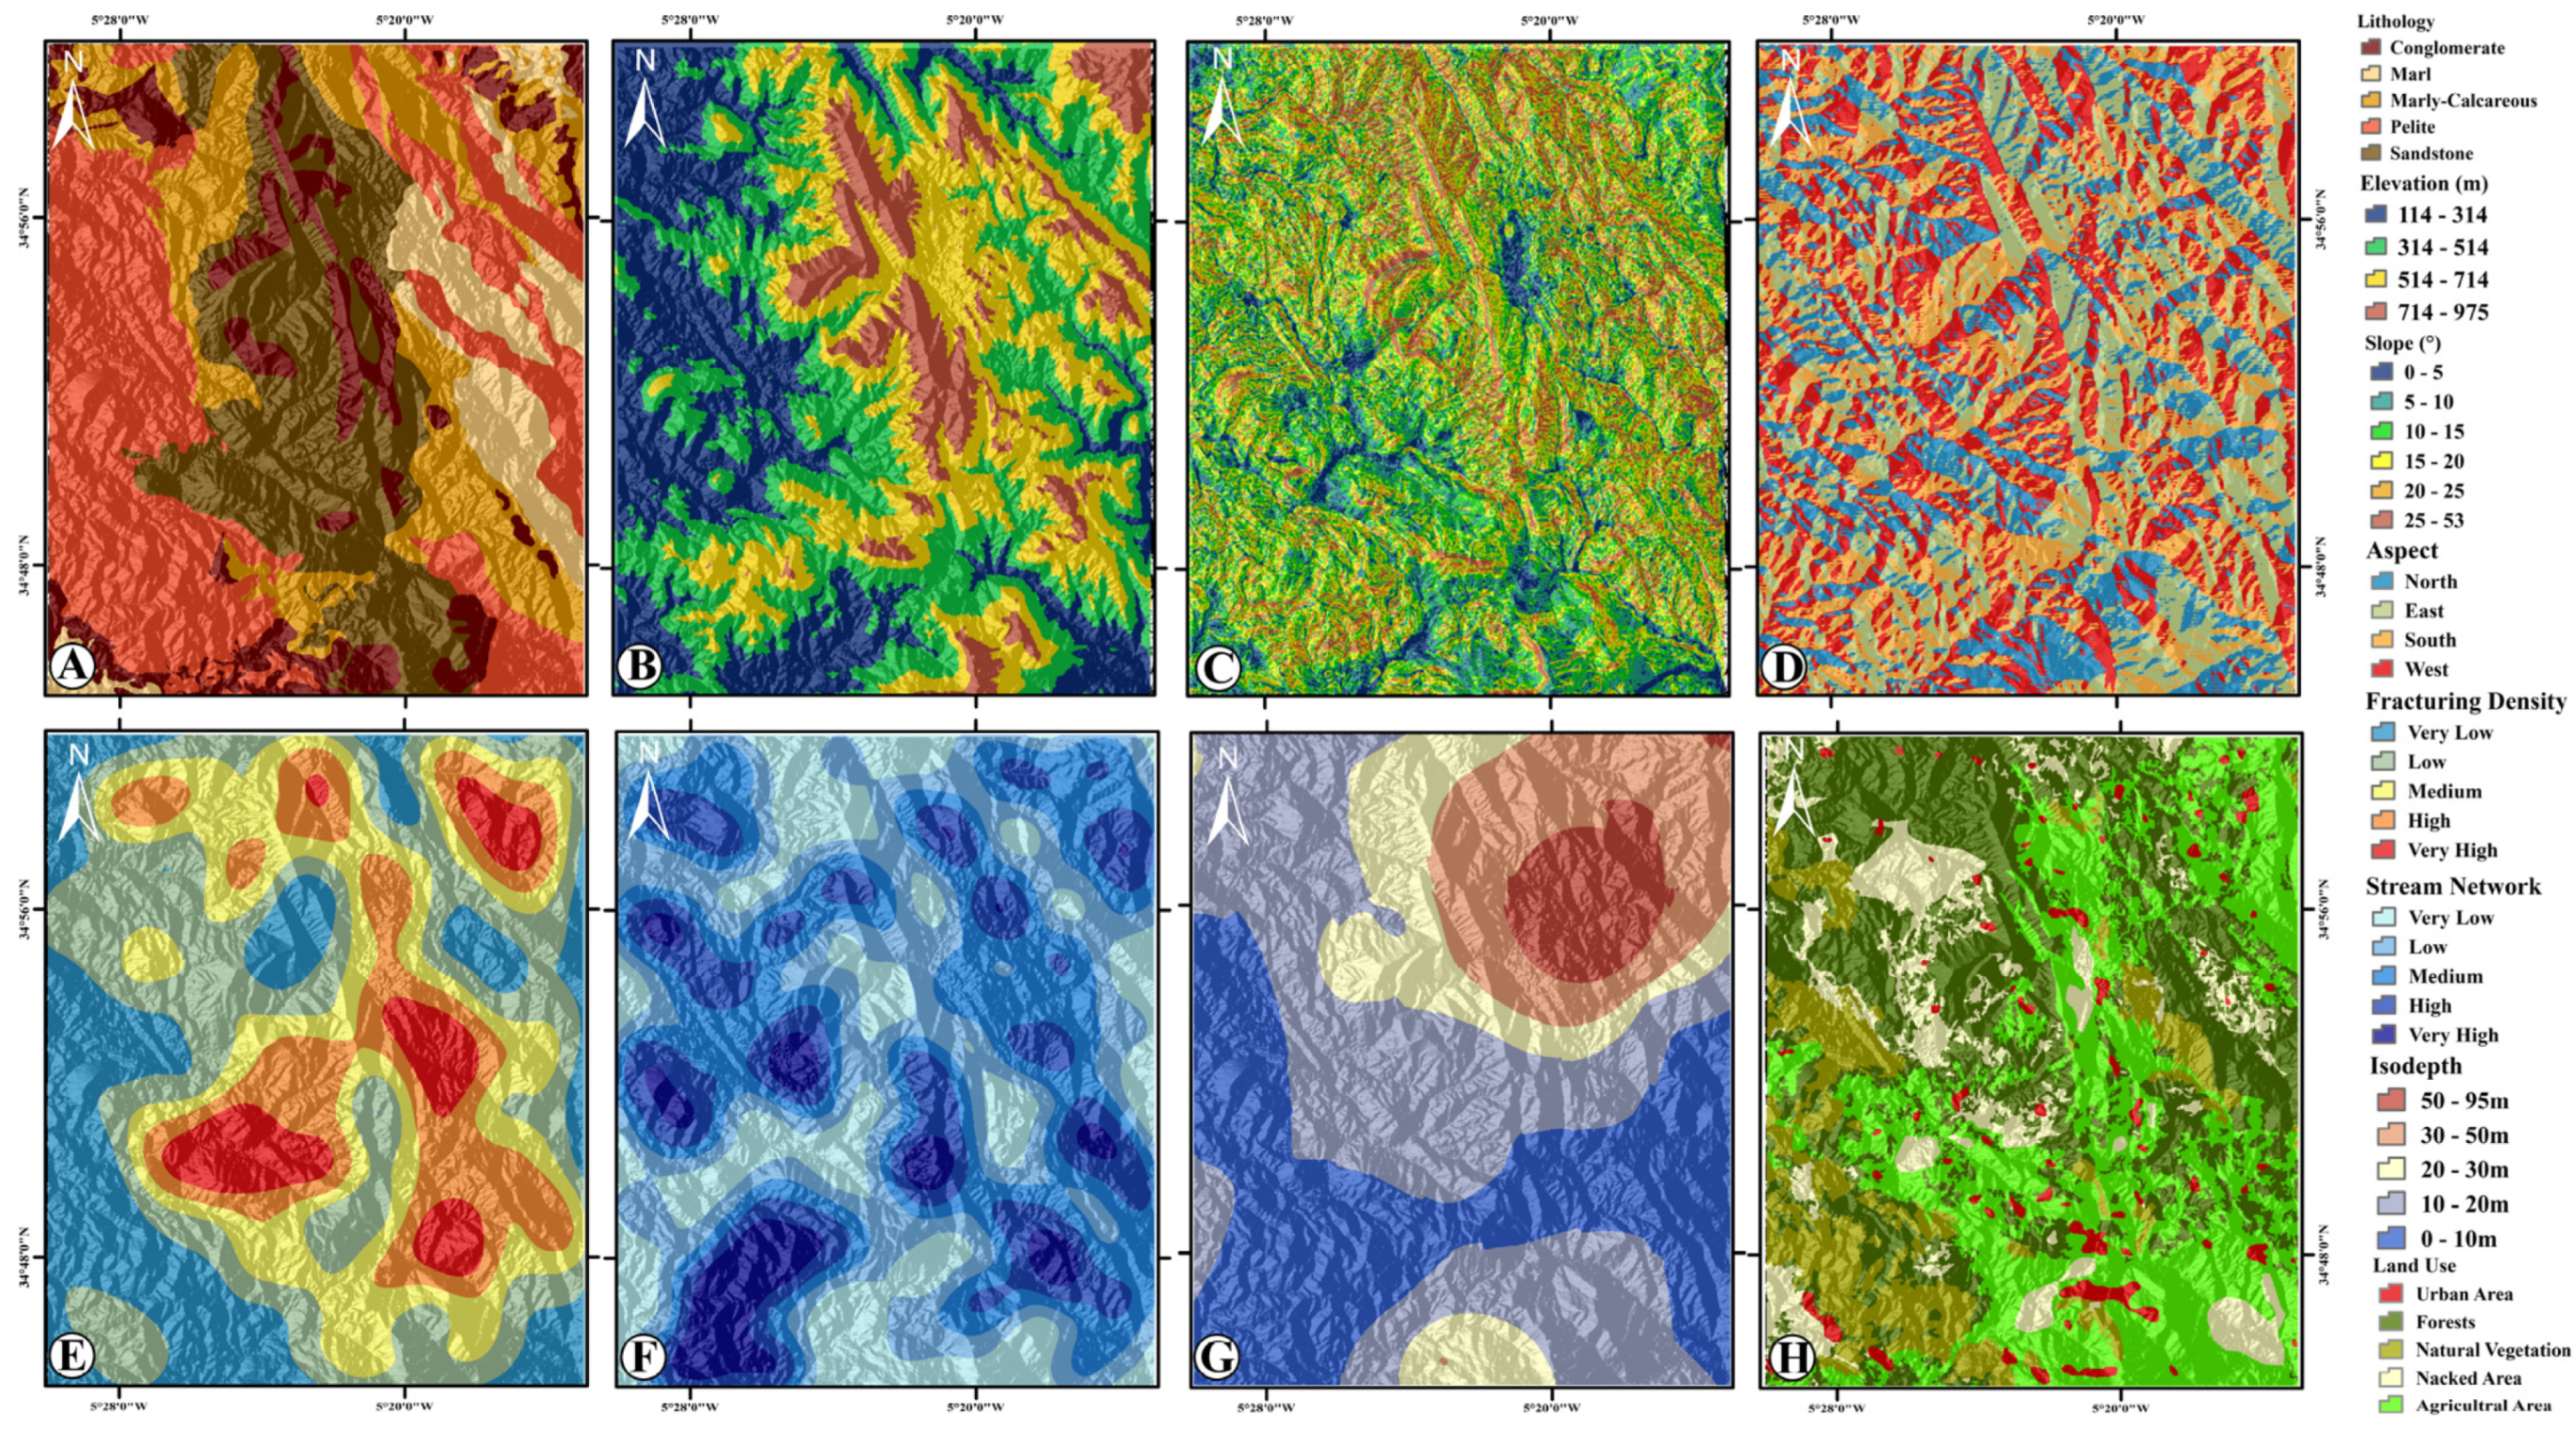
The initial dataset consisted of the geological formations map. A 1:50,000 scale geological map encompassing the study region was simplified, and the various geological units were delineated and digitized (Figure 5A). The classification scheme applied to these formations adhered to the framework established by Westen et al. (1993) [38], which combines lithological and geomorphological criteria. The resulting lithology categories identified in the area comprised pelite formations, sandstones, marls, marly calcareous units, and conglomerates.
The primary topographic characteristics, namely elevation, slope gradient, and slope orientation (Figure 5B–D), were derived from ASTER satellite data using Digital Elevation Model (DEM). Initial data processing included the application of filters aimed at correcting sensor-induced distortions. The elevation value assigned to each raster cell corresponded directly to the DEM’s raster cell measurement. In this research, the slope gradient was computed using an inclination algorithm that considers eight adjacent cells within a 3 × 3 window and categorized into six ranges: (0 to 5°), (5 to 10°), (10 to 15°), (15 to 20°), (20 to 25°) and (20 to 53°). Meanwhile, slope orientation was classified into four directional groups: north (azimuths from 315° to 45°), east (45° to 135°), south (135° to 225°), and west (225° to 315°). These orientation values were calculated in compass degrees (ranging from −1 to 360) by analyzing altitude differences among the four neighboring cells. Nonetheless, both recent and historical tectonic movements can influence or even initiate mass movements events, especially during seismic shaking in fractured zones [39].
The network of fractures can facilitate water penetration, which may raise pore pressure and consequently weaken rock shear strength. When saturation occurs, MMs begin with the development of a primary shear plane. The fracture map (Figure 5E) was generated through the integration of high-resolution remote sensing data, interpretation of orthorectified aerial photographs, morphostructural analysis of the DEM, and on-site field inspections. Similarly, the drainage map (Figure 5F) was produced by analyzing satellite imagery along with supplementary data. The region’s drainage system predominantly exhibits a dendritic pattern, extending up to fifth-order streams. Using these datasets, fracture density and drainage density maps were created by calculating a density metric defined as the total length of fracture and drainage networks within each 25 × 25 m grid cell.
For both the fracture density and drainage density maps, values were categorized into five distinct levels: very low, low, moderate, high, and very high. The study also explored how land use patterns influence MM within the region. In mountainous environments, land use plays a significant role in slope failures. The correlation between land use and these points instable can be intricate, varying according to the type and extent of land utilization. Land cover classes were delineated using SPOT5 satellite imagery, applying both supervised and unsupervised classification methods, along with manual visual interpretation. Additional inputs, such as existing maps and results from field verification, were also utilized. A total of five land cover categories were distinguished (Figure 5G): forested areas, natural vegetation, cultivated lands, built-up zones, and bare ground [40,41].
Slope stability is essentially determined by the balance between forces that support stability and those that promote instability. It is important to remember that during seismic events, two major types of seismic waves propagate through the Earth: body waves (which include longitudinal and transverse types) and surface waves (such as Love and Rayleigh waves). These seismic vibrations introduce dynamic loads that can disrupt the force equilibrium on slopes [42]. This disruption can lead to a range of mass movement processes including landslides, debris avalanches, rockfalls, and structural damage, often due to soil thixotropy. However, in the context of the present study area, earthquakes do not appear to act as immediate triggers for mass wasting events. Instead, their impacts are more delayed and indirect, primarily manifesting through increased fracturing in geological formations and a gradual decline in their mechanical integrity. Over time, these fractures enhance water infiltration, which accelerates material breakdown through freeze–thaw processes and eventually leads to slope failure.
In tectonically active areas, the likelihood of earthquake-induced mass movement depends significantly on seismic magnitude and proximity to epicenters or active fault zones [4,43,44]. An isodepth map was developed for the region (Figure 5H), illustrating five depth intervals: 0–10 km, 10–20 km, 20–30 km, 30–50 km, and 50–95 km.

4.2. Geostatistical Analysis and Interpretation of Mass Movements Spatial Distribution

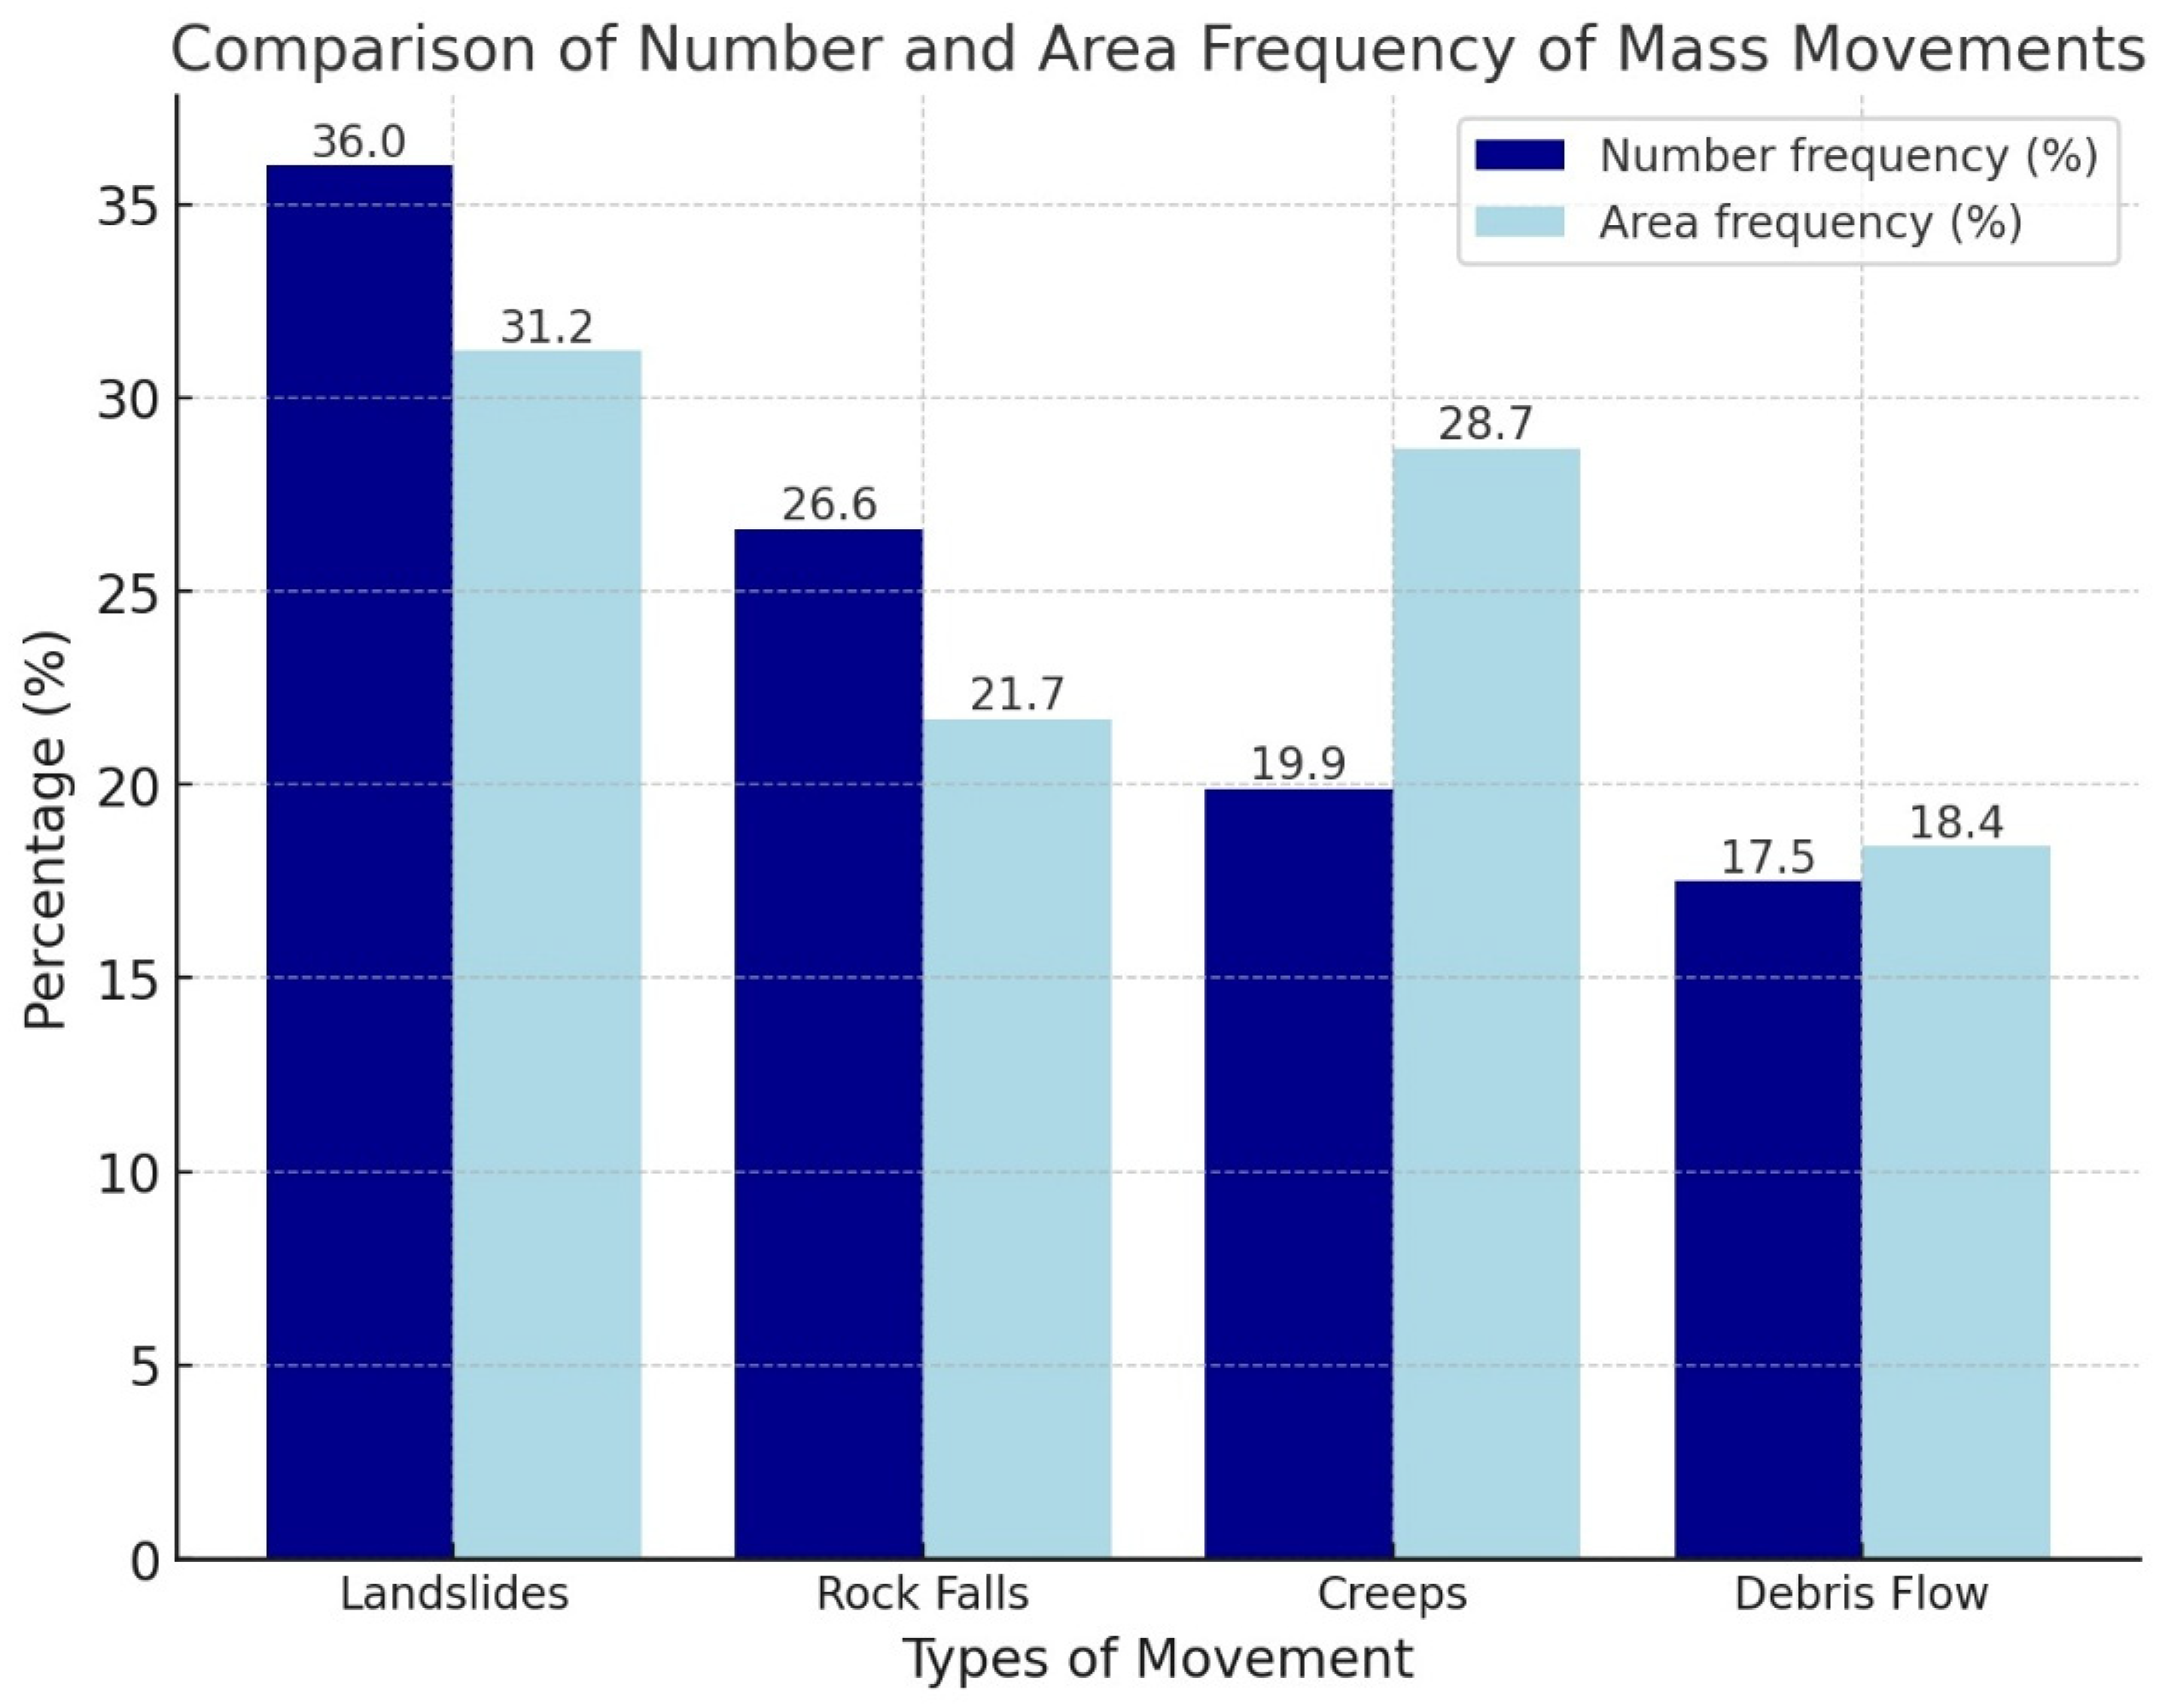
Based on the classification system proposed by Selby (1993) [7], which synthesizes and refines earlier typologies, four categories of mass movement were identified within the study area (Figure 3 and Figure 4). Among these, rock falls comprised approximately 26.6% of the total observed events (Figure 6). These rapid and chaotic displacements typically affect rigid, fractured rock types such as limestone, claystone, or crystalline substrates. In layered sedimentary formations, the presence of stratification enhances rock fragmentation, thereby increasing their vulnerability to failure. Landslides represented the most frequent type of movement, accounting for 36% of all documented cases (Figure 6). These involve the relatively slow displacement of intact soil or rock masses, often occurring along curved slip surfaces or planar discontinuities. Their scale and characteristics can vary considerably depending on the specific type of landslide. Field investigations revealed that most landslides occurred in sandstone and marl formations or within alternating marl-limestone sequences. Debris flows, making up 17.5% of recorded events (Figure 6), were predominantly observed in regions composed of conglomerate and pelitic materials. These flows are typically rapid, abrupt events involving large initial volumes of material that tend to travel in lobate forms down the slope.
Lastly, creep movements accounted for 19.9% of the total mass movement events identified in the study area (Figure 6). In contrast to debris flows, creeps are extremely slow processes that take place on water-saturated slopes, typically without the presence of visible failure surfaces. These movements cause shallow soil deformation, often resulting in the development of small ridges or soil rolls.
Figure 3 and Figure 6 presents both the frequency and the spatial extent of each type of mass movement observed across the region. All movement events were documented using a standardized mass movement inventory template in shapefile format. Using GIS tools, the boundaries of these unstable zones were digitized to create a comprehensive vector map. This vector dataset was subsequently transformed into a raster format to produce a gridded layer representing areas affected by mass movements.
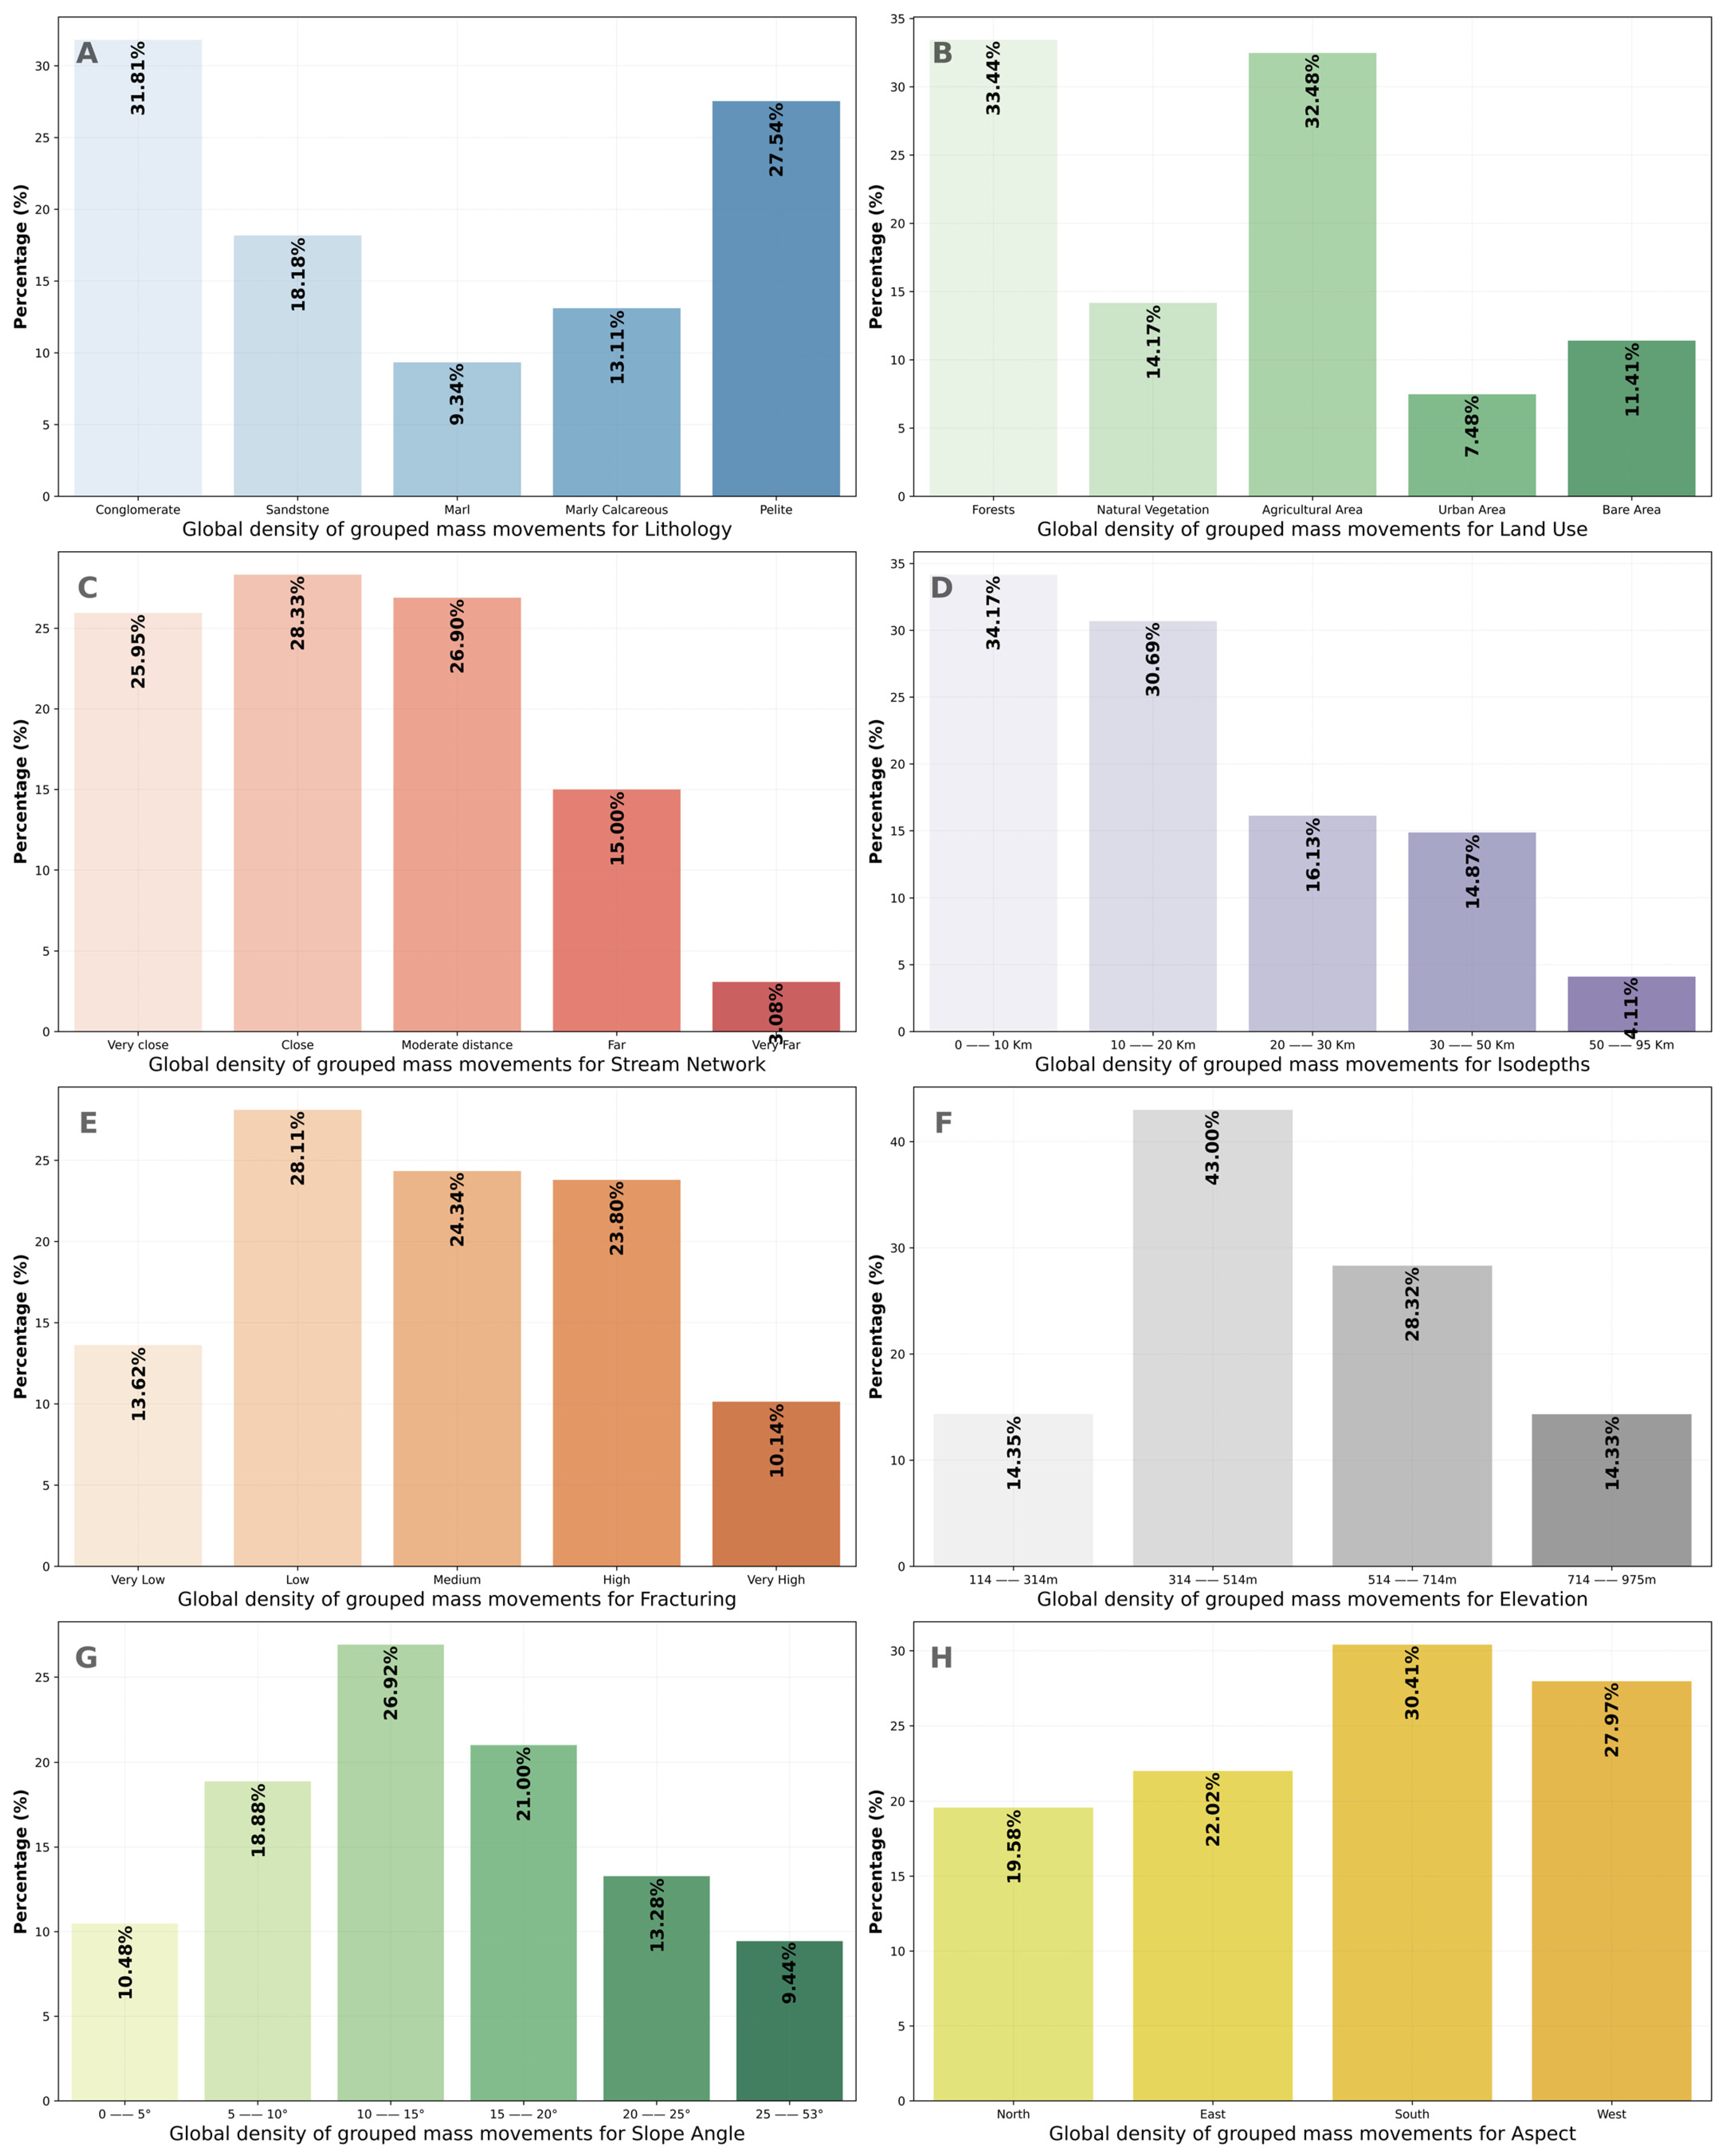
Geological, topographic and hydro-climatic variables represented in the field parameter maps were categorized and analyzed to determine their respective influence on mass movement density. Each thematic map was supplemented with histograms illustrating the occurrence density of different mass movement types across the various classes within each variable (Figure 7). These variables include lithology, elevation, slope steepness, slope orientation, fracture density, drainage density, land cover, and seismic isodepths, represented, respectively, in maps (Figure 7A–H). Additionally, summary diagrams were created (Figure 8) to visualize the overall density of mass movements grouped by variable class, offering a clearer perspective on how each factor contributes to mass movement patterns.
The analysis of mass movement occurrences in relation to geological formations revealed that conglomerate and pelitic units are the most prone to mass movement initiation (Figure 8A). These lithologies show a strong correlation with instability processes. In contrast, moderate levels of movement were observed in other formations such as sandstones and marly calcareous rocks, particularly within marl layers, which represent a relatively limited portion of the study region (Figure 3). Regarding elevation, the density of mass movements increased with altitude, peaking at 43% within the 314–514 m range (Figure 8F). The majority of these events were recorded between 314 and 714 m, with a noticeable decline in movement density both below 314 m and above 714 m.
Slope gradient was also a determining factor. Mass movement frequency increased on inclines ranging from 5° to 20°, with the highest density, in terms of both occurrence and affected area, found on moderately steep slopes (10 to 20°) (Figure 8G). Beyond this range, the frequency of movements diminished, especially on steeper slopes exceeding 20°, where infiltration is often limited. In these very steep zones, particularly those composed of resistant lithologies such as sandstone, the terrain appears relatively immune to mass movement activity due to its mechanical stability.
Slope aspect plays a key role in influencing soil stability and the likelihood of mass movement, primarily due to its impact on moisture availability and vegetation development. In this study, slope exposition was classified into four main directional categories: north, east, south, and west (Figure 5D). As illustrated in Figure 8H, the highest concentration of mass movements was recorded on south-facing slopes (30.41%), followed closely by west-facing slopes (27.97%). In addition, Zoumi region is characterized by intense weathering and a well-developed fracture network, which further amplifies its vulnerability to mass movements [18,45,46]. Regarding fracturing intensity, low, medium, and high fracture density classes were associated with the greatest frequency of mass movements, registering 28.11%, 24.34%, and 23.8%, respectively (Figure 8E). This pattern suggests that both moderately and highly fractured zones are particularly susceptible to MM processes. Within the study area, fault lines influence the surface drainage patterns and facilitate water infiltration, which in turn raises pore water pressure and weakens the shear strength of the rock masses.
When the soil or rock becomes saturated, even if only locally, mass movement can initiate through the development of principal shear-slip planes. The relationship between mass movements and stream networks density reveals that the highest occurrence rates are found within the classes representing very close, close, and moderate density from streams (Figure 8C). This trend highlights a clear decline in mass movement frequency as the density of the drainage network increases, particularly since the areas classified as far and very far comprise only about 12% of the total study region.
The five primary land use categories identified in the study area also contribute to the occurrence of mass movements (Figure 8B). These categories include forested regions, natural vegetation, agricultural lands, urbanized zones, and bare ground. Among these, agricultural fields and forested shrublands are the most susceptible, accounting for 32.48% and 33.44% of mass movement occurrences, respectively, largely due to their facilitation of shallow water infiltration from precipitation. Figure 8D illustrates a clear trend where the frequency of mass movements increases as earthquake focal depth decreases. The majority of events are concentrated within the two shallowest earthquake isodepth classes; 0 to 10 km and 10 to 20 km—with respective frequencies of 34.17% and 30.69%.

4.3. Susceptibility Mapping and Model Assessment

The instability of terrain, in all its forms, is characterized by a triggering event generally associated with the contribution of several factors, each accelerating the processes of this instability. In our study area, the results show a strong correlation and close connection between the eight variables, reaching a coefficient of 0.92. This indicates a relationship between the topographic factor (SG), which is considered the crucial variable in the loss of stability, and the variable of the density of the hydrographic system (SND), which can also influence the stability of the basins through its hydrodynamic forces (Figure 9). On the other hand, just as this last variable shows the highest contribution in triggering a mass movement with the slope factor, the same variable (SND) shows, this time, a nearly negligible contribution, with the fracture density (FD) not exceeding 0.19. This means that this type of geomorphological deformation in the Zoumi region cannot be primarily associated with tectonic activities, as in other regions in the Rif chain, due to the weakness of these fractures.
These findings are supported by the significance levels of the χ2 test, which exceed 0.15 for the model entry criterion and 0.05 for the Wald χ2 test used to retain predictor variables. Furthermore, the Cramér’s V values obtained (Figure 10) align with the results of the χ2 tests and the corresponding degrees of freedom. The Cramér’s V analysis indicates that all eight predictor variables exhibit a high degree of independence, validating their inclusion in the LR model to effectively explain the dependent variable (mass movements).
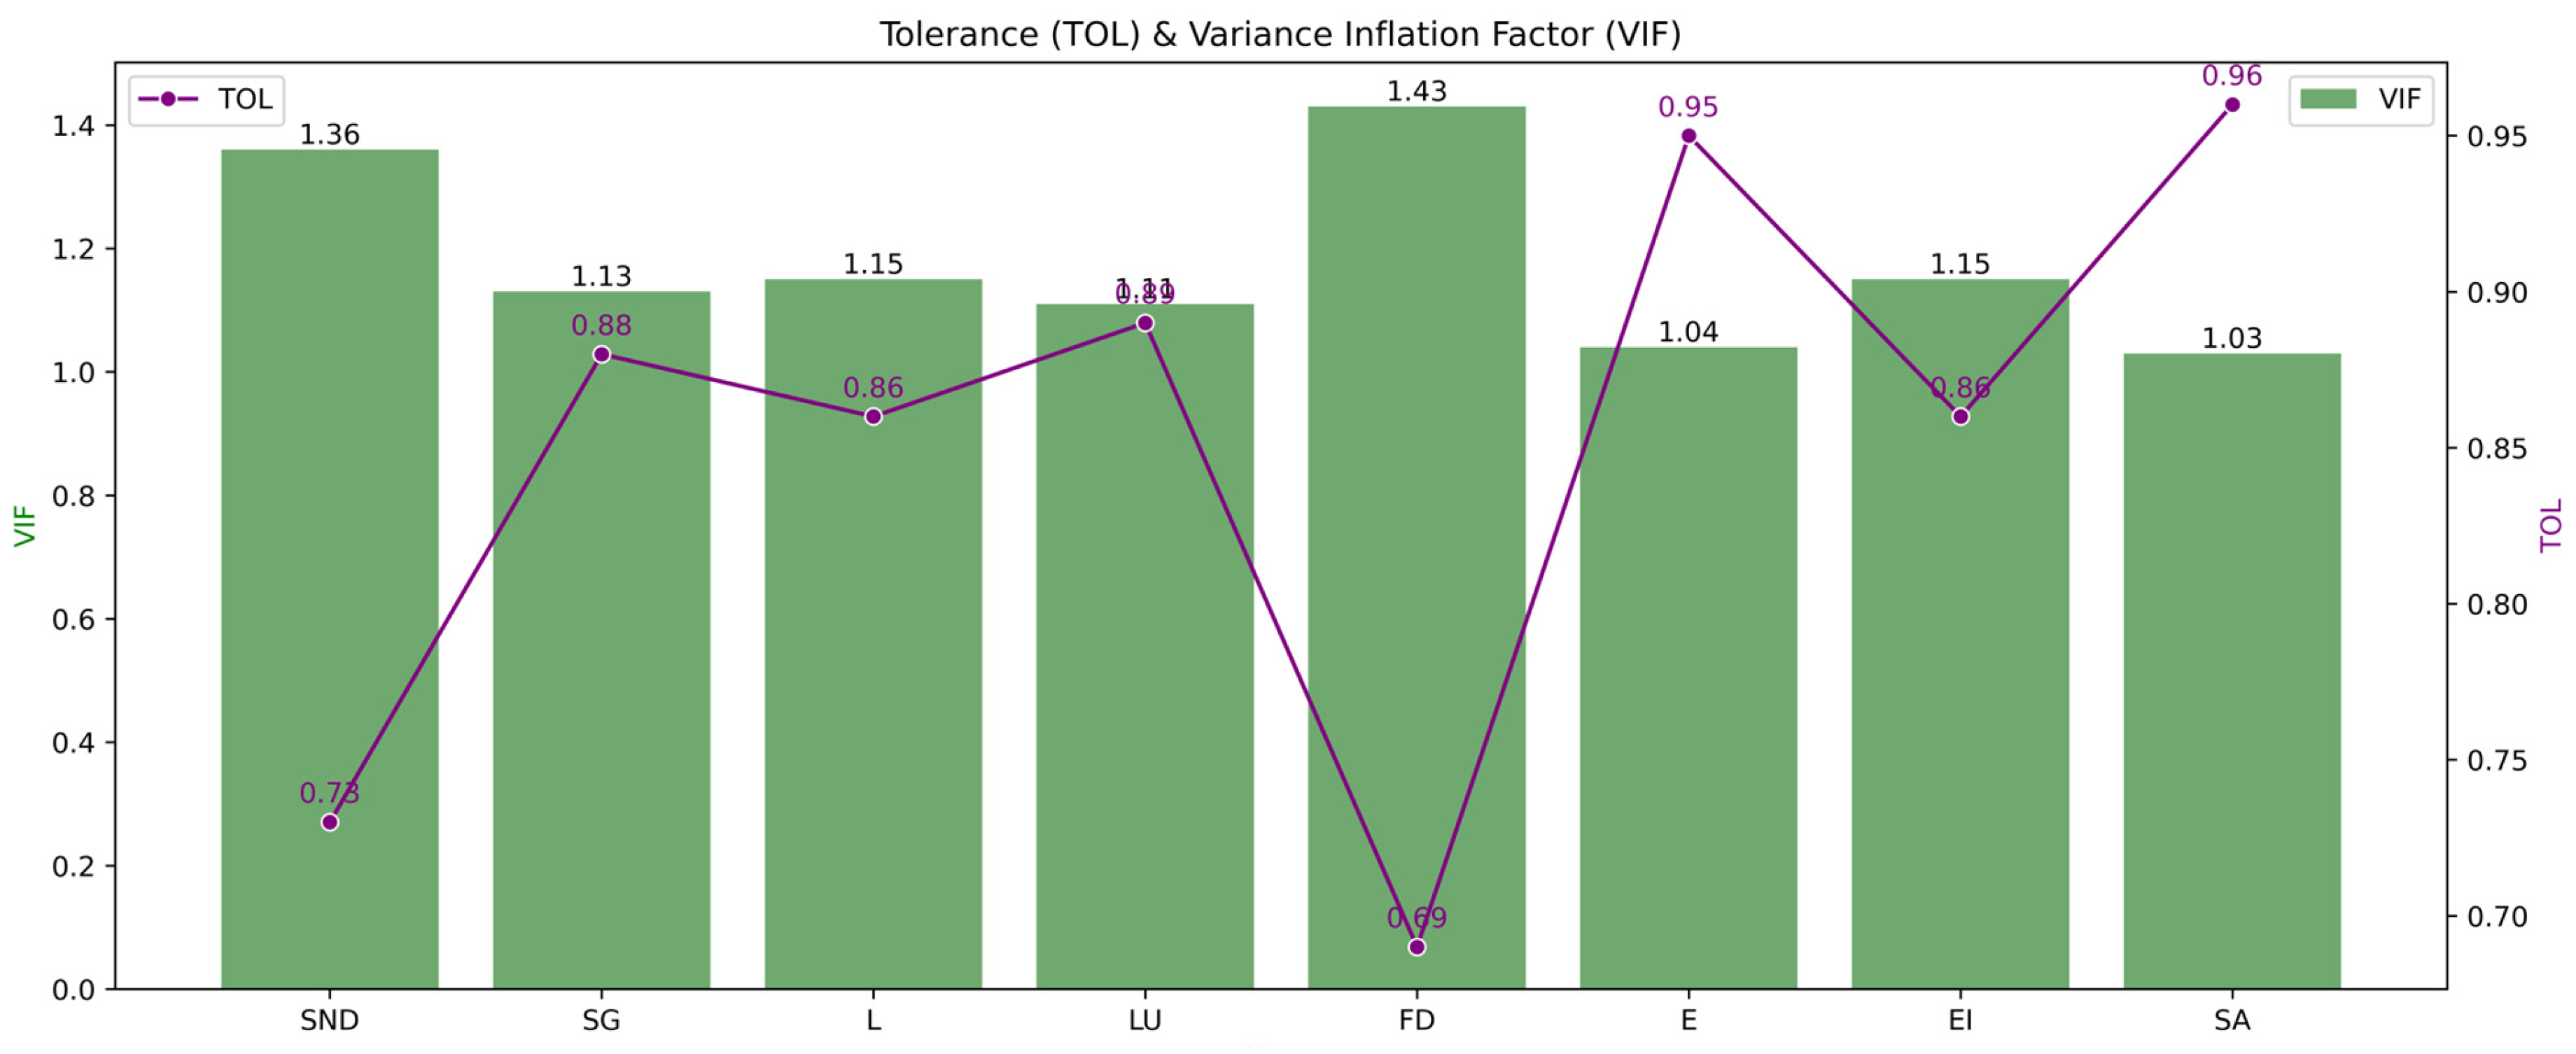
Multicollinearity in logistic regression models arises when strong correlations exist among the independent variables. Since collinearity diagnostics are computed solely from the independent variables, the choice of the dependent variable has no influence on the analysis. Two key indicators used to detect multicollinearity are Tolerance (TOL) and the Variance Inflation Factor (VIF). As shown in Figure 11, all TOL values are less than 1, and all VIF values are below 2. Based on the criteria established by Allison (2001), Menard (2001), and Mastere (2020) [36,47,48], these results confirm that the eight selected predictor variables are well-suited for inclusion in the model, they are sufficiently independent and do not exhibit problematic multicollinearity. Therefore, they were incorporated into the LR analysis conducted in this study.
Using 30% of the inventoried mass movement data in the study area, which corresponds to the test dataset, the logistic regression (LR) model successfully classified 73 out of 85 points into their correct classes. It accurately identified 33 points as stable (No MM = No Mass Movements) and categorized 40 points as mass movement occurrences (Figure 12). The confusion matrix for the LR model based on this test set also reveals a high accuracy level, estimated at 0.85, further supporting the model’s performance and its ability to learn from the input data, effectively detecting anomalies among the variables.
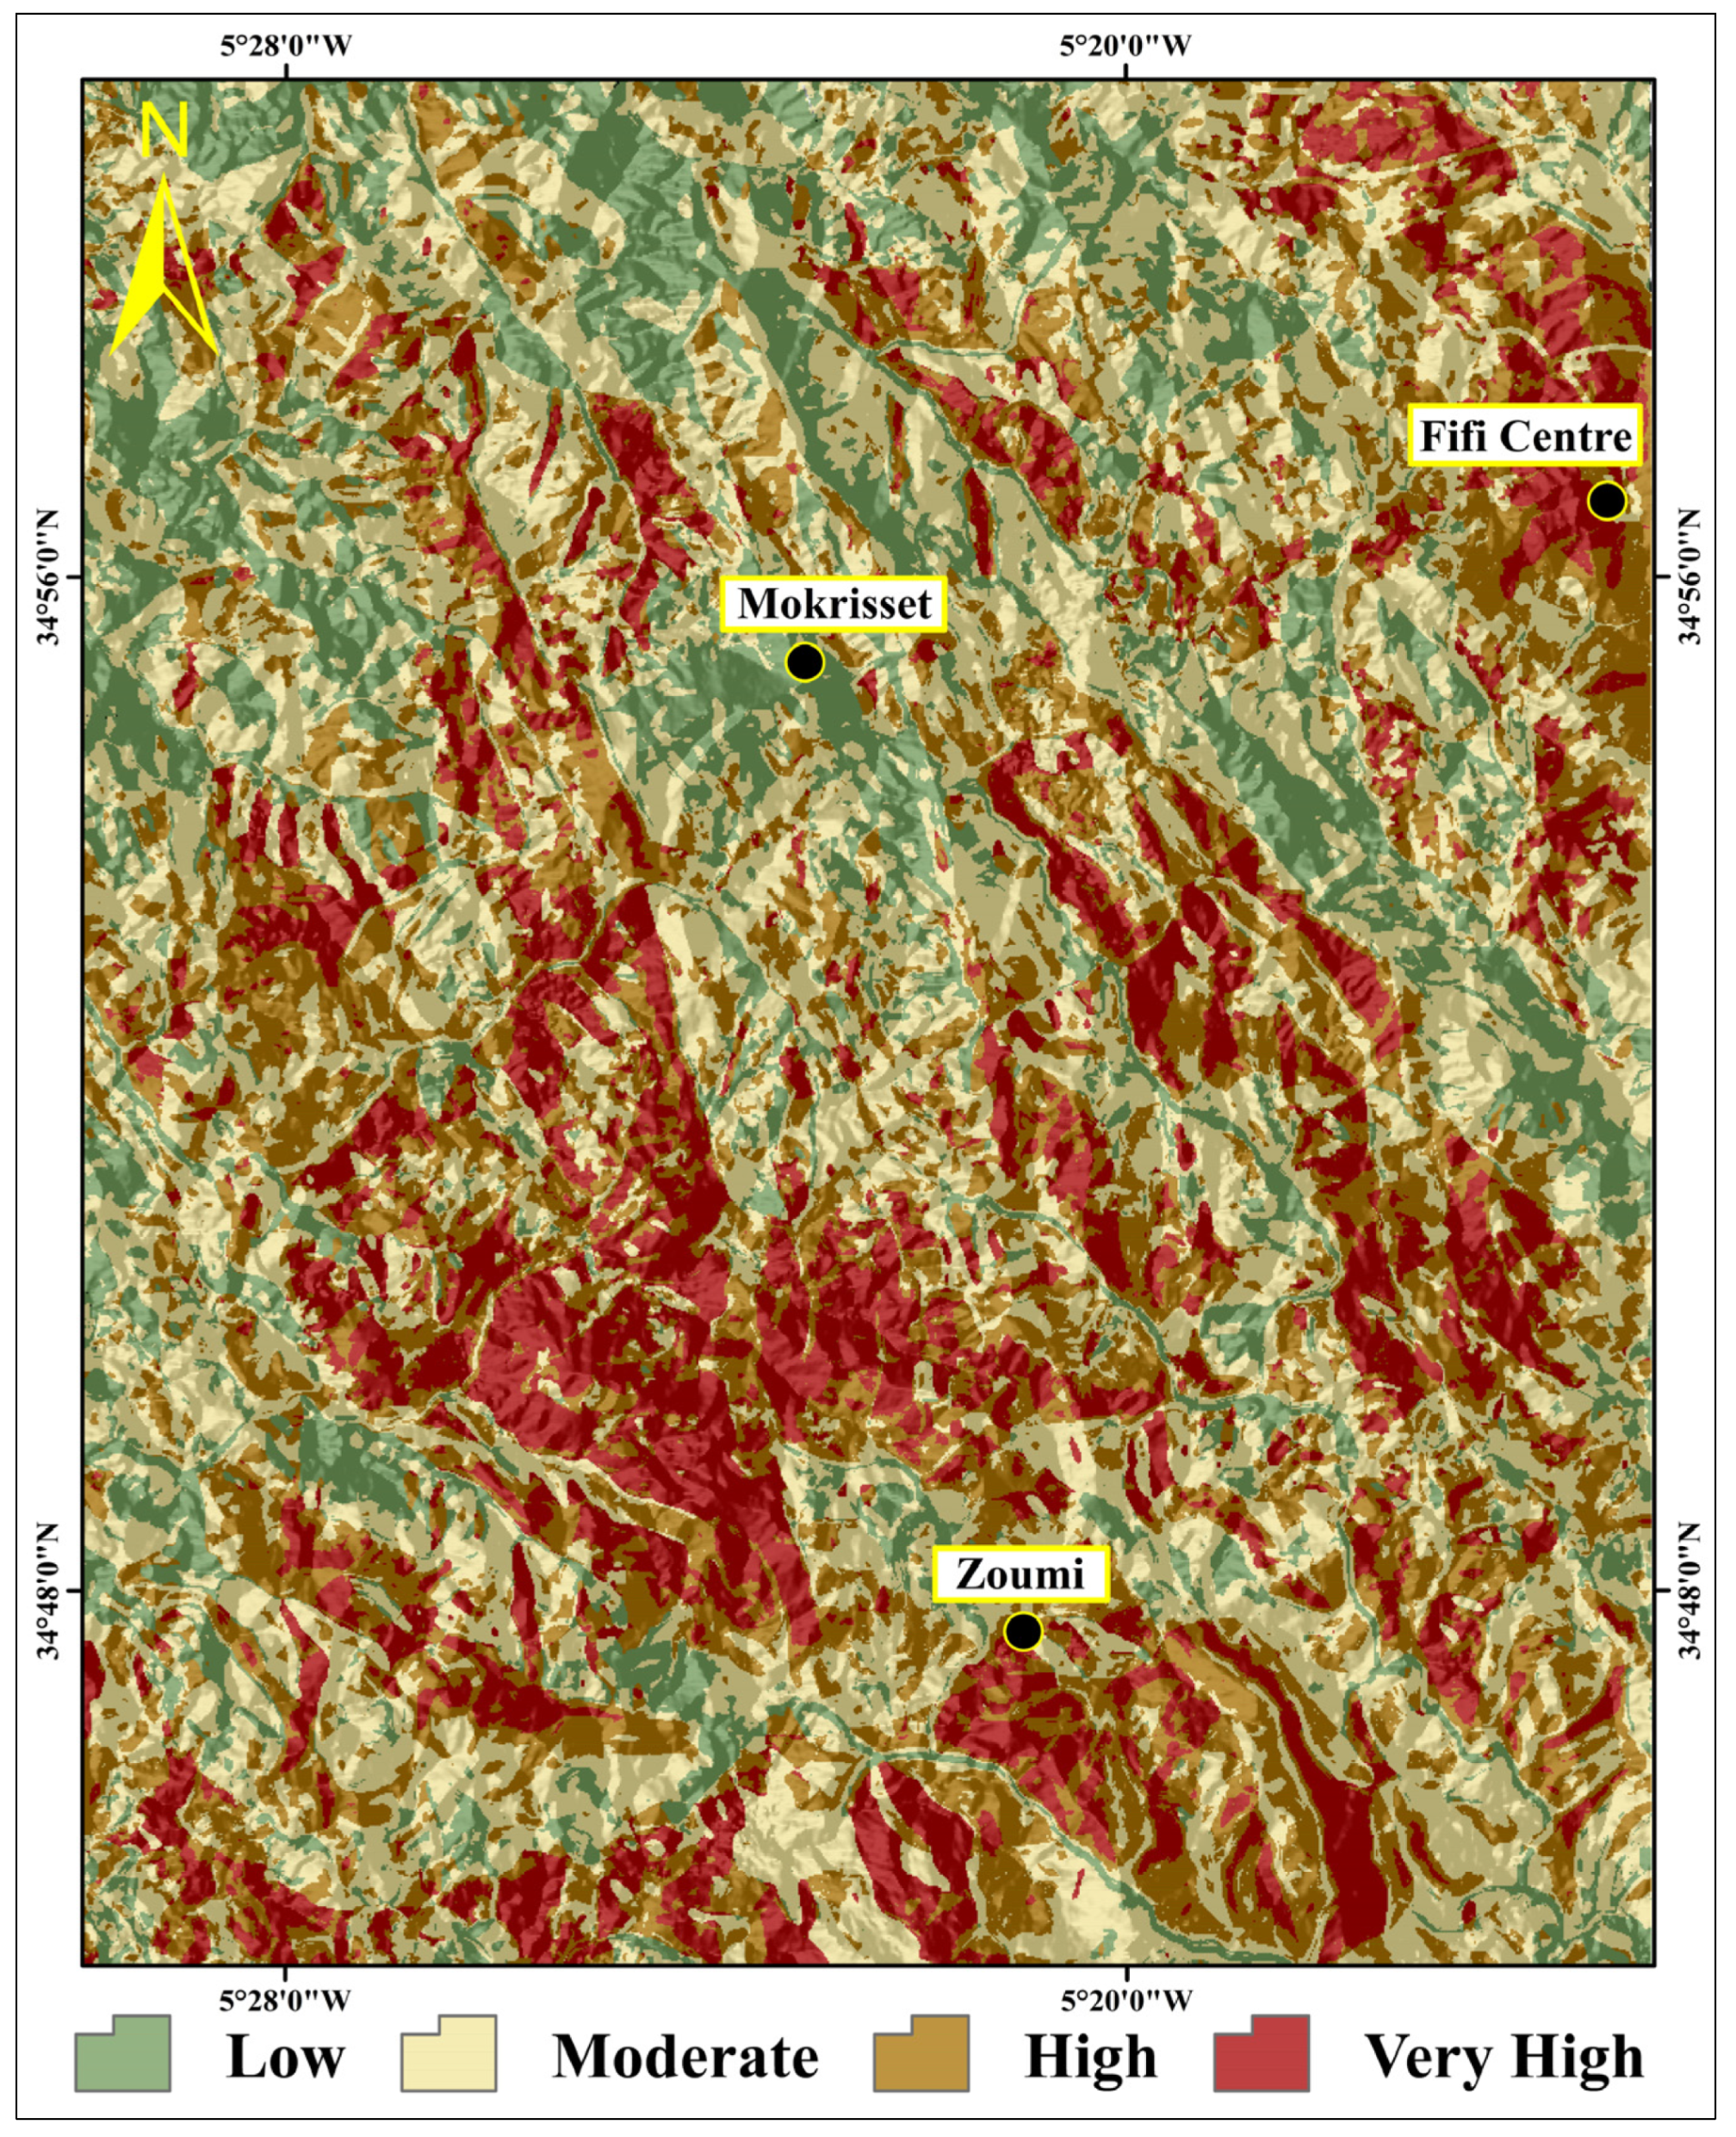
To implement the logistic regression model, the ArcSDM extension within ArcGIS 10 was utilized to assess the spatial correlation between mass movement occurrences and their controlling factors. The statistical output of the model, including the LR coefficients, is presented in Figure 13. These results indicate two types of relationships: positive coefficients, such as those associated with land use, and negative coefficients, such as slope aspect. Based on this model, a mass movement susceptibility map was generated for the Zoumi region (Figure 14) by applying the logistic regression equation as outlined in Equation (8).
y = 29 + ( S N D   C o e f × S N D ) + ( S G   C o e f × S G ) + ( L   C o e f × L ) + ( L U   C o e f × L U )   + ( F   C o e f × F ) + ( E   C o e f × E ) + ( E l   C o e f × E I ) + ( S A   C o e f × S A )
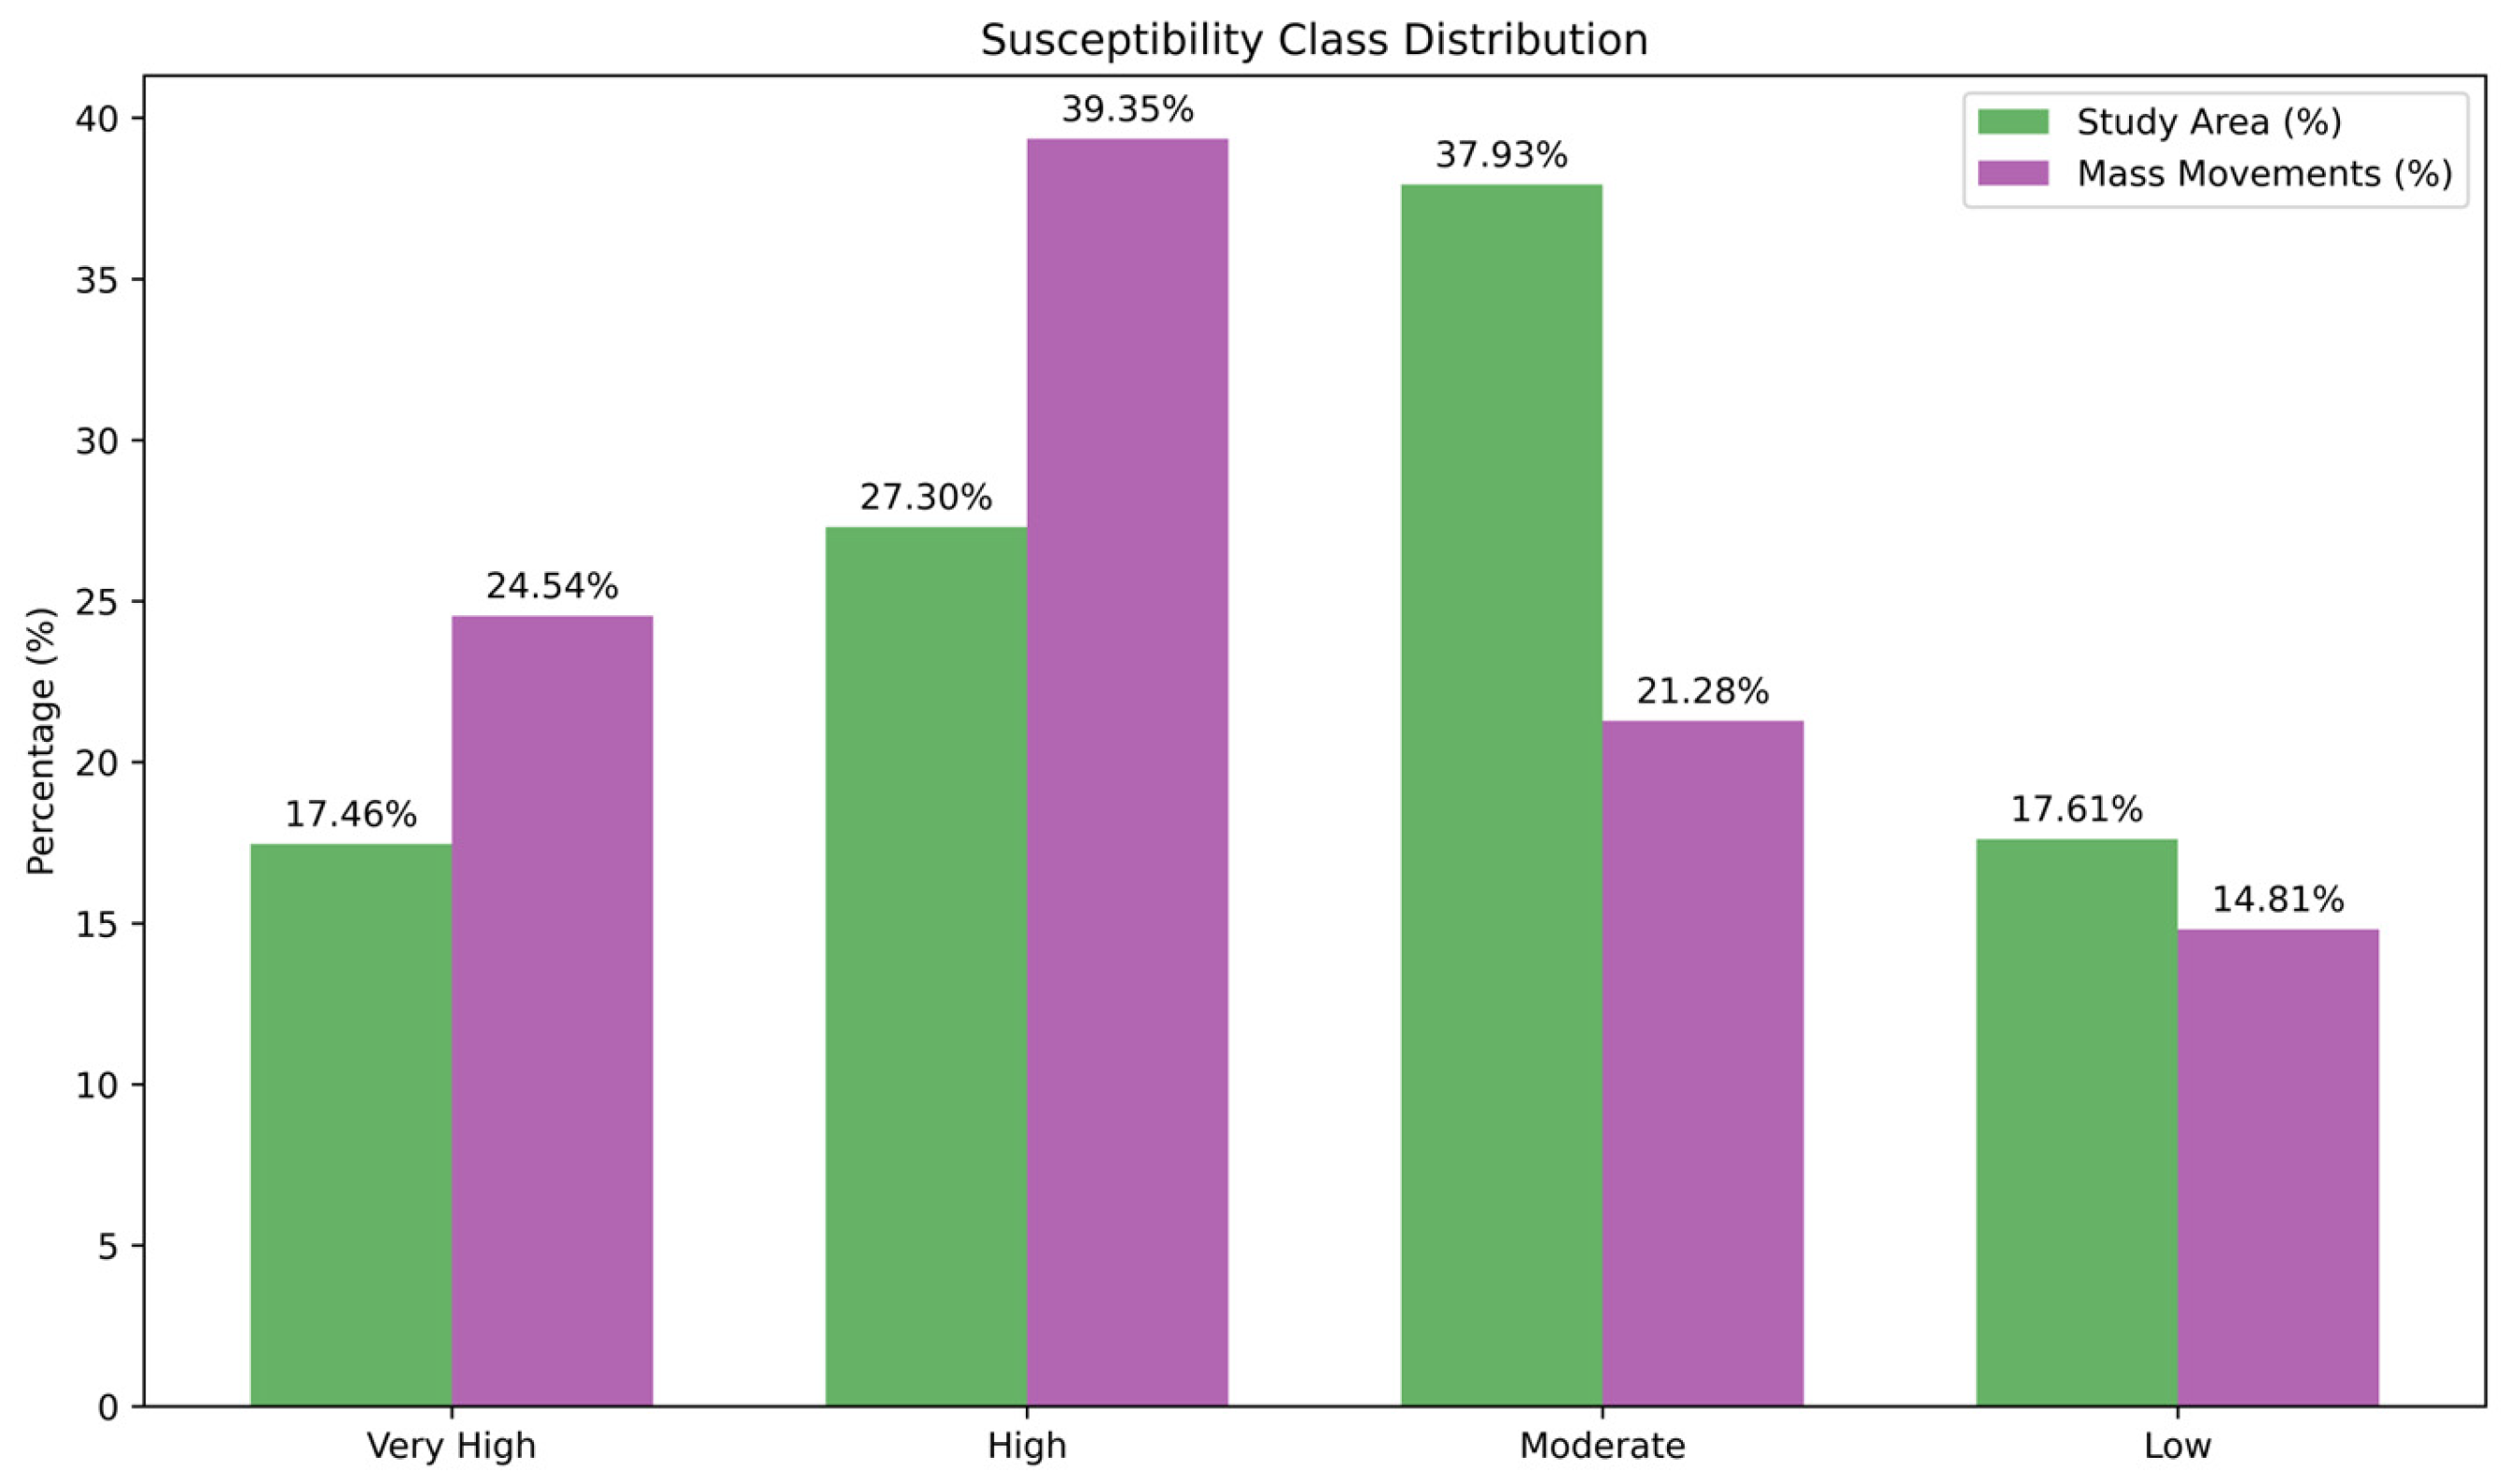
The resulting susceptibility map (Figure 14) was classified into four distinct categories: low, moderate, high, and very high susceptibility zones. Analysis of the map indicates that 17.46% of the study area falls within the very high susceptibility class. The high, moderate, and low susceptibility zones occupy 27.30%, 37.93%, and 17.61% of the region, respectively. The majority of the zones with very high and high susceptibility are concentrated in areas that are in close or very close density of stream networks and fracture zones, and are characterized by moderately steep slopes and agricultural land use.
In the literature, there are different validation methods. In this study, in order to validate the susceptibility map, we compared the cumulative percentages of known MM locations with the percentage of each susceptibility class of the produced mass movement susceptibility map, according to [36,45]. The greatest susceptible (very high class) class covered 17.46% of the study area, which covered 24.54% of the mass movement area, and the most susceptible (high class) class covered 27.30% of the study area, which covered 39.35% of the total mapped mass movements (Figure 15). The least susceptible (moderate class) and the least susceptible (low class) represented 37.93% and 17.61% of the area. It covers, respectively, 21.28% and 14.81 of the total mapped mass movements.
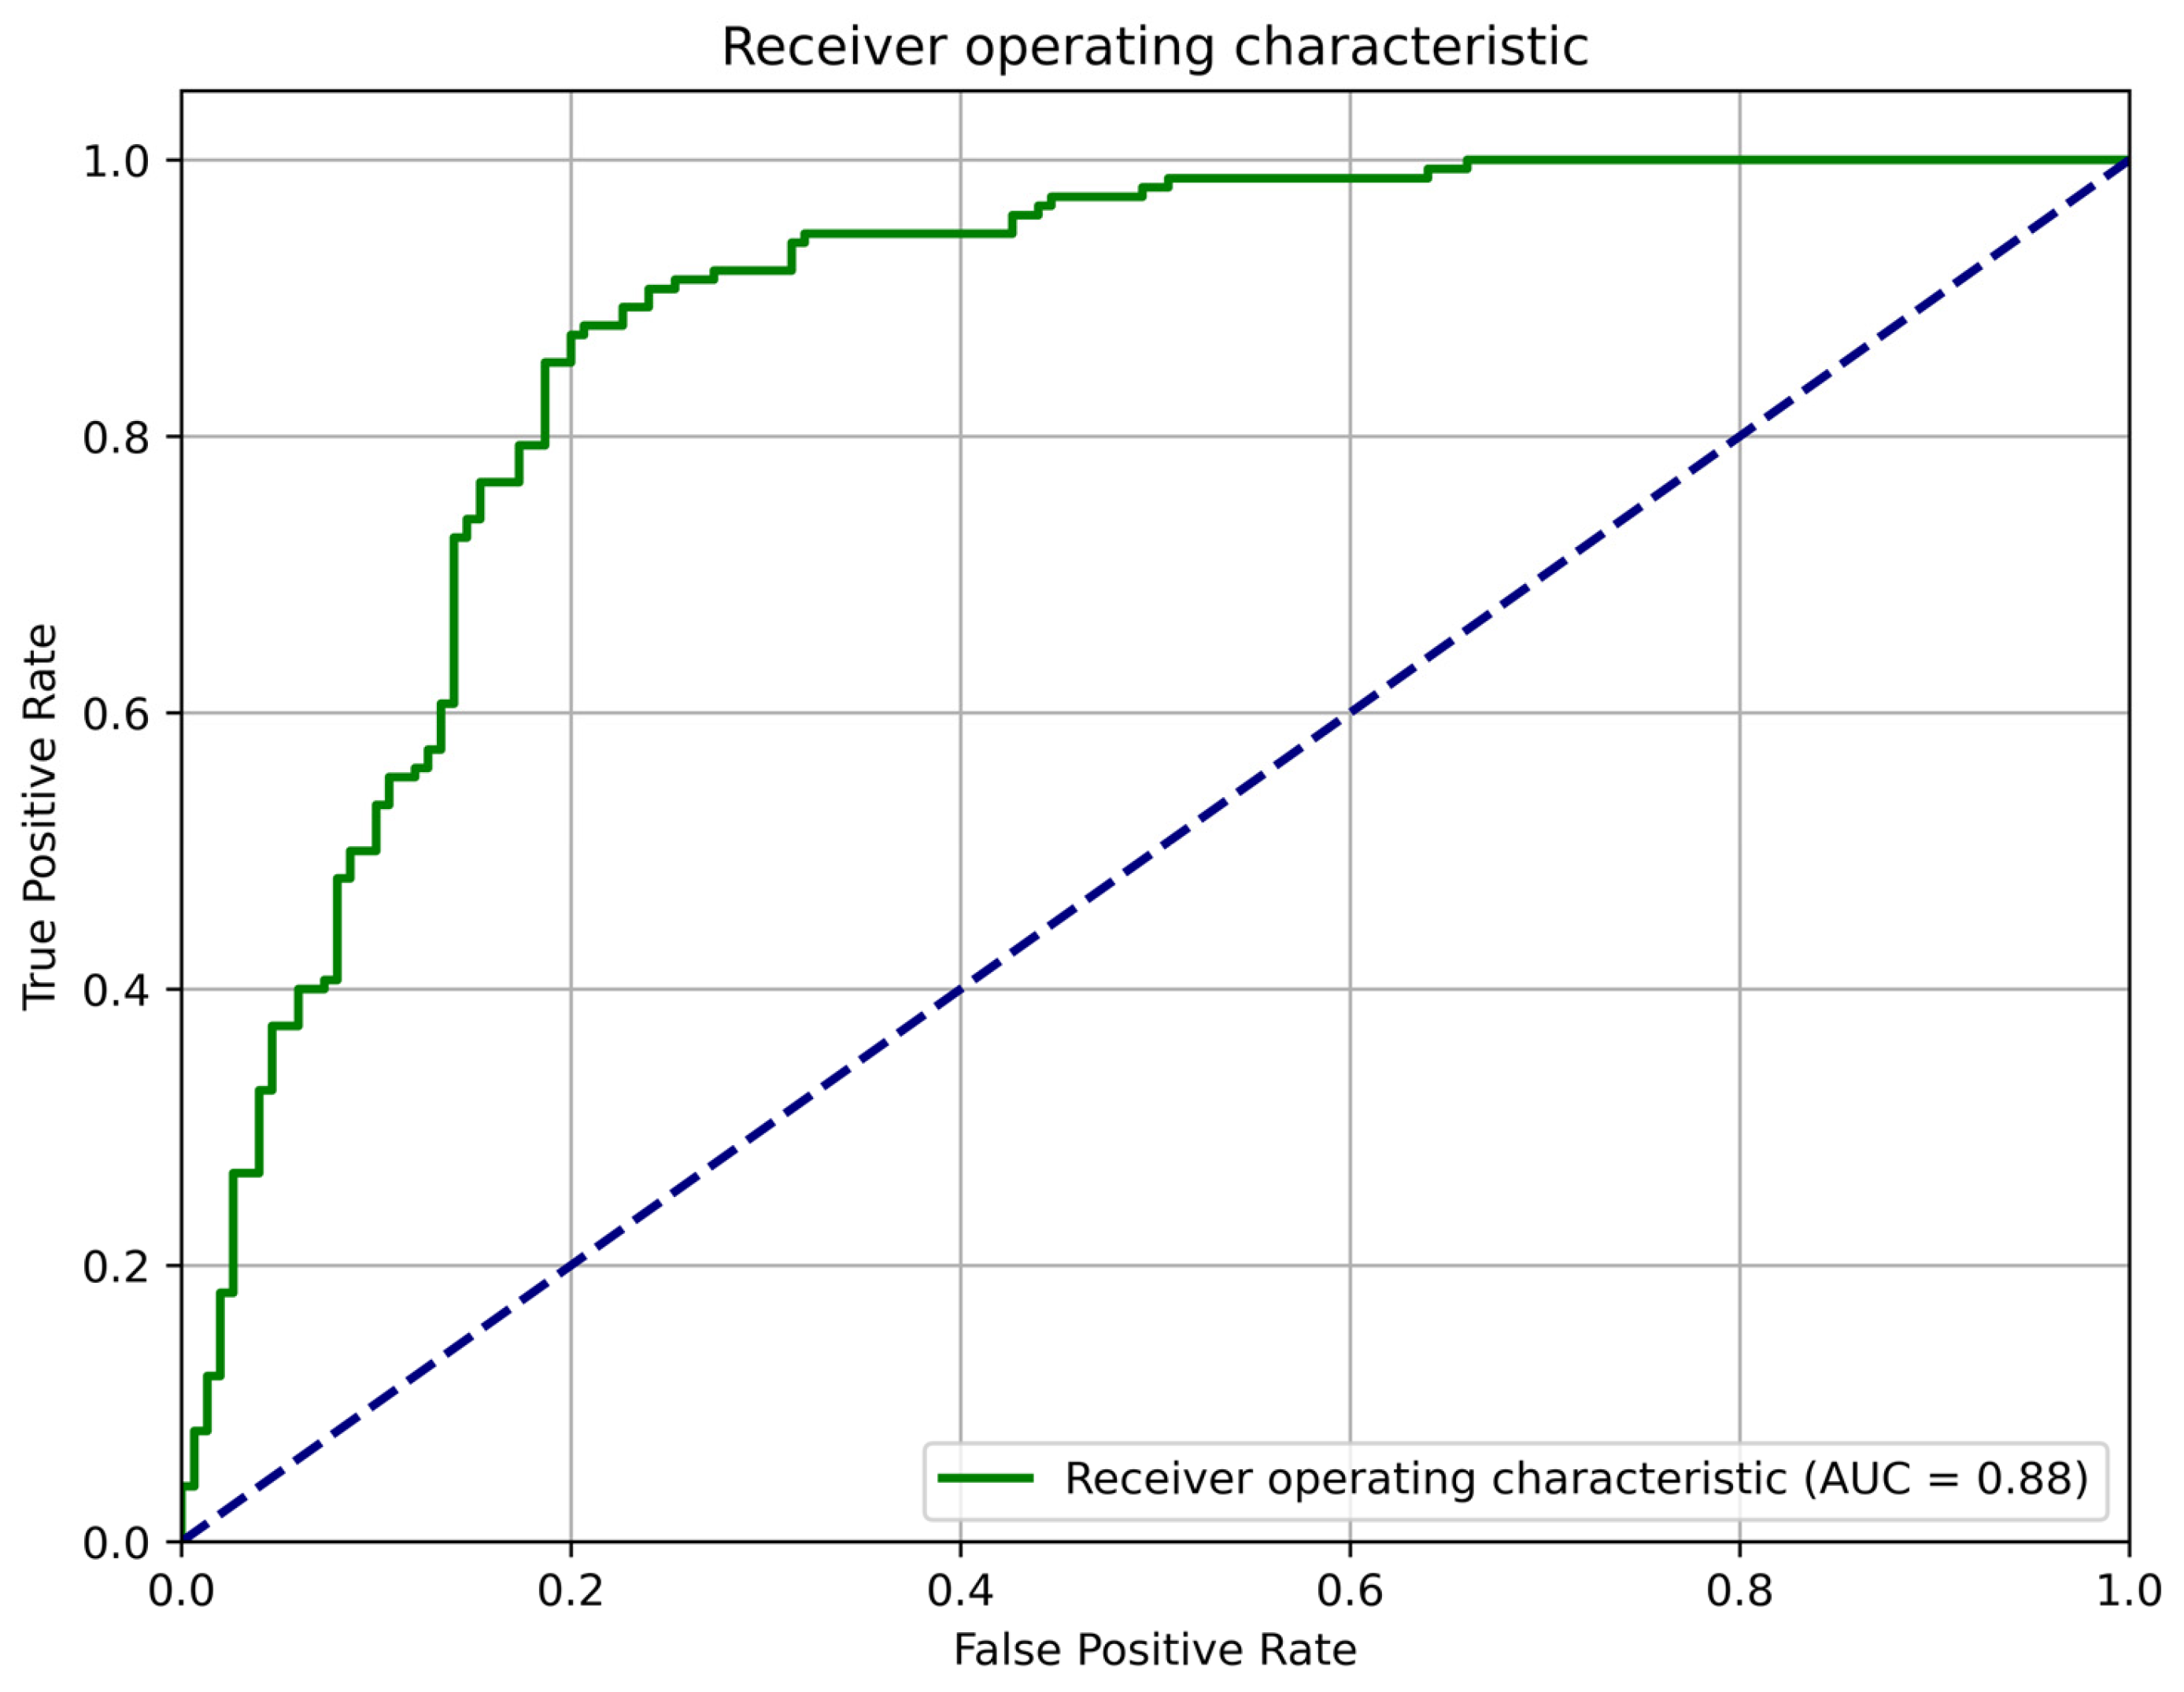
Figure 16 also provides a quantitative measure of the ability of the susceptibility model to match the known distribution of mass movements in the Zoumi area. Moreover, all these statistics highlight the high reliability of the results obtained using the logistic regression (LR) model. To further substantiate our findings, we applied the receiver operating characteristic (ROC) curve to quantitatively assess the performance of the model in classifying this type of data. The ROC curve analysis, along with its associated concepts, demonstrated a significantly strong performance, with an estimated receiver operating characteristic (ROC) curve analysis value of 88% (Figure 16). This AUC value reflects the model’s excellent ability to differentiate between the various data classes, emphasizing its effectiveness in similar classification scenarios. These results and the applied LR model appeared to be reliable in as much as the model best corresponded to the actual ground truth in the study area.

5. Discussion

The statistical analysis of frequency and surface area for each type of mass movement highlights their environmental parameters and susceptibility levels. These results contribute to a better understanding of the geomorphological deformations in the Zoumi province within a regional context. In the first section, the analysis of the spatial distribution of mass movements showed moderately close statistical variations among the four types of mass movements, with frequency values ranging from 36% to 17.5% (Figure 6).
In general, the typology of mass movements is closely linked to the nature of the displaced or deformed materials. For instance, landslides are a type of movement that can only occur in loose and fragile formations. In contrast, rockfalls typically occur in hard formations such as dolomites or limestone. According to the geological map (Figure 3), the Zoumi region is characterized by a vast area of terrain composed of unconsolidated soil layers, such as sand and marl. Specifically, these two soil types are considered among the most conducive to landslides due to their water saturation and the resulting alteration of their geotechnical properties. The statistics presented in Figure 6, in conjunction with the geological map, indicate that the high frequency of landslides compared with other types of mass movements is primarily due to the presence of fragile soils that favor such displacements. An overview of the spatial distribution of this type (landslides) on the geological map shows a strong concentration in the sandy and marly formations. The occurrence of rockfalls is associated with heterogeneous formations, which are often characterized by fragile bedrock overlain by rocky covers features that are evident in detrital formations. Although these formations are not widely represented in the study area, statistical data reveal a high concentration of events in the conglomeratic deposits, with a notable frequency estimated at 27%. Ranked third, soil creeps share similar characteristics with landslides but are distinguished by their slow movement of superficial layers and are generally observed in loose soils on relatively steep slopes. Although the frequency of such deformations is low, creeps in the Zoumi region affect large deformed areas—more extensive than those impacted by rockfalls—with a surface coverage reaching 28.7% (Figure 6). This is due to their mechanisms, which enable them to affect broad areas of the soil.
It is true that landslide susceptibility can be assessed in any region using similar parameters; however, the contribution and significance of these parameters may vary depending on the regional topographic, geological, and climatic characteristics. Based on the natural features of the study area, Figure 8 provides a complementary analysis that offers insight into the subcategories of predisposing variables that significantly contribute to the geomorphological deformation of the regional land surface.
The Rif Mountain chain is considered a very recent domain in the geological and geodynamic history of Morocco and remains active to this day due to fault deformations and ongoing tectonic processes. Given that the Zoumi region is part of this Rif chain, several fault families and tectonic structures may have contributed to the occurrence of various forms of mass movements. The classification of fault density in the study area supports the aforementioned findings, showing significant frequencies estimated at nearly 60% in zones with moderate to very high fault density, which highlights the contribution of these tectonic structures to mass instability. Due to the close relationship between faults and seismic activity often regarded as two sides of the same coin, the isodepth density map reveals that 65% of the recorded mass movements in the study area are located within a 20 km range, directly illustrating the role of seismotectonic activity in the genesis of mass movements in the Zoumi region (Figure 8D). Moreover, the hydrographic networks exert a similar influence to the aforementioned parameters. As shown in Figure 8C, riverbanks and areas in close proximity to watercourses exhibit a high concentration of mass movements. This is attributed to the hydrodynamic force of the flowing water, which induces erosional processes on the slopes and disrupts their stability. Other variables and their sub-classes, such as lithology, particularly conglomeratic formations, elevation, and slope also play a role in these hazards. Nevertheless, hydrographic networks, faults, and isodepths emerge as the most significant contributors to the occurrence of mass movements in the Zoumi region.
Before initiating the discussion on the regional susceptibility map, the results also highlight the issue of multicollinearity among the variables used to determine whether they exhibit exact linear relationships. This is achieved through the estimation of tolerance (TOL) indices and the variance inflation factor (VIF) (Figure 11). The latter indicates that when the value exceeds 1, the variables fall within the range of multicollinearity, and the higher the value, the greater the degree of multicollinearity. In this study, the VIF values indicate moderate multicollinearity for all factors, with values ranging from 1.03 to 1.43, except for the land use factor, which does not exhibit multicollinearity with the other variables. In contrast, the hydrographic networks and fault structures showed the highest values, confirming the earlier statistical findings.
Statistical analysis, the spatial distribution of mass movements, and the verification of variable multicollinearity are essential steps toward achieving the main objective of this study: assessing the susceptibility of the Zoumi region to mass movements. The application of logistic regression enabled the extraction of importance coefficients for each parameter used in generating the final map. By multiplying each coefficient by its corresponding variable within a GIS environment, a susceptibility map was produced, displaying four levels of susceptibility: low, moderate, high, and very high (Figure 14). The two highest susceptibility levels accounted for nearly 50% of the study area, representing a significant potential threat to the populations living in the Zoumi region due to the expected frequency and intensity of mass movements in these zones. Given that the approach is purely mathematical and numerical, the methodology includes a validation phase based on the ROC-AUC model, which provides scalar values used to evaluate the overall model performance. As previously noted in the context of natural hazard studies, this index must exceed 75%. This requirement is met by the logistic regression model in this study, which achieved a performance level of approximately 88% (Figure 14). This AUC value aligns with those reported in previous Moroccan studies, such as Benchelha et al. (2020) [49] in the Taounate region (AUC = 91.8%), where logistic regression has proven to be a robust predictive tool for mass movement susceptibility mapping. These comparisons confirm that logistic regression remains a powerful and efficient statistical method for MMSM “Mass Movement Susceptibility Mapping”, despite the availability of more complex machine learning techniques.
Despite the strong performance of the logistic regression, some limitations should be acknowledged. One of the main constraints of LR is its assumption of a linear relationship between predictor variables and MM susceptibility, whereas mass movement processes often exhibit non-linear interactions between geological, hydrological, and climatic factors. Future studies could explore machine learning approaches, such as random forests (RF), support vector machines (SVM), and deep learning models, to better capture the complexity of these interactions [49]. However, previous studies, including those by Benchelha and El-Fengour [50,51], have shown that when properly calibrated, logistic regression can achieve results comparable or even superior to machine learning models while maintaining better interpretability.
Another challenge relates to the spatial resolution of the input data. The 25 m × 25 m resolution adopted in this study represents a balance between computational efficiency and spatial precision, but finer-scale analyses could benefit from LiDAR- or UAV-based high-resolution elevation models. Furthermore, our approach remains static, while mass movements are dynamic phenomena influenced by seasonal rainfall patterns, vegetation cover changes, and land use modifications. Future studies should integrate multi-temporal satellite imagery, climatic trends, and NDVI-based vegetation monitoring to enhance the temporal accuracy of susceptibility mapping.
From an applied perspective, the mass movement susceptibility map generated in this study serves as a valuable tool for risk management and land use planning. As demonstrated by many papers and studies, susceptibility maps provide scientific guidance for infrastructure development, slope stabilization measures, and construction restrictions in high-risk areas. The integration of such findings into regional and national hazard mitigation strategies will be crucial in reducing ground movement -related damages and improving the resilience of local communities.

6. Conclusions

The Moroccan Rif is considered, on a national scale, as a benchmark in agriculture, particularly for the cultivation of olives, cannabis, and other crops. It stands out for the high quality of its natural products, which can be used in various fields such as cosmetics. However, the location of the Zoumi region at the heart of the Rif and as a major producer of these products, presents a drawback: it lies in an area at risk of mass movement, which can disrupt its economic activities and destroy the agricultural lands dedicated to these crops.
The collection, analysis, and interpretation of the predisposing factors allowed us to identify the most dominant types of movements as well as their correlation with the responsible parameters. This also provided a better understanding of the origin of this hazard in the Zoumi region, revealing that rivers and seismotectonic activities exert a major influence on the soil instability in the study area. Moreover, logistic regression shows notable performance, estimated at 88%, in the classification and processing of the input data. It also made it possible to determine the importance coefficients of the contributing factors in order to develop a local MM map. This map could prove useful for risk management and prevention in agricultural areas, with the aim of reducing financial losses. It is particularly important to note that the generated map indicates that 50% of the study area is at high to very high risk, while the remainder ranges from moderate to low risk.
The study also provides a framework for future research. Incorporating machine learning techniques, such as random forests or deep learning models, could improve the prediction accuracy of the susceptibility models. Additionally, integrating multi-temporal remote sensing data and hydrometeorological factors (e.g., precipitation and soil moisture) would enhance the dynamic assessment of geomorphological risks. From an applied perspective, this study contributes to the development of MM risk management strategies in northwestern Morocco. The susceptibility map serves as a scientific decision-support tool for policymakers, urban planners, and disaster management authorities, providing a spatially explicit basis for slope stabilization efforts and infrastructure adaptation.
Overall, this research confirms that logistic regression integrated with GIS is a powerful and effective approach for mass movement susceptibility assessment in tectonically active regions such as the Moroccan Rif. The methodology applied here offers a reliable and operational tool for natural hazard prevention, ensuring that urban expansion and land use practices account for mass movement susceptibility to minimize future risks.

Author Contributions

Conceptualization, M.M., A.S., A.E.O. and I.O.; Methodology, M.M., A.E.O., S.B., B.T. and O.A.; Software, M.M., S.B. and N.R.; Validation, M.M., A.S., I.O. and B.T.; Formal analysis, M.M., A.E.O., S.B. and A.B.; Investigation, M.M., I.O., O.A., A.E.O. and D.N.S.; Resources, D.N.S., S.B. and A.B.; Data curation, M.M., A.B., O.A., A.E.O. and I.O.; Writing—original draft preparation, M.M., A.E.O. and O.A.; Writing—review and editing, M.M., A.S., D.N.S., S.B., M.M. and A.E.O.; Visualization, A.E.O., B.T., O.A. and I.O.; Supervision, M.M., A.B., N.R. and D.N.S.; Project administration, M.M., A.E.O. and I.O.; Funding acquisition, M.M., B.T., A.B. and D.N.S. All authors have read and agreed to the published version of the manuscript.

Funding

This research received no external funding.

Institutional Review Board Statement

Not applicable.

Informed Consent Statement

Not applicable.

Data Availability Statement

All data are available from the corresponding authors upon reasonable request.

Acknowledgments

This research was financially supported by the Moroccan government through the CNRST (Centre National de la Recherche Scientifique et Technique) and the integrated action project MA/08/192, part of the Hubert Curien Volubilis partnership (project no. 17174 PK, France). The author extends sincere thanks to Yannick Thierry and Brigitte Van Vliet-Lanoë for their constructive criticism and insightful discussions, which significantly contributed to the improvement of this paper.

Conflicts of Interest

The authors declare that they have no known competing financial interests or personal relationships that could have appeared to influence the work reported in this paper.

Abbreviations

The following abbreviations are used in this manuscript:
MMMass Movements
MMSMass Movements Susceptibility
LRLogistic Regression
GISGeographic Information System
ROCReceiver operating characteristic
AUCArea Under Curve
SNDStream Network Density
SGSlope Gradient
LLithology
LULand Use
FDFault Density
EElevation
EIEarthquakes Isodepths
SASlope Aspect

References

  1. United Nations Office for Disaster Risk Reduction (UNDRR). Global Assessment Report on Disaster Risk Reduction 2022: Our World at Risk—Transforming Governance for a Resilient Future, UNDRR (2022). Available online: https://www.undrr.org/publication/global-assessment-report-disaster-risk-reduction-2022 (accessed on 16 January 2024).
  2. Mastere, M.; El Fellah, B.; Maquaire, O. Landslide inventory map as a first step for hazard and risk assessment: Rif Mountains, Morocco. Bull. L’Institut Sci. Sect. Sci. Terre 2020, 2020, 49–62. [Google Scholar]
  3. Benzougagh, B.; Meshram, S.G.; Baamar, B.; Dridri, A.; Boudad, L.; Sadkaoui, D.; Mimich, K. Relationship between landslides and morpho-structural analysis: A case study in Northeast Morocco. Appl. Water Sci. 2020, 10, 175. [Google Scholar] [CrossRef]
  4. Sbihi, A.; Mastere, M.; Benzougagh, B.; Ouchen, I.; Khedher, K.M.; Spalevic, V.; Sestras, P.; Jaufer, L.; Hughes, P.D.; Kader, S. Probabilistic modeling of earthquake recurrence and magnitude for enhanced geohazard assessment and infrastructure resilience. Eng. Geol. 2025, 356, 108269. [Google Scholar] [CrossRef]
  5. Varnes, D.J. Landslide Hazard Zonation: A Review of Principles and Practice; Natural Hazards, No. 3; UNESCO: Paris, France, 1984; 63p. [Google Scholar]
  6. Millies-Lacroix, A. Les glissements de terrains. Présentation d’une carte prévisionnelle des mouvements de masse dans le Rif (Maroc septentrional). Mines Géologie 1968, 27, 45–55. [Google Scholar]
  7. Selby, M.J. Hillslope Materials; Oxford University Press: Oxford, UK, 1993; 451p. [Google Scholar]
  8. Sharpe, C. Landslides and related phenomena: A study of the mass movements of soil and rock. Geogr. J. 1938, 92, 276. [Google Scholar] [CrossRef]
  9. Hutchinson, J. General Report: Morphological and Geotechnical Parameters of Landslides in Relation to Geology and Hydrogeology; A.A. Balkema: Rotterdam, The Netherlands, 1988. [Google Scholar]
  10. Nemčok, A.; Pašek, J.; Rybář, J. Classification of landslides and other mass movements. Rock Mech. Rock Eng. 1972, 4, 71–78. [Google Scholar] [CrossRef]
  11. Sassa, K. Geotechnical classification of landslides. Landslides Jpn. Landslide Soc. 1989, 3, 21–24. [Google Scholar]
  12. Varnes, D.J. Landslide types and processes Landslides and engineering practice. Highw. Res. Board Spec. Rep. 1958, 24, 20–47. [Google Scholar]
  13. Varnes, D.J. The Logic of Geological Maps, with Reference to Their Interpretation and Use for Engineering Purposes; US Government Printing Office: Washington, DC, USA, 1974; Volume 837. [Google Scholar]
  14. El Kharim, Y. Etude des Mouvements de Versants Dans la Région de Tetouan (Rif Occidental): Inventaire, Analyze et Cartographie. Ph.D. Thesis, Univ Abdelmalek Essaadi, Tétouan, Morocco, 2002; 219p. [Google Scholar]
  15. Sossey Alaoui, F. Traitement et Intégration des Données Satellitaires Optiques et Radar Dans un SIG en Vue de L’obtention de Carte de L’aléa Lié Aux Instabilités de Terrain dans la Péninsule de Tanger. Ph.D. Thesis, Université Mohamed V, Rabat, Morocco, 2005; 175p. [Google Scholar]
  16. Boukhres, N.; Fressard, M.; Thiery, Y.; Mastere, M.; Benzougagh, B.; Fellah, B.E. Mass movement inventory map of the Dhar Souk region and its main spatial morphometric characteristics. Bull. L’Institut Sci. Sect. Sci. Terre 2024, 46, 15–39. [Google Scholar]
  17. Ardizzone, F.; Cardinali, M.; Carrara, A.; Guzzetti, F.; Reichenbach, P. Uncertainty and errors in landslide mapping and hazard assessment. Nat. Hazards Earth Syst. Sci. 2002, 2, 3–14. [Google Scholar] [CrossRef]
  18. Elmoulat, M.; Brahim, L.A.; Mastere, M.; Jemmah, A.I. Mapping of mass movement susceptibility in the Zoumi Region using satellite image and GIS technology (Moroccan Rif). Int. J. Sci. Eng. Res. 2015, 6, 210–217. [Google Scholar]
  19. Li, L.; Jia, M.; Xu, C.; Tian, Y.; Ma, S.; Yang, J. Enhancing landslide susceptibility mapping by integrating neighboring information in slope units: A spatial logistic regression. Remote Sens. 2024, 16, 4475. [Google Scholar] [CrossRef]
  20. Prathom, K.; Sujitapan, C. Performance of logistic regression and support vector machine conjunction with the GIS and RS in the landslide susceptibility assessment: Case study in Nakhon Si Thammarat, southern Thailand. J. King Saud Univ. Sci. 2024, 36, 103306. [Google Scholar] [CrossRef]
  21. El Miloudi, Y.; El Kharim, Y.; El Hamdouni, R. A novel approach for rockfall susceptibility mapping: Transfer learning between boosting models and logistic regression. Environ. Earth Sci. 2025, 84, 447. [Google Scholar] [CrossRef]
  22. Khouz, A.; Trindade, J.; Oliveira, S.; Garcia, R.A.C.; Elbchari, F.; Chaibi, M.; Bougadir, B. Geomorphological 734 coastal slope instability and suscepbility mapping in Safi, Morocco. In Proceedings of the 10o Congresso Nacional de Geomorfologia. Dinâmicas 735 Geomorfológicas no Espaço e no Tempo, Coimbra, Portugal, 18–20 September 2024; pp. 122–128. [Google Scholar]
  23. Chalouan, A. Les Nappes Ghomarides (Rif Septentrional, Maroc), un Terrain Varisque Dans la Chaîne Alpine. Ph.D. Thesis, Université Louis Pasteur, Strasbourg, France, 1986. [Google Scholar]
  24. Lespinasse, P. Géologie des Zones Externes et des Flyschs Entre Chaouen et Zoumi (Centre de la Chaine Rifaine, Maroc). Ph.D. Thesis, Université Pierre et Marie Curie-Paris VI, Paris, France, 1975. [Google Scholar]
  25. Varnes, D.J. Slope movement types and processes. Spec. Rep. 1978, 176, e33. [Google Scholar]
  26. Martins-Campina, B. Le Rôle des Facteurs Géologiques et Mécaniques Dans le Déclenchement des Instabilités Gravitaires: Exemple de Deux Glissements de Terrain des Pyrénées Atlantiques (Vallée d’Ossau et Vallée d’Aspe). Ph.D. Dissertation, Université Sciences et Technologies-Bordeaux I, Bordeaux, France, 2005. [Google Scholar]
  27. Lee, S.; Sambath, T. Landslide susceptibility mapping in the Damrei Romel area, Cambodia using frequency ratio and logistic regression models. Environ. Geol. 2006, 50, 847–855. [Google Scholar] [CrossRef]
  28. Das, I.; Sahoo, S.; van Westen, C.; Stein, A.; Hack, R. Landslide susceptibility assessment using logistic regression and its comparison with a rock mass classification system, along a road section in the northern Himalayas (India). Geomorphology 2010, 114, 627–637. [Google Scholar] [CrossRef]
  29. Kendall, M.G.; Stuart, A. The Advanced Theory of Statistics. Biometrics 1969, 3, 435. [Google Scholar] [CrossRef]
  30. Van Den Eeckhaut, M.; Vanwalleghem, T.; Poesen, J.; Govers, G.; Verstraeten, G.; Vandekerckhove, L. Prediction of landslide susceptibility using rare events logistic regression: A case-study in the Flemish Ardennes (Belgium). Geomorphology 2006, 76, 392–410. [Google Scholar] [CrossRef]
  31. Bai, S.-B.; Wang, J.; Lü, G.-N.; Zhou, P.-G.; Hou, S.-S.; Xu, S.-N. GIS-based logistic regression for landslide suscep-764 tibility mapping of the Zhongxian segment in the Three Gorges area, China. Geomorphology 2010, 115, 23–31. [Google Scholar] [CrossRef]
  32. Mahmood, S.H. Estimating Models and Evaluating their Efficiency under Multicollinearity in Multiple Linear Regression: A Comparative Study. Zanco J. Hum. Sci. 2024, 28, 264–277. [Google Scholar]
  33. Nakarmi, S.S. Multi-collinearity in Research and Wayforward. Kaladarpan 2024, 4, 85–91. [Google Scholar] [CrossRef]
  34. Owoyemi, Q.A.; Bolakale, A. Comparative analysis of some linear predictive models in the presence of multicollinearity. Int. J. Adv. Stat. Probab. 2024, 11, 20–28. [Google Scholar] [CrossRef]
  35. Delacour, H.; Servonnet, A.; Perrot, A.; Vigezzi, J.F.; Ramirez, J.M. March. La courbe ROC (receiver operating characteristic): Principes et principales applications en biologie clinique. Ann. Biol. Clin. 2005, 63, 145–154. [Google Scholar]
  36. Mastere, M. Mass Movement Hazard Assessment at a Medium Scale Using the Weight of Evidence Model and Neo-Predictive Variables Creation. In Mapping and Spatial Analysis of Socio-Economic and Environmental Indicators for Sustainable Development; Rebai, N., Mastere, M., Eds.; Advances in Science, Technology, and Innovation; Springer: Cham, Switzerland, 2020. [Google Scholar] [CrossRef]
  37. Sbihi, A.; Mastere, M.; Benzougagh, B.; Spalevic, V.; Sestras, P.; Radovic, M.; Marković, S.B.; Jaufer, L.; Kader, S. Assessing landslide susceptibility in northern Morocco: A geostatistical mapping approach in Al Hoceima-Ajdir. J. Afr. Earth Sci. 2024, 218, 105361. [Google Scholar] [CrossRef]
  38. van Westen, C.J.; van Duren, I.C.; Kruse, H.M.G.; Terlien, M.T.J. GISSIZ: Training Package for Geographic Information Systems in Slope Instability Zonation; ITC: Bern, Switzerland, 1993. [Google Scholar]
  39. Hewitt, K. Geomorphic hazards in mountainous environments. In Mountain Geomorphology; Routledge: London, UK, 2014; pp. 187–218. [Google Scholar]
  40. Mastere, M.; Van Vliet-Lanoe, B.; Brahim, L.A. Land use mapping and its relation to mass wasting and gullying in the North-Western Rif (Morocco). Geomorphol.-Relief Process. Environ. 2013, 3, 335–352. [Google Scholar] [CrossRef]
  41. Rajaneesh, A.; Logesh, N.; Vishnu, C.L.; Bouali, E.H.; Oommen, T.; Midhuna, V.; Sajinkumar, K.S. Monitoring and Mapping of Shallow Landslides in a Tropical Environment Using Persistent Scatterer Interferometry: A Case Study from the Western Ghats, India. Geomatics 2020, 1, 3–17. [Google Scholar] [CrossRef]
  42. Badapalli, P.K.; Nakkala, A.B.; Kottala, R.B.; Gugulothu, S.; Hasher, F.F.B.; Mishra, V.N.; Zhran, M. Landslide susceptibility level mapping in Kozhikode, Kerala, using machine learning-based random forest, remote sensing, and GIS techniques. Land 2025, 14, 1453. [Google Scholar] [CrossRef]
  43. Keefer, D.K. Landslides caused by earthquakes. Geol. Soc. Am. Bull. 1984, 95, 406–421. [Google Scholar] [CrossRef]
  44. Keefer, D.K. Investigating landslides caused by earthquakes: A historical review. Surv. Geophys. 2002, 23, 473–510. [Google Scholar] [CrossRef]
  45. Boukhres, N.; Mastere, M.; Thiery, Y.; Maquaire, O.; El Fellah, B.; Costa, S. A comparative modeling of landslides susceptibility at a meso-scale using frequency ratio and analytic hierarchy process models in geographic information system: The case of African Alpine Mountains (Rif, Morocco). Model. Earth Syst. Environ. 2022, 9, 1949–1975. [Google Scholar] [CrossRef]
  46. Mastere, M.; Achbun, A.; El Fellah, B. Open Remote Sensing Image Classification Using NDVI and Thermal Bands. In Mapping and Spatial Analysis of Socio-Economic and Environmental Indicators for Sustainable Development; Rebai, N., Mastere, M., Eds.; Advances in Science, Technology, and Innovation; Springer: Cham, Switzerland, 2020. [Google Scholar] [CrossRef]
  47. Allison, P.D. Logistic Regression Using the SAS System: Theory and Application; SAS Institute: Cary, NC, USA, 1999; 288p. [Google Scholar]
  48. Menard, S. Applied Logistic Regression Analysis; SAGE Publications: Thousand Oaks, CA, USA, 2001. [Google Scholar]
  49. Zhao, P.; Wang, Y.; Xie, Y.; Uddin, M.G.; Xu, Z.; Chang, X.; Zhang, Y. Landslide susceptibility assessment using information quantity and machine learning integrated models: A case study of Sichuan province, southwestern China. Earth Sci. Inform. 2025, 18, 190. [Google Scholar] [CrossRef]
  50. Benchelha, S.; Aoudjehane, H.C.; Hakdaoui, M.; El Hamdouni, R.; Mansouri, H.; Benchelha, T.; Alaoui, M. Landslide susceptibility mapping in the commune of Oudka, Taounate Province, North Morocco: A comparative analysis of the logistic regression, multivariate adaptive regression spline, and artificial neural network models. Environ. Eng. Geosci. 2020, 26, 185–200. [Google Scholar] [CrossRef]
  51. El-Fengour, A.; Motaki, H.E.; Bouzidi, A.E. Landslides susceptibility modeling using multivariate logistic regression model in the Sahla Watershed in northern Morocco. Soc. Nat. 2021, 33, e59124. [Google Scholar] [CrossRef]
Figure 1. Geographical location of the study area in the Moroccan and African contexts.
Geomatics 05 00051 g001
Figure 2. Lithological map and spatial distribution of MM in the study area, based on the classification by Varnes (1978) and Campina (2005), [25,26].
Geomatics 05 00051 g002
Figure 3. Examples of landslides detected on very high-resolution satellite imagery (SPOT 5). (A) shallow landslides with arrows marking the initiation zones; (B) Translational landslide; (C) translational landslide; (D) shallow landslides, where the large arrow indicates the initiation zone of the main landslide, while the smaller arrows highlight secondary, smaller-scale failures.
Geomatics 05 00051 g003
Figure 4. Methodology flowchart.
Geomatics 05 00051 g004
Figure 5. Maps of predisposing factors: (A) Geological formations, (B) Altitude distribution, (C) Slope gradient (steepness), (D) Slope aspect, (E) Fracture density distribution, (F) density of stream networks, (G) Land cover classification, and (H) Seismic isodepth contours.
Geomatics 05 00051 g005
Figure 6. The classification of the identified mass movements.
Geomatics 05 00051 g006
Figure 7. The percentage of each type of mass movement according to classes of predictive variables: (A) lithological units, (B) elevation ranges, (C) slope gradients, (D) slope orientations, (E) fracture density levels, (F) stream networks density, (G) LULC, and (H) earthquakes isodepths.
Geomatics 05 00051 g007
Figure 8. The global density of combined mass movement types for each category of predictive variables. (A) lithological units, (B) elevation ranges, (C) slope gradients, (D) slope orientations, (E) fracture density levels, (F) stream networks density, (G) LULC, and (H) earthquakes isodepths.
Geomatics 05 00051 g008
Figure 9. The degrees of freedom of the predictor variables (Values < 0.05 Indicate some conditional dependence).
Geomatics 05 00051 g009
Figure 10. Chi-square (x2) statistics and Cramer’s V, computed for the eight independent predisposing factors.
Geomatics 05 00051 g010
Figure 11. Tolerance (TOL) and Variance Inflation Factor (VIF) computed for the eight independent triggering parameters.
Geomatics 05 00051 g011
Figure 12. The confusion matrix of the logistic regression model based on the input data.
Geomatics 05 00051 g012
Figure 13. The regression coefficients derived for the eight MM predisposing variables.
Geomatics 05 00051 g013
Figure 14. A mass movement susceptibility map of the Zoumi region generated using logistic regression coefficients.
Geomatics 05 00051 g014
Figure 15. Statistics of inventoried mass movements across the evaluated susceptibility levels.
Geomatics 05 00051 g015
Figure 16. The Receiver Operating Characteristic of the LR model and AUC value.
Geomatics 05 00051 g016
Table 1. Eight factors selected to assess the susceptibility of mass movements in the Zoumi region.
FactorsSources of DataDescription
LithologyGeological mapsConglomerate
Marl
Marly Calcareous
Pelite
Sandstone
Density of Tectonic structuresVery Low
Low
Moderate
High
Very High
Slope gradientSatellite image
(DEM and Landsat 8 OLI)
0–5°
5–10°
10–15°
15–20°
20–25°
25–53°
Slope aspectNorth
East
South
West
Altitude114–314
314–514
514–714
714–975
Density of Stream NetworksVery Low
Low
Moderate
High
Very High
Land Cover/Land UseUrban Area
Forests
Natural Vegetation
Nacked Area
Agricultural Area
Seismic isodepthUSGS database0–10 m
10–20 m
20–30 m
30–50 m
50–95 m
Table 2. Typological framework of mass movements based on data sources and literature References.
TypologySources of DataReference of Classification
Mass MovementLandslidesField missions
and satellite image
Varnes, 1978 [25]
Campina, 2005 [26]
Rockfalls
Creep
Debris flow
Disclaimer/Publisher’s Note: The statements, opinions and data contained in all publications are solely those of the individual author(s) and contributor(s) and not of MDPI and/or the editor(s). MDPI and/or the editor(s) disclaim responsibility for any injury to people or property resulting from any ideas, methods, instructions or products referred to in the content.