1. Introduction
Tropical cyclones (TCs) cause structural, environmental, economic, and societal damages around the world due to their fast winds, storm surges, and flooding rainfall [
1]. The most familiar classification for these systems is according to their intensity, which refers to the maximum sustained wind speed, although this typically happens in a small area near the center of the storm. Size is measured by the radial extent of gale-force (17 m/s) winds, which occur over a much larger area. Although abundant rainfall from TCs contributes to flooding that endangers lives and livelihoods [
2], no standard metric exists to categorize TCs according to their rain field size. The Dvorak technique utilizes the spatial patterns of TC clouds to determine storm intensity [
3]. As such a standard is not in place to measure the spatial properties of TC rain fields, continued efforts along these lines are warranted.
Countries in southeastern Africa such as Mozambique and Madagascar are impacted by TCs that can reach wind speeds of over 67 m/s and produce flooding rainfall as recently occurred with Cyclones Kenneth and Idai in 2019 [
4,
5]. TCs can make landfall over Madagascar and/or Mozambique multiple times in a single season [
6]. Rural Mozambique is spotted with communities of farmers that depend entirely on agriculture [
7]. Drought is detrimental to their income, yet large amounts of rainfall can be just as damaging [
8]. Many factors such as sea surface temperatures (SSTs) and interannual variations in atmospheric circulation contribute to rainfall variability in the area, but TCs have caused much damage and many lives have been lost when they produce flooding rainfall [
1,
9,
10]. Wind and rainfall properties of TCs affecting other parts of the globe have been studied by hundreds of researchers, however, less research has focused on TCs that affect African countries.
Although TC frequency and landfall occurrence have been documented globally, the few studies that have examined the rainfall extent of these storms focused on the Atlantic basin [
11,
12,
13]. These studies examined TCs moving over large landmasses and did not look at how topography of island nations might affect rainfall extent and rain field shape. Previous research showed that TCs may expand or contract in rainfall extent when interacting with land [
12]. The amount or extent of rainfall produced by a landfalling TC changes due to environmental factors such as topography and loss of heat and moisture from the sea [
14]. To our knowledge, no studies have examined rainfall extent for TCs that form over the Southwest Indian Ocean (SWIO).
There are multiple dynamic and thermodynamic conditions that must exist for a TC to form and these conditions must persist for the storm to be maintained and/or intensify [
15]. Of these, much previous research has examined how vertical wind shear (VWS) affects structure and rainfall asymmetry. When the winds in the upper troposphere are too strong, they cause the TC to tilt and this causes its rainfall regions to develop more strongly on the side of the tilt (downshear), while rainfall decreases on the opposite upshear side [
16]. Lonfat et al. [
17] included shear as a key predictor of TC rainfall in their statistical model. Corbosiero and Molinari [
18] and Chen et al. [
19] found that VWS > 5 m/s negatively affects TC organization. Lonfat et al. [
20] suggested precipitation distribution is asymmetric toward the leading edge of TCs in the Southern Hemisphere.
Key thermodynamic conditions needed for TC development include sufficient moisture in the environment surrounding the storm, and high SSTs generally >26.5 °C. Although it has been studied less than VWS, water vapor available in the environment surrounding a TC is crucial to storm development and sustenance. In a modeling study, [
21] found that higher relative humidity (RH) values in the environment surrounding a TC led to increased wind field size, while an observational study by [
11] found that higher RH values corresponded to larger extent of rain fields on the western sides of hurricanes making landfall over the U.S. On the other hand, [
22] found that dry air can limit the ability of a TC to intensify and introduce asymmetries in convection. SSTs are tightly coupled with environmental humidity in the tropics [
23]. Evans et al. [
24] found that TCs over deep and warm waters had higher area-averaged rainfall than when over cooler waters. Lin et al. [
25] found that higher SSTs corresponded to higher TC rain rates.
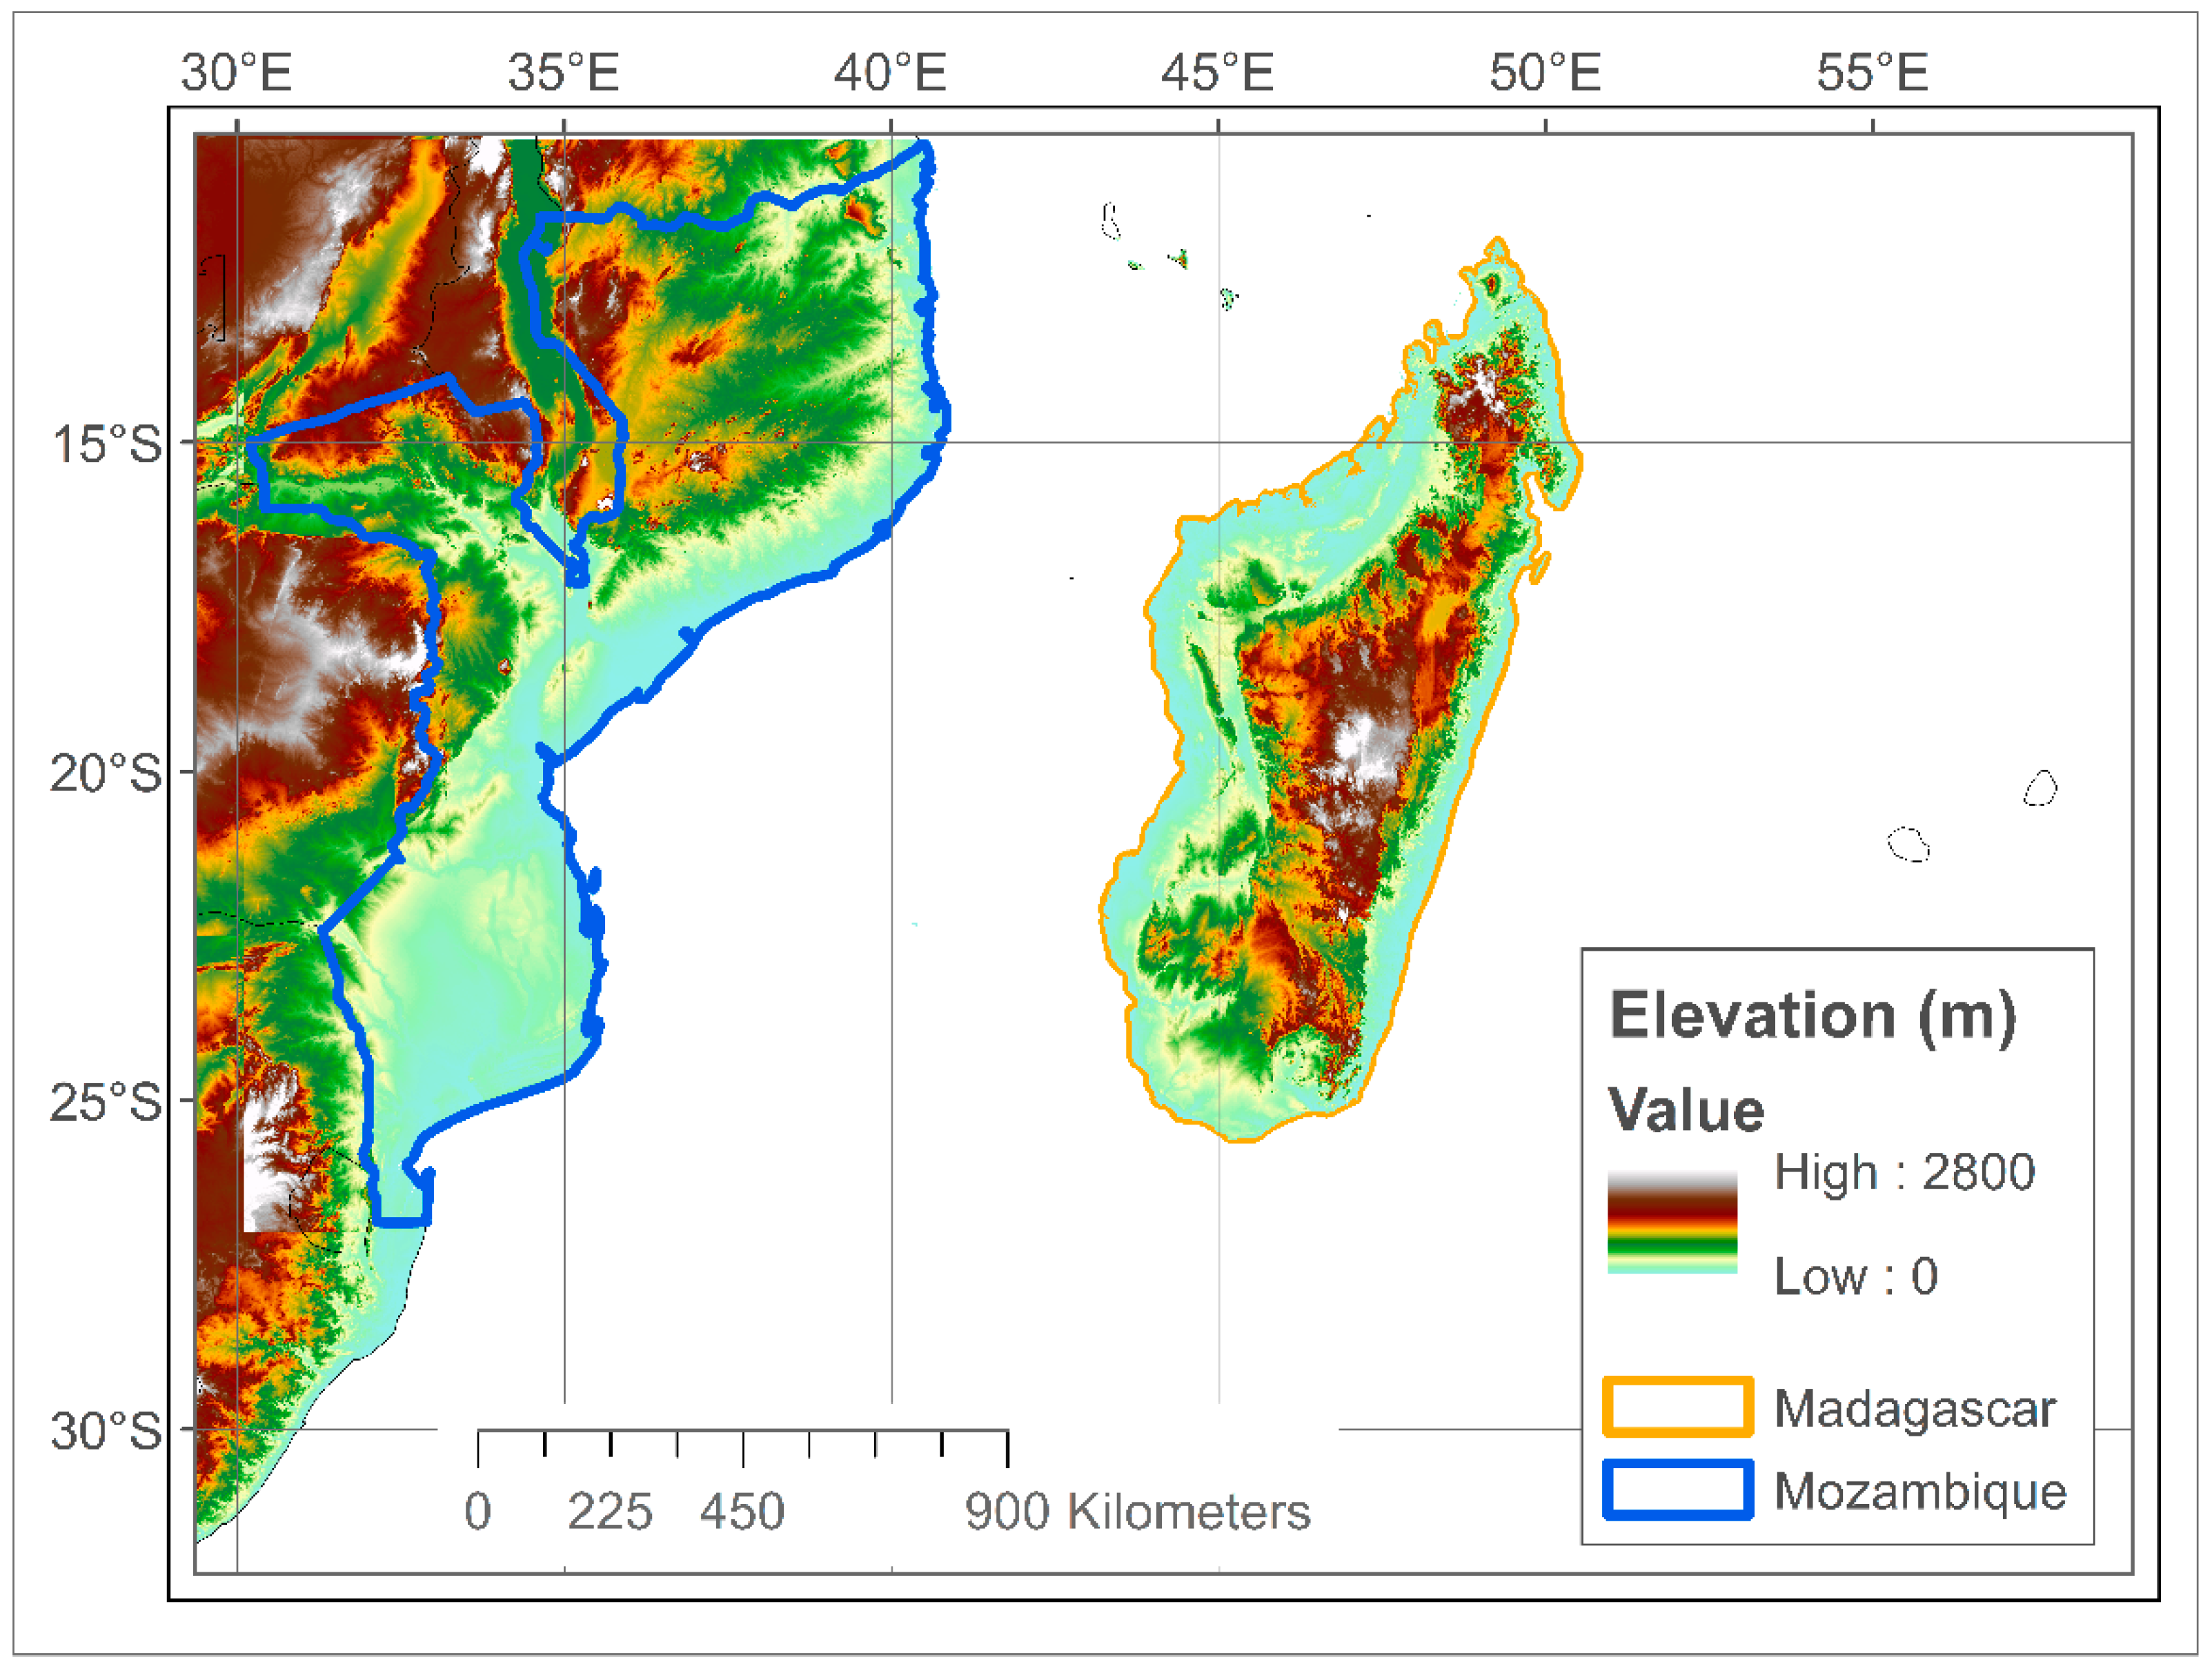
Both Madagascar and Mozambique lie between 10° S and 30° S (
Figure 1) in a region where the thermodynamic and dynamic conditions necessary for TC development occur during the late spring, summer, and early autumn [
26]. Rainfall is highly variable during these months due to effects of the Intertropical Convergence Zone (ITCZ), which moves across these countries during austral summer [
27,
28]. When TCs move over Madagascar and Mozambique, they encounter different topography (
Figure 1). Madagascar is characterized by a mid-island plateau 1600 m high with peaks up to 2600 m which includes the Malagasy Mountains in the northwest and Maromokotro on the north of the island having the tallest point of ~2800 m above sea level [
14]. While moving over these steep mountains, TCs weaken but can re-intensify once on the leeward side due to development of the lee rotor [
14,
29]. On the other hand, Mozambique has a low-lying coastline that extends more than 200 km westward before increasing to the Manica Plateau, Lebombo Mountains in the south, and Namuli Mountains in the north. The Mozambique Channel is between these countries, whose coastlines are 430–1050 km apart, and its warm waters provide energy to help TCs form or intensify, while VWS remains relatively low [
30].
Massive flooding often occurs in rural Madagascar and Mozambique during TCs [
7]. Soil rapidly erodes when immense amounts of rainfall are received. Cycles of drought and TCs create landslides and destroy crops which are instrumental in the livelihoods of the people [
31]. Poverty in Mozambique can be exacerbated by a highly variable climate [
8]. Some communities have responded to the flooding risks by relocating to higher ground where consequently, they are more prone to drought [
32]. Timing of TC rainfall is instrumental to food security for Madagascar farmers with regard to water budget planning and landslides—too little can deprive crops while too much can cause landslides and flood fields during planting season forcing a delay in harvest [
7].
During 1950–1999, fewer than 5% of TCs that formed over the SWIO made landfall over southern Africa’s east coast [
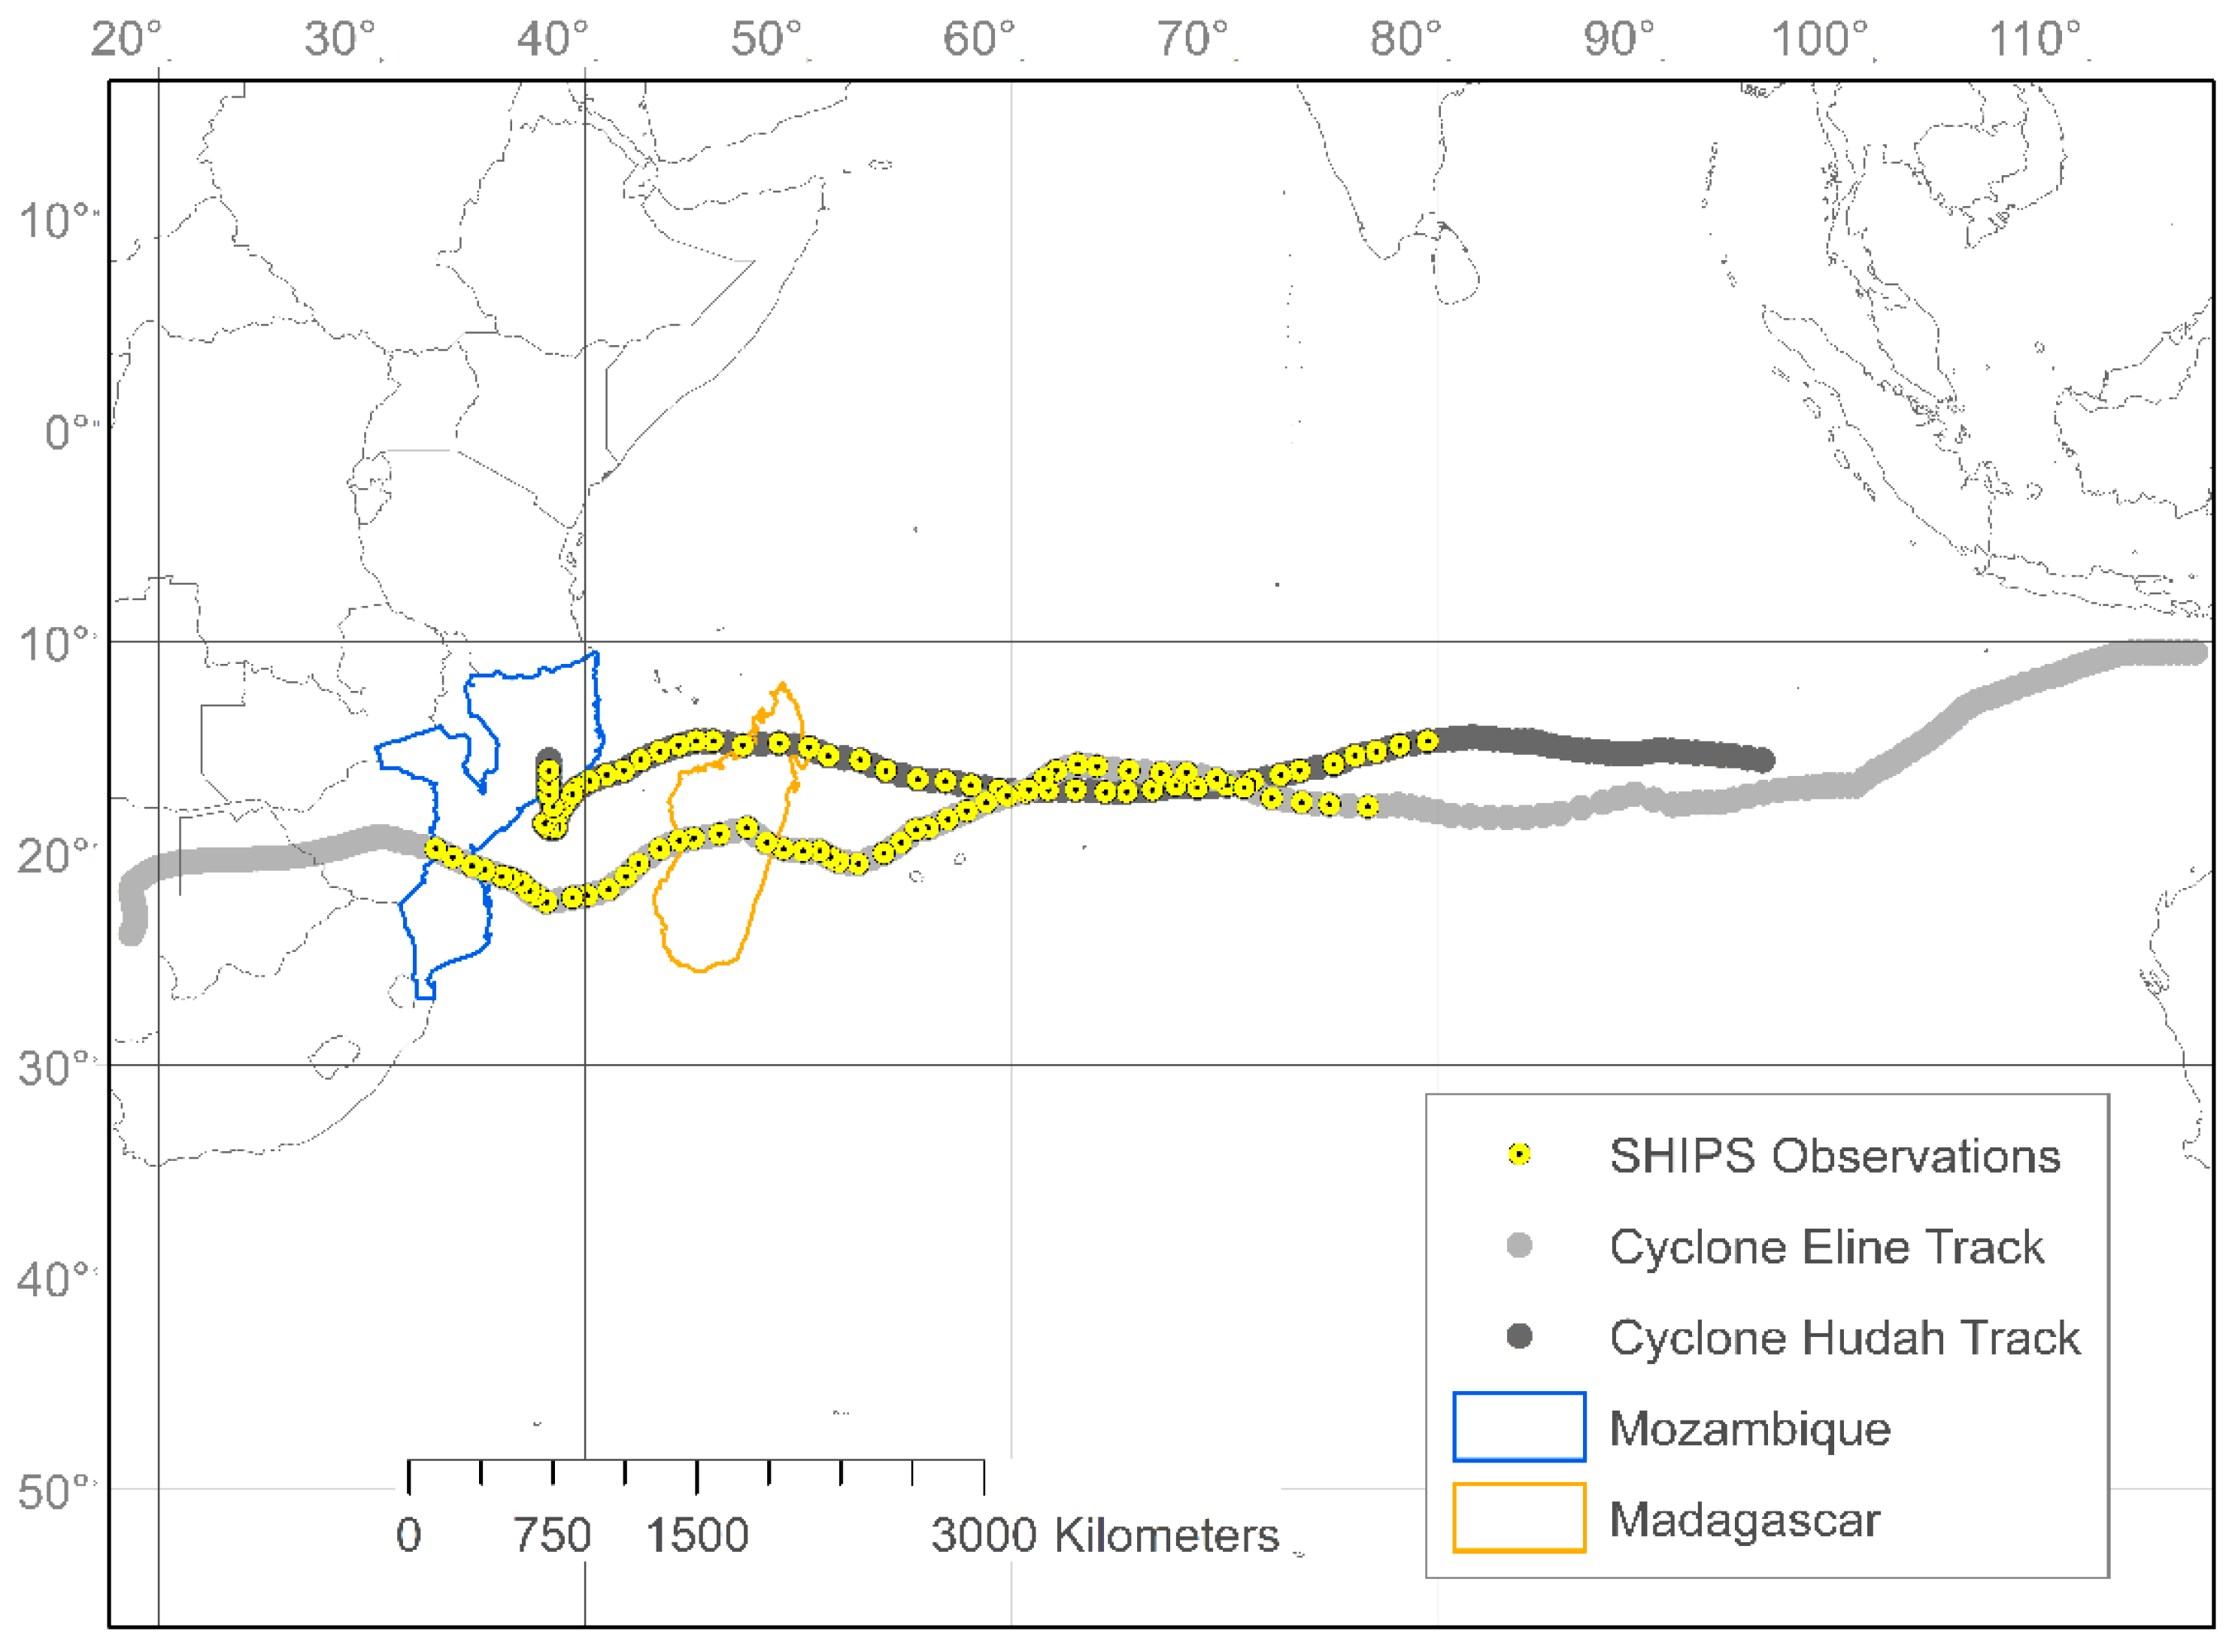
33]. Yet in 2000, Cyclones Eline and Hudah both made landfalls over Madagascar and Mozambique (
Figure 2). Their tracks were atypical as the majority of TCs recurve west of Madagascar or turn south once entering the Mozambique Channel and recurve [
26,
30,
34]. Fitchett and Grab [
35] state that only 5% of TCs make landfall over both countries, although their study does not include Hudah. A La Niña was occurring which is typically associated with more zonal TC tracks [
36]. Eline formed near the coast of Indonesia on 3 February and made landfalls over Madagascar and Mozambique on 17 and 22 February, respectively. Southern Africa was well above-normal in terms of rainfall in the weeks prior to Eline’s passage. Reason and Keibel [
33] found that latent heat flux was higher than normal which likely contributed to Eline’s intensification prior to its Mozambique landfall and the record rainfall it produced. Hudah formed on 22 March, making landfall over Madagascar (Mozambique) on 2 (8) April. The effects caused by Cyclones Eline and Hudah were widespread and devastating. Eline brought >20 cm per day of rain to an already wet region of Mozambique [
36]. After Eline, initial estimates showed that over 1 million people were affected with 300,000 homeless or displaced, >69 deceased, and major economic impacts to agriculture and infrastructure [
37]. According to the Food and Agriculture Organization (FAO): Special alert #301 (2000), floods caused by Eline drastically affected food security [
37]. An estimated 150,000 hectares (~370,000 acres) of crops were lost due to flooding from Eline. In South Africa, farmers lost >50% of their exportable products [
38]. Rain fields from Cyclone Hudah crossed over land just five weeks after rainfall from Eline stopped. Hudah contributed at least 17 more deaths, ~100,000 homeless, ~300,000 displaced, and further crop damage in already devastated areas [
39].
The importance of environmental conditions in the development of TC rain fields, and the limited studies about rain fields of TCs over the SWIO, were considered when developing the current study. We hypothesized that rain field extent will be large and more symmetrical, and the rain fields will completely enclose the circulation center, be centered on the circulation center, and have high solidity as the TC experiences low vertical wind shear and high values of relative humidity while moving over warm waters. Landfall and/or encountering strong vertical wind shear should associate with an asymmetrical and dispersed rain field that does not completely enclose the storm center. We explored these proposed relationships by comparing Cyclones Eline and Hudah which intensified into the equivalent of a hurricane and took similar trajectories over the SWIO, making landfalls over Madagascar and Mozambique (
Figure 1). We tested the hypothesis by comparing shape metrics including asymmetry, solidity, dispersion, closure, and area covered by rain. Additionally, we analyzed environmental conditions including SST, vertical wind shear, and relative humidity between the storms, for both before and after rain field interaction with land using non-parametric statistical tests.
2. Materials and Methods
Rain gauge data are not spatially or temporally consistent for either Madagascar or Mozambique [
40]. Thus, we defined rain rates produced in both TCs using data from the Tropical Rainfall Measuring Mission (TRMM) 3B42 product [
41]. Data from the TRMM’s microwave imager and multi-sensor infrared-based datasets are calibrated and combined to produce a snapshot of rain rates every three hours with a 0.25° spatial resolution with coverage 50° N-S. The rain rates are verified using ground observations on a monthly scale. Numerous researchers have utilized the TRMM 3B42 dataset to examine rainfall production for TCs globally and rainfall over the study region [
8,
40,
42,
43,
44].
The 3-hourly positions, intensity, and speed of forward motion of each TC were taken from the International Best Track for Climate Stewardship (IBTrACS) dataset [
45]. Intensity estimates from the Bureau of Meteorology and La Reunion are based on a 10-min sustained speed. Original values are in kt, which we converted to m/s. Intensity values are satellite estimates which are subject to some variability in precision especially over land, and maximum sustained wind speeds are not estimated once a TC becomes too weak.
Data pertaining to VWS, moisture, and SSTs were taken from the Statistical Hurricane Intensity Prediction Scheme (SHIPS) dataset for an equal number of observations for each TC (
Figure 1) [
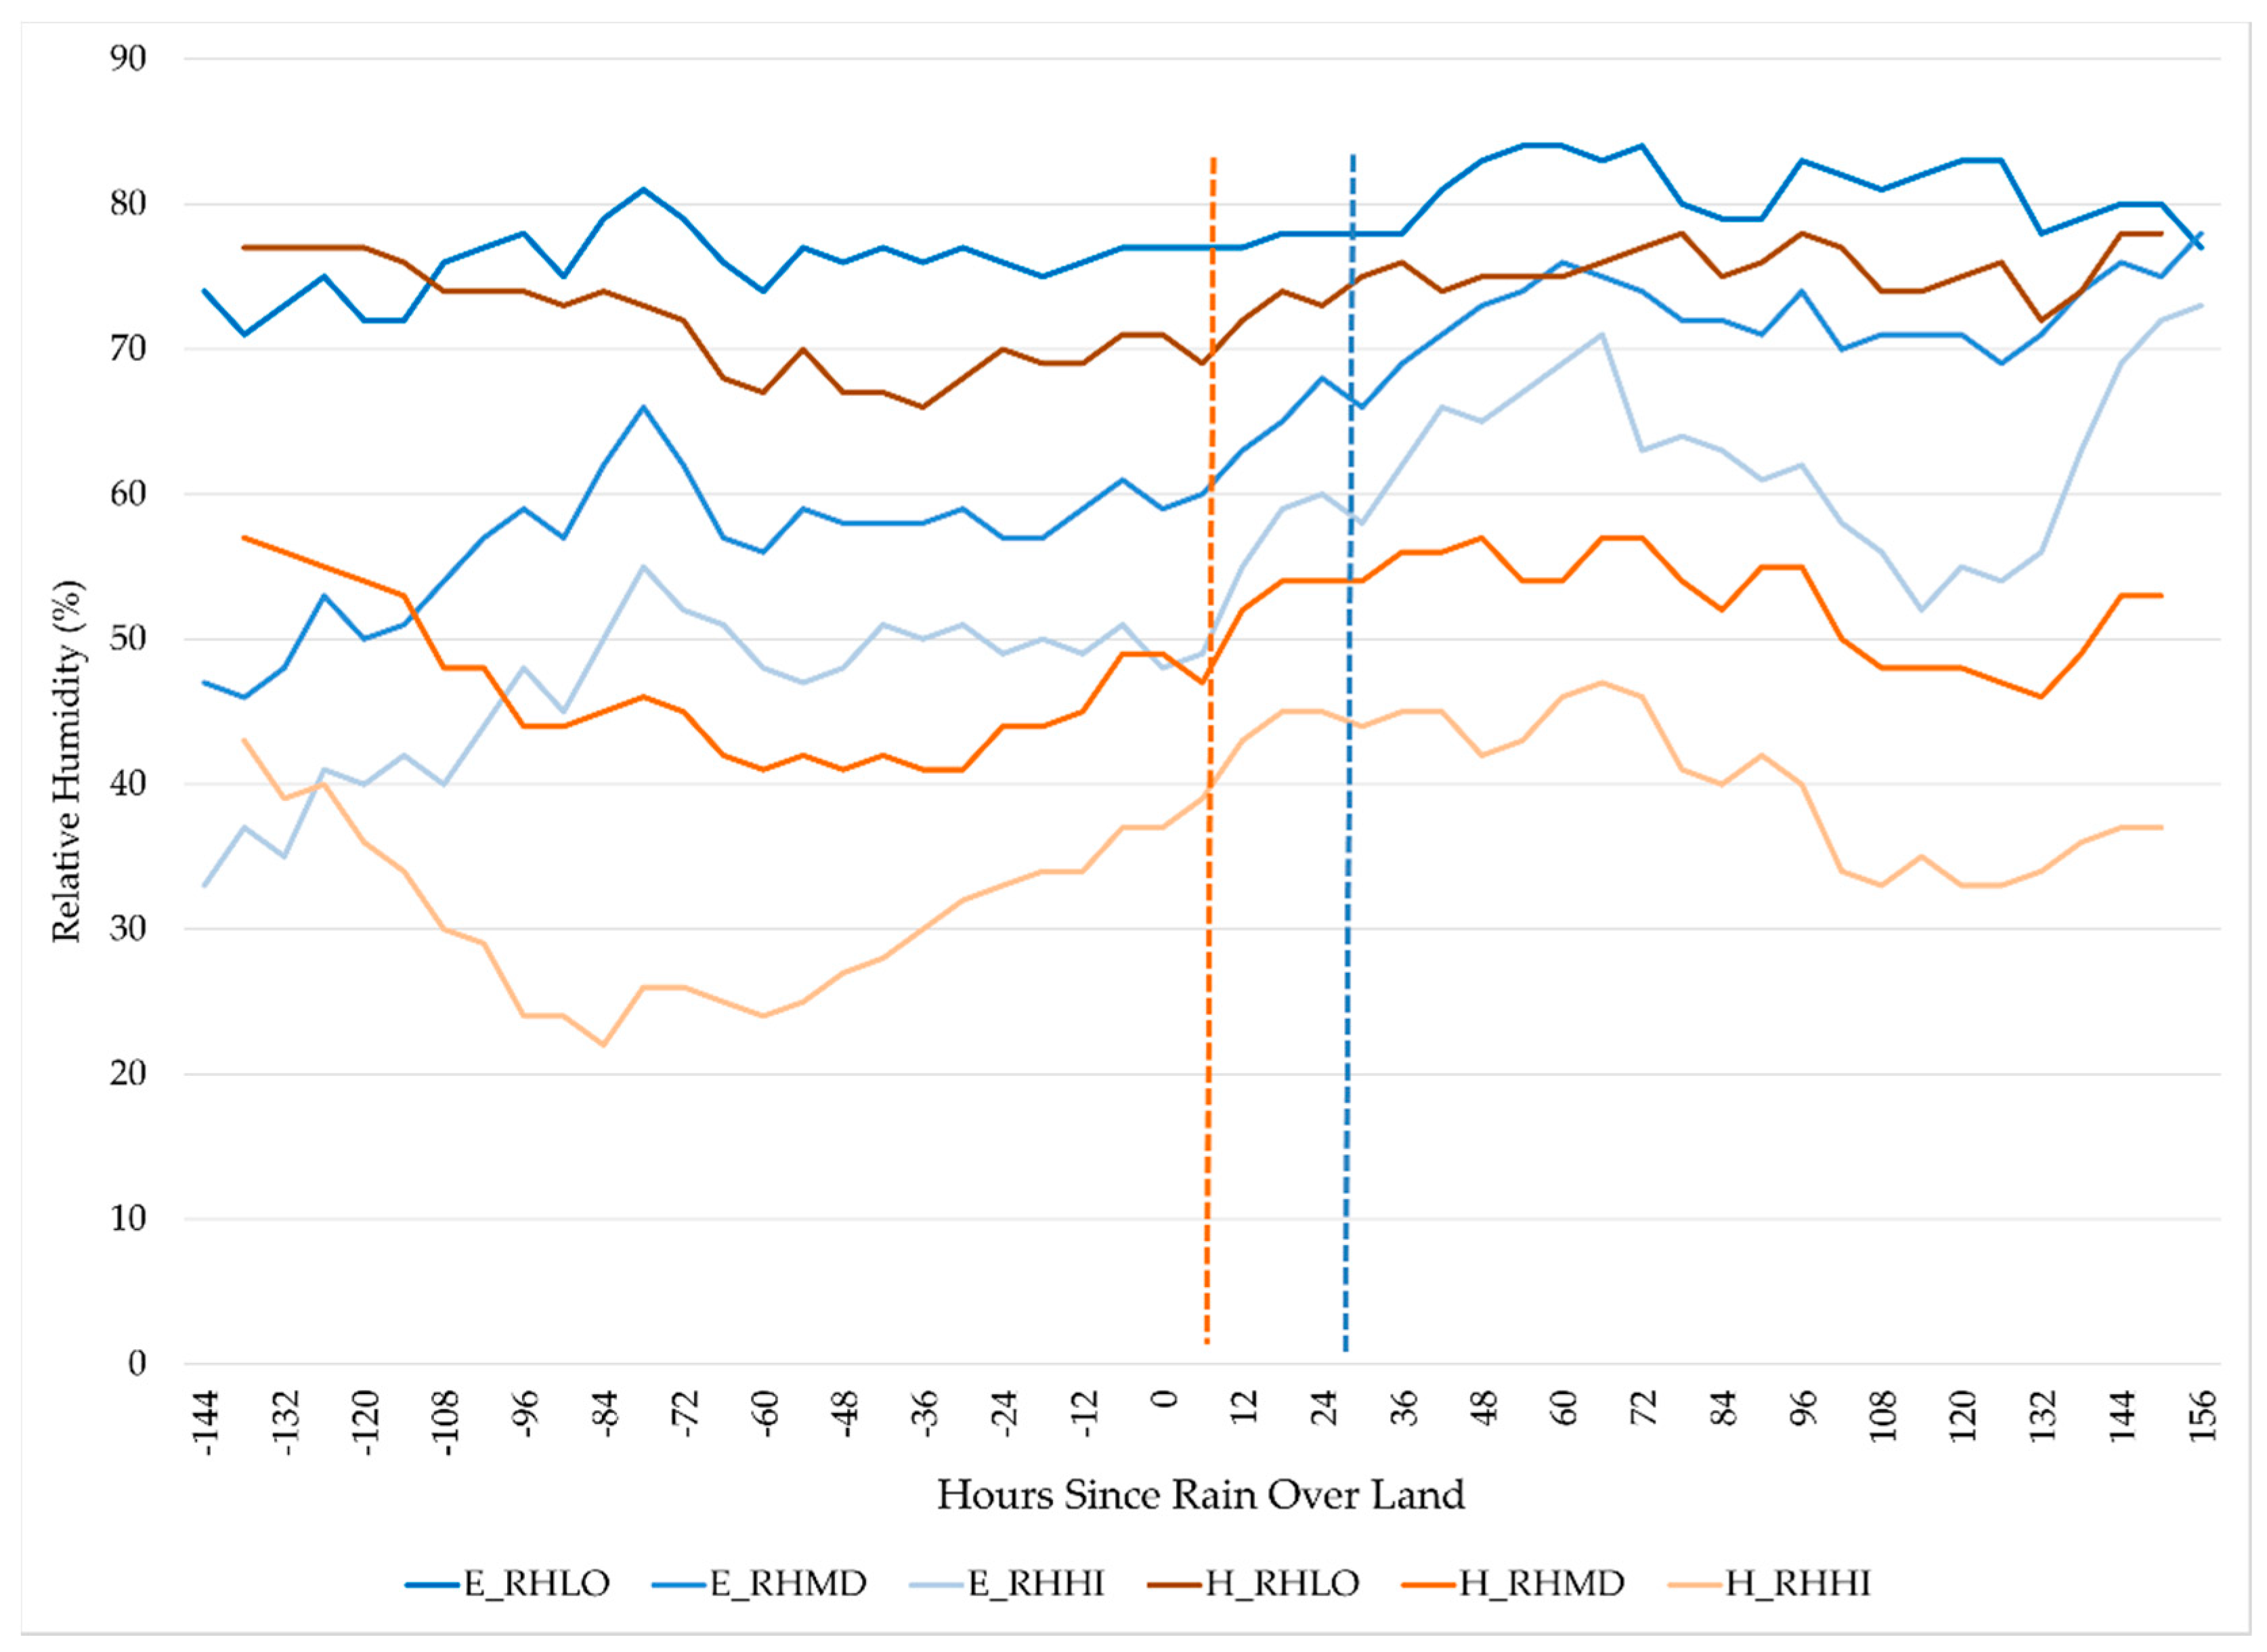
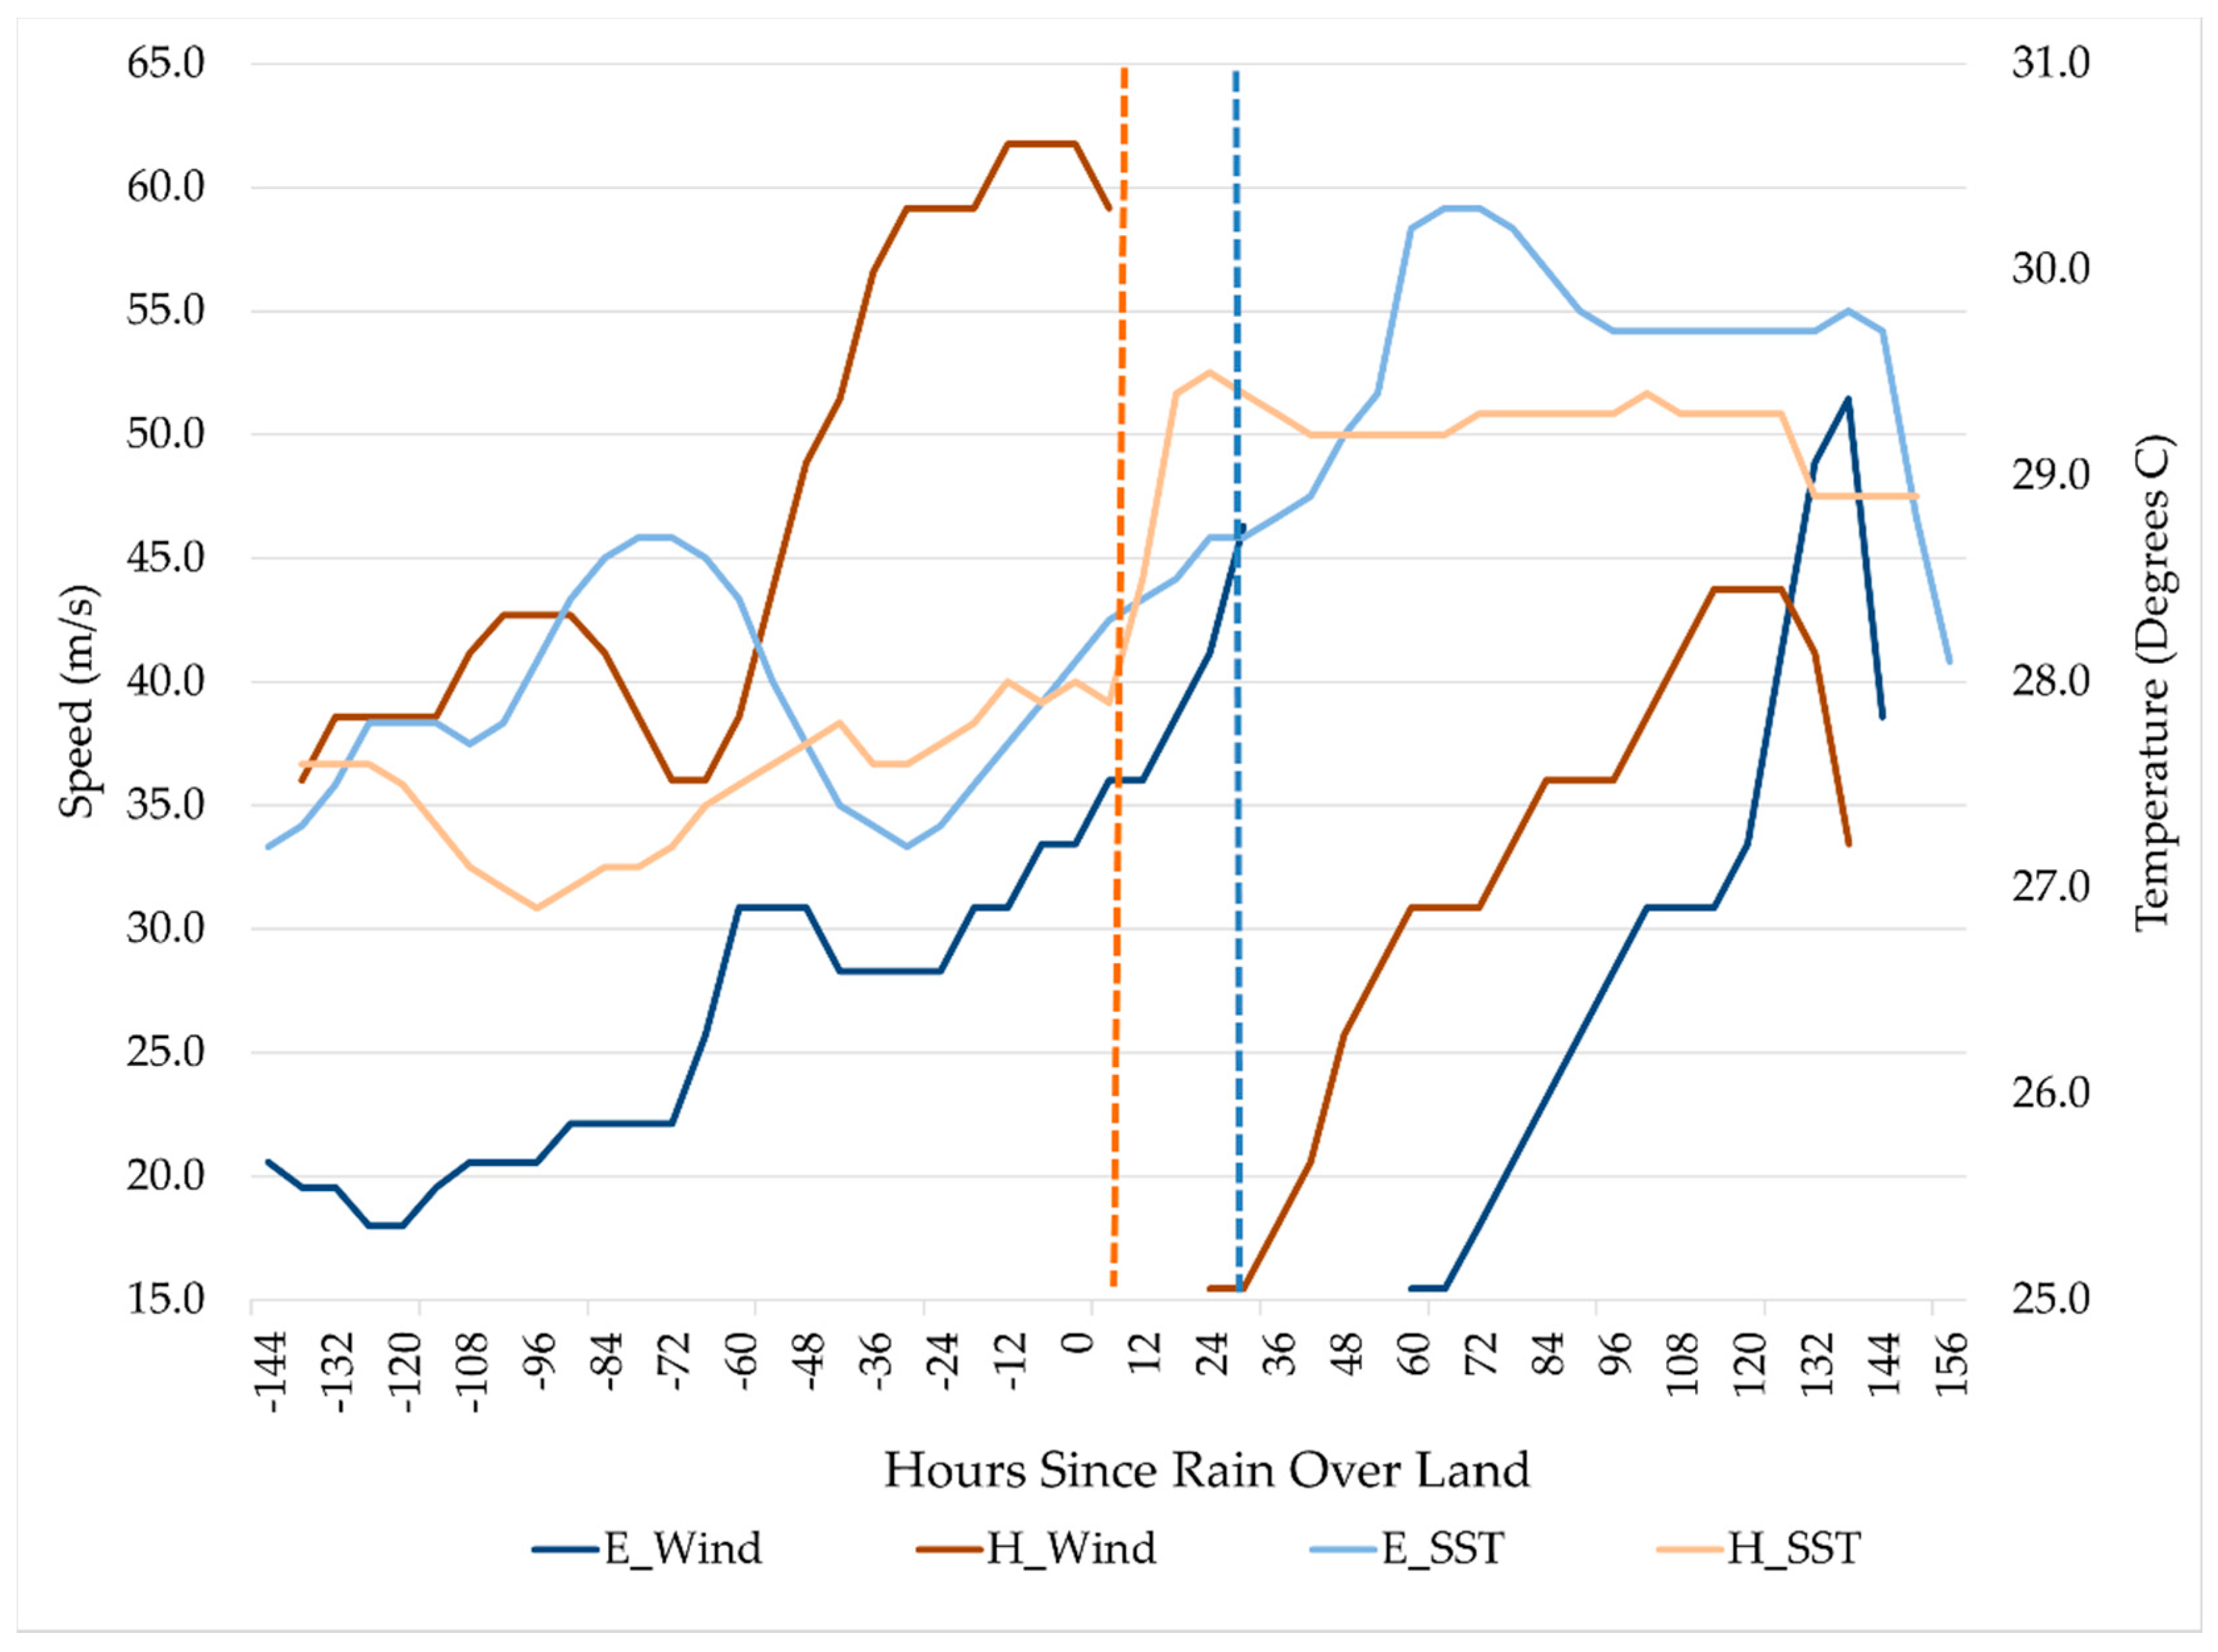
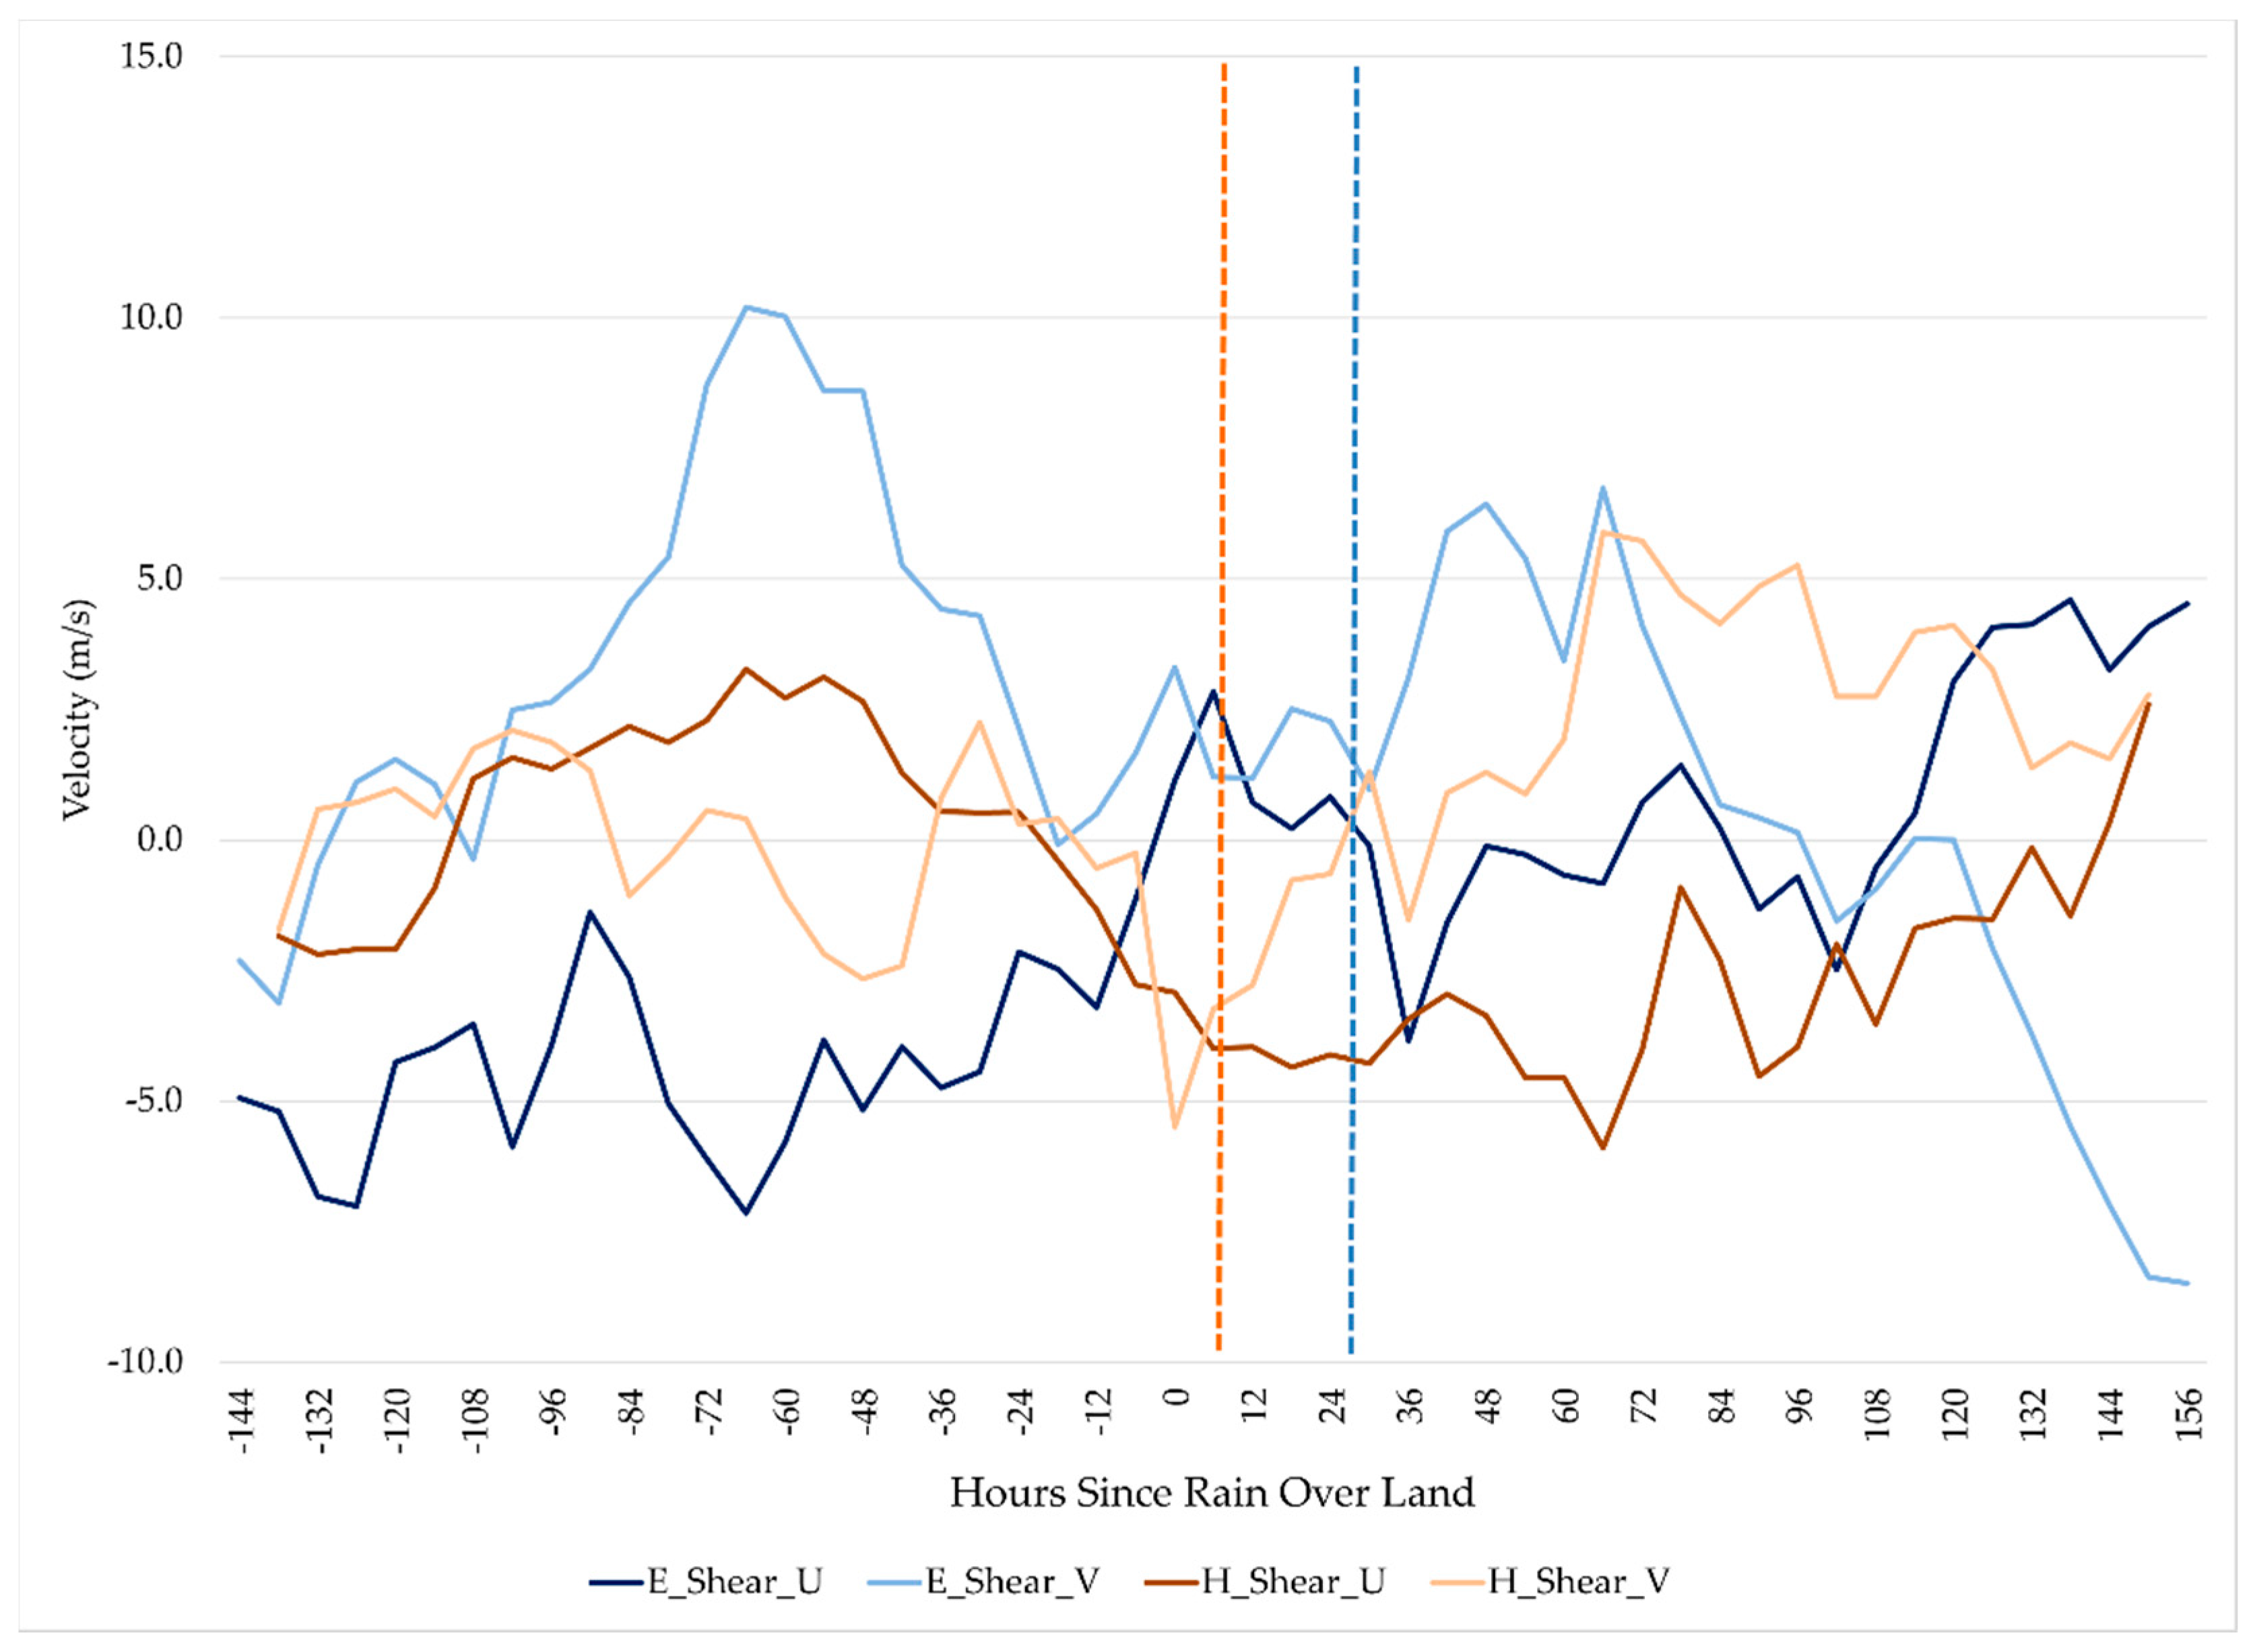
46]. The SHIPS dataset contains more than 100 variables that are used in a statistical model to help forecast TC intensity. Raw values taken from the Global Forecast System are analyzed every six hours by averaging values in a ring extending 200–800 km from the TC’s circulation center. This removes the core of the storm from the analysis so that conditions at the storm’s edge and in its surrounding environment are considered. For VWS, wind vectors from 200 and 850 hPa are subtracted and then averaged over the ring to produce a value for the speed and direction. We combine speed and heading to determine u (zonal) and v (meridional) components of the deep-layer shear. For RH, values are averaged over 850–700 hPa (RHLO), 700–500 hPa (RHMD), and 500–300 hPa (RHHI). Reynold’s SSTs are utilized to examine ocean conditions.
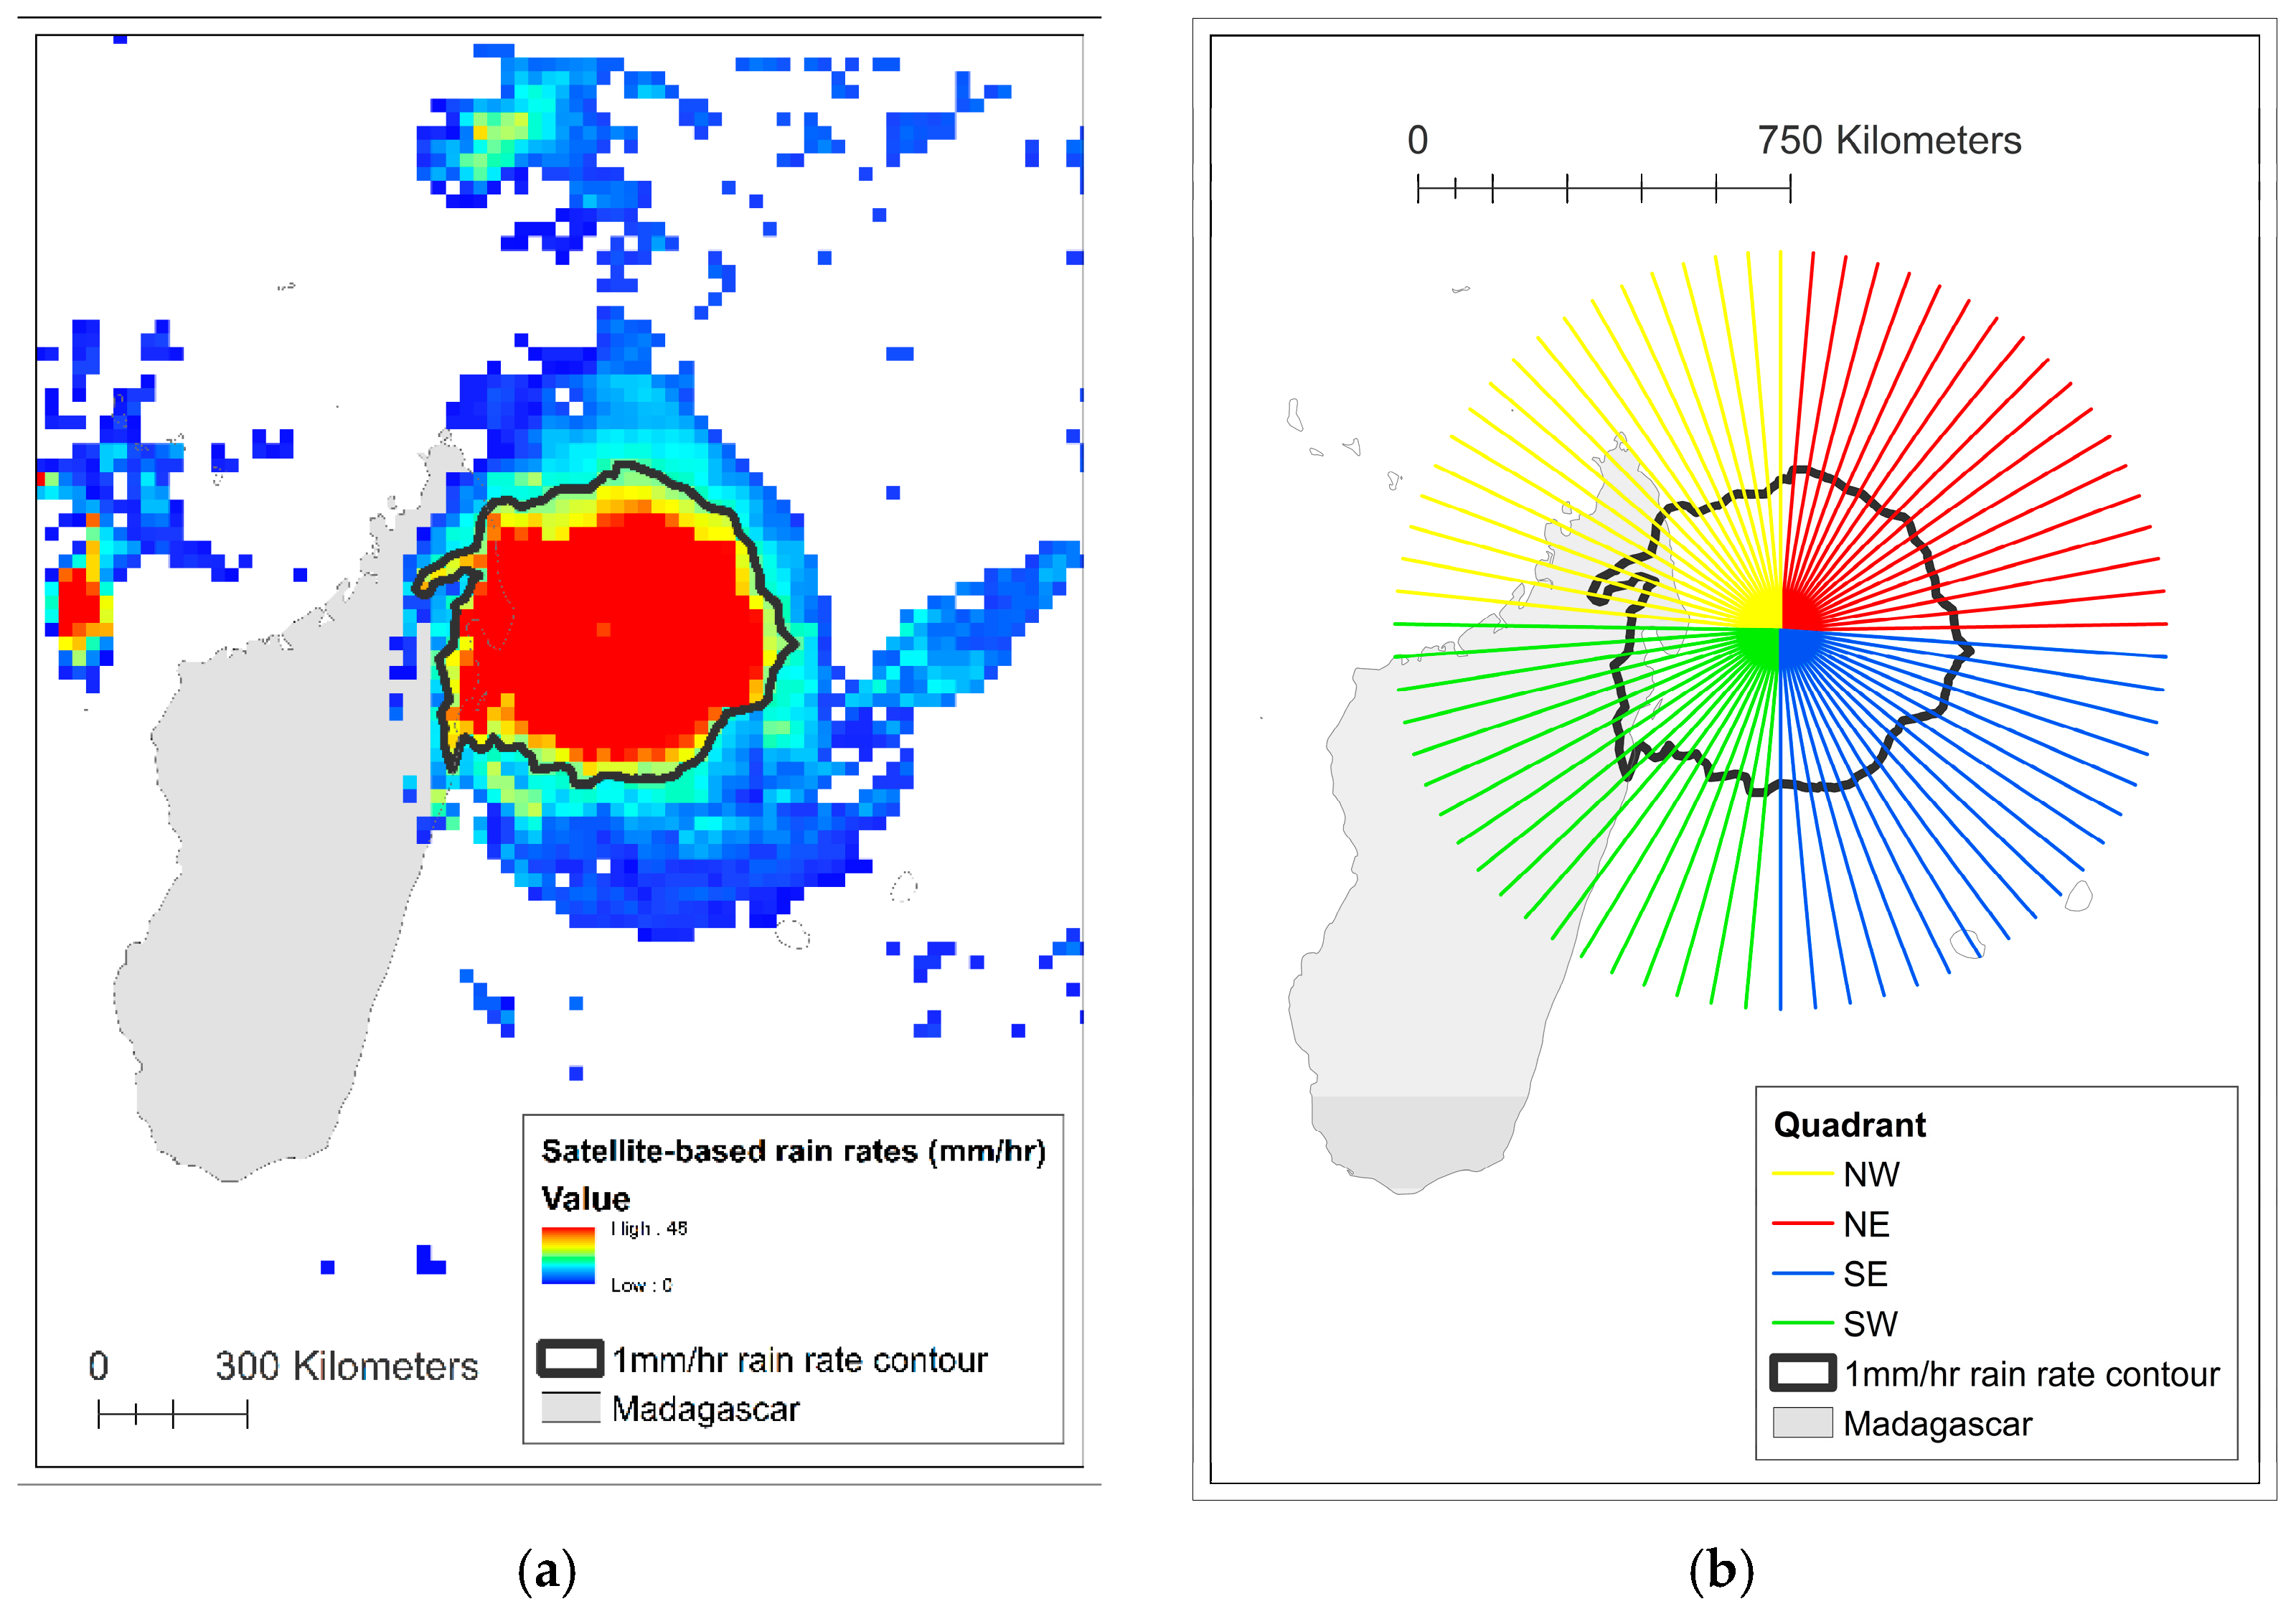
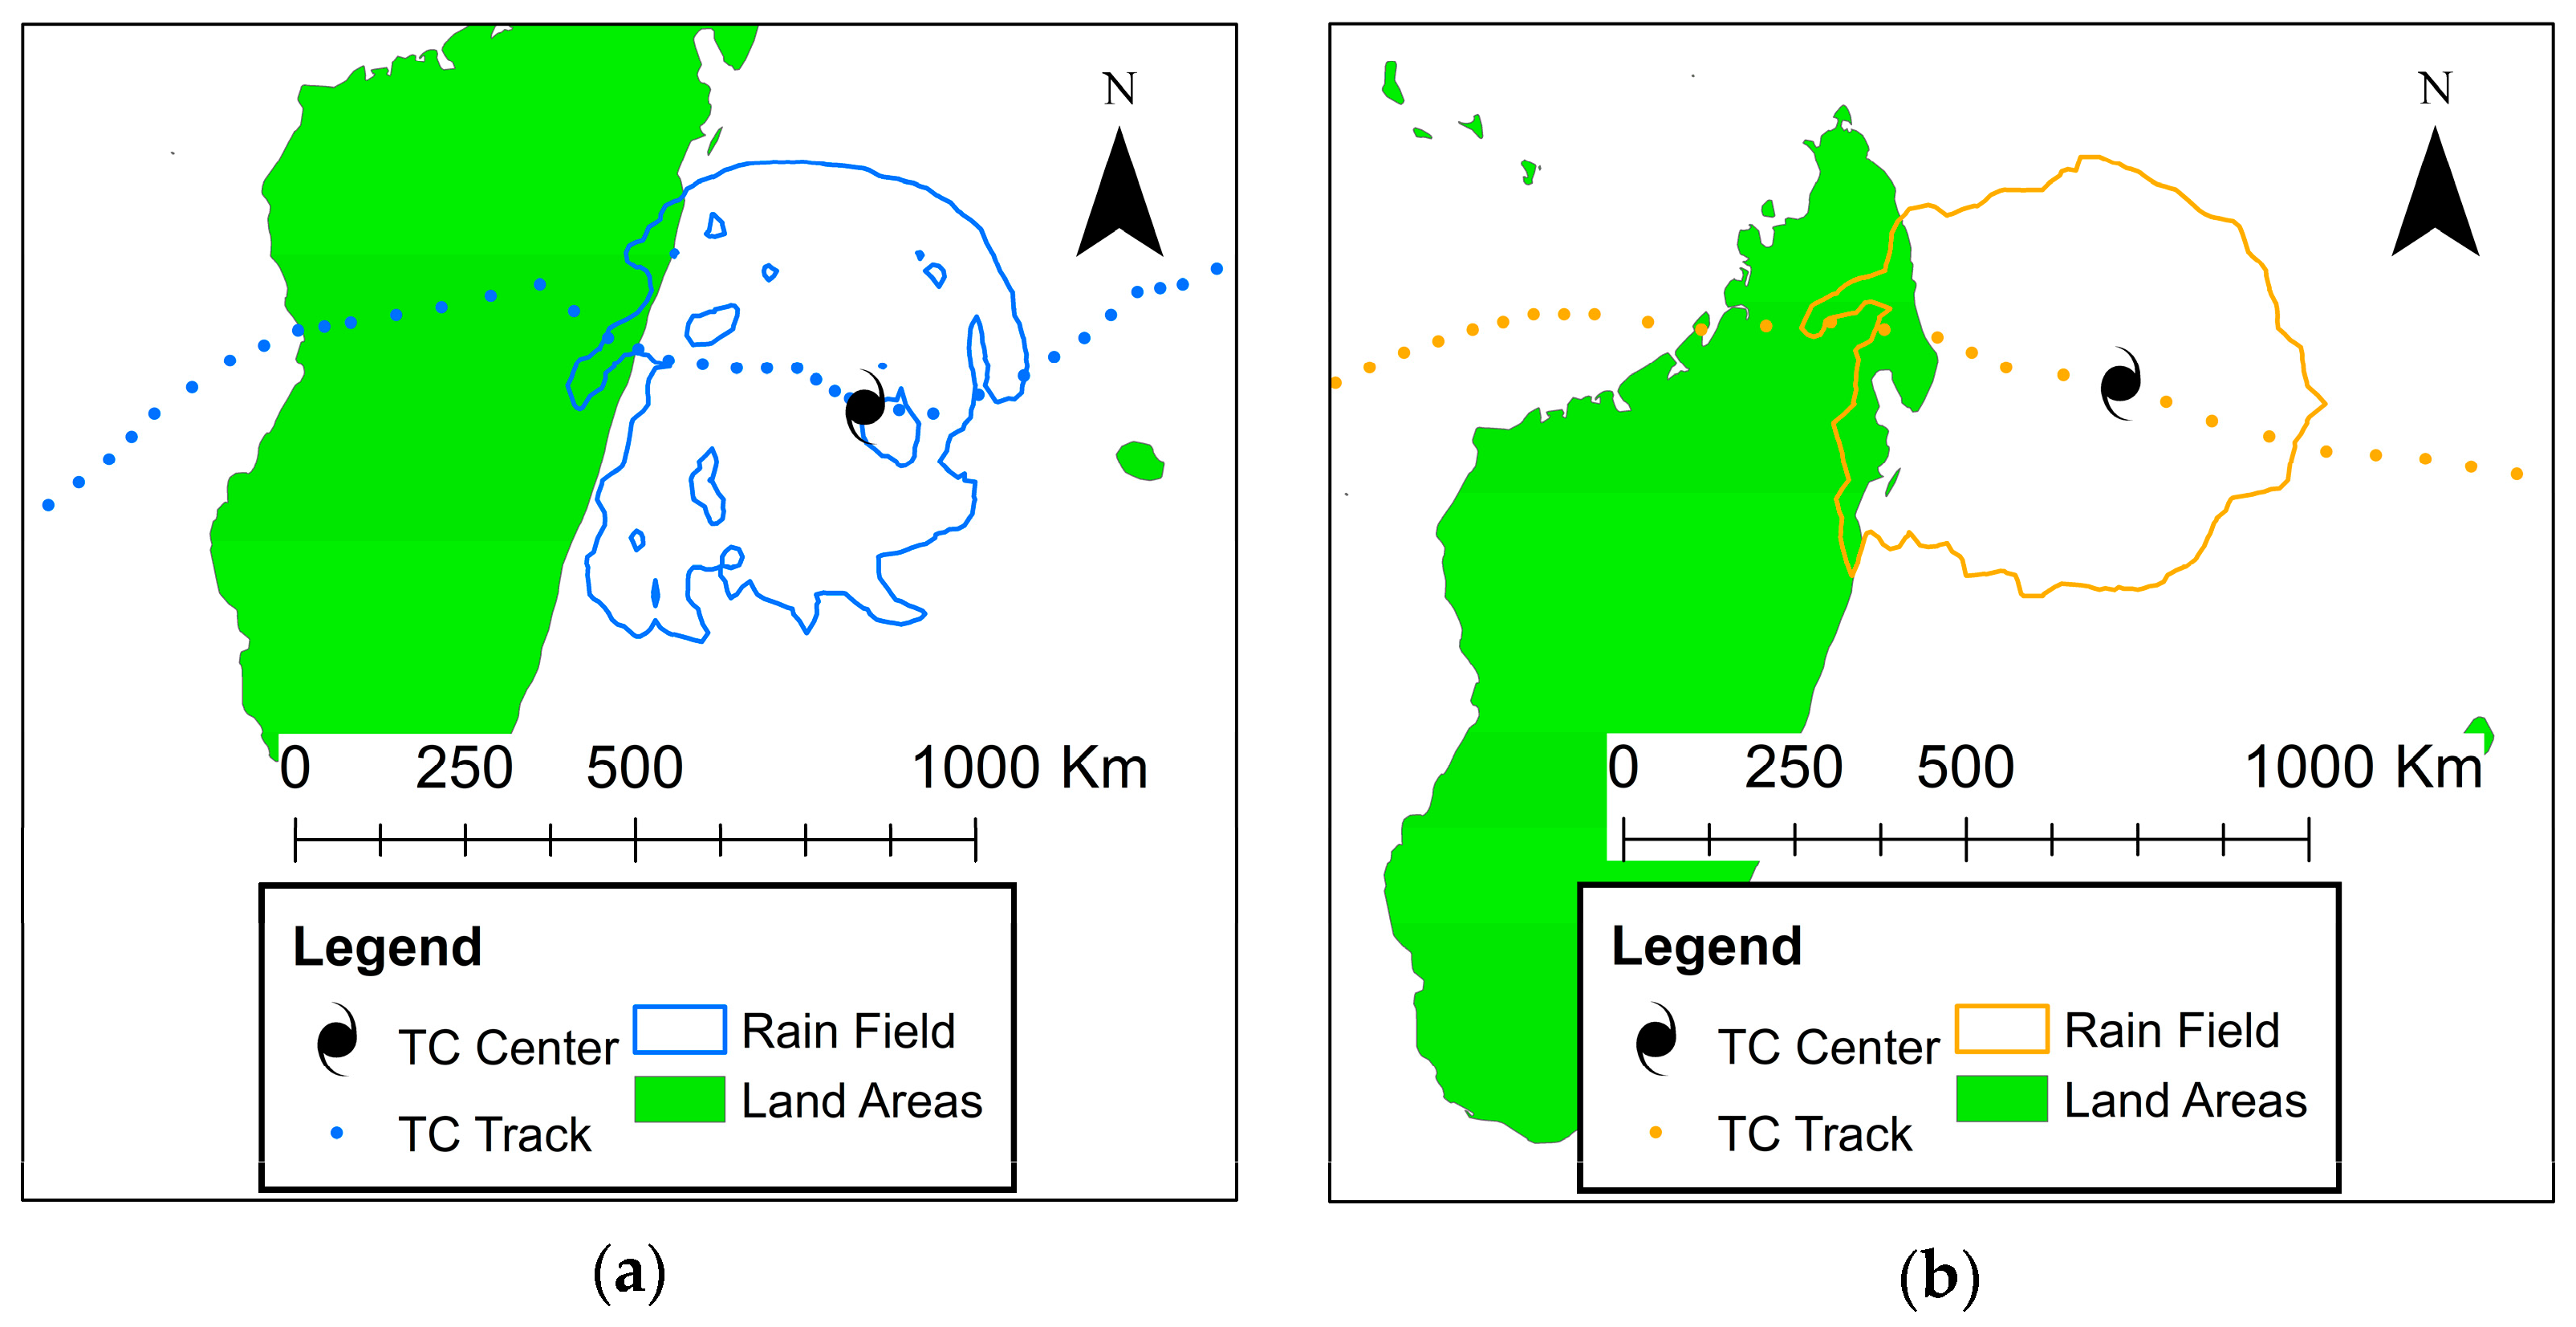
We employed a geographic information system (GIS) to analyze the spatial patterns of rain rates produced by both TCs. We selected a threshold rain rate to delineate the outermost edge of each TC’s rain field. Lonfat et al. [
20] found that rain rates for TCs over the Southern Indian Ocean peaked at 1 mm/h. After a sensitivity analysis utilizing rates of 1, 2, and 2.5 mm/h, we found that using 1 mm/h to define the edge of the rain field produced the most reliable results across the TCs. In many cases, higher rain rates produced regions that were too small for analysis. Next, we converted smoothed contours to polygons and determined the distance of each polygon’s centroid from the TC’s circulation center (
Figure 3a). We only included polygons with centroids <500 km from the TC center to exclude rainfall produced from other weather systems [
42].
These regions bounded by 1 mm/h rain rates were then examined in two ways. First, the extent of the outermost edge of the rain fields was calculated for each storm quadrant. Every 1° around the storm center, radial lines extended 750 km (
Figure 3b). At every location where a radial intersected with a polygon’s edge, the location of this intersection was recorded. The farthest intersection along each line was retained and the 90 measures in each quadrant were averaged. The quadrants were placed according to cardinal directions: northwest (NW), southwest (SW), southeast (SE and northeast (NE) [
11,
47]. As the TCs generally moved east to west, the western quadrants contained the leading edge of the storm, with the southwest quadrant generally carrying the highest wind speeds as it was the left front quadrant. We then measured asymmetry by subtracting the quadrant with the largest average rainfall extent from the quadrant with the smallest average rainfall extent. Intersecting the rain field polygons with land allowed us to determine the time that the rain fields first crossed over land (
Figure 4) and we examined differences in atmospheric conditions and rain field patterns before and after each TC’s rain field first intersected Madagascar (
Figure 5a,b). As data pertaining to the environmental conditions are available every six hours, we only analyzed rain rates at these matching times.
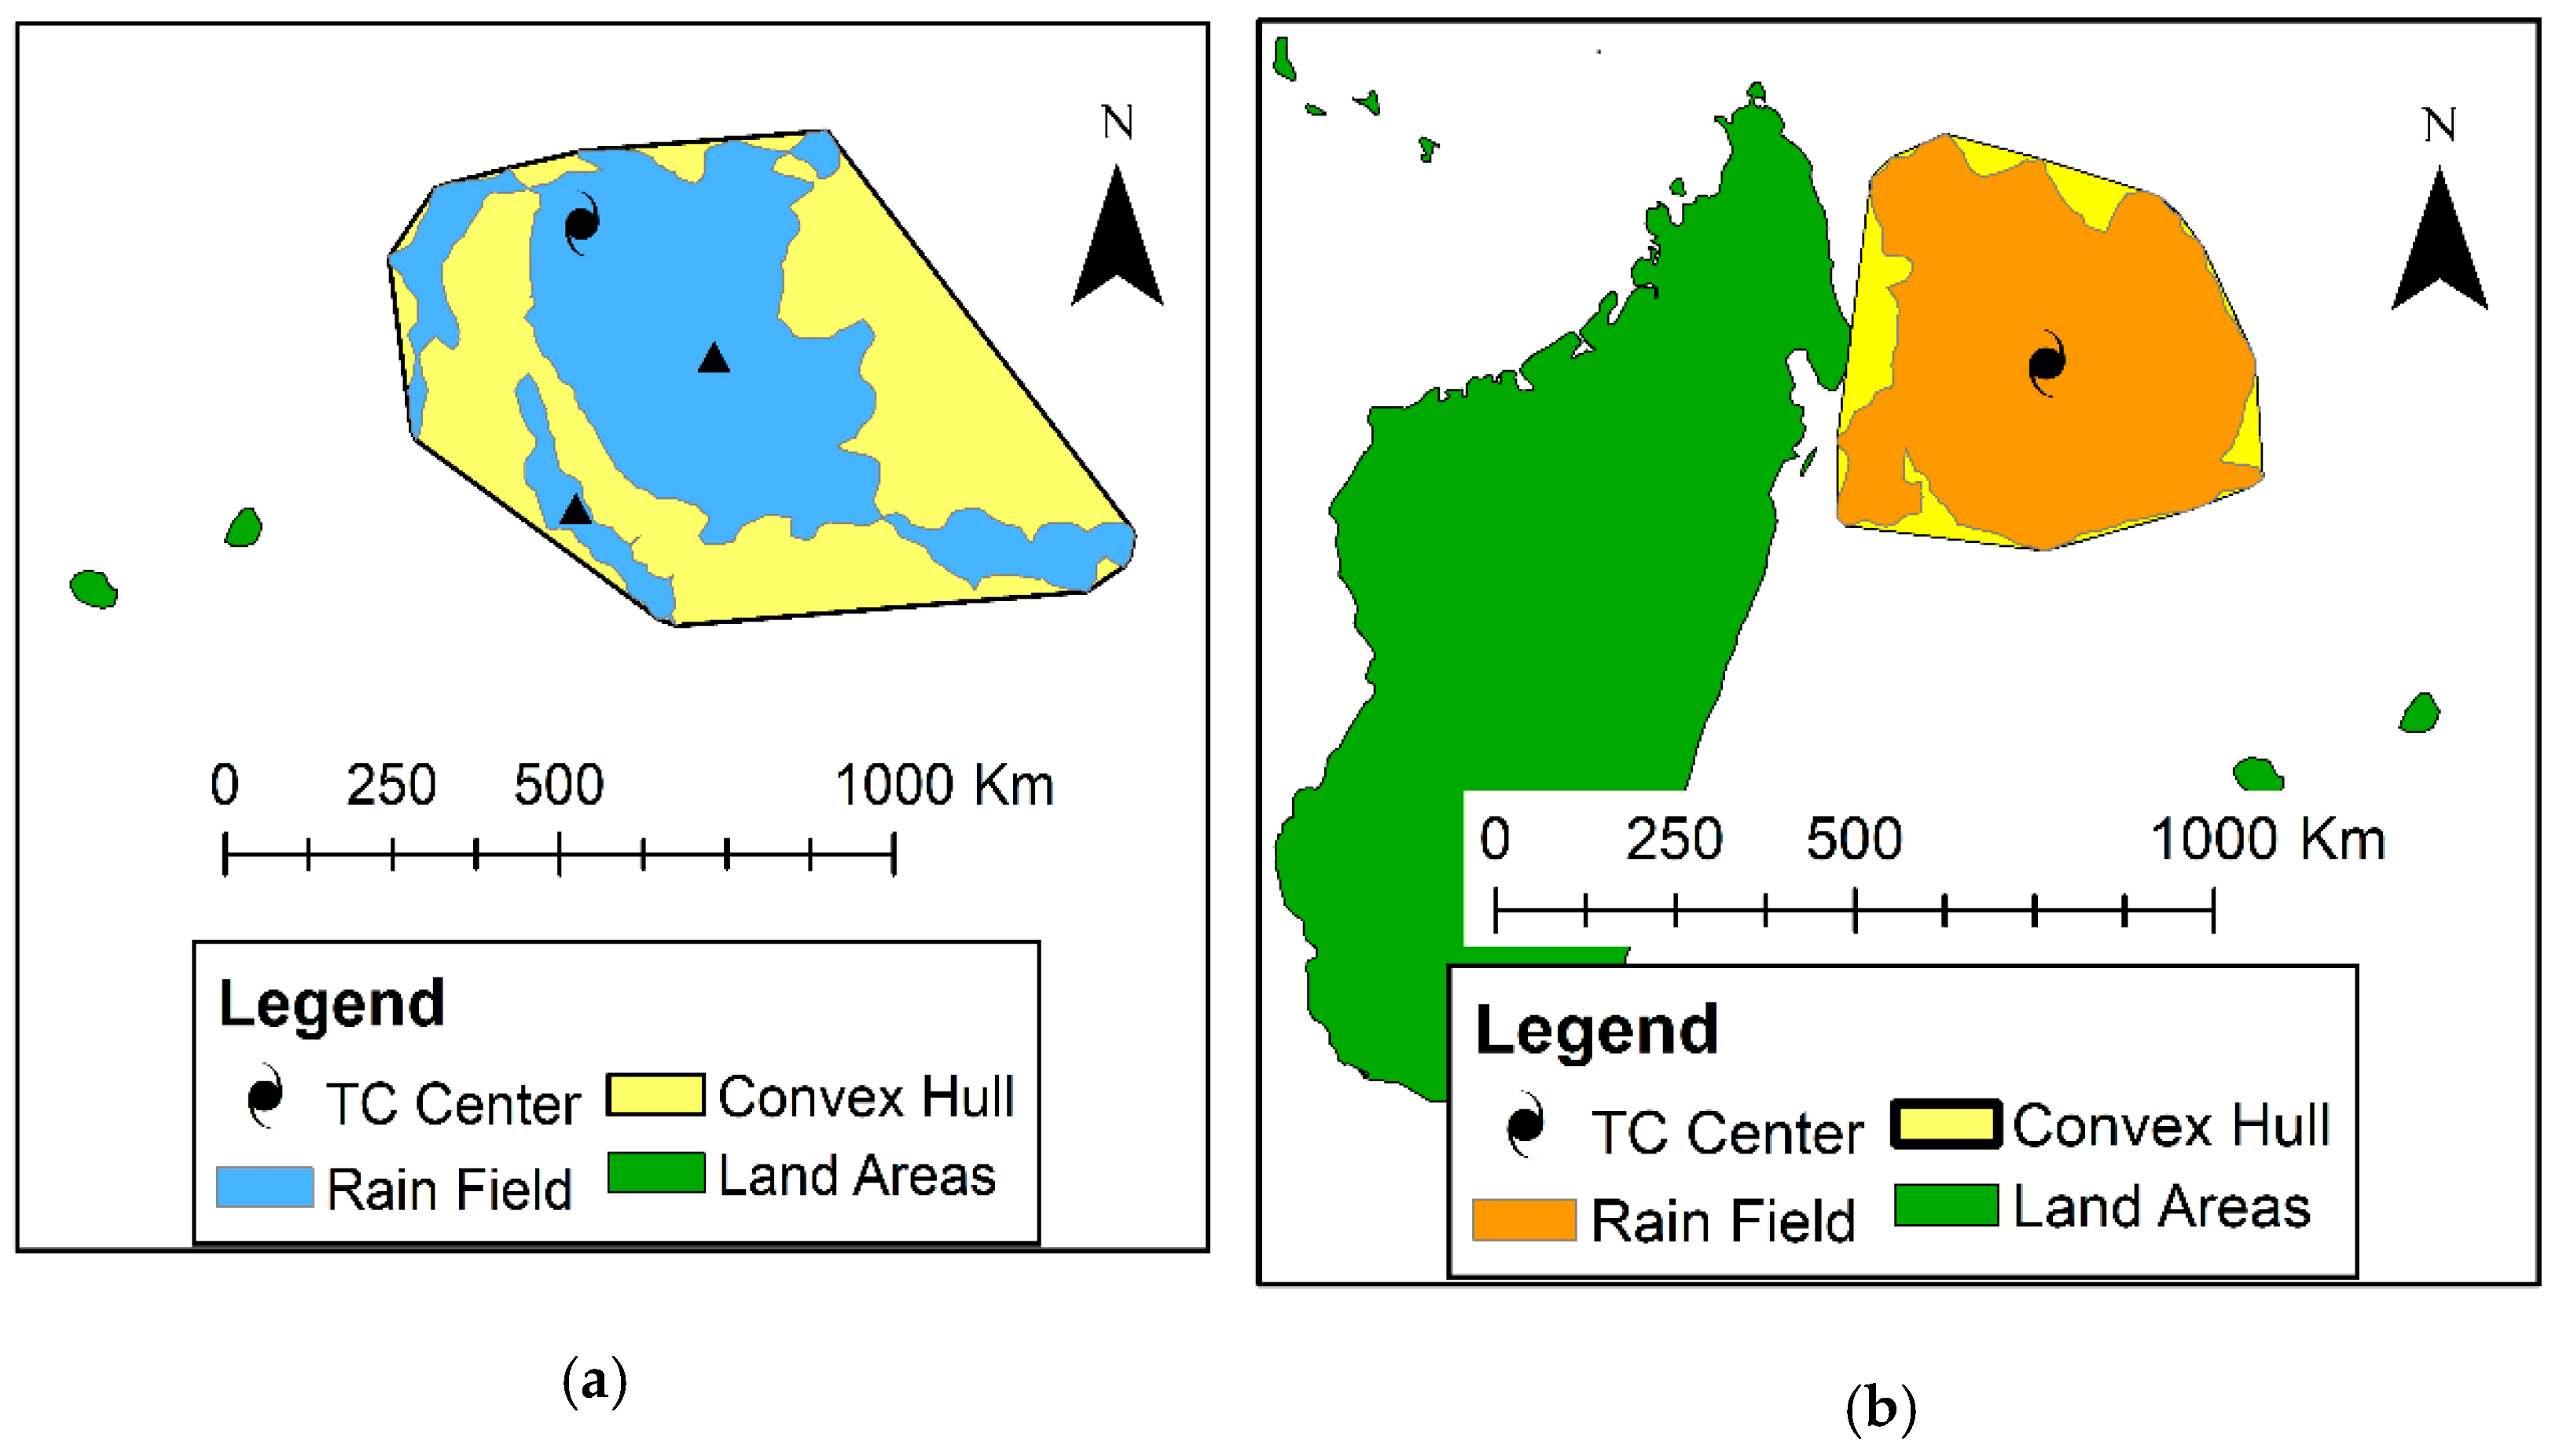
The second set of calculations examined multiple measures of TC compactness by considering the entire rain field rather than dividing it into sections. After calculating the area occupied by each rain field, we related the area of the rain fields to that of a convex hull, which is the simplest polygon that can encompass it (see Equation (1)). The simple shape should have a larger area than the more complex actual rain field (
Figure 5a) that could also be comprised of multiple polygons that would leave some of the hull unfilled (yellow areas
Figure 5a). Higher solidity values indicate that the rain field fills most of its convex hull (
Figure 5b). This metric is called Area index by [
48]
Dispersion measured the degree to which the rain field was centered over the TC’s circulation center. We used a search radius (
rsearch) of 500 km and calculated the ratio of the centroid radius (
rcentroid) to the search (see Equation (2)). The number of polygons (NP) was determined and dispersion was calculated individually for each rainfall polygon, and then the values of all polygons were summed to get the final value, with larger polygons receiving more weight in the calculation. The theoretical range of this metric is from 0 to 1 with 0.5 indicating that the average centroid position is 250 km from the storm center, which is similar to
Figure 5a. In
Figure 5b, dispersion is 0.04 as the centroid of the lone polygon is almost perfectly aligned with the TC’s circulation center. Dispersion has been utilized to examine TC rainfields using data from TRMM 3B42 data for the entire TC lifecycle and from higher-resolution data detected by ground-based radars [
49,
50,
51,
52].
While dispersion measured the radial distribution of the rain fields with respect to the storm center, closure measured the tangential distribution. As in the extent calculations, radial lines were extended outward from the TC center every 1° around a circle (
Figure 3b). Each radial that intersected a rain field polygon was noted and all intersections were summed and divided by the maximum possible of 360 (see Equation (3)). We also employed an exclusion zone of 25 km around the TC center due to the rather coarse resolution of the 3B42 data which hinders its ability to detect the eye in fine resolution, and for timing offsets between the TRMM 3B42 images and the TC positions. Closure of 1.0 indicates that rain fields completely enclose the TC center (
Figure 5), while a value of 0.5 means that 180° contains rainfall. Closure was originally developed by [
53] and called rain field arc-length and has been calculated for Atlantic Basin TCs near to and over land with high-resolution data from ground-based radars [
50,
52,
53].
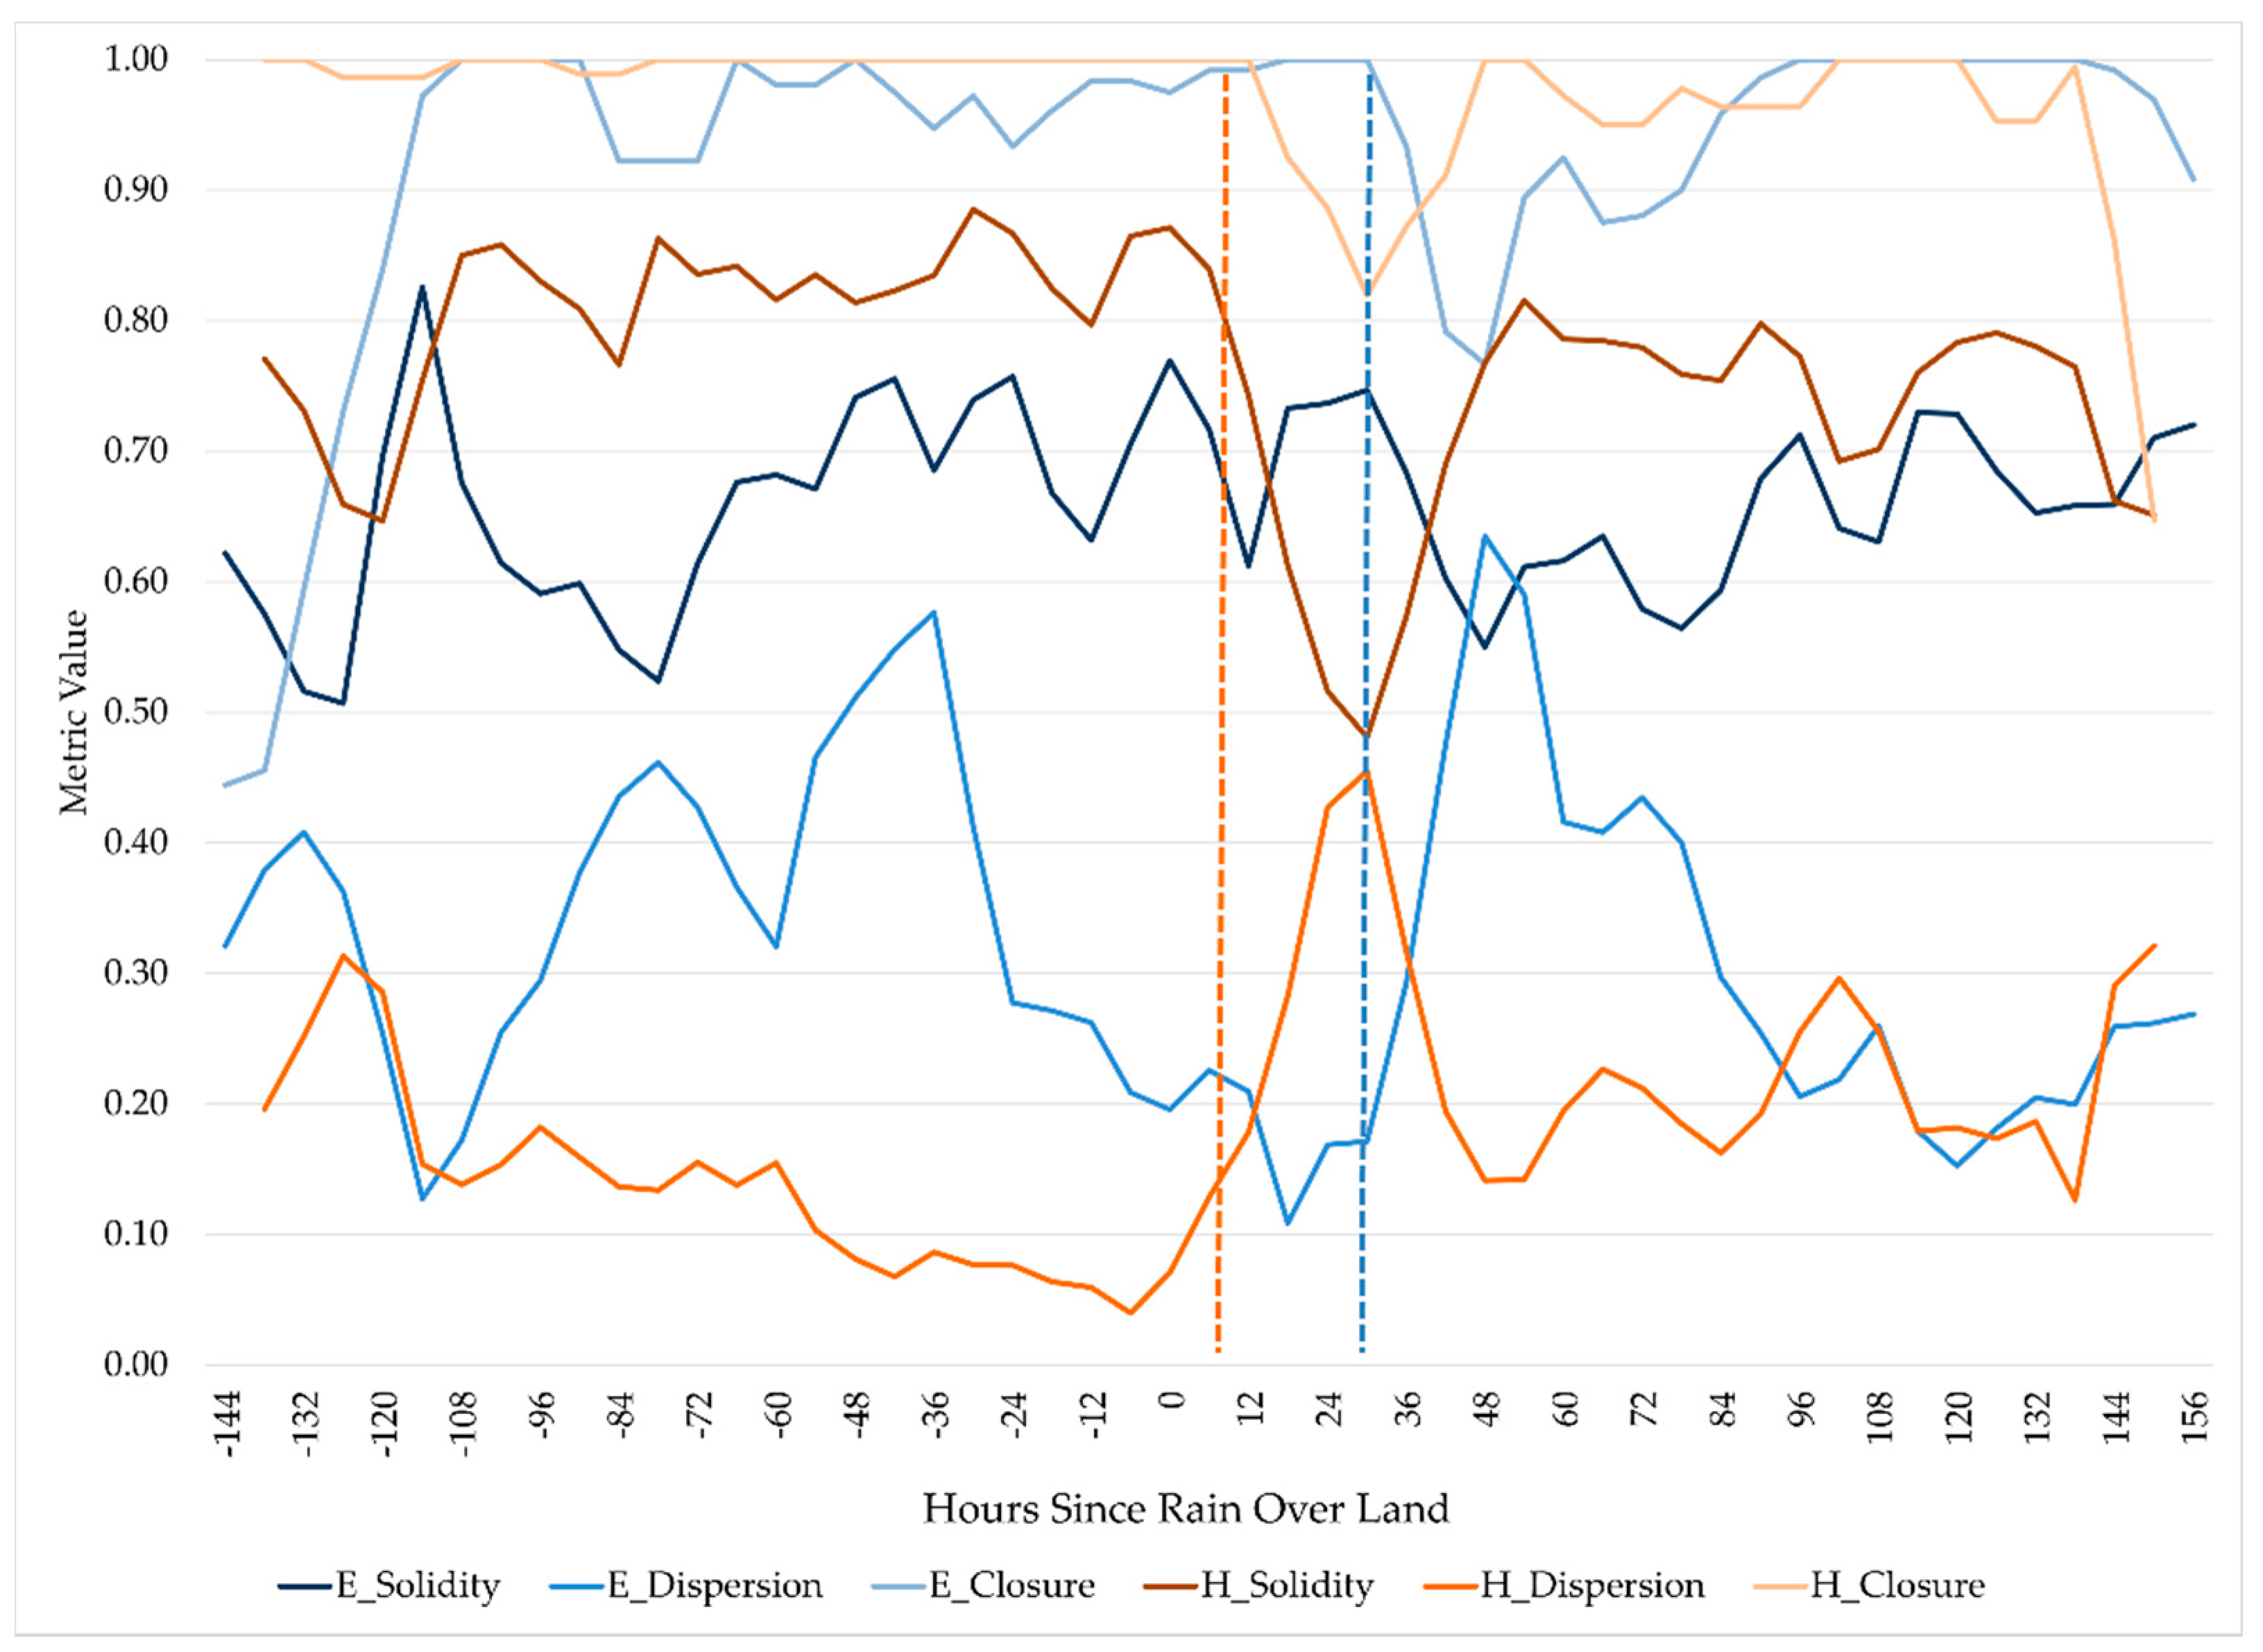
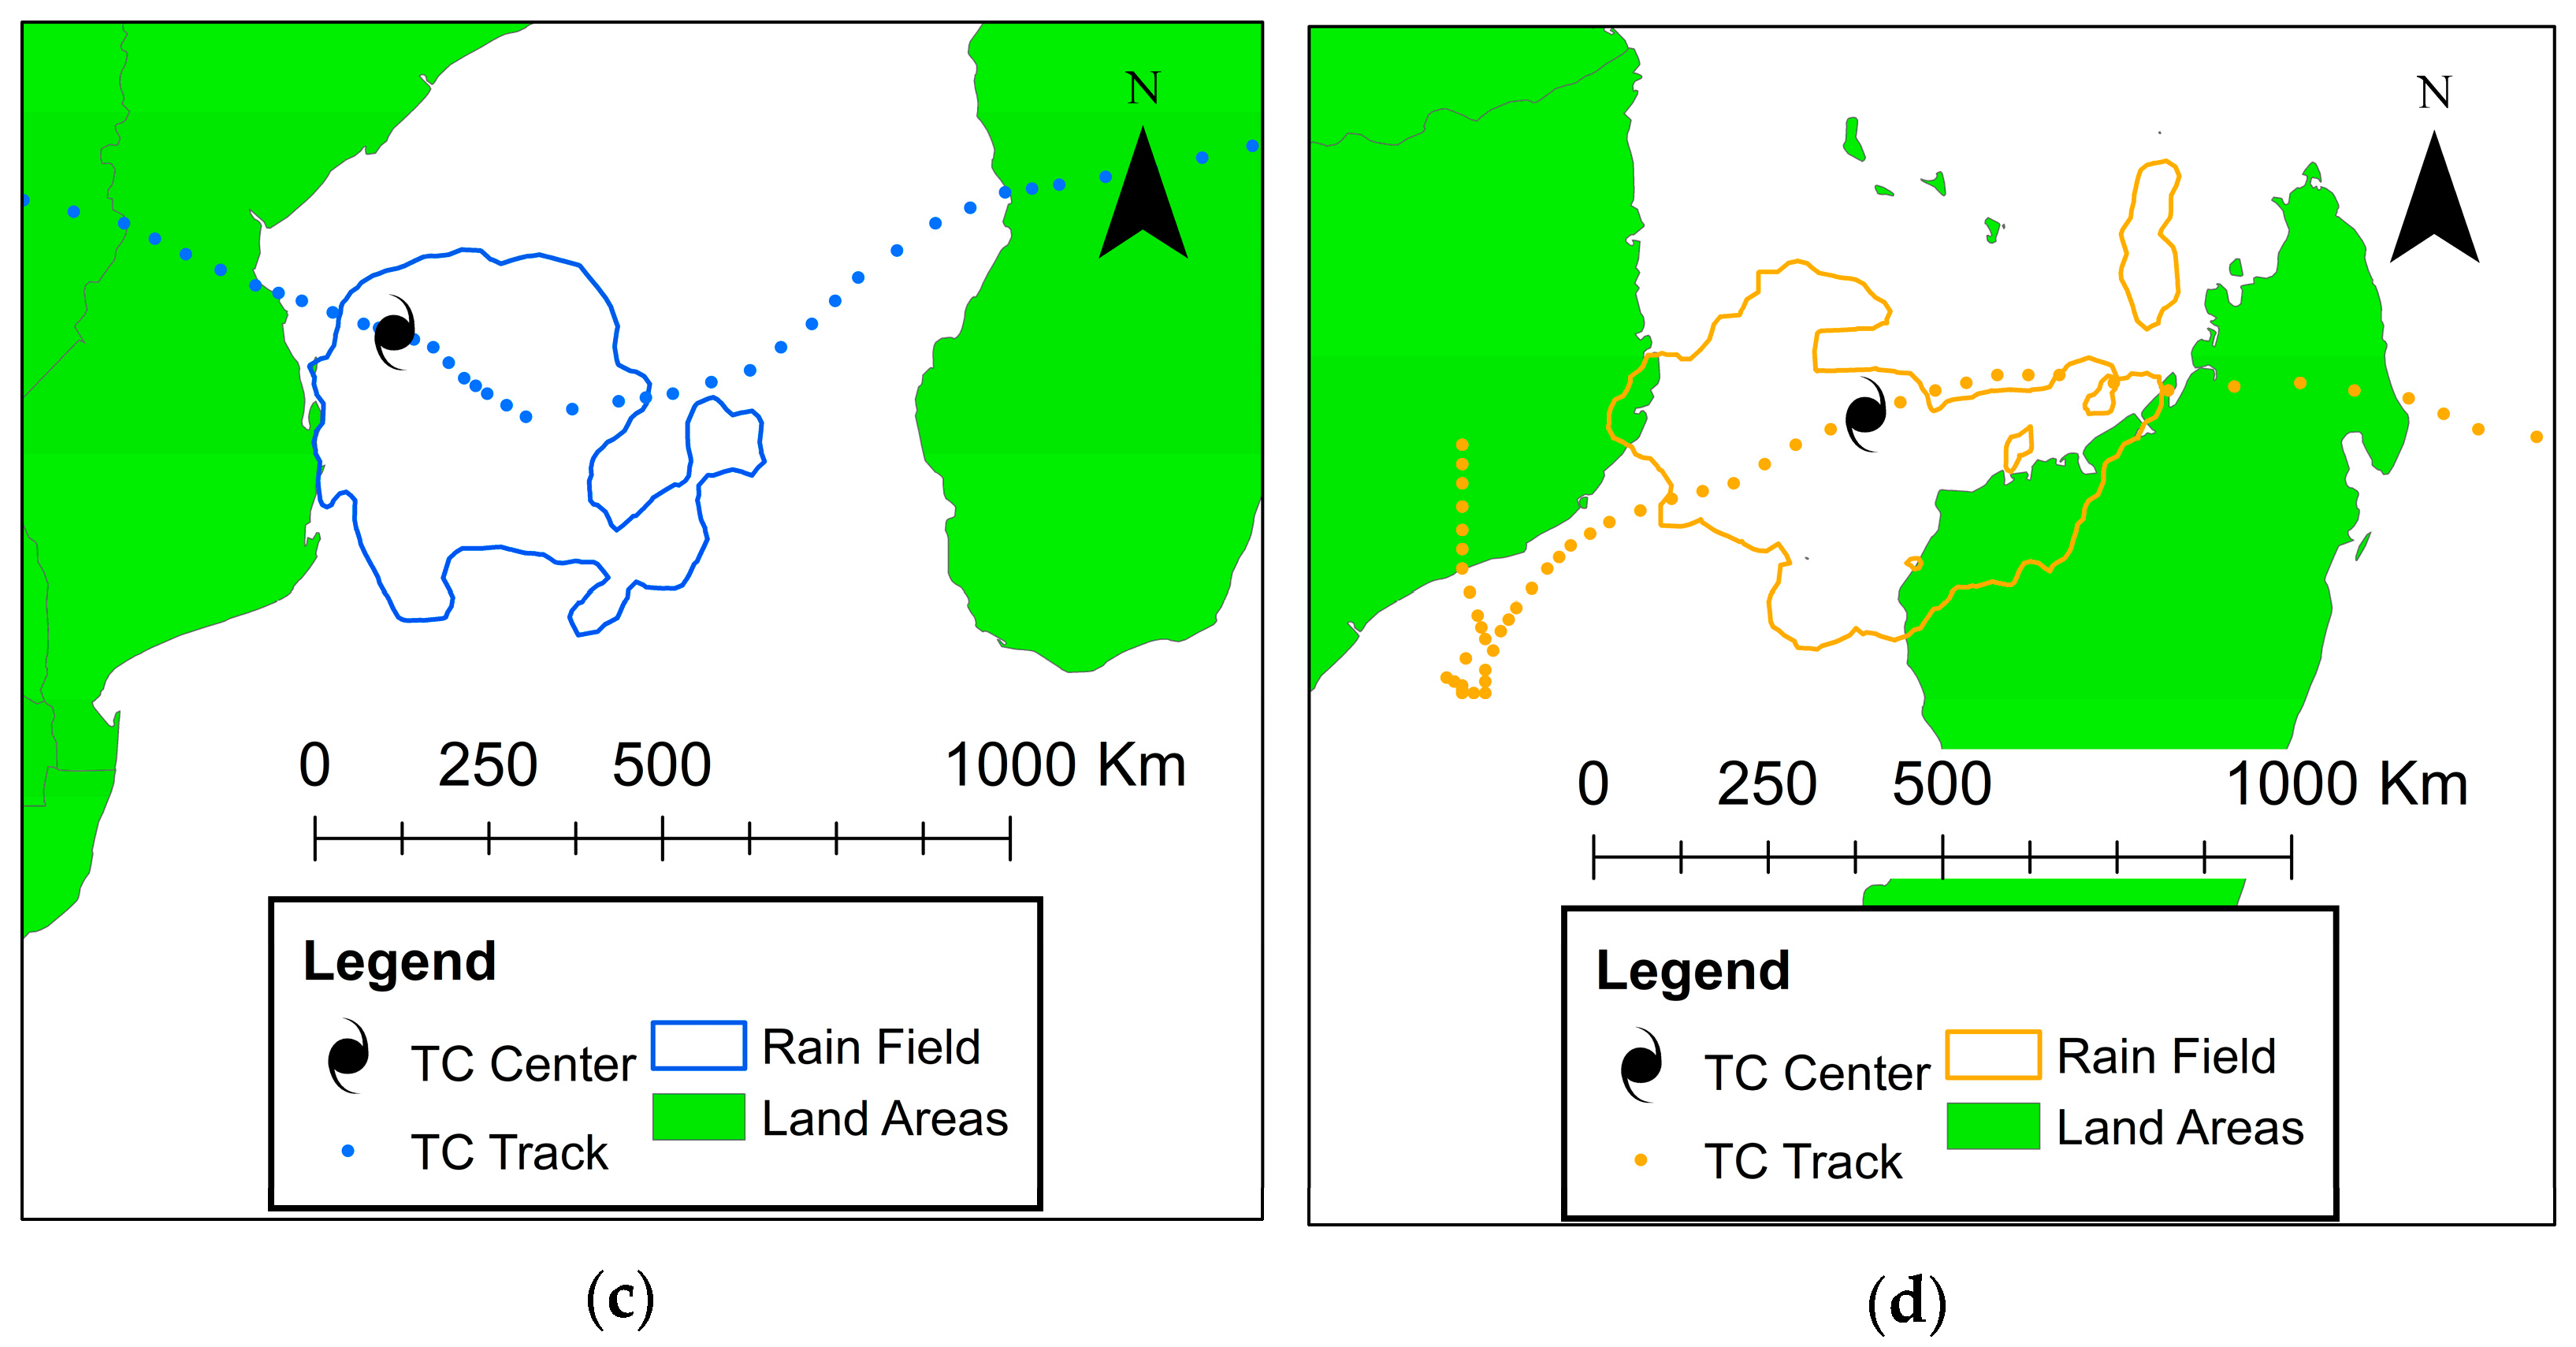
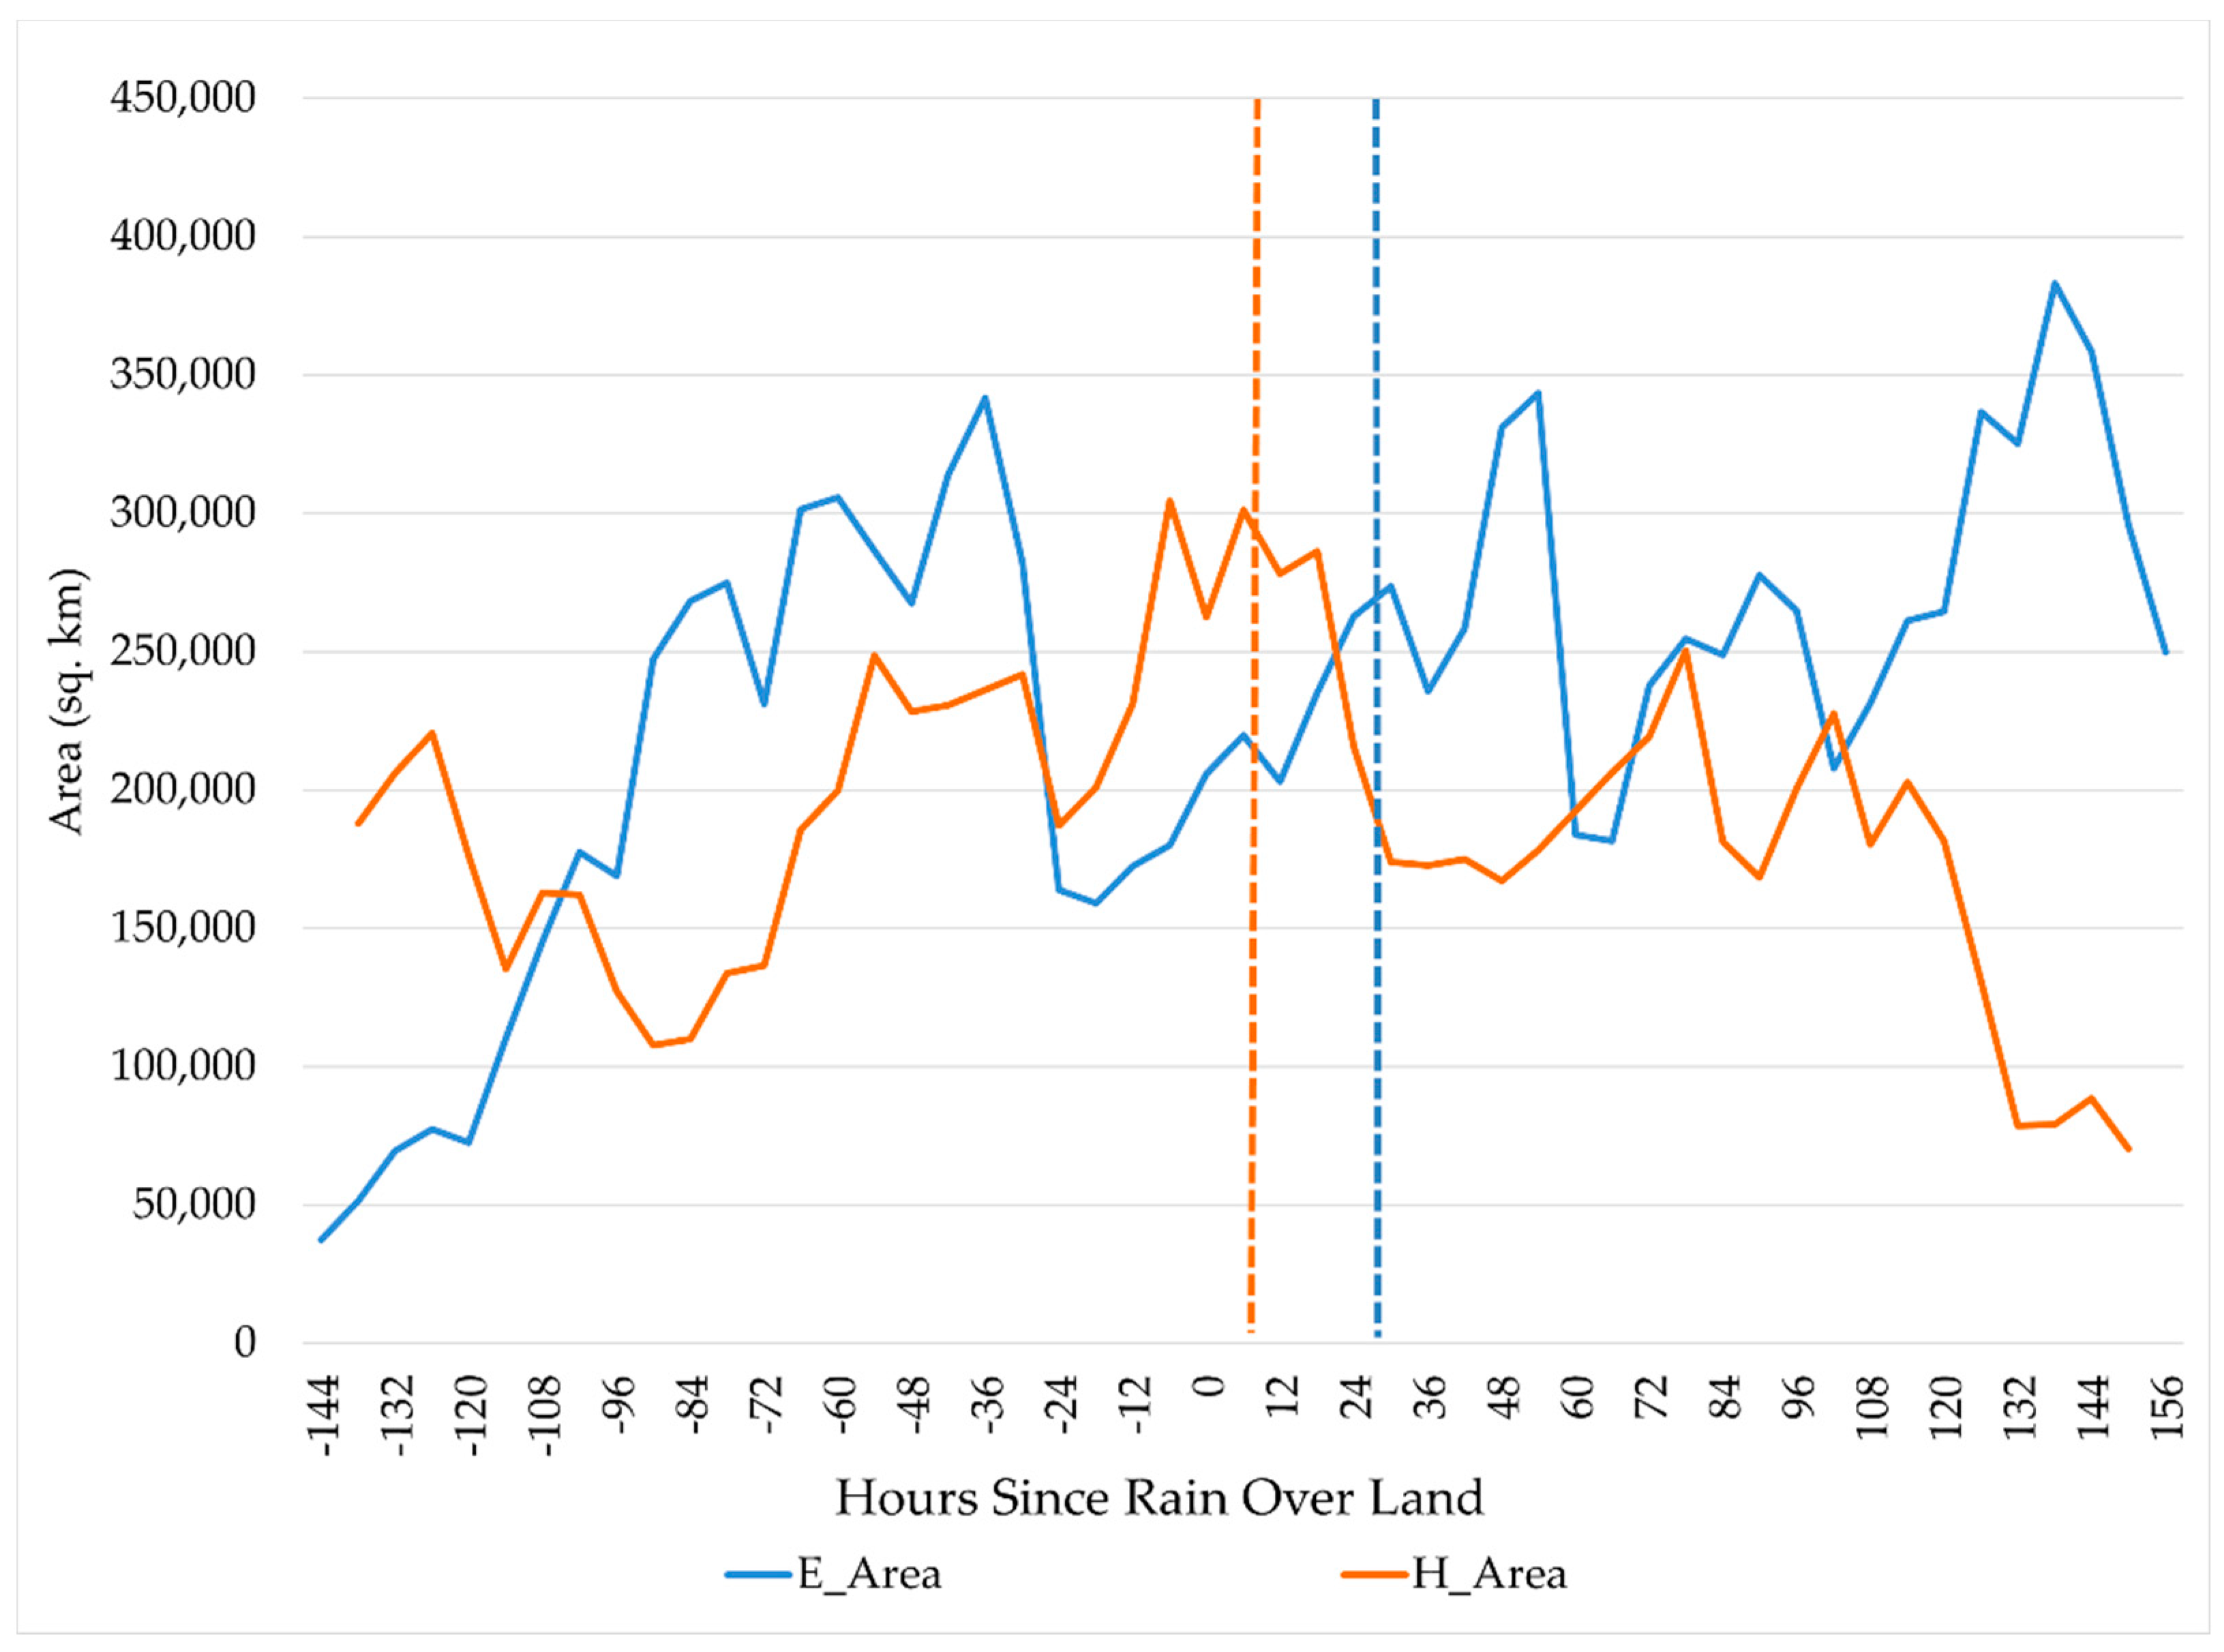
In this study, we represented the data according to the time relative to when the rain fields first cross over land (
Figure 4a,b). Negative values in the time series plots indicate time prior to crossing Madagascar. We did not utilize the entire storm’s history as Eline lasted for 13 days more than Hudah (
Figure 2). As we also contrasted the rain field extent and atmospheric conditions before and after land interaction, we began our analysis at a time when there was a fairly even number of observations before and after land interaction, which also captured the time when the tracks were the most similar as the storms approached Madagascar. Observations occurring before the rain fields first interact with land are termed Period 1, while those after first land interaction occur during Period 2.
We utilized two types of nonparametric statistical tests to compare the two TCs and associate atmospheric conditions with rain field extent. We first employed a Mann–Whitney U test, which determines similarities between two independent samples, to compare the two TCs according to the rain field spatial patterns, maximum sustained wind speed, the velocity of the u and v components of the VWS, RH, and SSTs. Correlations among intensity, environmental conditions, and rain field extent, asymmetry, and shape were calculated using the Spearman’s rank correlation coefficient. When plotting time series graphs of the variables, we noted changes that seemed to coincide with the time that the rain fields first crossed over land. Thus, we employed Mann–Whitney U tests within each storm to test variables before and after first land interaction, and to compare the storms with each other before and after this interaction. We utilized a 95% confidence level (α = 0.05) to test the null hypothesis that the independent samples were statistically similar for all Mann–Whitney U tests, and to determine that a coefficient was statistically significant in the correlation analyses.
4. Discussion
We now compare the spatial dimensions of the rain fields for Eline and Hudah to studies of Atlantic basin TCs. The two most comparable studies in terms of data utilized TRMM 3B42 rain rates yet selected 2.5 mm/h to define the rain field edge. Eline and Hudah had larger mean areas than the 35 TCs in [
49] likely due to the lower threshold of 1 mm/h used to define the rain field edge. Interestingly, Eline’s dispersion values are comparable to this previous study, which also found that more intense TCs were less dispersed. Zhou et al. [
13] measured area and extent of 70 TCs within 600 km of the U.S. coastline. Although Eline and Hudah covered more area than these TCs, their rain fields did not extend as far away from center. This difference could be explained by the fact that dry air tends to advect into TCs near landfall over large land masses, reducing areal coverage of rain rates [
56,
57]. However, higher rain rates in outer rainbands may still occur causing extent to remain high. An analysis of solidity for these 70 TCs would help confirm this hypothesis.
Three previous studies employed reflectivity values from ground-based weather radars to measure TC rain field properties, selecting a 20 dB
Z threshold to define the storm’s outer edge. When converting radar reflectivity to rain rate in a tropical environment this equates to 0.5 mm/h [
58]. According to [
11], U.S. landfalling hurricanes have average rain field extents of 223 km which agrees well with the results of the current study. However, those hurricanes had higher values of asymmetry as compared to Hudah and Eline and were moving through environments containing less moisture. Matyas and Tang [
50] found strong negative correlations between dispersion and closure (−0.93 and −0.75), and values for these metrics covered a larger range than in the current study as those TCs moved inland. Rain field areas were lower for the TCs in [
50] but both experienced strong vertical wind shear and became highly asymmetric after landfall while also experiencing dry air entrainment that likely accounted for the smaller area values. Similarly, Hurricane Isabel (2003) [
52] experienced strong vertical wind shear and dry air entrainment while undergoing extratropical transition exhibiting higher dispersion and lower closure, with a stronger correlation between these metrics, as compared to the current study. Results from [
53] agree with the current study that more intense TCs are more enclosed by their rain fields. Overall, the current study’s finding that closure and dispersion were correlated with TC intensity helps to validate previous research, while differences in actual values as well as area and extent could be explained by Eline and Hudah’s high intensity, moving through an environment with relatively low vertical wind shear and high moisture, and not being sampled at a time when they moved far inland as was the case for the previous ground-based radar studies.
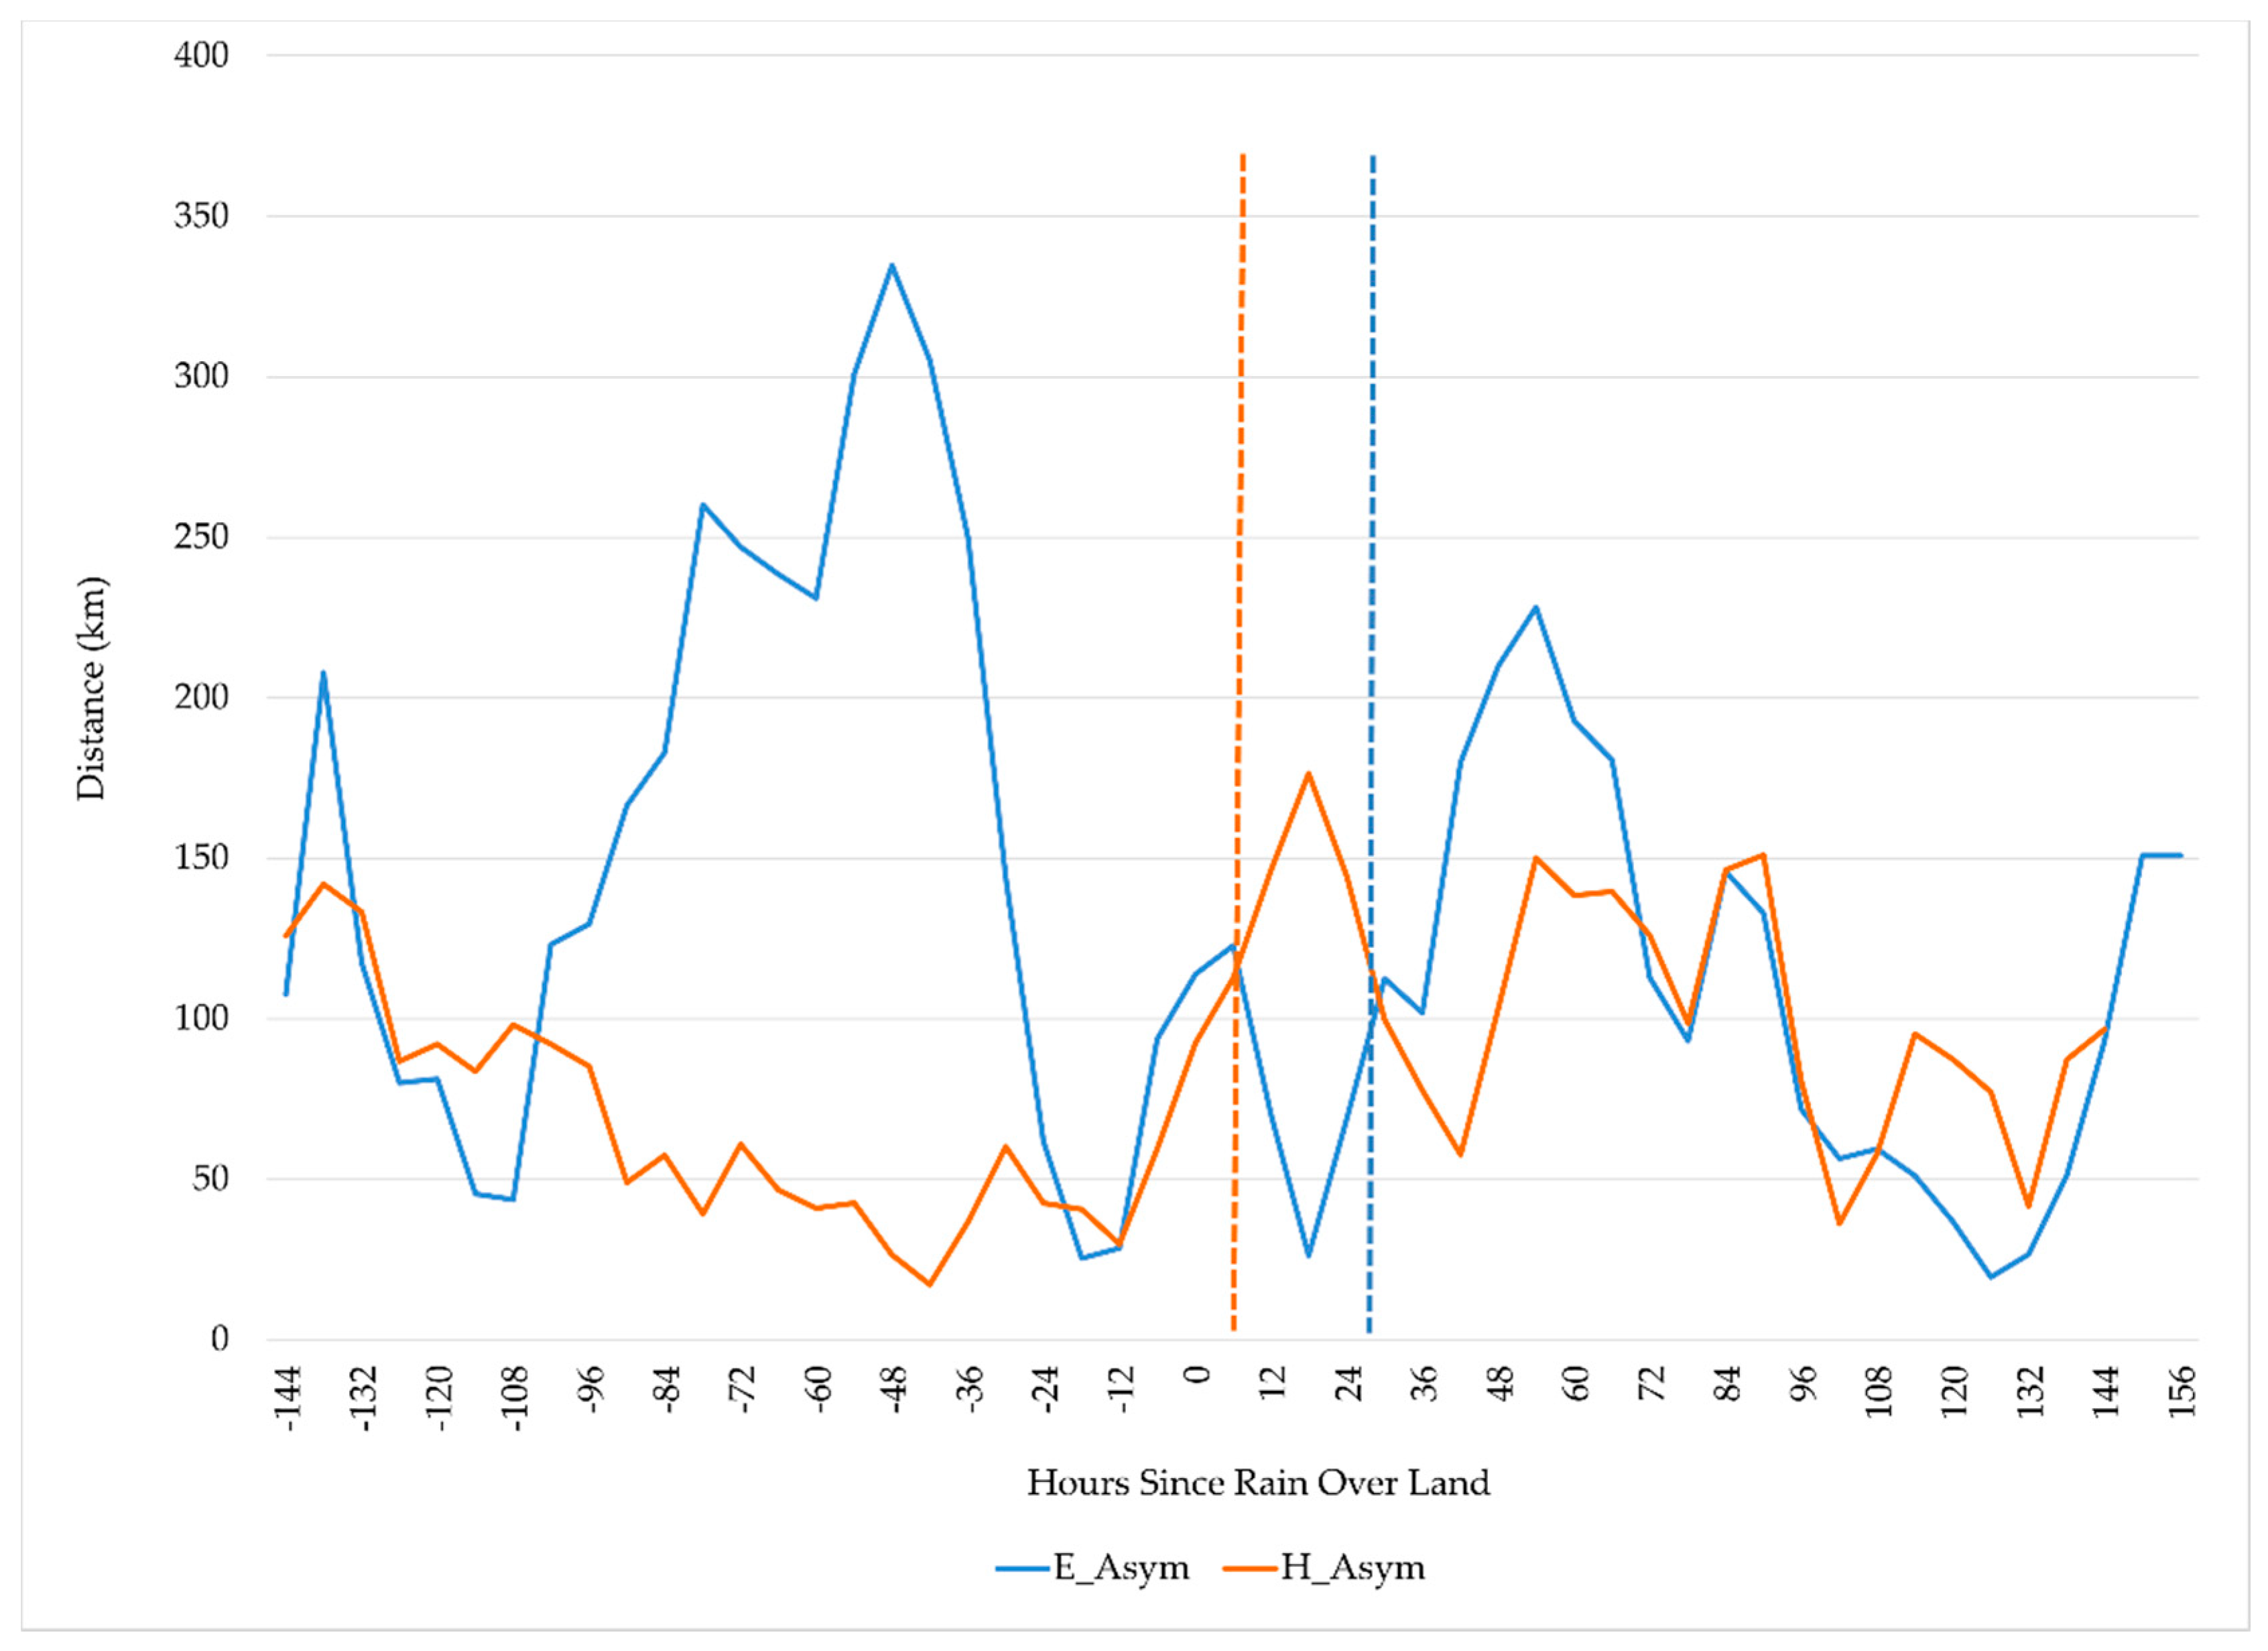
The speed and direction of the vertical wind shear was a large difference between the storms. According to [
19], deep-layer vertical shear is normally quite low in the area that Hudah transited and climatologically is slightly higher with a westerly direction where Eline passed. Their analysis showed a downshear right asymmetry in TC rain fields for cases in the basin. Deep-layer VWS is considered to be high and most damaging to a TC’s structure when its velocity is >10 m/s [
18]. Hudah never experienced shear of this magnitude, while Eline experienced it for 24 h three days before rain began over land. This timing corresponds to increasing extent towards the SE, or downshear right quadrant, and higher dispersion. In fact, Period 1 dispersion peaked 12 h after this period of high shear. Hudah experienced weak shear (<5 m/s) 88% of the time while Eline experienced weak shear 53% of the time when both periods are considered. Much of the weak shear for Eline occurred during Period 2, corresponding to increased extent towards the north and overall areal coverage, and decreasing asymmetry and dispersion.
The high RH values may also have been an important difference between the storms. Despite the northwesterly shear likely causing Eline to become asymmetrical and dispersed in Period 1, closure remained high. This could have been due to the abundance of moisture which helped rain rates to remain high as the intensifying storm converged more moisture into its core that then circulated around the storm center. Matyas and Tang [
50] found that closure remained high despite strong vertical wind shear as Hurricane Humberto (2007) moved through an environment containing high amounts of moisture. The increase in moisture may also have helped Hudah maintain its rain field extent after its first landfall even though shear velocity did significantly increase as well. Despite experiencing lower RH overall, Hudah maintained a higher solidity. This could have been due to its higher intensity allowing it to be more efficient in converging available moisture into its core. Previous research has found that TCs can grow larger when moving through environments with higher RH [
21], but this large extent could be more difficult to keep filled with rain when intensity is lower and vertical wind shear is stronger. However, the higher moisture may have facilitated the rapid recovery in rain field area after Eline’s first landfall, allowing it to reach its greatest coverage prior to Mozambique landfall when it also attained its highest intensity. In [
11], a larger extent of hurricane rain fields occurred with higher values of RH and thus the current study supports this finding.
Overall, the metrics exhibited the strongest and most consistent relationships with storm intensity so that a more intense TC had larger extent in the SW, or left front, quadrant, was more symmetrical and filled by rain that more completely encompassed the storm center, and rain was more centered around the storm. It should be noted that values of these metrics changed the most rapidly due to land interaction, which in turn also caused TC winds to weaken. So, it is not possible to conclude whether intensity changes in the absence of landfall would exhibit the same strong relationships with storm shape that were observed here.
The results underscore the importance of considering how TCs which make multiple landfalls respond to interaction with land. Hudah was more intense and spent less time over Madagascar. Dispersion, closure, and solidity show that Hudah recovered quite quickly once moving back over water compared to Eline, which spent more than twice as long over Madagascar and was less intense prior to landfall. Dividing the observations into the two periods also highlighted the differences in SSTs, RH, and VWS experienced by each TC. Although SSTs and RH increased in both cases, shear decreased for Eline and increased for Hudah, although not to the level that Eline experienced during Period 1. Thus, crossing over Madagascar can allow TCs to emerge over the Mozambique Channel into different environmental conditions which can in turn affect the organization of their rain fields.
5. Conclusions
This study examined atmospheric conditions and rainfall extent in cyclones Eline and Hudah which both made landfall over Madagascar and Mozambique in 2000. Satellite-based estimates of rain rates were analyzed to measure the spatial properties of their rain fields as defined by 1 mm/h rain rates. Metrics calculated included averaged rain field extent in each quadrant and asymmetry, areal coverage, solidity, dispersion, and closure. Storm intensity and environmental conditions experienced by each TC including vertical wind shear, relative humidity, sea surface temperatures, and proximity to land were also examined every six hours to determine whether these conditions varied between the storms and might have contributed to differences in rainfall distribution using nonparametric statistical tests. Observations were examined separately for the hours prior to and after each TC’s first interaction with Madagascar.
Eline and Hudah both intensified before each of their respective landfalls. Despite moving over warmer waters and through an atmosphere with higher RH, Eline was a weaker TC prior to first landfall as it experienced stronger VWS compared to Hudah. The rain fields of Hudah were more symmetrical, had a larger extent towards the north, were more closed and solid, and less dispersed than Eline prior to first interaction with land. Although both TCs encountered increased moisture and SSTs, re-intensified, and had slower forward velocities after first landfall, the amount and direction of shear differed as did the duration of land interaction after first encountering Madagascar. In that second period, dispersion and closure were similar between the storms as was rain field extent in most quadrants suggesting that moving over land and then into an environment of relatively low shear and high moisture had similar effects on rain field structure. The rain fields of both TCs exhibited strong correlations with intensity when a 12-h lag was applied between storm conditions and rain field metrics. Higher maximum sustained wind speed corresponded to larger extent towards the SW, less asymmetry and dispersion, and being more enclosed and solid. Relationships between intensity and rain field shape support the results of previous research and demonstrate the global utility of these metrics.
Future research should expand on the limited scope of this exploratory study. A larger sample of TCs that originated over the SWIO should be analyzed to provide a more holistic analysis of rain fields in this basin to facilitate comparisons to TCs in other basins. In particular, we found that rainfall can begin over land 9 h to >4 days before landfall depending on the extent of the rain fields in the forward quadrants and storm forward speed. It would be useful to characterize other landfalling TCs in this manner to provide better estimates on the timing of preparations for rain to begin in future storms. This study demonstrates the utility of spatial metrics to measure changes in rain field distributions before and after TCs interact with a large mountainous island, which suggests that additional TCs should be explored in this way, both in the SWIO and in other basins. More recent TCs should be analyzed using data from the Global Precipitation Mission satellite’s sensors that provide increased spatial and temporal resolution to better resolve the influences of land interaction. Additional rain rate thresholds could also be employed to distinguish changes in lower and higher rain rates.


