Article

Recipe for the One-Pot Synthesis of C-/O-Doped Luminescent Boron Nitride Quantum Dots with Tunable Optical Properties for Bioapplications

by
Anastasiya Bahdanava
1,2,*,
Lena Golubewa
3,
Yaraslau Padrez
3,*,
Nadzeya Valynets
1 and
Tatsiana Kulahava
1
1
Institute for Nuclear Problems, Belarusian State University, Bobruiskaya Str. 11, 220006 Minsk, Belarus
2
International Sakharov Environmental Institute, Belarusian State University, Dolgobrodskaya Str., 23/1, 220070 Minsk, Belarus
3
State Research Institute Center for Physical Sciences and Technology, Sauletekio Av. 3, LT-10257 Vilnius, Lithuania
*
Authors to whom correspondence should be addressed.
Physchem 2025, 5(4), 46; https://doi.org/10.3390/physchem5040046 (registering DOI)
Submission received: 1 August 2025 / Revised: 11 October 2025 / Accepted: 23 October 2025 / Published: 26 October 2025
(This article belongs to the Section Biophysical Chemistry)

Abstract

One-pot hydrothermal synthesis of boron nitride quantum dots (BNQDs) offers a simple and widely accessible approach to produce nanoparticles with tailored properties for biomedical purposes, including bioimaging and drug delivery. However, growing evidence suggests that most reported BNQD syntheses yield products with insufficient purity and poorly defined structures, limiting their bioapplications where precise composition and controlled synthesis are paramount. In this study, we present a formation mechanism and demonstrate multiple BNQD synthesis pathways that can be precisely controlled by modulating the reaction equilibrium during hydrothermal synthesis under varying experimental conditions. We demonstrate that carbon-related defects shift BNQD photoluminescence (PL) from the UV to the 400–450 nm region, making them suitable for bioimaging, while BO2 enrichment introduces additional phosphorescence. Furthermore, we show that as-synthesized BNQD suspensions contain significant contamination by non-luminescent ammonium polyborate salts, which is overlooked in prior studies, and disclose the mechanism of their formation as well as effective purification method. Finally, we assess the biocompatibility of purified BNQDs with tuned PL properties and demonstrate their application in bioimaging using Vero cells. The elucidated nanoparticle formation mechanisms, combined with methods for precise control of optical properties, structural defects and sample purity, enable the reproducible production of reliable and effective BNQDs for bioimaging.

1. Introduction

Hexagonal boron nitride (h-BN), which has a structure analogous to graphene, has drawn considerable attention as an alternative material for applications in optoelectronics, bioimaging, and sensing. The structural peculiarities of BN materials are characterized by: (i) the confinement (or shift) of electron pairs in the sp2-hybridized σ-bond of B–N toward the nitrogen (N) atom due to its higher electronegativity, and (ii) the partial delocalization of the lone pair of electrons in the N atom’s orbital with the empty boron (B) atom’s orbital. This contrasts with the equally contributed and evenly distributed electrons along the -C–C=C- bonds in graphite layers. These features of h-BN result in a large band gap, leading to the electrically insulating nature and colorless appearance of BN materials [1].
For a long time, BN structures have been recognized as dielectric and thermally conductive materials [2]. Numerous studies have focused on bandgap engineering of such systems to tailor their optical and electrical properties [3]. To permanently alter the band structure and luminescent properties of h-BN, structural deviations from its pristine hexagonal form, through doping and surface functionalization, are necessary [4]. Recent research indicates that three types of effective luminescent centers drive visible-region emissions in h-BN: nitrogen vacancy-type defects [5], carbene structures at zigzag edges [6], and BOx (x = 1, 2) species [7]. Furthermore, reducing the lateral size of h-BN materials to produce boron nitride quantum dots (BNQDs) is expected to significantly enhance their edge- and defect-dependent optical properties [8].
Boron nitride quantum dots are zero-dimensional (0D) members of the BN-nanomaterial family, characterized by a honeycomb lattice structure in which B and N atoms alternate positions. Strong interest in BNQDs is primarily driven by their photoluminescence and quantum emission properties, the understanding of which has significantly advanced in recent years [9]. Several studies have demonstrated that oxygen-containing functional groups, typically linked to boron atoms within the structure, greatly enhance both the optical properties [10,11,12] and the biocompatibility [13,14] of BNQDs. The most straightforward approach for creating these defects entails the modulation of the oxidative conditions and the incorporation of oxygen-rich precursors during synthesis.
Fluorescent BNQDs are now synthesized using both top-down and bottom-up approaches [15,16,17]. The choice of synthesis technique depends on factors such as the purity of the final product, its size, the affordability of the synthesis equipment, and the characterization techniques available.
Top-down methods, including mechanical milling, microwave synthesis, sonication, and chemical exfoliation techniques, break down BN sheets into smaller fragments to produce heterogeneous BNQDs. The degree of lattice and edge defects is largely influenced by the organic solvents used during the process. The advantage of these methods is the certainty that the resulting structure retains a BN core, making characterization of the obtained substance relatively easier. These BNQDs are further chemically treated to modify their photoluminescence properties. However, the exceptional chemical stability of the h-BN structure possesses significant challenges for both physical and chemical modification [18,19,20].
The bottom-up approach allows for the indirect incorporation of defects into the lattice and facilitates the functionalization of edges during synthesis. This is achieved by varying the precursors and synthesis environment. Bottom-up methods are considered more advantageous for designing fluorescent nanomaterials with tunable optical properties and a narrow size distribution [21].
Hydrothermal/solvothermal synthesis is a widely employed bottom-up approach for fabricating nanomaterials, owing to its ability to precisely regulate particle size and morphology, high-crystallinity product yield, and operate under cost- and energy-efficient conditions. Moreover, this method is environmentally friendly, as it minimizes the use of toxic solvents while remaining scalable for industrial applications [22]. The term “bottom-up hydrothermal/solvothermal synthesis” refers to a process in which the formation of the BNQDs structure occurs in the liquid phase often within a Teflon-lined stainless-steel autoclave, without requiring any additional annealing process either before or after the procedure.
Since the first bottom-up hydrothermal synthesis of fluorescent BNQDs (or boron-nitride nanoparticles (BNNPs)) from boric acid and ammonia solution under a nitrogen atmosphere [23], the influence of different nitrogen precursors as well as synthesis temperatures, and reaction times on the size, structure, and optical properties of BNQDs has been investigated (Table 1). However, limited attention has been given to the impact of solvents used during solvothermal synthesis on the structure and properties of the resulting BNQDs.
Solvents play a pivotal role in solvothermal processes, governing reaction thermodynamics and kinetics, which directly influence product structure, crystallinity, and yield. Beyond acting as reaction media, solvents actively participate in chemical pathways via hydrogen bonding, solvation effects, or coordination interactions, thereby modulating bond dissociation and recombination dynamics. From an environmental perspective, water stands out as the greenest solvent: its abundance, low toxicity, and high dielectric constant make it the most commonly used solvent in the solvothermal synthesis of BNQDs (Table 1). Nevertheless, altering the solvent can lead to the incorporation of various atoms and functional groups into the nanomaterial’s structure or on its surface, ultimately modifying both its structure and physicochemical properties. This phenomenon has been demonstrated in carbon dot synthesis, where solvent choice significantly affects the distribution of functional groups, product composition, and final material properties [24]. Studies employing ethanol (or anhydrous ethanol) as a solvent during BNQD synthesis may regard it as a precursor of additional carbon-related defects in the structure of BN. A strategy to achieve BNQDs with desired structural and functional properties could involve the use of mixed-solvent systems.
Table 1. Summary of bottom-up hydrothermal synthesis protocols of BNQDs.
Name of Obtained NanomaterialsB PrecursorN PrecursorT (°C)/
t (h)
Solvent
Systems
References
BNQDs
(BONDs)
Boric acid
H3BO3
30–33% NH3 (aq)120–200/
5–24
H2O[11,23,25,26,27,28,29,30]
h-BNQDs (BNQDs, h-BNNPs)Melamine
C3H6N6
200/
15,24
H2O[31,32,33,34,35,36]
BNQDs
(h-BNQDs)
Urea
(H2N)CO
200/12Ethanol, H2O,
10% NH3(aq)
[37,38]
200/15H2O[39]
h-BNQDsUrea (H2N)CO/
Thiourea (H2N)SO/
Melamine C3H6N6
200/24H2O[40]
BNQDsAmino acids (tryptophan, cysteine, arginine, phenylalanine, tyrosine, aspartic acid, valine, isoleucine, histidine)200/10H2O[41]
BNNPsAliphatic amine150/4H2O[21]
o-BNQDsDicyandiamide
C2H4N4
160–230/
10–15
Anhydrous
ethanol
[10]
The resulting nanoparticles may incorporate a significant amount of oxygen (forming boron oxynitride dots) and carbon (yielding carbon boron nitride dots), along with mixed sp3-sp2 hybridized structures associated with orthorhombic BNQD (o-BNQD) phases and hydrogen terminations. Moreover, in several studies the formation of h-BNQDs is not even mentioned, suggesting instead the crystallization of ammonium pentaborate [42]. Considering the mentioned above, hydrothermal (solvothermal) synthesis may result in the formation of various by-products in addition to h-BNQDs.
This study focuses on evaluating the actual processes occurring during synthesis in the boric acid/urea system and investigating how the solvent influences the resulting structure and optical properties of BNQDs. Based on the mechanisms uncovered, we engineered impurity-free, highly emissive, biocompatible BNQDs with fluorescent properties finely tuned from the biologically unfavorable UV spectral range to the range commonly used for bio-imaging and corresponding to the standard DAPI channel. We also demonstrate the use of these specifically engineered BNQDs as effective blue-emitting labels for cellular imaging with fluorescence microscopy. This investigation could provide a foundation for the property-specific design of functionalized BNQDs, meeting the rising demands for advanced optoelectronic, electrochemical and biomedical imaging techniques in cutting-edge quantum technologies.

2. Materials and Methods

2.1. Synthesis of BNQDs

We conducted a one-pot hydrothermal synthesis to produce BNQDs using boric acid (Glentham Life Sciences Ltd., Corsham, UK) and urea (Glentham Life Sciences Ltd., Corsham, UK) as precursors, following the methodology described in [37]. As the reaction medium, the following solvent systems were chosen: (i) distilled water, (ii) 10% liquid ammonia (Sigma-Aldrich, St Louis, MO, USA), (iii) ethanol (Sigma-Aldrich, St Louis, MO, USA) and (iv) a mixture of (i–iii) in a 2:2:1 volume ratio. Further in the text, the corresponding synthesized products will be referred to as (i) H-BNQDs, (ii) N-BNQDs, (iii) E-BNQDs and (iv) C-BNQDs, respectively.
In a typical procedure, boric acid and urea (1:2 molar ratio) were dissolved in the designated solvent system and hydrothermally heated in a Teflon-lined stainless-steel autoclave at 200 °C for 12 h (Figure 1). After synthesis, the BNQD solution was cooled to room temperature and stored at 4 °C for 1–3 days to allow complete precipitation of white crystalline solid phase. Notably, precipitates formed only in solvent systems (iii) and (iv). Subsequently, approximately 80% of the top supernatant liquid was collected and filtered through a 0.22 μm pore-size syringe filter. Following solvent evaporation under 40 °C, BNQD powders (ranging in color from white to light yellow) were obtained.

2.2. Structural and Optical Characterization of BNQDs

2.2.1. Scanning Electron Microscopy (SEM) and Energy Dispersive X-Ray Spectroscopy (EDX)

The structure and composition of BNQD powders were examined using SEM (Hitachi S-4800 microscope, Hitachi High-Technologies Corp., Tokyo, Japan) and EDX (Bruker QUANTAX 200 EDS, Bruker AXS, Karlsruhe, Germany). BNQD powders were affixed to a conductive carbon tape mounted on an aluminum stub to ensure electrical conductivity and minimize charging effects. The sample was gently pressed to achieve a uniform layer and remove excess loose particles. The analysis was conducted at an accelerating voltage of 15 keV to optimize the excitation of elemental emission lines while minimizing beam damage.

2.2.2. Dynamic Light Scattering (DLS) and Zeta-Potential

For DLS and zeta potential measurements, BNQD powder samples were dispersed in deionized water at a concentration of 10 mg/mL. The hydrodynamic radius of the BNQD particles in the dispersion at 25 °C was analyzed using a Litesizer DLS 500 analyzer (Anton Paar GmbH, Graz, Austria). The instrument provides a detection range of 0.3 nm to 10 μm with an accuracy of ±2%, calibrated against NIST-traceable standards. Colloidal stability was assessed via zeta potential analysis on the same instrument. Measurements were performed with an accuracy of ±10%, reported as the average of three consecutive runs.

2.2.3. X-Ray Diffraction (XRD)

XRD measurement of powder samples of BNQDs was conducted at room temperature by using a Malvern Panalytical Empyrean Series 2 diffractometer (Panalytical, Almelo, The Netherland) with CuKα radiation (λ = 0.154178 nm). The measurement was taken in geometry of coupled θ–2θ varied between 10° and 60° (step—0.013°) with an operation voltage and current maintained at 40 kV and 30 mA.

2.2.4. Infrared Spectroscopy by Fourier Transform (FTIR)

FTIR spectra of different types of BNQD powders were collected using a Thermo Nicolet Avatar FTIR 330 spectrometer (Thermo Fisher Scientific, Waltham, MA, USA) equipped with a Smart Diffuse Reflectance attachment.

2.2.5. Raman Spectroscopy

The BNQDs powder samples for Raman spectroscopy were prepared by uniformly depositing a thin layer onto a clean glass coverslip mounted on a silicon substrate, providing optimal thermal conductivity and minimized fluorescence background. Raman spectra were collected by a HORIBA XploRA PLUS (HORIBA France SAS, Palaiseau, France) confocal system with a 532 nm laser. A 100× objective with a numerical aperture (NA) of 0.95 was employed with laser exposure times of 10–20 s at a power of 10 mW. The spot size on the sample surface was 0.75 μm. Raman intensities for all spectra were divided by the exposure time and represented in counts per second (cps) units.

2.2.6. UV–Vis Spectroscopy

The UV–vis absorption spectra of the BNQD water suspensions were recorded with the Jasco V-670 UV–vis spectrophotometer (JASCO Inc., Easton, MD, USA). The absorbance spectra of the synthesized samples of BNQDs were initially measured at equal concentrations of 10 mg/mL in distilled water using 1 cm quartz cuvettes, then diluted to achieve an optical density (OD) of 0.1 or less at the absorbance maximum for further photoluminescence (PL) and photoluminescence excitation (PLE) spectra measurements to avoid reabsorption. Measurements were carried out in the spectral range of 220–800 nm.

2.2.7. PL, PLE Spectroscopy and 2D PLE Mapping

2D PLE mapping and PL spectra of BNQD water suspensions (OD < 0.1) were performed in 1 cm quartz cuvettes using the FS5 spectrofluorometer (Edinburgh Instruments Ltd., Edinburgh, UK) equipped with a xenon arc lamp (150 W, CW, ozone-free) as excitation source. PL spectra were measured with excitation at 240 nm, 267 nm and 320 nm and emission at 310 (325)–600 nm with excitation/emission slits of 1/3 nm and a dwell time of 1 s. PLE mapping was performed with excitation in the range 230–400 nm with a step of 5 nm, emission in the range 250–600 nm with a step of 2 nm, a dwell time of 0.5 s and excitation/emission slits of 1/3 nm. The Raman band of water was removed from the spectra during analysis. Spectra were smoothed using the asymmetric least squares smoothing algorithm.

2.3. Fluorescence Microscopy of BNQDs in Vero and MDBK Cells

The Vero and MDBK cells were provided by the Republican Center for Hygiene, Epidemiology, and Public Health, Research Institute of Hygiene, Toxicology, Epidemiology, Virology, and Microbiology, Minsk, Belarus. Vero or MDBK cells were seeded into Ibidi dishes with glass bottom (Ibidi GmbH, Gräfelfing, Germany) at a density of 300,000 cells/mL and incubated with C-BNQDs (1 mg/mL) in DMEM culture medium supplemented with 10% fetal bovine serum and 1% penicillin–streptomycin at 37 °C in a humidified 5% CO2 incubator. Prior to treatment, the aqueous suspension of C-BNQDs was filtered through a 0.22 μm syringe filter to ensure sterility. As a negative control, a monolayer of cells incubated with sterile distilled water was analyzed. After 24 h of incubation, the cell monolayers were washed with phosphate-buffered saline (PBS, pH 7.4; Elabscience, Houston, TX, USA) and subsequently analyzed using fluorescence microscopy.
Cell imaging was carried out using an inverted Nikon Eclipse Ti2 microscope (Nikon, Tokyo, Japan) with a water immersion objective Nikon Plan Apo 60×, NA 1.20 (Nikon, Tokyo, Japan). The excitation light source was an LED peaking at 365 nm (52 nm FWHM), DAPI channel. The fluorescence signal was separated from the excitation light using a BrightLine Pinkel filter set (412–450, 490–530, 576–615, 660–710 and 760–850 nm emission ranges) and detected using a monochrome DS-Qi2 camera with a 16 MP CMOS matrix. For analysis, the fluorescent images were set to the same intensity scale to enable clear comparison between control cells and cells with accumulated BNQDs.

2.4. Cytotoxicity Assay of BNQDs

The cytotoxicity of BNQDs was evaluated by MTT (3-[4,5-dimethylthiazol-2-yl]-2,5 diphenyl tetrazolium bromide) assay using Vero cells according to the standard protocol. Vero cells were seeded at a concentration of 50,000 cells per well in 96-well plates and maintained at 37 °C and 5% CO2. After 24 h of cultivation, a filtered C-BNQD water solution was added to the wells at concentrations of 10–1000 µg/mL. Untreated cells were used as negative control. The cells were incubated with the C-BNQDs in the dark at 37 °C for 6 and 24 h and then washed with PBS buffer. Subsequently, 0.3 mg/mL MTT was added, and the cells were left in the dark for 2 h. The formazan crystals, formed in viable cells by the enzymatic reduction of MTT, were dissolved in 0.1 mL DMSO by shaking for 1 h. The absorbance was measured at a wavelength of 540 nm using a Wallac 1420 Victor2 Micro-plate Reader (PerkinElmer, Shelton, CT, USA). The percentage of viable cells was calculated relative to the maximum absorbance intensity of the control cells.

3. Results

3.1. Morphology, Chemical Composition and Yield of Synthesized BNQDs

In this work, we obtained four samples of BNQDs, which were synthesized using a bottom-up hydrothermal/solvothermal method from boric acid and urea as precursors, utilizing different solvent systems, as shown in Table 2. Notably, for C-BNQDs and E-BNQDs, a crystalline precipitate was formed after keeping the synthesized solution at 4 °C for 1–3 days.
The yield of BNQD powder was calculated as the ratio of the mass of the initial reactants (boric acid and urea) to the mass of the obtained powder after evaporation. For C-BNQD and E-BNQD, both the yield of the powder after evaporation and the formed precipitate were assessed separately and summed up. The observed total yield in the four synthesized systems ranged from 27% to 33%. Notably, the actual yields of C-BNQDs and E-BNQDs are 5.95% and 13.30%, which are much lower than the precipitate formed. In the case of H-BNQDs and N-BNQDs, the high yield may be attributed to the presence of by-products that could not be removed after the synthesis procedure.
To investigate the chemical composition of the synthesized BNQDs, elemental analysis using EDX was performed, and the results are presented in Table 3. In pristine BNQDs, the B:N ratio is typically 1:1. However, our measurements revealed deviations from this ratio: 2.4:1 for C-BNQDs, 4.8:1 for H-BNQDs, 3.3:1 for E-BNQDs, and 4.1:1 for N-BNQDs.
Furthermore, the presence of O and C atoms in BNQD samples was detected. These dopants originated from the precursors (boric acid and urea) as well as from the ethanol used in the synthesis can be incorporated into the BN core. The oxygen content in all samples was exceptionally high (exceeding 60 wt.%), with the maximum value observed in the E-BNQDs sample (73.10 wt.% or 66.34 at.%) and the minimum in N-BNQDs (64.82 wt.% or 57.30 at.%).

3.2. Characterization of Size and Zeta-Potential of BNQDs

The SEM images of the samples of BNQD water solutions, dripped and dried on the polished silicon wafer, show self-organized BNQD agglomerates with an average lateral size of the individual particles of 15 to 45 nm (Figure S1). The influence of the solvent on the size of synthesized BNQDs in solution was assessed employing DLS analysis. As shown in Table 4, the minimum and maximum hydrodynamic diameters observed were 580 nm and 770 nm for E-BNQDs and N-BNQDs, respectively. Although filtration of the BNQDs suspension through the 0.22 μm pore-size syringe filters were supposed to result in nanoparticle size below 220 nm, the significant enlargement of the nanoparticles occurred more likely due to aggregation or the formation of a hydration shell. All types of BNQDs exhibited a polydispersity index (PDI) in the range of 0.3–0.4, indicating moderate sample polydispersity, likely due to the presence of larger particles in aqueous suspensions.
C-BNQDs, H-BNQDs and E-BNQDs demonstrated high negative zeta potentials near −30 mV, confirming excellent colloidal stability and suggesting the presence of negatively charged functional groups at the nanoparticle edges. In contrast, N-BNQDs showed a significantly reduced zeta potential of −1.5 mV.

3.3. Structural Characterization of BNQDs

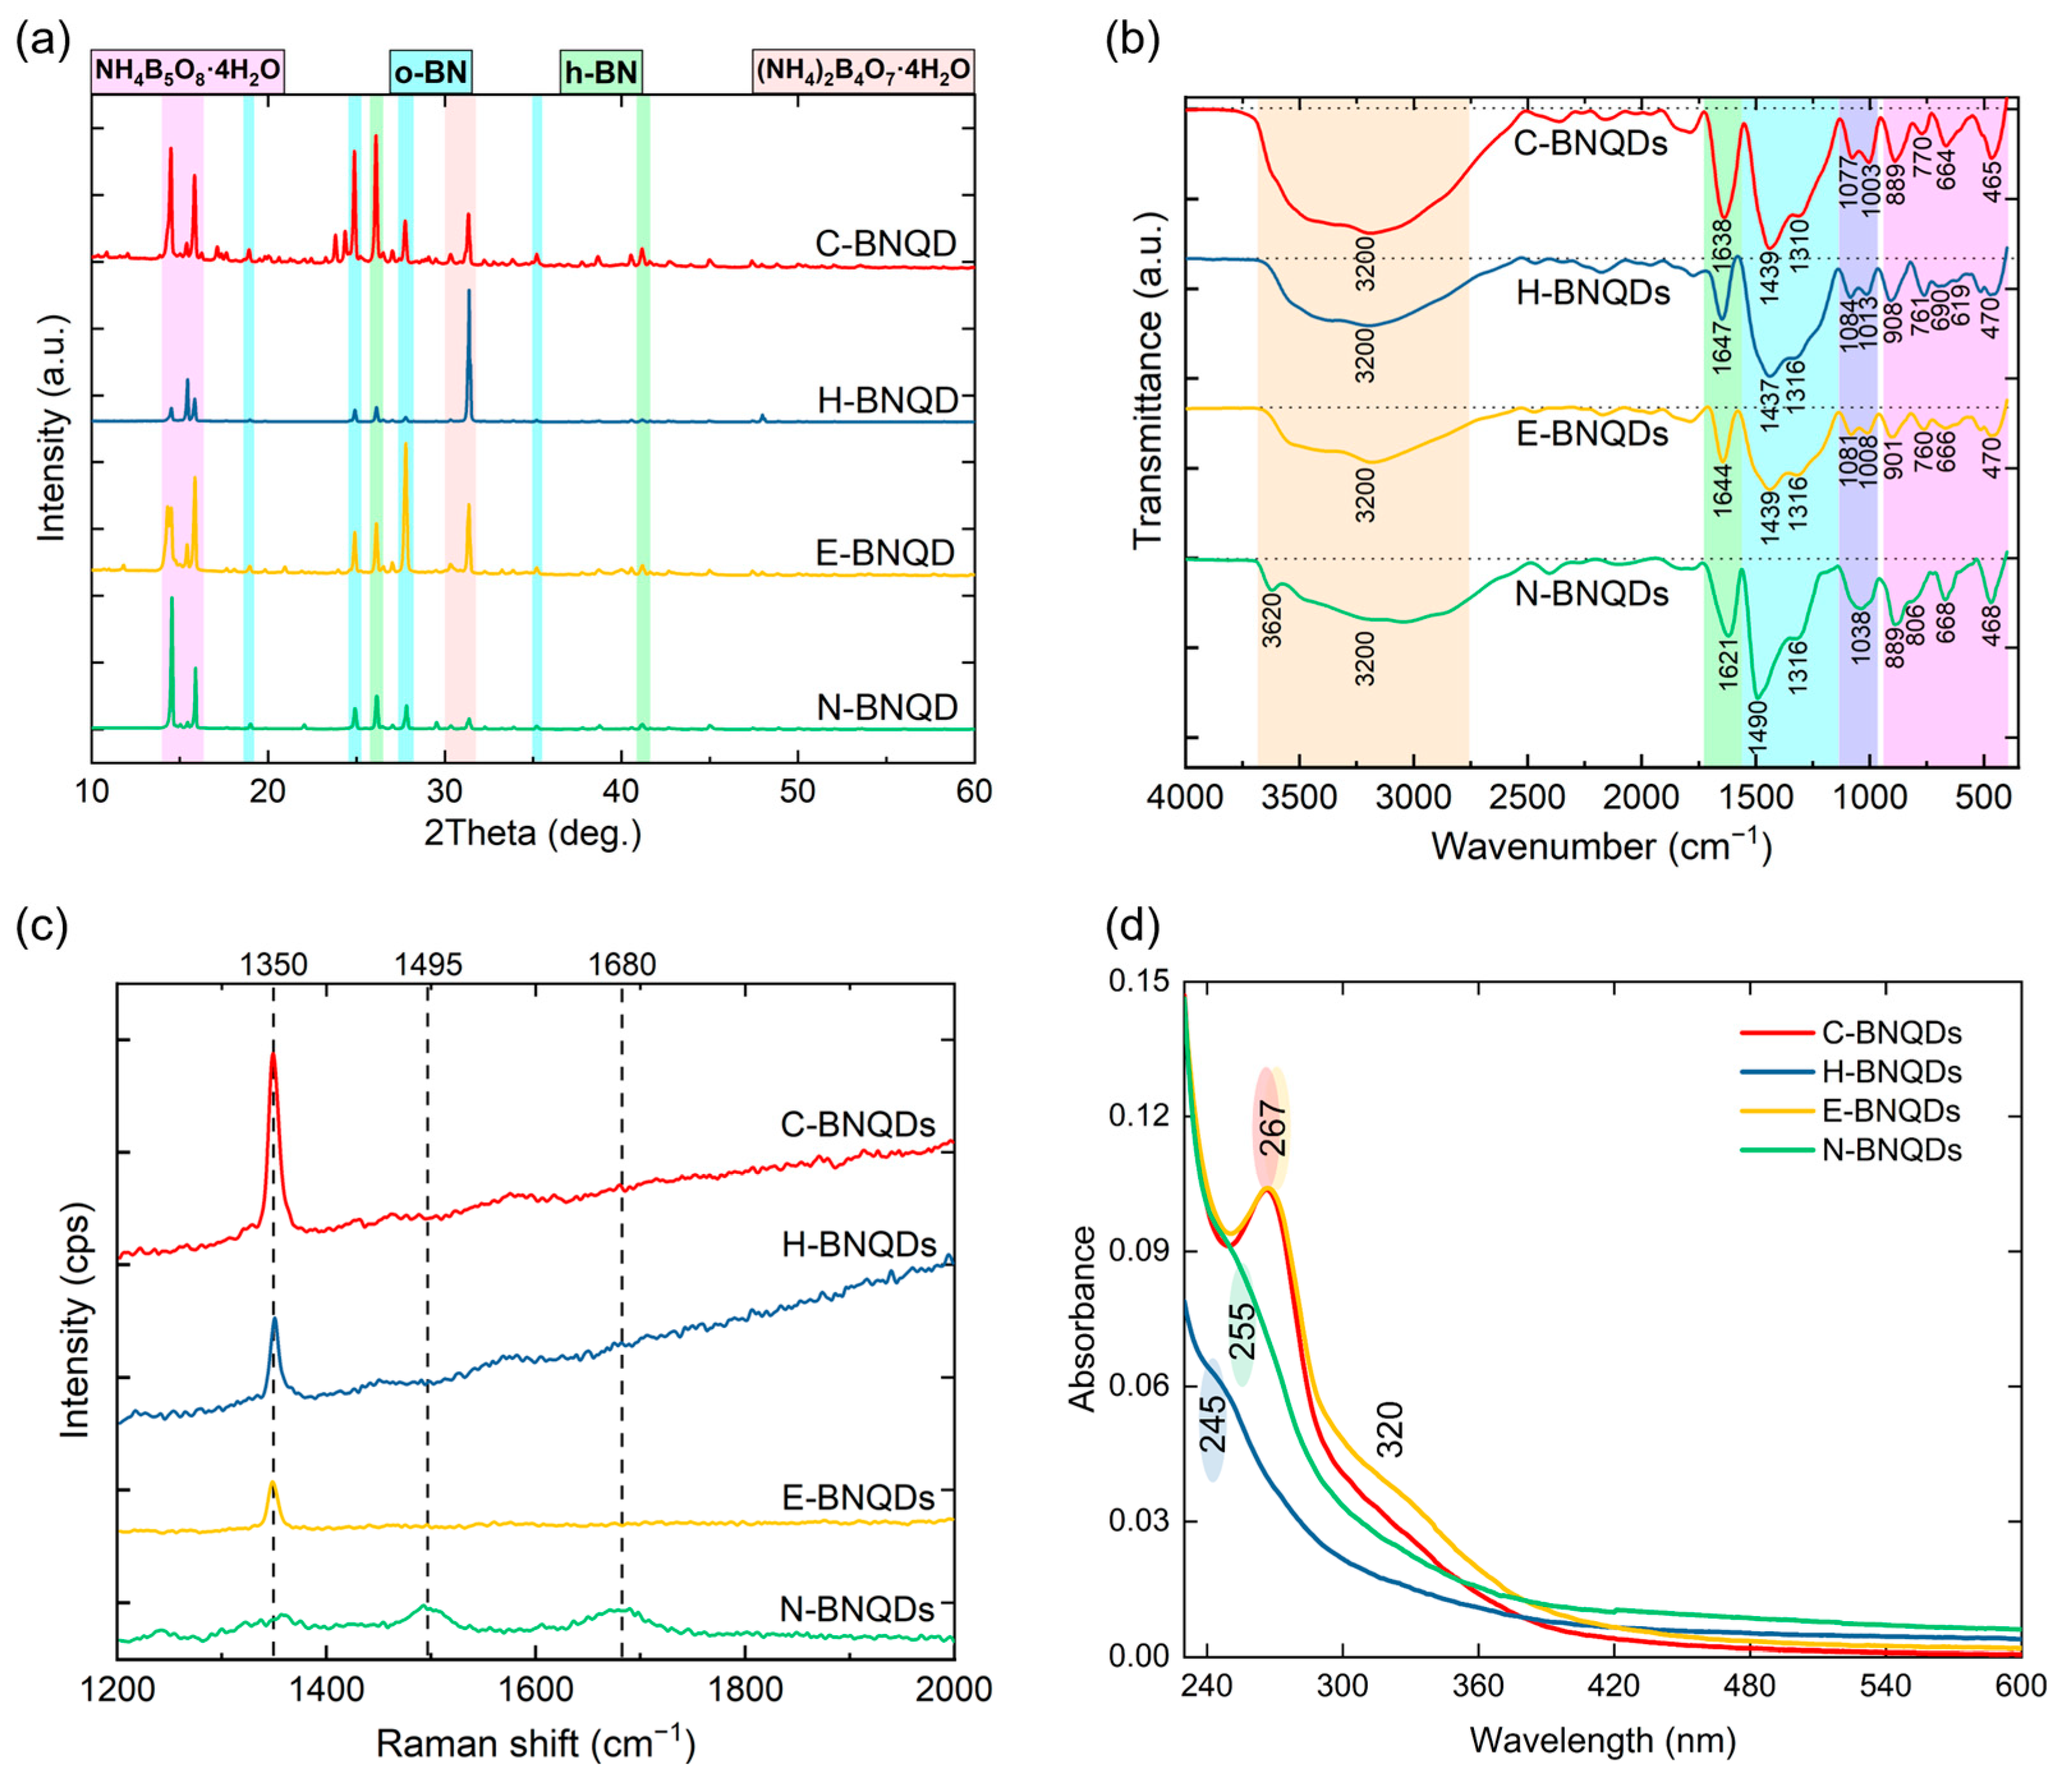
XRD analysis revealed the crystalline structure of all prepared BNQD samples. By comparing the XRD patterns of BNQDs, represented in Figure 2a, with the standard reference cards, it was determined that in addition to h-BN (JCPDS no. 00-009-0012), o-BN (JCPDS no. 00-018-0251), ammonium pentaborate tetrahydrate (NH4B5O8·4H2O, APT) (JCPDS no. 00-031-0043), and ammonium tetraborate tetrahydrate ((NH4)2B4O7·4H2O, ATT) (JCPDS no. 00-019-0061) were present. Peaks at 2θ = 26.1° and 41.2° were indexed to the characteristic (002) and (100) reflections of the h-BN phase, while peaks at 18.9° (011), 24.9° (120), 27.8° (211), and 35.2° (202) corresponded to the o-BN structure. It was observed that BN phases predominated in samples C-BNQDs and E-BNQDs, whereas impurity presence was prominent in samples H-BNQDs and N-BNQDs, correlating well with the absence of precipitate during synthesis.
All prepared BNQDs exhibit characteristic bands in their FTIR spectra indicative of BN bonds (Figure 2b). However, the peak maxima positions of different types of BNQDs do not coincide, typically showing a difference of 10–20 cm−1. The band at 1638 cm−1 in the C-BNQDs spectrum corresponds to the characteristic vibrational peaks of C–B/N and B=N bonds [23,43]. This suggests that the dot structure likely formed and probably was additionally decorated with carbon-containing functional groups such as C–N and C=O originating from precursor molecules or solvents. The bands in the spectra of all BNQDs, except for N-BNQDs, at 770–760 cm−1 and 1084–1077 cm−1 correspond to the vibrational modes of B–N and N–B–O bonds [11,44]. A weak band in the range of 1316–1310 cm−1, indicating the presence of B–N–B vibrations, was registered in all samples.
The spectra also indicate the presence of additional C-, N- and O-containing functional groups. Intense, broad bands centered at 3200 cm−1, and at 3430–3400 cm−1 (shoulder) in the high-frequency range of all BNQD spectra are attributed to the symmetric stretching vibrations of O–H in B–OH and N–H, respectively [30].
The band at 1439–1437 cm−1 (which coincides in all FTIR spectra of BNQDs) could be attributed to B-O or C-N bonds [10]. Interpretation of this peak should be approached with caution, as these bonds are also found in the FTIR spectra of precursors (boric acid and urea). Therefore, it cannot be definitively concluded that these vibrations are specifically associated with the BNQDs structures. The band at 1013–1003 cm−1 could be attributed to tetrahedral B units [45] of B–N–O and N–B–O bonds. The presence of these boron oxynitride groups in the BNQD structure may also explain the merging of two peaks (1080 and 1010 cm−1) into a single peak centered at 1038 cm−1 in the N-BNQDs spectrum.
The remaining peaks located in the low-frequency range (below 1000 cm−1) correspond to deformation vibrations and may be associated with boron bond vibrations (B–O, B–O–B, B–OH, symmetric BO3 deformation, and O–B–O) [46].
The typical Raman spectra of synthesized BNQD powders are shown in Figure 2c. Existing information on the electronic structure and phonon dispersion of h-BN-based materials predominantly indicates a single peak around 1363 cm−1 with a full width at half maximum (FWHM) of approximately 10 cm−1. This peak is generally attributed to the high-frequency E2g vibrational mode of h-BN [8,14]. In the Raman spectra of C-BNQDs and E-BNQDs, a distinct peak at 1350 cm−1 is observed, with FWHM values of 12 cm−1 and 11 cm−1, respectively. In the H-BNQDs sample, a blue shift of up to 2 cm−1 is detected, with a peak at 1352 cm−1 and a reduced FWHM of 9 cm−1, indicating a narrowing of up to 3 cm−1 compared to C-BNQDs. The presence of luminescence in the C-BNQDs and H-BNQDs samples was evidenced by an elevated baseline in the Raman spectra, indicative the broadband emission overlapping with the Raman scattering signal. The recorded Raman spectrum of N-BNQDs differs significantly from those of the other samples, with a peak around 1350 cm−1 barely discernible. The presence of low-intensity peaks at 1242, 1495, and 1680 cm−1 may indicate residual urea and correspond to the vibrations of CO, CN, and NH2 bonds, although the presence of these groups in the structure of BNQDs cannot be excluded.

3.4. Optical Characterization of BNQDs

Figure 2d presents the UV–vis absorption spectra of aqueous solutions of BNQDs. The absorption maxima at 245 nm for H-BNQDs and 255 nm for N-BNQDs arise from the continuum of π-π* interband transitions, reflecting valence-band to conduction-band electronic excitations characteristic of the BN system [47,48]. The spectra of C- and E-BNQDs display a distinct absorption band centered at 267 nm (π-π* transitions) and shoulder at 320 nm. The 320 nm band is assigned to n-π* transitions involving defect states created by either oxygen edge functionalization or C-B/C-N bonds formation [49,50]. Since the initial reagents (boric acid and urea) exhibit minor absorption in the UV–vis range, any contributions from residual contents are excluded.
The photoluminescence (PL) spectra of BNQDs under 240 nm, 267 nm, and 320 nm excitation are shown in Figure 3. Under 240 nm excitation, both C-BNQDs and E-BNQDs exhibited dual emission peaks. While C-BNQDs showed an emission maximum at 430 nm, E-BNQDs displayed a blue-shifted peak at 355 nm. Notably, under 267 nm excitation, both samples have emission maxima at 420 nm, though C-BNQDs dominate in intensity. At 320 nm excitation, both samples have a single broad emission peak, and the blue-shift trend persisted for E-BNQDs (emission at 355 nm), while C-BNQDs emitted at 390 nm. In contrast, N-BNQDs and H-BNQDs show weak emission at 390–410 nm.
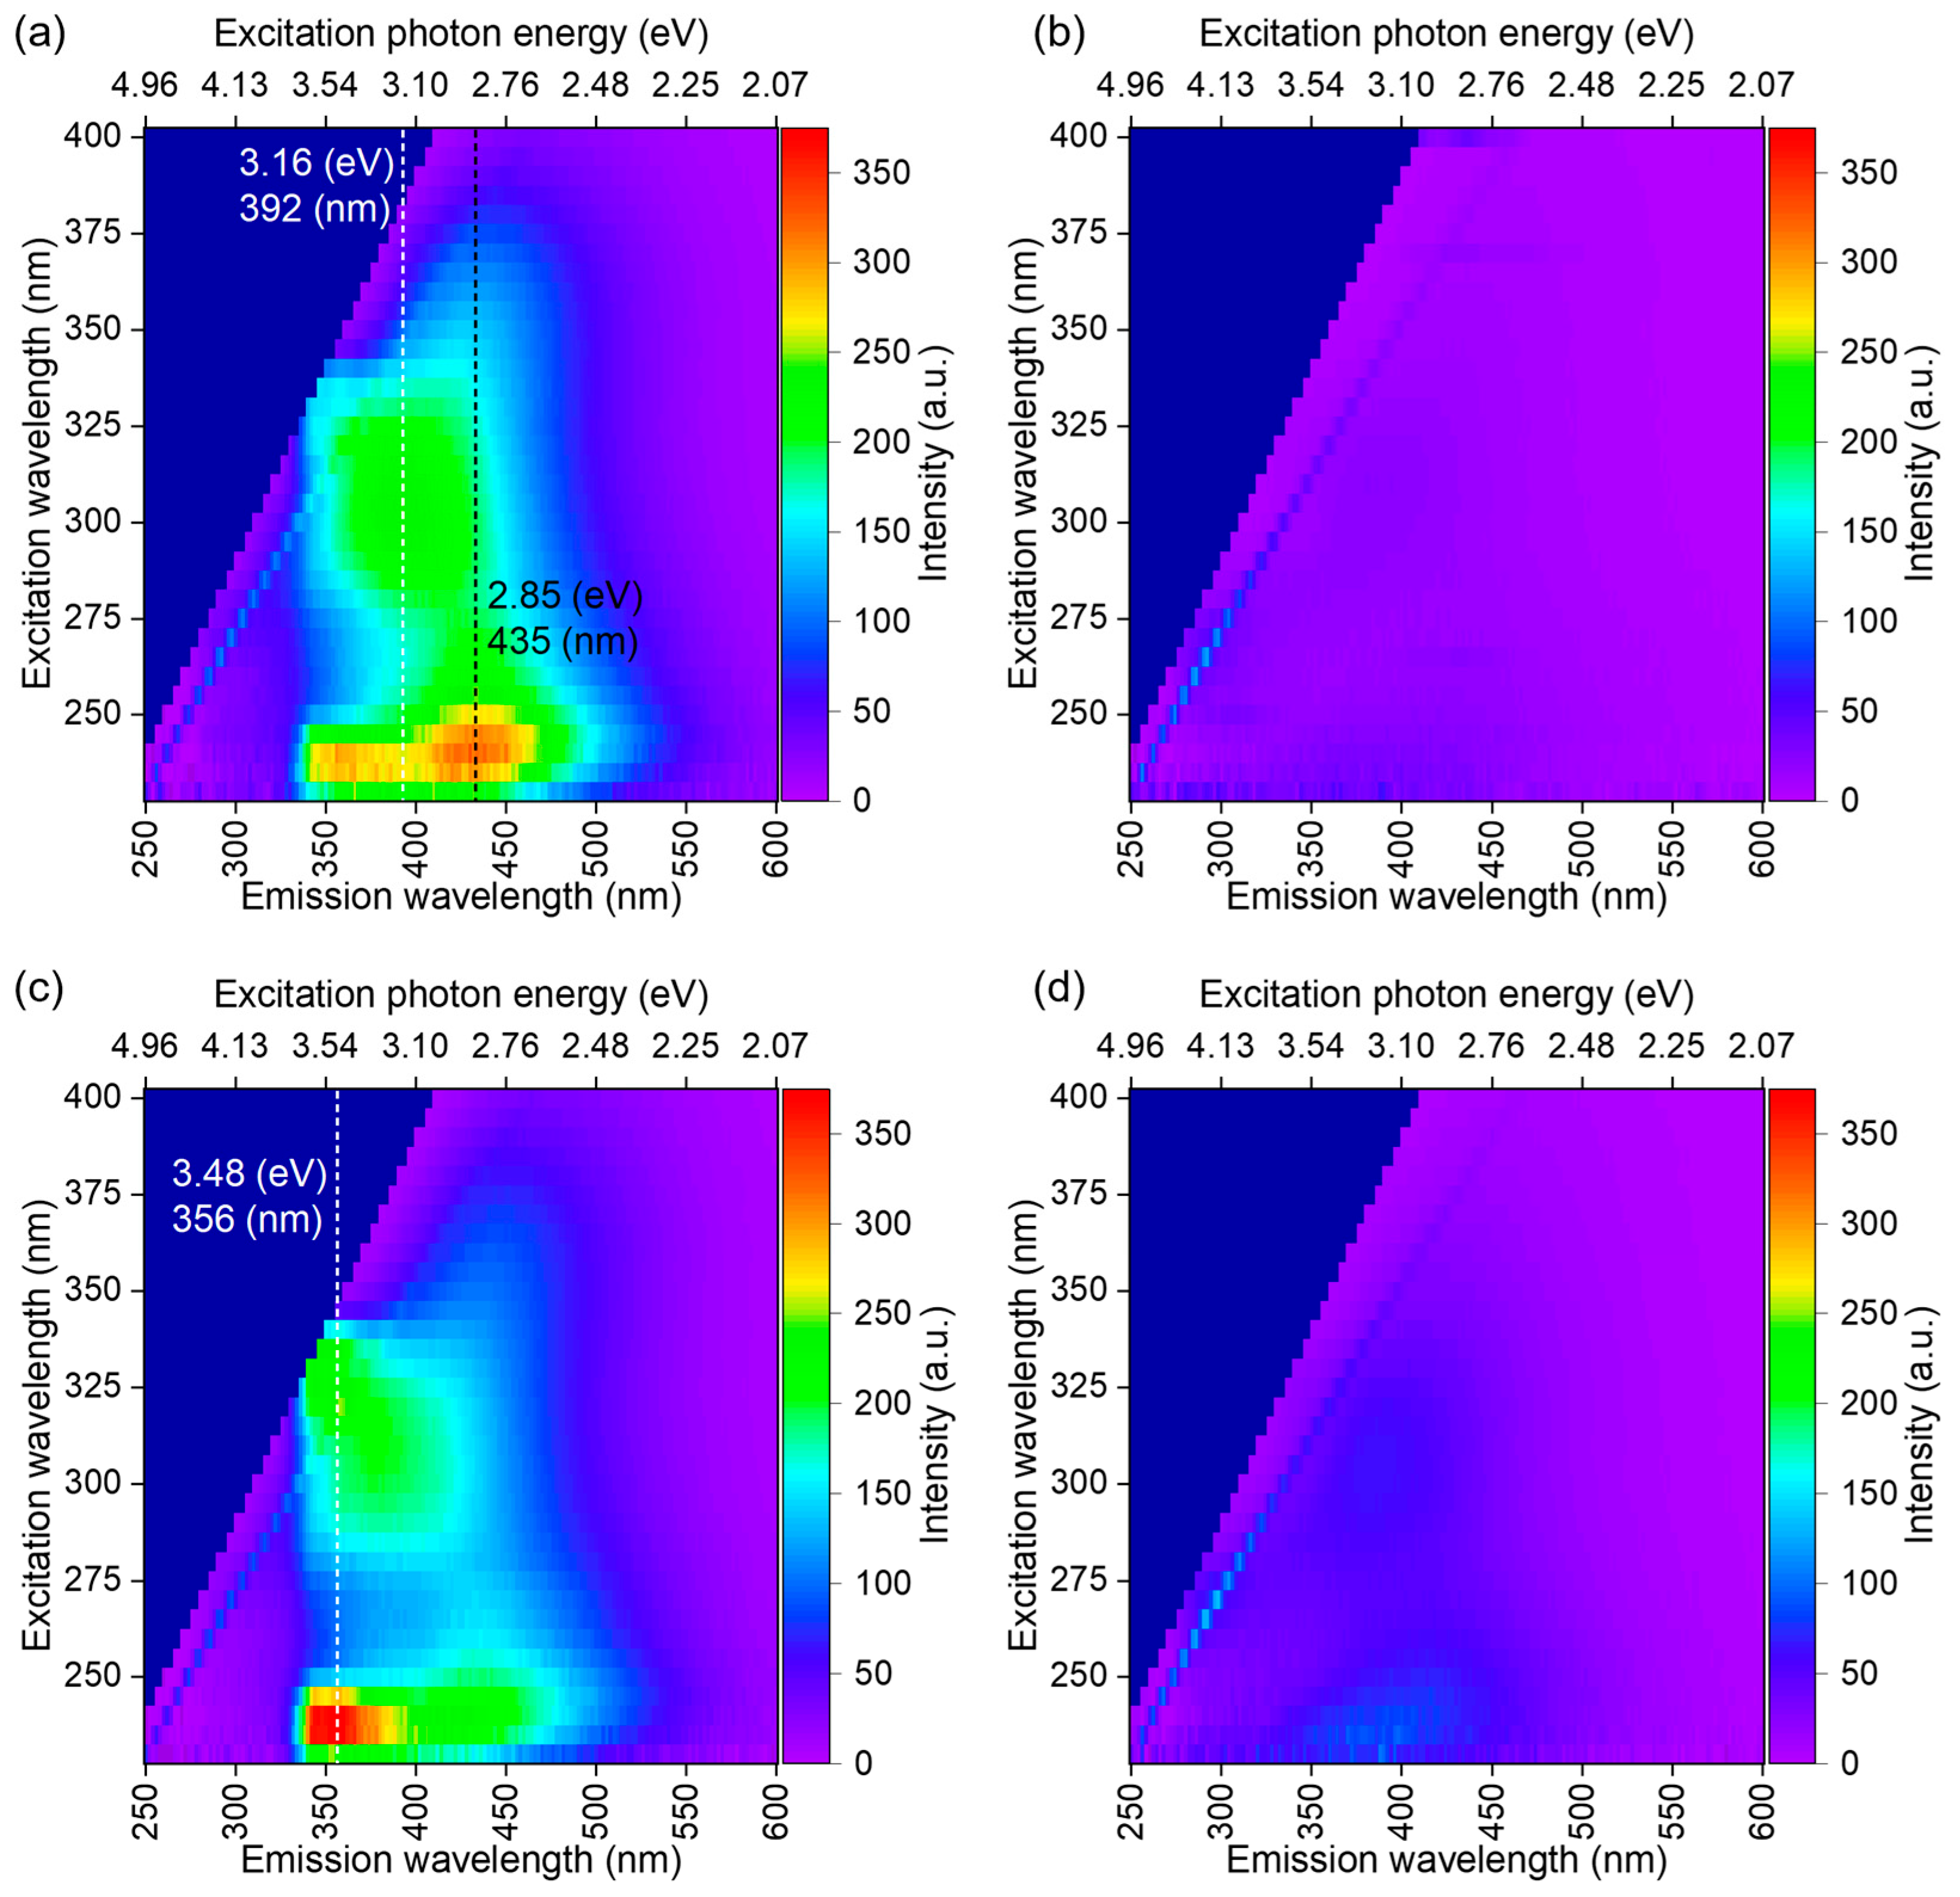
The excitation-dependent luminescence behavior evident in the 2D PLE (photoluminescence excitation) map spectra was compared by representing PLE data in the same scale in absolute values (Figure 4). Compared to C-BNQDs and E-BNQDs, the PLE map of N-BNQDs and H-BNQDs exhibits reduced/negligible intensity. The spectra of E-BNQDs and C-BNQDs exhibit two distinct emission regions: (i) a broad UV band with peaks at 355 nm and 430 nm under 240 nm excitation, respectively, and (ii) a blue region (370–425 nm) with maximum emission at 390 nm under 310 nm excitation, particularly prominent in C-BNQDs. This two-region behavior suggests competing radiative pathways involving both intrinsic band–edge transitions and defect-related states, with the relative intensities reflecting differences in surface functionalization between the two BNQD types.
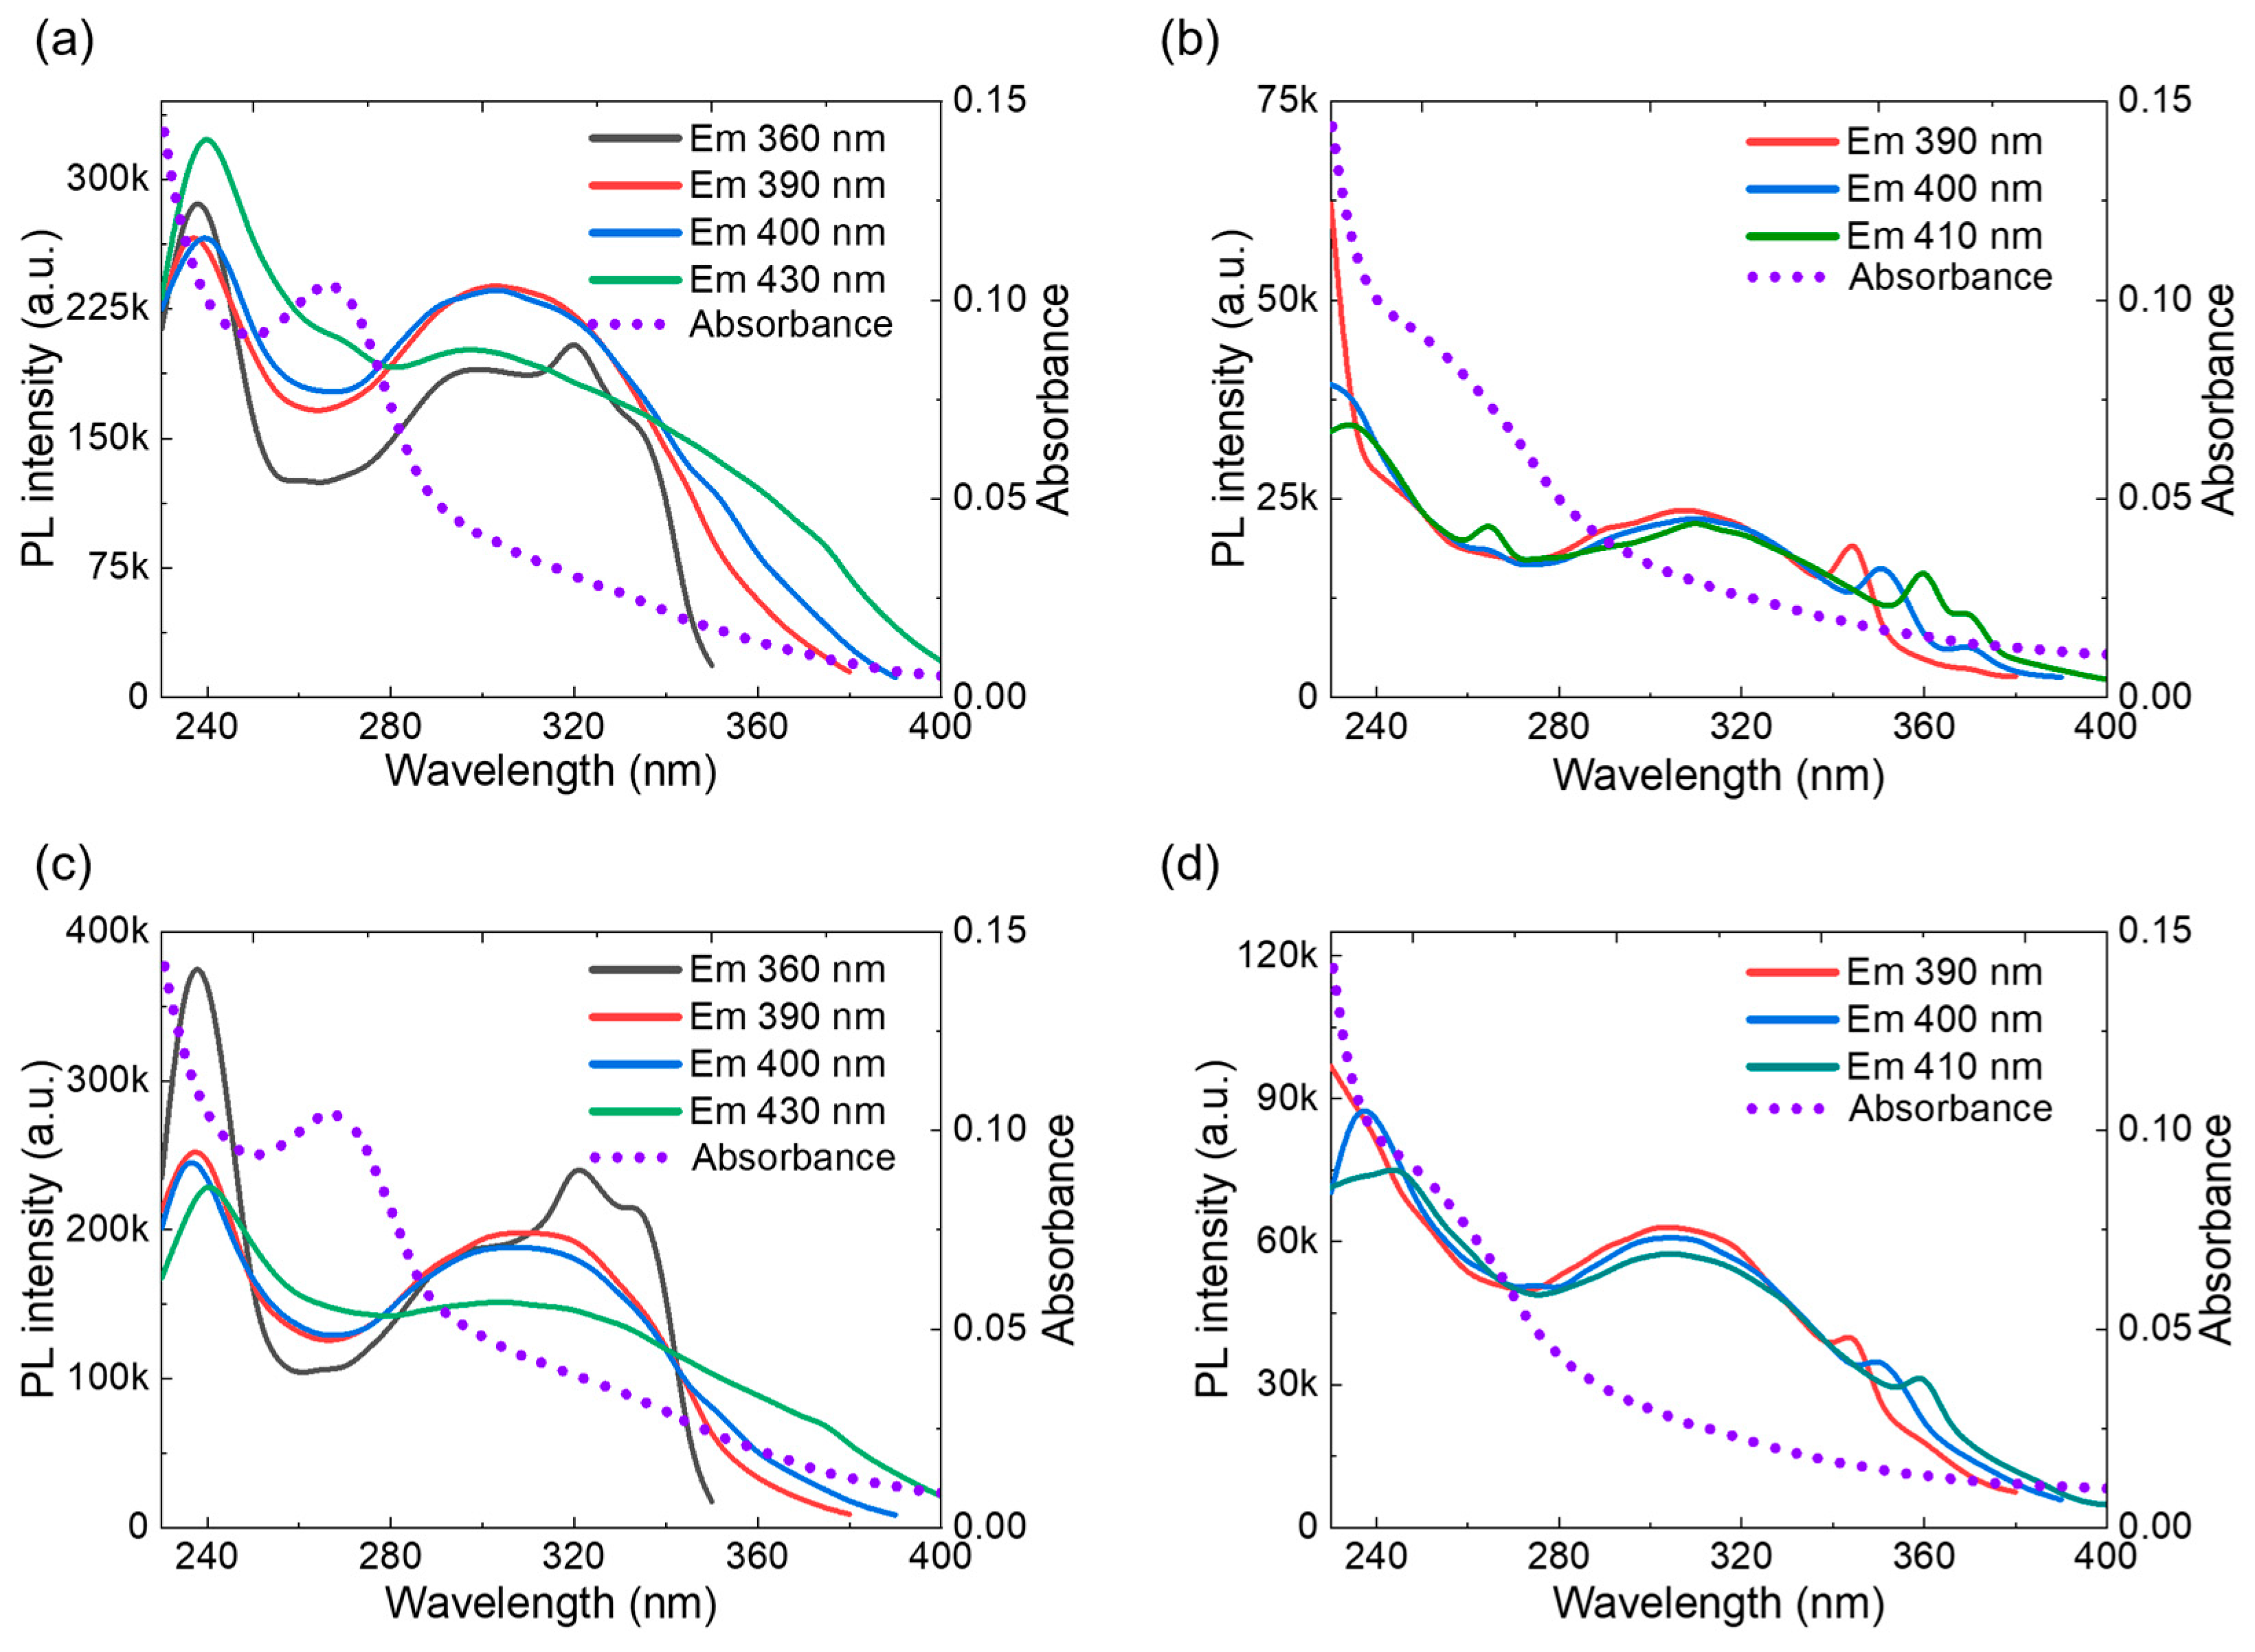
The observed mismatch between absorbance and PLE spectral maxima reveals critical insights into the competition between radiative and non-radiative processes in BNQDs (Figure 5). The absorbance spectra are dominated by a π-π* transition at 245, 255, and 267 nm for H-BNQDs, N-BNQDs, C-BNQDs and E-BNQDs. However, the absence of these peaks in the PLE spectra suggests efficient non-radiative relaxation.
The quantum yield (QY) of the C-BNQDs was determined by comparison with reference fluorescent dyes and amounted to 7.4% for excitation at 320 nm (see Supplementary Materials).
The results for the photostability of BNQDs under continuous irradiation and storage in the dark for about one year are shown in Figures S2 and S3. The synthesized BNQDs show remarkable photostability. As follows from Figure S2a, the decrease in PL intensity (λem = 390 nm) was less than 7% for all BNQD types after 30 min irradiation with λex = 320 nm. The shape of the spectra of C- and E-BNQDs changed slightly after irradiation, while the spectra of H- and N-BNQDs remained unchanged (Figure S2b). As shown in Figure S3a, the UV–vis absorption spectra practically coincide, so we can assume that no structural changes occurred in the BNQDs during the storage period.

3.5. Characterization of C-BNQD and E-BNQD Precipitates

The precipitate formed during the bottom-up hydrothermal/solvothermal synthesis of C-BNQDs and E-BNQDs was characterized using EDX, XRD, and FTIR analysis. EDX analysis (Table 5) revealed the presence of all constituent atoms in both the BNQDs and their precipitate which can be attributed to two possible factors: (1) partial incorporation of nanoparticles into the precipitate during crystallization, or (2) residual unreacted precursors (urea and boric acid) co-precipitating with reaction by-products.
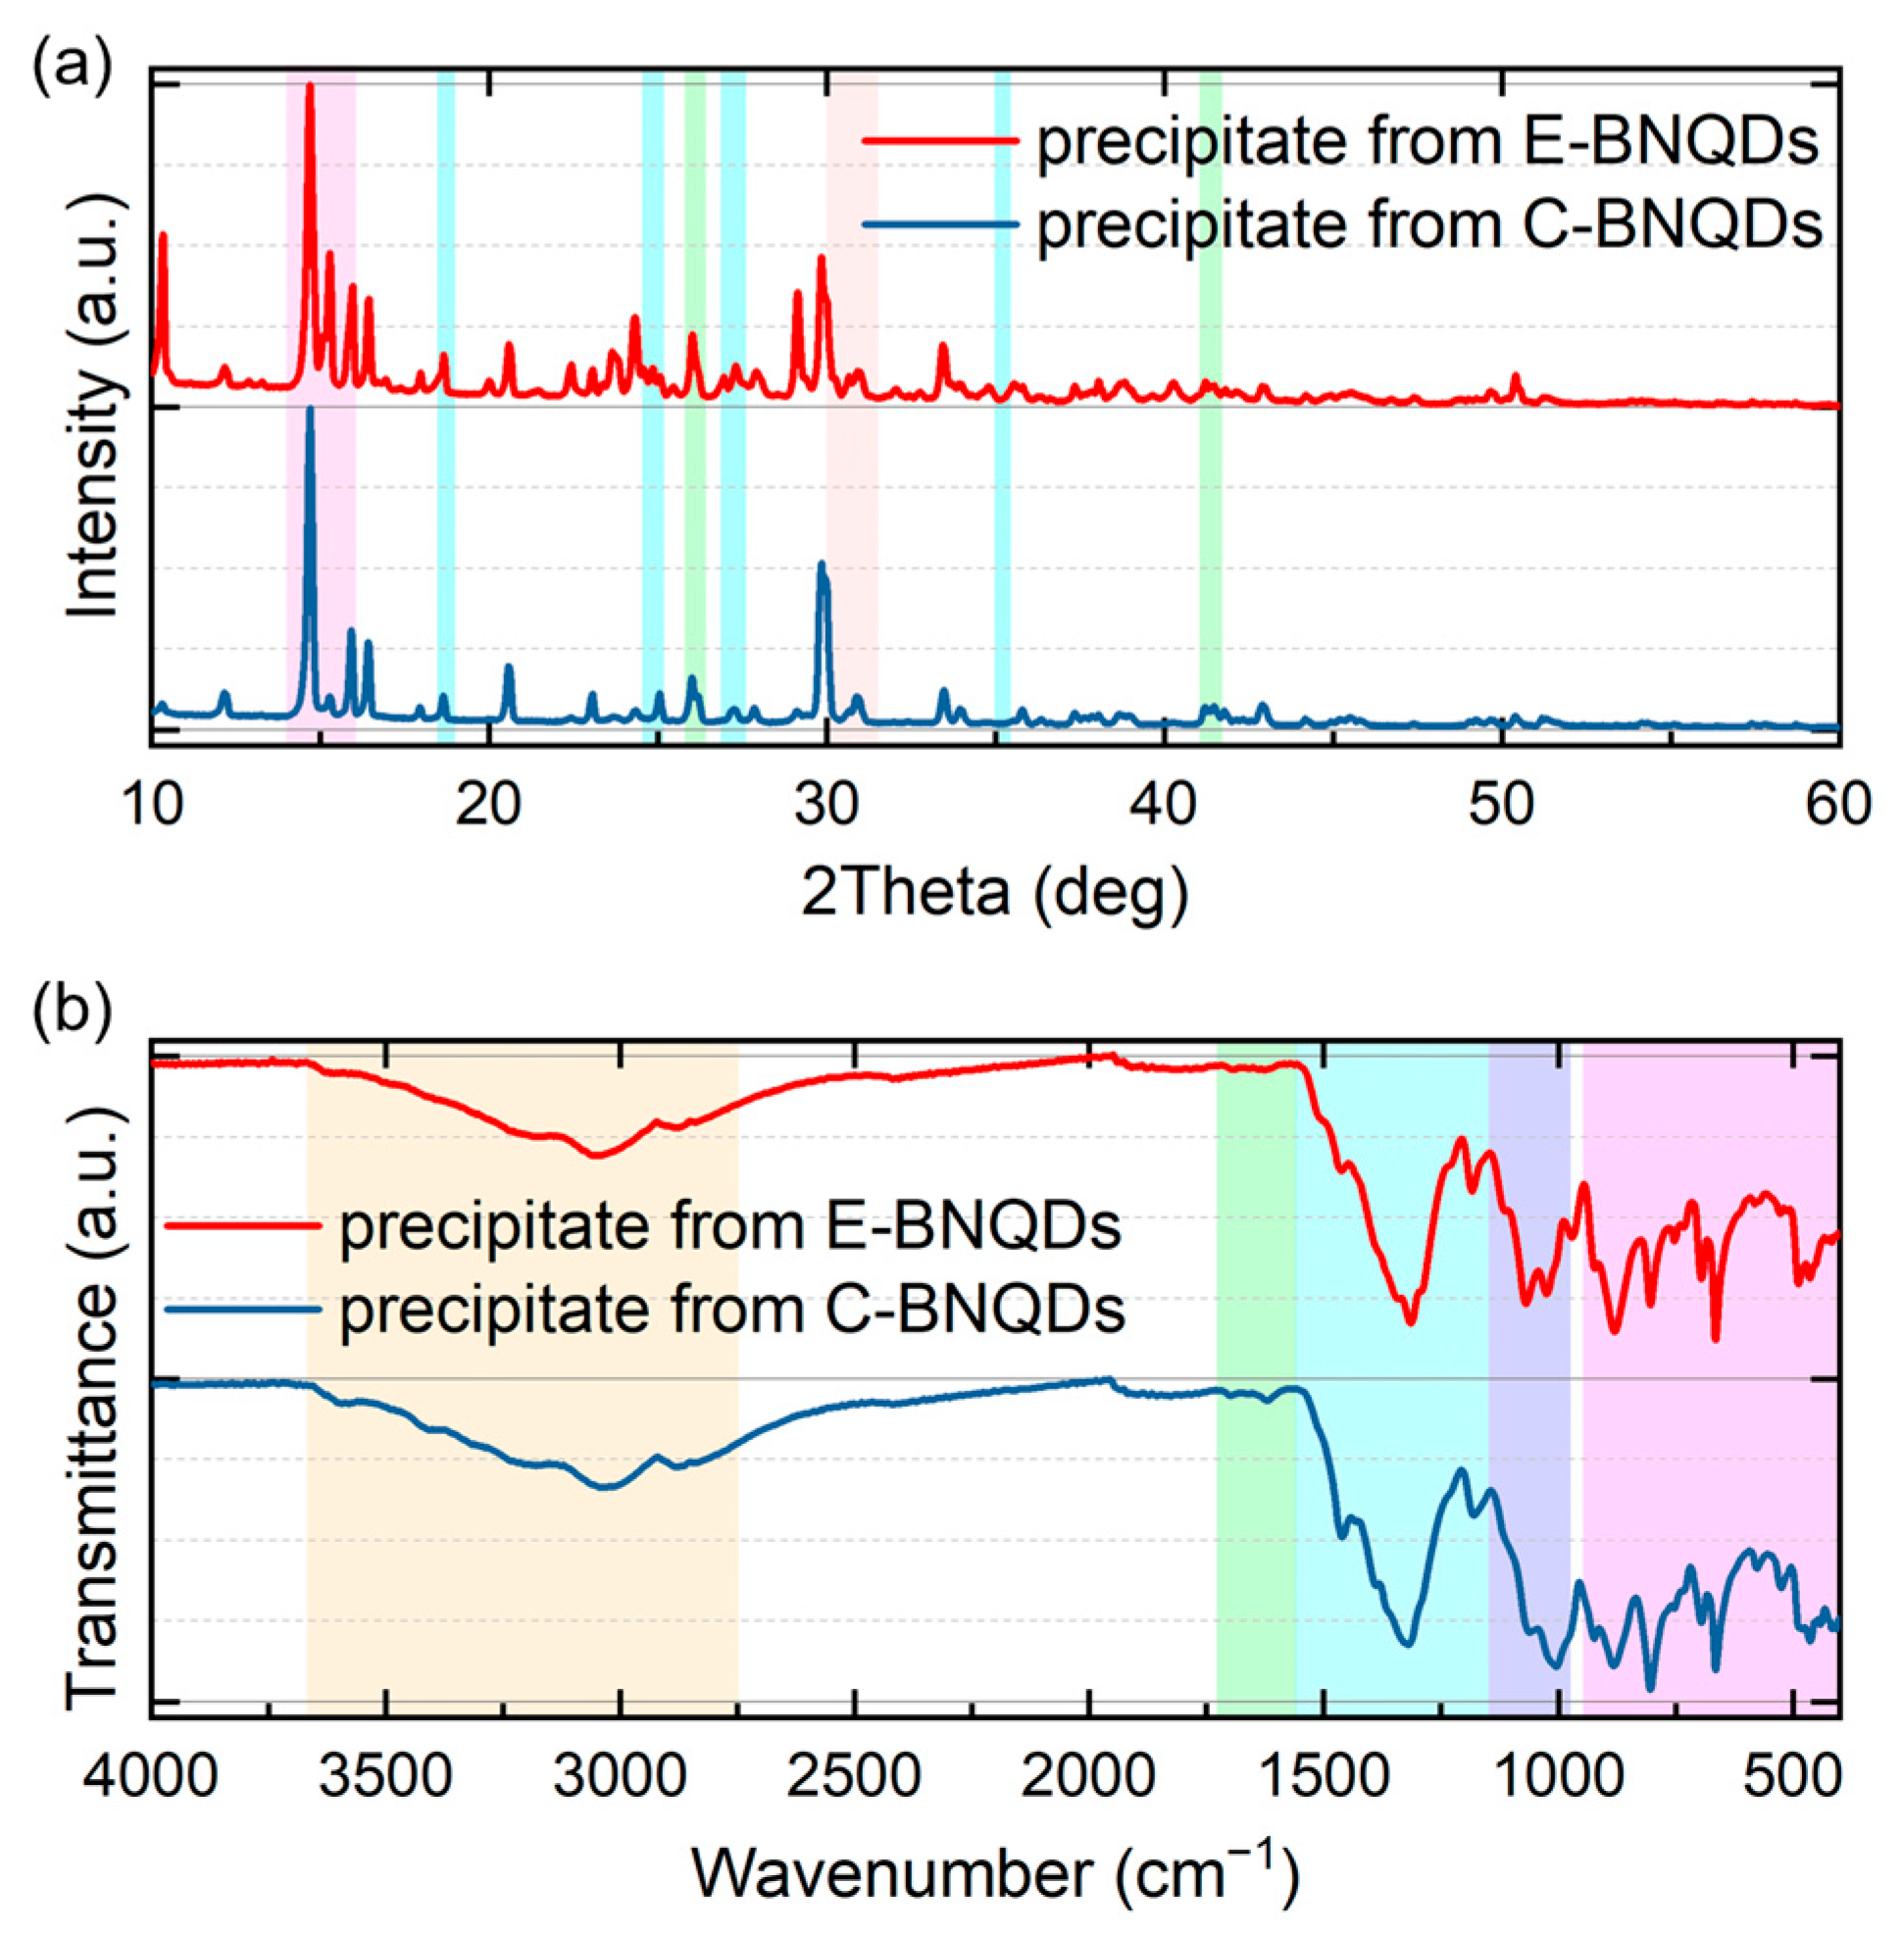
XRD analysis (Figure 6a) revealed that the precipitates from C-BNQDs and E-BNQDs were predominantly ammonium polyborate polyhydrate phases, with negligible consistence of BN-phases. FTIR spectra (Figure 6b) showed characteristic B-N bond vibrations at 1320 cm−1, which appeared only in nanosheets (multilayered h-BN structures) in both precipitates, along with distinct bands at 1000–995, 940–800, 700–660, and 530–450 cm−1 attributable to B-O and O-B-O vibrations. Comparative structural analysis of C-BNQDs, E-BNQDs, and their precipitates suggested that the precipitates may retain trace amounts of BNQDs (or larger BN nanosheets), potentially entrapped during crystallization. There was no fluorescence in the precipitates obtained from the as-synthesized C-BNQD and E-BNQDs (Figure S4).

3.6. Bioimaging of BNQDs in Vero and MDBK Cells

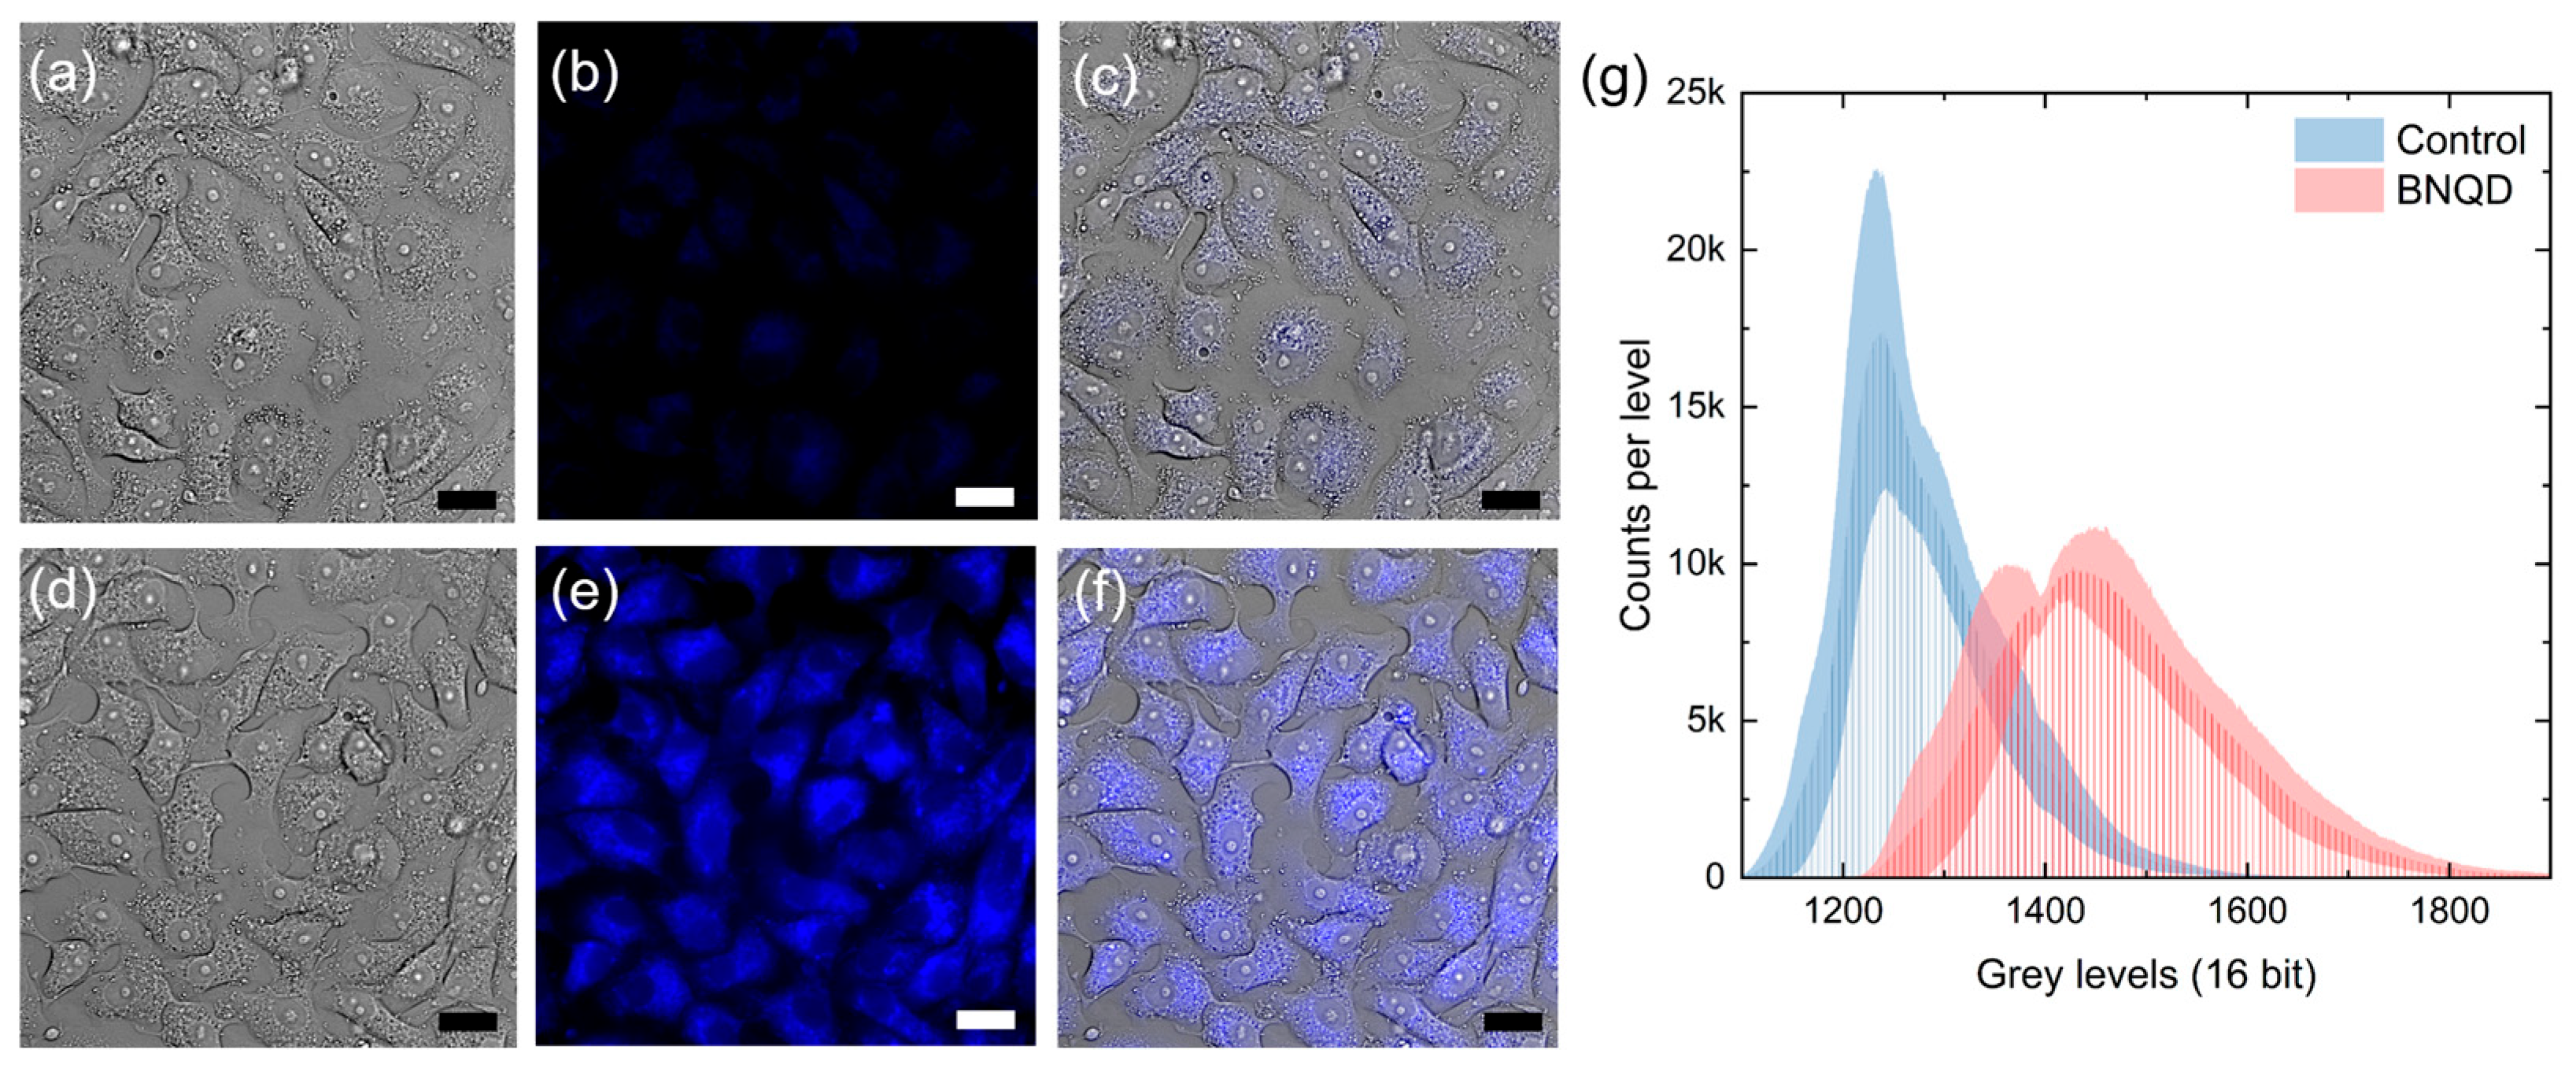
The integrity of the cellular monolayer following C-BNQD uptake, along with the fluorescence distribution of C-BNQDs in Vero and MDBK cells, is shown in Figure 7 and Figure S5. Brightfield microscopy revealed that incubation with C-BNQDs at a concentration of 1 mg/mL did not alter cell morphology, size, or monolayer density compared to the control in both investigated cell lines.
Fluorescent C-BNQDs accumulated intracellularly and were clearly detectable in the DAPI channel with high contrast only in the Vero cell line. The inherent cellular autofluorescence in this channel did not interfere with fluorescence bioimaging of C-BNQDs. The results of quantitative analysis of fluorescence images of BNQD-treated and non-treated Vero cells are represented in Figure 7g. As follows from the average intensity histograms of the control cells and cells exposed to BNQDs, the fluorescence intensity surpasses the autofluorescence of cells, indicating the possibility of bioimaging of living cells with BNQDs in DAPI channel. As expected, autofluorescence is characterized by a relatively narrow intensity distribution with lower grey level values, while BNQDs have a broader intensity distribution with higher intensities.
As follows from Figure S5, MDBK cells did not accumulate BNQDs and both BNQD treated and non-treated cells show only autofluorescence when detected in the DAPI channel. The intensity histograms (Figure S5g) prove such a conclusion, since grey level distributions in the fluorescence images of both BNQD-treated and non-treated cells overlap completely.

3.7. In Vitro Analysis of BNQD Cytotoxicity

The viability of Vero cells was determined using the MTT assay. Viability analysis was performed for C-BNQDs at concentrations ranging from 10 to 1000 µg/mL and incubation times of 6 h and 24 h. As shown in Table 6, treatment of Vero cells with C-BNQDs had no effect on cell viability. It can be concluded that concentrations up to 1.0 mg/mL are not cytotoxic and can be used successfully for bioimaging.

4. Discussion

The hydrothermal/solvothermal bottom-up synthesis of luminescent BNQDs often suffers from contamination by precursor residues, reaction by-products, and solvent impurities. In this work, we synthesize and systematically analyze the underlying reaction mechanisms in the boric acid/urea system and elucidate the role of the solvent, comparing water, ethanol, ammonia, and their mixtures, in determining the structural and optical characteristics of the synthesized BNQDs. The solvent in solvothermal BNQD synthesis is believed to control reaction mechanisms and intermediate phases, directly affecting the final product’s structure and properties. Beyond being a mere medium, solvents actively participate in chemical interactions (e.g., hydrogen bonding, coordination, solvation), influencing defect formation, edge functionalization, and overall crystallinity—key factors for tailoring BNQDs for optoelectronic and biomedical applications.
Depending on the type of solvent, four types of BNQD samples were synthesized, including C-BNQDs, E-BNQDs, H-BNQDs and N-BNQDs. During the synthesis of C- and E-BNQDs (where ethanol was employed), we observed the formation of crystalline precipitates in the cooled reaction mixture. It has not been previously reported or explained in the literature. Therefore, these precipitates were separated and analyzed aside from the BNQD samples.
In the crystalline structure of synthesized BNQDs, along with h-BN and o-BN phases the presence of polyborate salts was revealed. Comparing the diffraction patterns, it can be stated that in the C-BNQD and E-BNQD samples, where the precipitate was formed, h-BN and o-BN predominate, while in other samples without precipitate formation, crystals of polyborate salts are prevalent. Comparative analysis of C-BNQD, E-BNQDs diffractograms and their separated precipitates suggested that the precipitates may retain trace amounts of BNQDs, potentially captured during the crystallization process.
Compositional analysis revealed significant deviations from the ideal 1:1 B:N ratio in synthesized BNQDs ranging from 2.4:1 to 4.8:1 (Table 3). The deviations in the C-BNQDs and E-BNQDs are primarily attributable to intrinsic structural defects, whereas the non-stoichiometry observed in H-BNQDs and N-BNQDs is likely a consequence of extrinsic impurities formed during synthesis. The carbon incorporation in BNQDs may originate from either the solvent system (ethanol) or the urea employed as the nitrogen precursor. The high oxygen content (>60 wt.%) observed across all samples may be attributed to edge functionalization of BNQDs with –B–OH and –O–B–O– fragments, chemisorbed O2, or structurally bound water molecules. An additional contribution of O atoms could arise from ammonium polyborate polyhydrate species formed during synthesis, demonstrating that BNQDs are highly susceptible to contamination by solvent-dependent by-products. Although XRD and EDX analyses could not fully exclude the presence of residual by-products in C- and E-BNQDs, where the precipitate was physically separated, the impurity content in these samples was significantly lower than in H- and N-BNQDs. This reduction in contaminants is particularly advantageous for biomedical applications.
After evaporation of the solvents, all BNQDs were found to form stable aqueous suspensions upon dilution of the resulting powder in water. According to the DLS analysis (Table 4), the significant interaction forces between the small structural units of BNQDs in water exist, which result in aggregation of nanoparticles into assemblies. Alternatively, they may also stem from hydrogen bonding with water molecules, leading to the formation of hydration shells around BNQDs. The latter assumption resolves the apparent contradiction between the results of particle size analysis by SEM (15–45 nm) and DLS (580–770 nm), as it has already been shown in [51] that the hydrodynamic diameter of synthesized BN nanoparticles, determined by DLS, can be at least five times larger than the average particle diameter determined by TEM analysis. The stability of nanoparticle suspensions after synthesis as well as the presence of negatively charged groups on the edges of the BNQDs is also confirmed by the negative zeta potential of about −30 mV.
FTIR and Raman spectroscopy confirmed that nearly all synthesis routes successfully produced materials containing the characteristic BNQD core structure. As shown in the FTIR spectra (Figure 2b), all synthesized samples exhibit characteristic BN bond vibrations (e.g., B-N, B=N and B-N-B), though with 10–20 cm−1 peak shifts between samples that may be induced by edge oxidization of BN (electron shifted from O to N-B) or carbon incorporation. FTIR spectra reveal vibrational bands corresponding to oxygen-containing functional groups (B–OH, N–B–O, –OH) and carbon-related bonds (C–N, C–B, C=O) in all samples.
The Raman spectra of BNQDs synthesized using bottom-up methods are poorly characterized in the literature compared to BNQDs produced by top-down methods. The BNQDs synthesized in this work exhibit a downshifted (or red-shifted), broadened Raman peak position at 1350 cm−1 (Figure 2c) compared to literature data on bulk BN materials, and BN-nanomaterials produced via top-down routes. This effect has already been explained in the literature for certain types of nanoparticles through several theoretical models that account for the discretization of nanoparticle vibrations [52]. Moreover, the obtained results are aligned well with those reported in [33], where a band at 1345 cm−1 is observed in the Raman spectrum of BNQDs hydrothermally synthesized from boric acid and melamine.
The origin of luminescence in synthesized BNQDs has traditionally been attributed to the quantum confinement effect arising from the transition from bulk BN-materials to nanoscale particles. However, recent studies have demonstrated that the bandgap of BNQDs is size-independent but governed by defect states, which significantly modify the electronic structure and luminescent behavior [49,53,54].
In our work, the absorbance and PL spectra of BNQDs reveal distinct emission profiles highlighting their structure-dependent optical properties. The redshift of the absorption band from 245 nm (H-BNQDs) and 255 nm (N-BNQDs) to 267 nm (C- and E-BNQDs) likely results from the incorporation of carbon atoms into the BNQD structures, narrowing the energy band gap and shifting the absorbance toward longer wavelengths. A similar trend was observed in work [55], where passivation of BNQDs after top-down synthesis using a carbon-containing precursor (p-phenylenediamine) in ethanol led to a significant redshift in the absorbance spectra, along with a reduction in the size of the passivated BNQDs. This further confirms that quantum confinement effects do not dominate the optical properties of BNQDs. This observation, combined with the presence of the 320 nm absorption band in C- and E-BNQDs, suggests the formation of defect states induced either by oxygen- and carbon-containing functional groups or impurities that introduce mid-gap states within the electronic structure of BN.
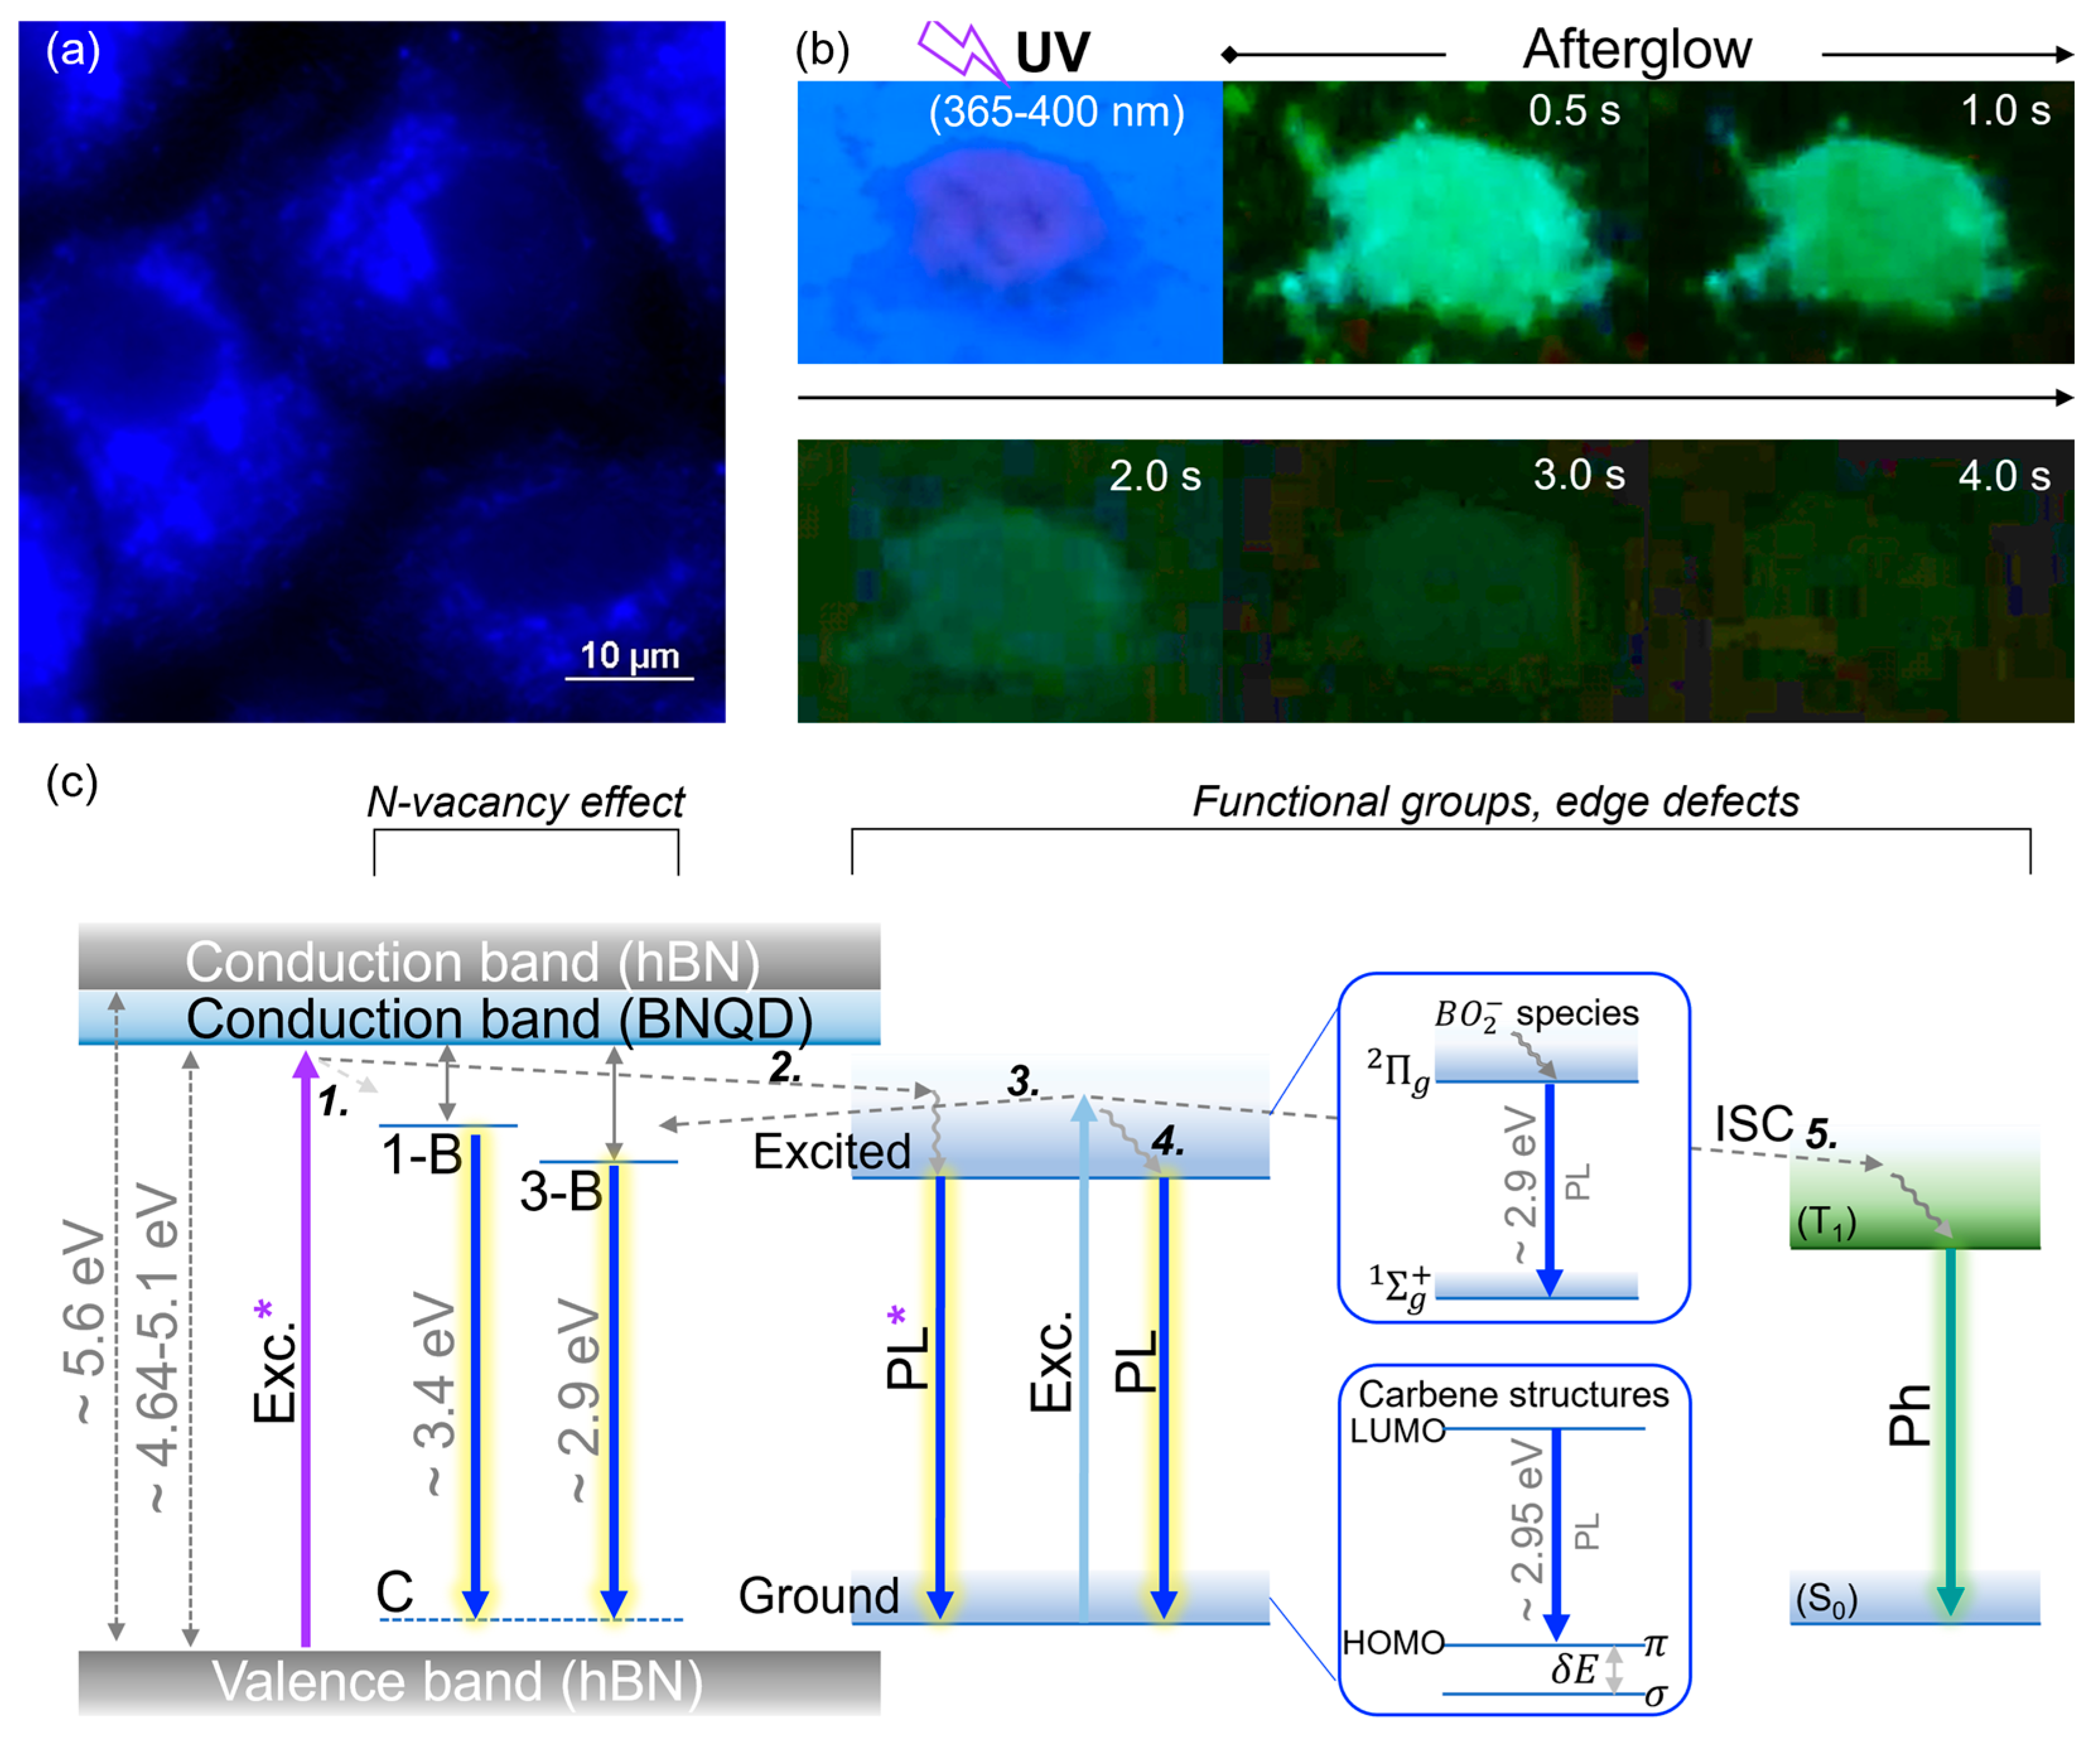
According to theoretical predictions and experimental findings, distinct functional groups and structural defects in the BN lattice contribute to characteristic optical emissions, including (i) nitrogen vacancies (1-B (~3.4 eV) and 3-B centers (~2.9 eV)/410–360 nm), which are exclusively observed only in carbon-containing samples; (ii) carbene-like zigzag edges (~2.95 eV/420 nm), and (iii) BO2 defects (~2.9–3.0 eV/420–410 nm) [6,7,56]. PL and PLE studies of C-BNQDs and E-BNQDs revealed that when excited at the absorption maximum of 267 nm, the synthesized samples exhibit a single dominant emission center at 430 nm. In contrast, H-BNQDs and N-BNQDs exhibit only a single weak emission peak at 390–410 nm, differing from the stronger and tunable emissions of C-BNQDs and E-BNQDs. The removal of precipitate from the BNQD suspensions after synthesis significantly enhances the photoluminescence properties of the resulting BNQDs.
However, deconvoluting the specific contributions of the aforementioned structural defects from the broad emission peak observed in Figure 3b remains challenging. Structural characterization of C- and E-BNQDs highlights the critical role of ethanol as a synthesis solvent, which promotes carbon incorporation into the BNQD structures. These findings suggest that carbon-related nitrogen vacancies likely serve as the dominant luminescence centers in these quantum dot systems. The discrepancy between the absorbance and PLE spectral maxima provides key evidence of the competitive interplay between radiative and non-radiative processes in BNQDs that may also arise from defect-related states, highlighting the dominant role of trap states in their emission properties (Figure 8c).
Moreover, C-BNQDs display a broad 320–380 nm excitation band (Figure 5a) accompanied by the strongest emission intensity at 430 nm across all BNQD types. These spectral characteristics align well with standard DAPI filter sets in fluorescence microscopy, which typically have an excitation pass band around 365 ± 20 nm and an emission pass band from 412 to 450 nm.
When creating nanoparticles for photonic biomedical applications, crucial aspects are reproducibility of the synthesis procedure, stability of the nanoparticle suspension and their optical characteristics. The PL spectra of synthesized C-BNQDs are nearly identical among three randomly selected batches (Figure S6), photostable (Figure S2), and extremely stable at storage (Figure S3). The luminescence properties of C-BNQDs, combined with their minimal impurity content, clearly demonstrate that this type of quantum dots emerge as the most promising candidates for bioimaging applications.
Fluorescence microscopy analysis of Vero cell monolayers incubated with C-BNQDs for 24 h confirms their excellent suitability for high-contrast bioimaging using the DAPI channel. Our results demonstrate that C-BNQDs localize primarily in cytoplasmic structures (Figure 8a), with no detectable nuclear penetration (as evidenced by the absence of fluorescence signal in cell nuclei). In [57], it was demonstrated that B/N-doped carbon quantum dots containing boronic acid edge groups (-B(OH)2) exhibit lysosome-specific targeting. These findings underscore the critical relationship between BNQD chemical structure and organelle-specific imaging capabilities.
For C-BNQDs, we also observed short-lived phosphorescence following UV irradiation under 365 nm of the powdered samples (Figure 8b). Phosphorescence in C-BNQDs may be induced by functional groups enabling n-π* transitions (e.g., -C=O, -C=N), which act as triplet-state stabilizers and suppress non-radiative decay [58]. Notably, the precipitate removed from C-BNQD suspensions demonstrates neither fluorescent nor phosphorescent signal under UV irradiation. The observation of phosphorescence in C-BNQDs, once comprehensively characterized in future studies, could significantly expand their potential for practical applications.
To engineer biocompatible BNQDs with precisely tunable fluorescent properties for biomedical applications, a comprehensive understanding of their formation mechanism is essential; otherwise, the resulting particles and their properties will be a “pig in a poke”.
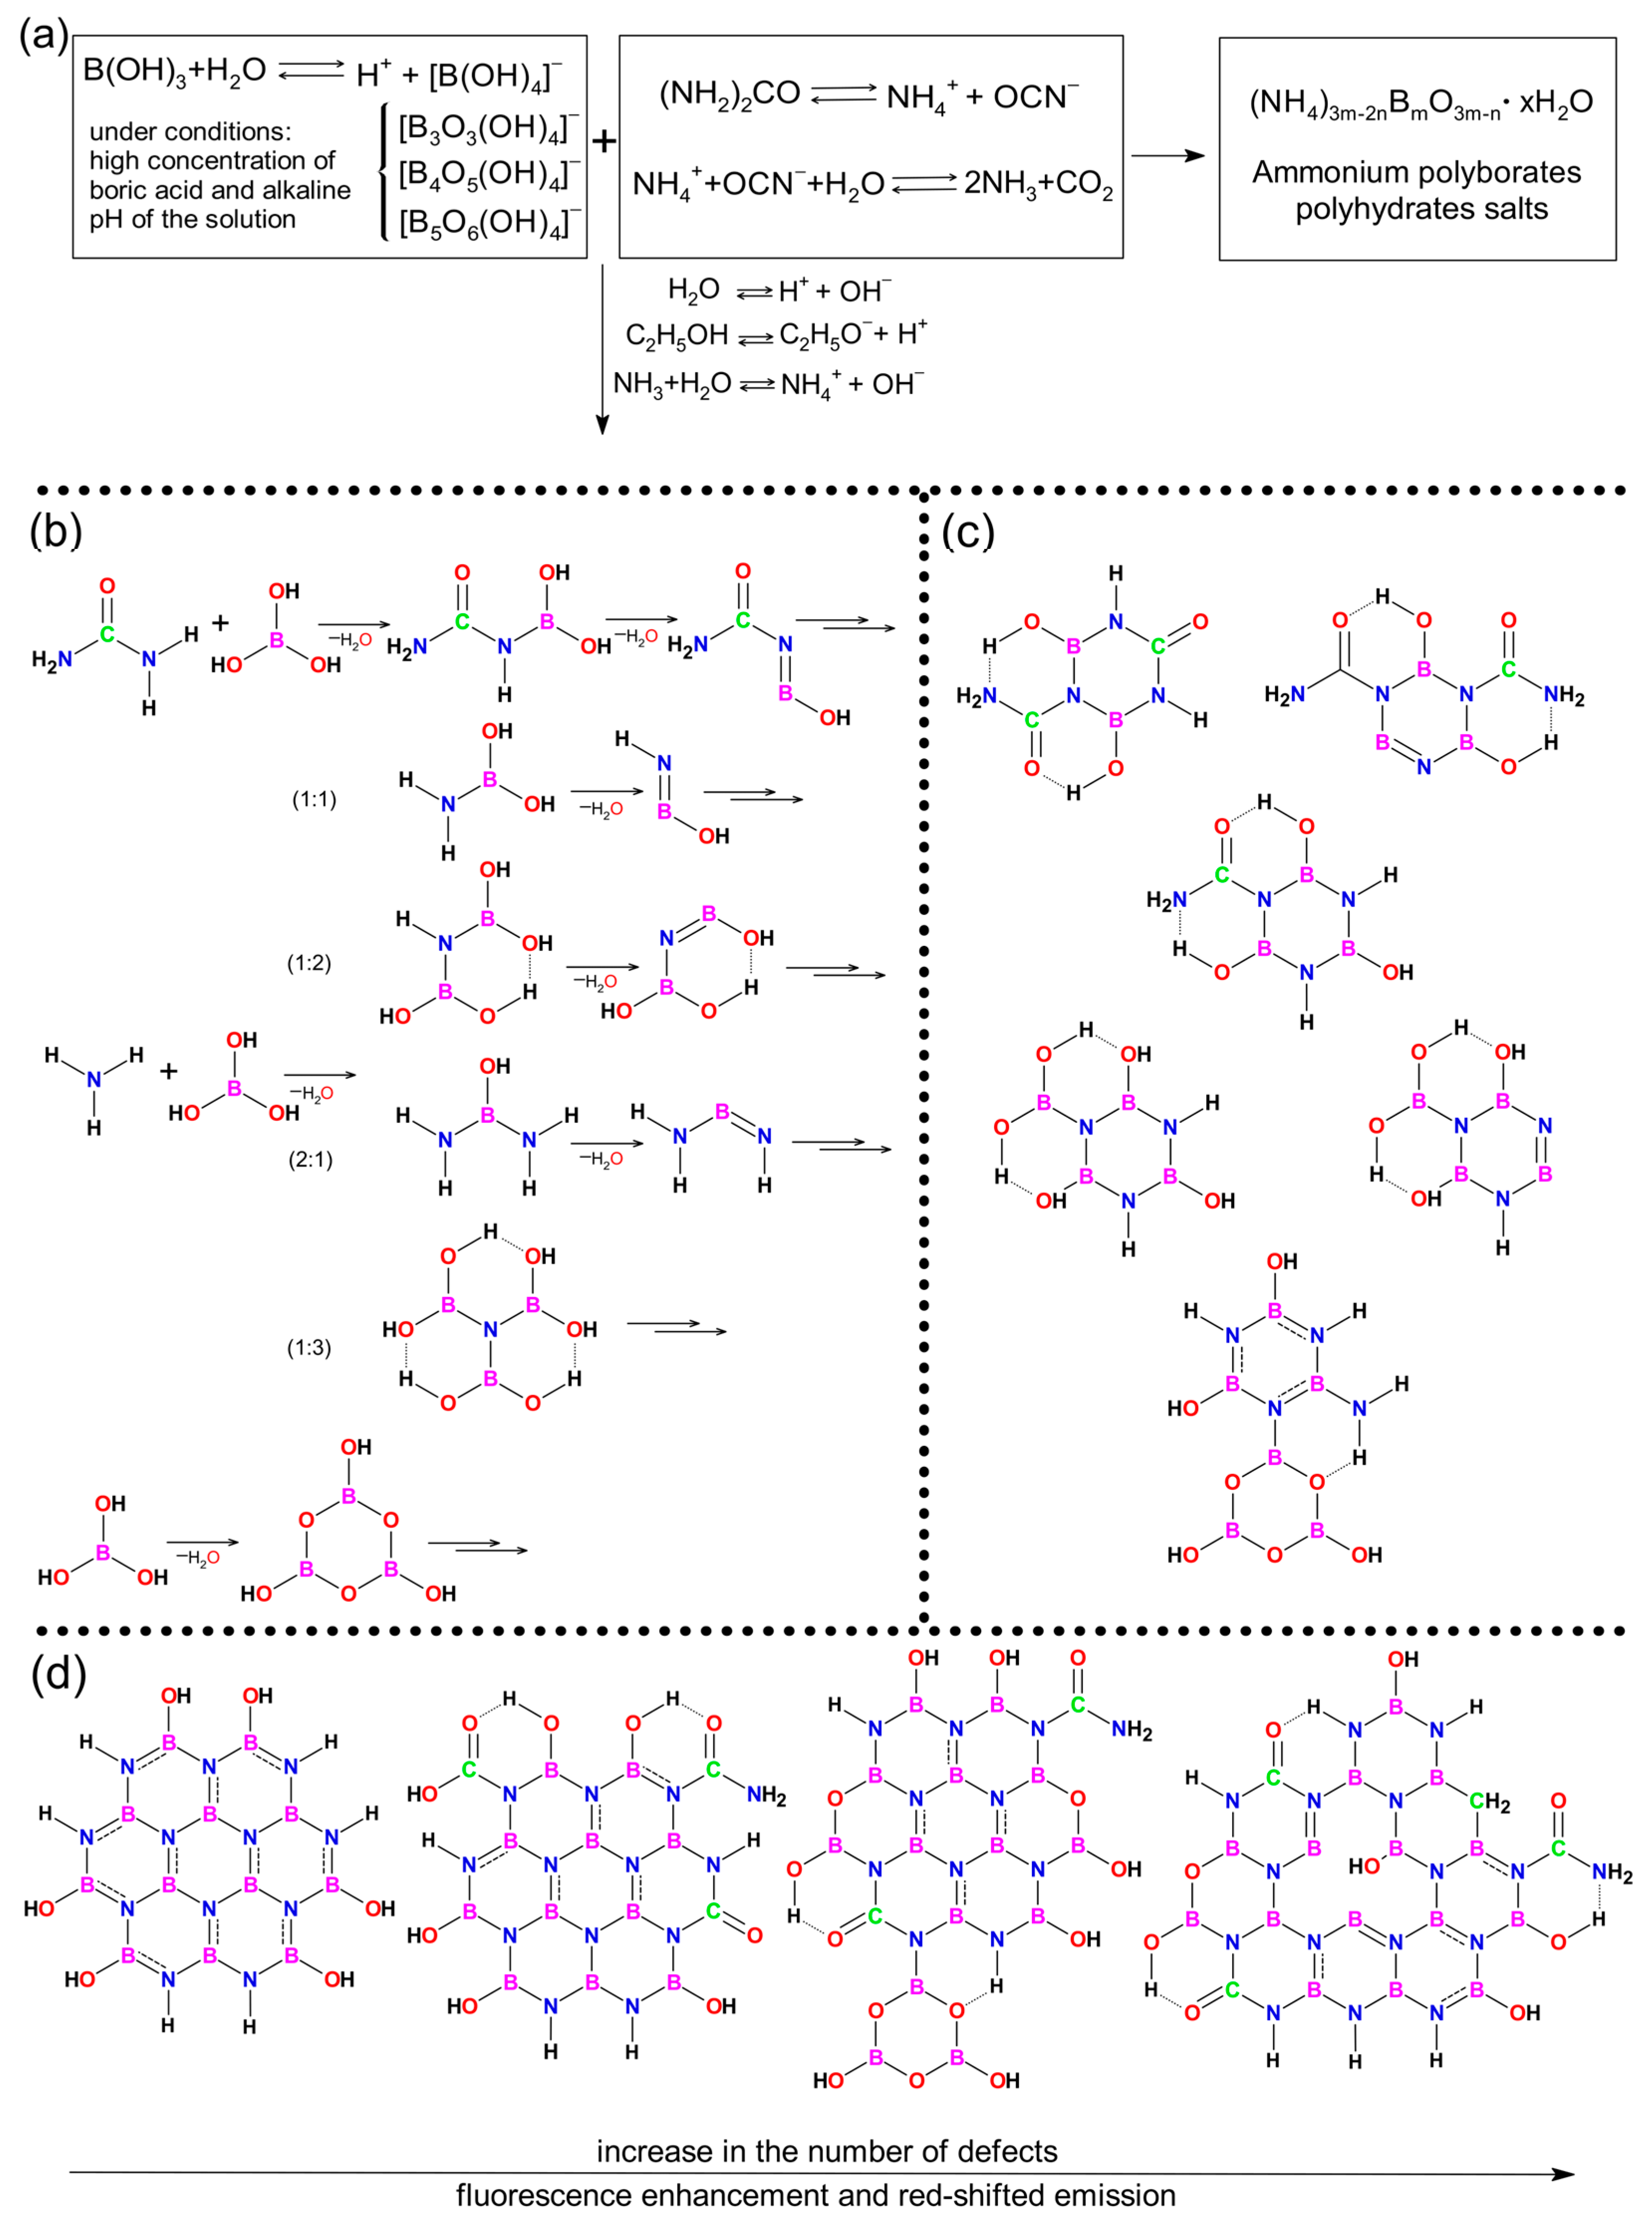
Based on the experimental findings, a primary mechanism for BNQDs formation and potential structural configurations in different solvent systems during the hydrothermal synthesis have been proposed (Figure 9). In aqueous solutions, boric acid exhibits pH and concentration-dependent speciation (Figure 9a). At low concentrations (<0.02 M), boric acid predominantly exists as its molecular form, B(OH)3, and as borate, [B(OH)4]. However, under typical BNQDs synthesis conditions employing high boric acid concentrations (0.32 M in this case) and elevated pH (6–10), the equilibrium shifts toward the formation of polyborate anions. These include triborate ([B3O3(OH)4]), tetraborate ([B4O5(OH)4]2−), and pentaborate ([B5O6(OH)4]) species [59], whose presence must be accounted for, as they may not only participate in BNQDs formation but also produce by-products (in our conditions: various species of ammonium polyborate polyhydrate). Notably, high-luminescence BNQDs (C- and E-BNQDs, which utilize ethanol in the solvent system mixture) can only be obtained after separating the precipitate from the reaction mixture.
The urea component demonstrates distinct thermal decomposition behavior in aqueous media (Figure 9a). While stable at room temperature within the pH range of 4–8, urea undergoes transformation upon heating. The decomposition pathway involves initial conversion to ammonium cyanate (NH4+OCN), which rapidly hydrolyzes to yield ammonia (NH3) and carbon dioxide (CO2) [60]. These reversible reactions exhibit strong dependence on both temperature and the concentrations of NH3/NH4+ in the system, which may be regulated by the presence of ammonium in the solvent system. The specific reactive state of urea during its reaction with boric acid modulates the incorporation efficiency of nitrogen and carbon into the growing BN structure.
The initiation reaction of formation BNQDs involves a dehydration process between boric acid and urea or ammonia in varying ratios, leading to the formation of a “starting unit”. Several variants of this reaction are proposed in Figure 9b, which align closely with the DFT-calculation reported in [23]. Boric acid and polyborate ions can also form boroxyl rings and, as a “starting unit”, integrate into the structure of BNQDs [11]. This integration induces disorganization within the expected hexagonal BN core of the nanomaterials.
Various “starting unit” options can lead to the formation of diverse “starting blocks,” composed of individual hexagonal rings (Figure 9c). Through various combinations of dehydration reactions between “starting unit”, hexagonal rings composed of B and N atoms with sp2 and sp3 bonding configurations can be obtained. According to the proposed reaction scheme, B and N atoms may associate with amide, hydroxyl, and boroxyl groups. The formation of hydrogen bonds facilitates the creation of additional cycles, thereby enhancing the stability of such a starting block. From the provided formulas of the starting blocks, it becomes evident that the incorporation of C and O atoms into the final BNQD structure is inevitable and is modulated by the solvent system employed during synthesis.
The solvents not only serve as the reaction medium during BNQD synthesis but actively participate in chemical transformations through hydrogen bonding, pH buffering, and stabilization of intermediate species.
While most studies employ water as the solvent, we suggest that ethanol serves a dual role as both solvent and carbon source. The presence of ethanol enables carbon doping within the BN lattice, creating hybrid sp2/sp3 domains in structure. Partial ethanol decomposition leads to ethoxy group (-OC2H5) attachment to surface boron and nitrogen atoms modifying the surface chemistry [61]. This process may also generate nitrogen vacancies, enabling tunable fluorescence properties in BNQDs. These modifications also improve the hydrophilicity and colloidal stability of the resulting ethanol-derived BNQDs (E-BNQDs).
When ammonia is used as the solvent in the synthesis of C-BNQDs and N-BNQDs, the additional presence of NH4+ ions in the reaction mixture appears to shift the reaction equilibrium toward urea composition, making urea molecules more likely to participate in the dehydration reaction with boric acid. This leads to the incorporation of amide (-CONH2) and carboxylic (-COOH) groups at the edges of nanoparticles, as well as the possible formation of carbonyl (-C=O) groups within the structure, which can additionally enhance the fluorescence properties of BNQDs [62].
The formation of BNQDs proceeds through variable arrangements of hexagonal “starting blocks,” yielding unpredictable final structures that incorporate diverse B-N cores and defects, along with edge functional groups (Figure 9d). An idealized BNQD structure is likely to form only in trace amounts, with the dominant products being functionalized, defect-rich nanostructures. The experimental results from this study demonstrate that hydrothermal synthesis of BNQDs using boric acid and urea yields diverse O- and C-doped BNQDs, alongside significant polyborate salt impurities.

5. Conclusions

The actual composition of BNQDs obtained by hydrothermal synthesis differs significantly from pure BN structures and is characterized by considerable heterogeneity and variations in physicochemical and optical properties. In the current study, we demonstrate the crucial importance of the composition of the solvents used in the synthesis of BNQDs in achieving the highest PL efficiency and shifting the emission range to the visible region. Based on experimental results, we determined the mechanisms of nanoparticle formation depending on the solvent mixture with the complete growth pathway of “starting units” combined into “starting blocks” and their assembly into the resulting BNQDs with different structures. We have also shown the formation of ammonium polyborate-polyhydrate salts, which lack PL and phosphorescence. The latter probably explains why these by-products have been completely overlooked in most research. We show that BNQDs synthesized from H3BO3 and (NH2)2CO in a reaction medium of “distilled water; 10% liquid ammonia: ethanol” at a volume ratio of 2:2:1 enable the synthesis of BNQDs that are highly luminescent in the blue spectral region corresponding to the DAPI channel, which is traditionally used in fluorescence microscopy and flow cytometry for bioimaging. The purification of BNQDs from polyborate salts is simplified in this synthesis procedure, as they precipitate and can be easily separated from the BNQD-containing liquid phase. The spectral tuning of the PL properties is achieved by the incorporation of carbon into the BNQD structures, which is promoted by the presence of ethanol, resulting in the carbon-related nitrogen vacancies likely serving as dominant luminescence centers. The additional presence of NH4+ ions in the reaction mixture appears to shift the reaction equilibrium such that the incorporation of amide (-CONH2) and carboxylic (-COOH) groups at the edges of the BNQDs as well as the possible formation of carbonyl groups (-C=O) within the structure occur. Enrichment of the BNQD structures with O-containing groups imparts additional phosphorescence to the nanoparticles, which can also be used for bioimaging. The developed recipe for the one-pot synthesis of high-purity BNQDs with tunable fluorescence and phosphorescence properties enables a simple and reliable approach for the development of nanoparticles that meet stringent requirements for quality, optical properties and cytotoxicity of nanoparticles for biomedical applications.

Supplementary Materials

The following supporting information can be downloaded at: https://www.mdpi.com/article/10.3390/physchem5040046/s1, Figure S1: SEM images of (a) C-BNQDs, (b) H-BNQDs, (c) E-BNQDs, (d) N-BNQDs. Scale bar 30 nm. Orange circles in-dicate aggregated structures from 15 nm to 45 nm; Figure S2: Photobleaching of BNQDs: (a) dependence of the PL intensity of BNQDs on time at constant irradiation, (b) the PL spectra of BNQDs before (line) and after (dot) irradiation of BNQDs for 30 minutes. The symbol ☀ marks the spectra of BNQDs irradiated at λex = 320 nm for 30 minutes. Emission was detected at λem = 390 nm. The measure-ments were performed on the BNQDs, which were stored in the dark for one year; Figure S3: Long-term stability of the synthesized BNQDs: (a) UV-vis absorption spectra, (b) PL spectra of BNQDs ex-cited at λex = 240 nm, (c) excited at λex = 267 nm and (d) excited at λex = 320 nm. The BNQDs were stored in solutions in the dark for approximately one year; Figure S4: PL spectra of water suspensions of C-BNQDs and E-BNQDs, and precipitates. The excitation was performed with λex = 320 nm. The ODs (λ = 267 nm) of the solutions were adjusted to 0.1 for each sample; Figure S5: Brightfield images, fluorescence microscopy and their merge of (a), (b), (c) BNQD-treated cells and (d), (e), (f) not BNQD-treated cells, respectively. Scale bar 20 μm. The excitation wavelength is 365 nm (DAPI). (g) Average histo-grams of the intensities of BNQD-treated cells and not BNQD-treated cells. Filled areas represent standard deviations of the data; Figure S6: The PL spectra of C-BNQDs from three randomly selected batches. Excitation was at 320 nm; emission was measured at 400 nm. References [63,64,65,66,67,68] are cited in the Supplementary Materials.

Author Contributions

Conceptualization, A.B., L.G. and T.K.; methodology, A.B., L.G., N.V. and T.K.; formal analysis, A.B., Y.P. and L.G.; investigation, A.B., L.G., Y.P. and N.V.; data curation, A.B., L.G. and T.K.; visualization, A.B., Y.P. and L.G.; writing—original draft preparation, A.B.; writing—review and editing, L.G. and T.K.; supervision, T.K. All authors have read and agreed to the published version of the manuscript.

Funding

This research was funded by the Belarusian Republican Foundation for Fundamental Research (BRFFR), grant number X24MП-006.

Data Availability Statement

The original contributions presented in this study are included in the article/Supplementary Materials. Further inquiries can be directed to the corresponding author(s).

Acknowledgments

We thank Sergei Koran and Tatsiana Fomina (the Republican Center for Hygiene, Epidemiology, and Public Health, Research Institute of Hygiene, Toxicology, Epidemiology, Virology, and Microbiology, Minsk, Belarus) for providing Vero cells.

Conflicts of Interest

The authors declare no conflicts of interest.

References

  1. Weng, Q.; Wang, X.; Wang, X.; Bando, Y.; Golberg, D. Functionalized hexagonal boron nitride nanomaterials: Emerging properties and applications. Chem. Soc. Rev. 2016, 45, 3989–4012. [Google Scholar] [CrossRef] [PubMed]
  2. Jiang, X.; Weng, Q.; Wang, X.; Li, X.; Zhang, J.; Golberg, D.; Bando, Y. Recent Progress on Fabrications and Applications of Boron Nitride Nanomaterials: A Review. J. Mater. Sci. Technol. 2015, 31, 589–598. [Google Scholar] [CrossRef]
  3. Ba, K.; Jiang, W.; Cheng, J.; Bao, J.; Xuan, N.; Sun, Y.; Liu, B.; Xie, A.; Wu, S.; Sun, Z. Chemical and Bandgap Engineering in Monolayer Hexagonal Boron Nitride. Sci. Rep. 2017, 7, 45584. [Google Scholar] [CrossRef] [PubMed]
  4. Ren, J.; Stagi, L.; Carbonaro, C.; Malfatti, L.; Casula, M.; Ricci, P.; Del Rio Castillo, A.; Bonaccorso, F.; Calvillo, L.; Granozzi, G.; et al. Defect-assisted photoluminescence in hexagonal boron nitride nanosheets. 2D Mater. 2020, 7, ababf0. [Google Scholar] [CrossRef]
  5. Berzina, B.; Korsaks, V.; Trinkler, L.; Sarakovskis, A.; Grube, J.; Bellucci, S. Defect-induced blue luminescence of hexagonal boron nitride. Diam. Relat. Mater. 2016, 68, 131–137. [Google Scholar] [CrossRef]
  6. Lin, L.; Xu, Y.; Zhang, S.; Ross, I.; Ong, A.; Allwood, D. Fabrication and luminescence of monolayered boron nitride quantum dots. Small 2014, 10, 60–65. [Google Scholar] [CrossRef]
  7. Tang, C.; Bando, Y.; Zhi, C.; Golberg, D. Boron-oxygen luminescence centres in boron-nitrogen systems. Chem. Commun. 2007, 44, 4599–4601. [Google Scholar] [CrossRef]
  8. Li, H.; Tay, R.; Tsang, S.; Zhen, X.; Teo, E. Controllable Synthesis of Highly Luminescent Boron Nitride Quantum Dots. Small 2015, 11, 6491–6499. [Google Scholar] [CrossRef] [PubMed]
  9. Rawat, J.; Sajwan, D.; Garimella, S.; Sharma, H.; Dwivedi, C. Boron Nitride quantum dots: A rising star in sensing applications. Nano Trends 2023, 2, 100008. [Google Scholar] [CrossRef]
  10. Chen, P.; Yang, S.; Liu, F.; Jiang, Y.; Wang, Y.; Huang, Y.; Hu, J.; Chen, L. Blue-Emitting Orthorhombic Boron Nitride Quantum Dots and Quantum-Dot Light-Emitting Diodes. Adv. Photon. Res. 2023, 4, 202200344. [Google Scholar] [CrossRef]
  11. Ren, J.; Malfatti, L.; Enzo, S.; Carbonaro, C.; Calvillo, L.; Granozzi, G.; Innocenzi, P. Boron oxynitride two-colour fluorescent dots and their incorporation in a hybrid organic-inorganic film. J. Colloid Interface Sci. 2020, 560, 398–406. [Google Scholar] [CrossRef] [PubMed]
  12. Ren, J.; Stagi, L.; Malfatti, L.; Carbonaro, C.; Granozzi, G.; Calvillo, L.; Garroni, S.; Enzo, S.; Innocenzi, P. Engineering UV-emitting defects in h-BN nanodots by a top-down route. Appl. Surf. Sci. 2021, 567, 150727. [Google Scholar] [CrossRef]
  13. Jung, J.; Kotal, M.; Jang, M.; Lee, J.; Cho, Y.; Kim, W.; Oh, I. Defect engineering route to boron nitride quantum dots and edge-hydroxylated functionalization for bio-imaging. RSC Adv. 2016, 6, 73939–73946. [Google Scholar] [CrossRef]
  14. Umrao, S.; Maurya, A.; Shukla, V.; Grigoriev, A.; Ahuja, R.; Vinayak, M.; Srivastava, R.; Saxena, P.; Oh, I.; Srivastava, A. Anticarcinogenic activity of blue fluorescent hexagonal boron nitride quantum dots: As an effective enhancer for DNA cleavage activity of anticancer drug doxorubicin. Mater. Today Bio 2019, 1, 100001. [Google Scholar] [CrossRef]
  15. Shtansky, D.; Firestein, K.; Golberg, D. Fabrication and application of BN nanoparticles, nanosheets and their nanohybrids. Nanoscale 2018, 10, 17477–17493. [Google Scholar] [CrossRef]
  16. Stagi, L.; Ren, J.; Innocenzi, P. From 2-D to 0-D Boron Nitride Materials, The Next Challenge. Materials 2019, 12, 3905. [Google Scholar] [CrossRef]
  17. Zhang, X.; An, L.; Bai, C.; Chen, L.; Yu, Y. Hexagonal boron nitride quantum dots: Properties, preparation and applications. Mater. Today Chem. 2021, 20, 100425. [Google Scholar] [CrossRef]
  18. Acharya, A.; Sharma, S.; Liu, X.; Zhang, D.; Yap, Y. A Review on van der Waals Boron Nitride Quantum Dots. C 2021, 7, 35. [Google Scholar] [CrossRef]
  19. Ren, J.; Stagi, L.; Innocenzi, P. Hydroxylated boron nitride materials: From structures to functional applications. J. Mater. Sci. 2021, 56, 4053–4079. [Google Scholar] [CrossRef]
  20. Zheng, Z.; Cox, M.; Li, B. Surface modification of hexagonal boron nitride nanomaterials: A review. J. Mater. Sci. 2018, 53, 66–99. [Google Scholar] [CrossRef]
  21. Kainthola, A.; Bijalwan, K.; Negi, S.; Sharma, H.; Dwivedi, C. Hydrothermal synthesis of highly stable boron nitride nanoparticles. Mater. Today Proc. 2020, 28, 138–140. [Google Scholar] [CrossRef]
  22. Demazeau, G. Solvothermal Processes: Definition, Key Factors Governing the Involved Chemical Reactions. Z. Naturforsch. 2010, 65b, 999–1006. [Google Scholar] [CrossRef]
  23. Liu, B.; Yan, S.; Song, Z.; Liu, M.; Ji, X.; Yang, W.; Liu, J. One-Step Synthesis of Boron Nitride Quantum Dots: Simple Chemistry Meets Delicate Nanotechnology. Chem. Eur. J. 2016, 22, 18899–18907. [Google Scholar] [CrossRef] [PubMed]
  24. Wibowo, A.; Jahir Khan, M.; Sansanaphongpricha, K.; Khemthong, P.; Laosiripojana, N.; Yu, Y.; Wu, K.; Sakdaronnarong, C. Carbon Dots in Photodynamic Therapy: The Role of Dopant and Solvent on Optical and Photo-Responsive Properties. Chem. Eur. J. 2024, 30, e202400885. [Google Scholar] [CrossRef] [PubMed]
  25. Paul Choudhury, S.; Feng, Z.; Gao, C.; Ma, X.; Zhan, J.; Jia, F. BN quantum dots decorated ZnO nanoplates sensor for enhanced detection of BTEX gases. J. Alloys Compd. 2020, 815, 152376. [Google Scholar] [CrossRef]
  26. Qin, D.; Jiang, X.; Mo, G.; Feng, J.; Deng, B. Boron nitride quantum dots as electrochemiluminescence coreactants of rGO@Au@Ru–SiO2 for label-free detection of AFP in human serum. Electrochim. Acta 2020, 335, 135621. [Google Scholar] [CrossRef]
  27. Xing, H.; Zhai, Q.; Zhang, X.; Li, J.; Wang, E. Boron Nitride Quantum Dots as Efficient Coreactant for Enhanced Electrochemiluminescence of Ruthenium(II) Tris(2,2′-bipyridyl). Anal. Chem. 2018, 90, 2141–2147. [Google Scholar] [CrossRef]
  28. Li, M.; Wang, C.; Chen, L.; Liu, D. A novel electrochemiluminescence sensor based on resonance energy transfer system between nitrogen doped graphene quantum dots and boron nitride quantum dots for sensitive detection of folic acid. Anal. Chim. Acta 2019, 1090, 57–63. [Google Scholar] [CrossRef]
  29. Peng, C.; Xing, H.; Fan, X.; Xue, Y.; Li, J.; Wang, E. Glutathione Regulated Inner Filter Effect of MnO2 Nanosheets on Boron Nitride Quantum Dots for Sensitive Assay. Anal. Chem. 2019, 91, 5762–5767. [Google Scholar] [CrossRef]
  30. Yao, Q.; Feng, Y.; Rong, M.; He, S.; Chen, X. Determination of nickel(II) via quenching of the fluorescence of boron nitride quantum dots. Microchim. Acta 2017, 184, 4217–4223. [Google Scholar] [CrossRef]
  31. Chen, Y.; Xu, X.; Li, C.; Bendavid, A.; Westerhausen, M.; Bradac, C.; Toth, M.; Aharonovich, I.; Tran, T. Bottom-Up Synthesis of Hexagonal Boron Nitride Nanoparticles with Intensity-Stabilized Quantum Emitters. Small 2021, 17, e2008062. [Google Scholar] [CrossRef]
  32. Huo, B.; Liu, B.; Chen, T.; Cui, L.; Xu, G.; Liu, M.; Liu, J. One-step synthesis of fluorescent boron nitride quantum dots via a hydrothermal strategy using melamine as nitrogen source for the detection of ferric ions. Langmuir 2017, 33, 10673–10678. [Google Scholar] [CrossRef]
  33. Liu, D.; Song, J.; Chung, J.; Hur, S.; Choi, W. ZnO/Boron Nitride Quantum Dots Nanocomposites for the Enhanced Photocatalytic Degradation of Methylene Blue and Methyl Orange. Molecules 2022, 27, 6833. [Google Scholar] [CrossRef]
  34. Liu, Y.; Chen, X.; Wang, M.; Ma, Q. A visual electrochemiluminescence resonance energy transfer/surface plasmon coupled electrochemiluminescence nanosensor for Shiga toxin-producing: Escherichia coli detection. Green Chem. 2018, 20, 5520–5527. [Google Scholar] [CrossRef]
  35. Mohanta, M.; Sahu, T.; Gogoi, D.; Peela, N.; Qureshi, M. Hexagonal Boron Nitride Quantum Dots as a Superior Hole Extractor for Efficient Charge Separation in WO3-Based Photoelectrochemical Water Oxidation. ACS Appl. Energy Mater. 2019, 2, 7457–7466. [Google Scholar] [CrossRef]
  36. Sahu, T.; Mohanta, M.; Qureshi, M. Modulating water oxidation kinetics utilizing h-BN quantum dots as an efficient hole extractor on fluorine doped hematite photoanode. J. Power Sources 2020, 445, 227341. [Google Scholar] [CrossRef]
  37. Jerome, R.; Sundramoorthy, A. Hydrothermal Synthesis of Boron Nitride Quantum Dots/Poly(Luminol) Nanocomposite for Selective Detection of Ascorbic Acid. J. Electrochem. Soc. 2019, 166, B3017–B3024. [Google Scholar] [CrossRef]
  38. Bhasi, A.P.; Wilson, N.H.; Palanisamy, T. Nanosized Hexagonal Boron Nitride and Polyethylene Glycol-Filled Leathers for Applications Demanding High Thermal Insulation and Impact Resistance. ACS Omega 2022, 7, 45120–45128. [Google Scholar] [CrossRef]
  39. Yang, K.; Jia, P.; Hou, J.; Bu, T.; Sun, X.; Liu, Y.; Wang, L. Innovative dual-emitting ratiometric fluorescence sensor for tetracyclines detection based on boron nitride quantum dots and europium ions. ACS Sustain. Chem. Eng. 2020, 8, 17185–17193. [Google Scholar] [CrossRef]
  40. Budak, E.; Unlu, C. Effect of Nitrogen Precursor on Optical Properties of Hexagonal Boron Nitride Quantum Dots. J. Turk. Chem. Soc. Sect. A Chem. 2021, 8, 969–976. [Google Scholar] [CrossRef]
  41. Kong, Y.; He, Y.; Zhou, J.; Zhong, S.; Song, G. Amino Acids as the Nitrogen Source to Synthesize Boron Nitride Quantum Dots for Fluorescence Turn-off-on Detection of Ascorbic Acid. ChemistrySelect 2020, 5, 3828–3834. [Google Scholar] [CrossRef]
  42. Song, Y.; Wang, J.; Chen, L.; Yang, P. Ammonium pentaborate crystals with adjustable and bright phosphorescence and long lifetime. J. Lumin. 2020, 225, 117325. [Google Scholar] [CrossRef]
  43. Liu, M.; Xu, Y.; Wang, Y.; Chen, X.; Ji, X.; Niu, F.; Song, Z.; Liu, J. Boron Nitride Quantum Dots with Solvent-Regulated Blue/Green Photoluminescence and Electrochemiluminescent Behavior for Versatile Applications. Adv. Opt. Mater. 2017, 3, 1600661. [Google Scholar] [CrossRef]
  44. Men, J.; Li, B.; Li, J.; Li, G.; Chen, J.; Hou, X. Amorphous liquid phase induced synthesis of boron nitride nanospheres for improving sintering property of h-BN/ZrO2 composites. Ceram. Int. 2020, 46, 8031–8038. [Google Scholar] [CrossRef]
  45. Wakasugi, T.; Tsukihashi, F.; Sano, N. Thermodynamics of Nitrogen in B2O3, B2O3-SiO2, and B2O3-CaO Systems. J. Am. Ceram. Soc. 1991, 7, 1650–1653. [Google Scholar] [CrossRef]
  46. Andrews, L.; Burkholder, T. Infrared spectra of molecular B(OH)3 and HOBO in solid argon. J. Chem. Phys. 1992, 97, 7203–7210. [Google Scholar] [CrossRef]
  47. Medeiros, S.; Azevedo, S. Electronic and optical properties of quantum emitters in h-BN. Appl. Phys. A Mater. 2023, 129, 659. [Google Scholar] [CrossRef]
  48. Watanabe, K.; Taniguchi, T.; Kanda, H. Direct-bandgap properties and evidence for ultraviolet lasing of hexagonal boron nitride single crystal. Nat. Mater. 2004, 3, 404–409. [Google Scholar] [CrossRef] [PubMed]
  49. Sarath Kumar, C.; Reji, R.; Sivalingam, Y.; Kawazoe, Y.; Surya, V. Carbon and boron nitride quantum dots as optical sensor probes for selective detection of toxic metals in drinking water: A quantum chemical prediction through structure- and morphology-dependent electronic and optical properties. RSC Adv. 2024, 14, 28182–28200. [Google Scholar] [CrossRef]
  50. Weng, Q.; Kvashnin, D.; Wang, X.; Cretu, O.; Yang, Y.; Zhou, M.; Zhang, C.; Tang, D.; Sorokin, P.; Bando, Y.; et al. Tuning of the Optical, Electronic, and Magnetic Properties of Boron Nitride Nanosheets with Oxygen Doping and Functionalization. Adv. Mater. 2017, 29, 1700695. [Google Scholar] [CrossRef]
  51. Li, H.; Qiao, W.; Shen, Y.; Xu, H.; Fan, Y.; Liu, Y.; Lan, Y.; Gong, Y.; Chen, F.; Feng, S. Biomimetic Boron Nitride Nanoparticles for Targeted Drug Delivery and Enhanced Antitumor Activity. Pharmaceutics 2023, 15, 1269. [Google Scholar] [CrossRef]
  52. Meilakhs, A.; Koniakhin, S. New explanation of Raman peak redshift in nanoparticles. Superlattices Microst. 2017, 110, 319–323. [Google Scholar] [CrossRef]
  53. Dubey, R.; Cowles, M.; Salimi, Z.; Liu, X.; Oakley, R.; Yapici, N.; Uddin, J.; Zhang, D.; Yap, Y. Boron nitride nanosheets, quantum dots, and dots: Synthesis, properties, and biomedical applications. APL Mater. 2025, 13, 040601. [Google Scholar] [CrossRef]
  54. Guerra, T.; Araujo, L.; Azevedo, S. Magnetic and electronic properties of diamond-shaped graphene-boron nitride nanoribbons and nanoflakes. J. Phys. Chem. Solids 2019, 135, 109085. [Google Scholar] [CrossRef]
  55. Ding, Y.; He, P.; Li, S.; Chang, B.; Zhang, S.; Wang, Z.; Chen, J.; Yu, J.; Wu, S.; Zeng, H.; et al. Efficient Full-Color Boron Nitride Quantum Dots for Thermostable Flexible Displays. ACS Nano 2021, 15, 14610–14617. [Google Scholar] [CrossRef] [PubMed]
  56. Weston, L.; Wickramaratne, D.; Mackoit, M.; Alkauskas, A.; Van De Walle, C. Native point defects and impurities in hexagonal boron nitride. Phys. Rev. B 2018, 97, 214104. [Google Scholar] [CrossRef]
  57. Wang, C.; Long, Y.; Deng, Y.; Han, Y.; Tishkevich, D.; Ha, M.; Weng, Q. Hexagonal boron nitride nanomaterials for biomedical applications. BMEMat 2024, 2, 12068. [Google Scholar] [CrossRef]
  58. Han, B.; Lei, X.; Li, D.; Liu, Q.; Chen, Y.; Wang, J.; He, G. Shallow Traps in Carbon Nitride Quantum Dots to Achieve 6.47 s Ultralong Lifetime and Wavelength-Tunable Room Temperature Phosphorescence. Adv. Opt. Mater. 2023, 11, 2202293. [Google Scholar] [CrossRef]
  59. Kochkodan, V.; Darwish, N.; Hilal, N. The Chemistry of Boron in Water. In Boron Separation Processes, 1st ed.; Kabay, N., Bryjak, M., Hilal, N., Eds.; Elsevier: Amsterdam, The Netherlands, 2015; pp. 35–63. [Google Scholar]
  60. Panyachariwat, N.; Steckel, H. Stability of urea in solution and pharmaceutical preparations. J. Cosmet. Sci. 2014, 65, 187–195. [Google Scholar] [PubMed]
  61. Kim, D.; Nakajima, S.; Sawada, T.; Iwasaki, M.; Kawauchi, S.; Zhi, C.; Bando, Y.; Golberg, D.; Serizawa, T. Sonication-assisted alcoholysis of boron nitride nanotubes for their sidewalls chemical peeling. Chem. Commun. 2015, 51, 7104–7107. [Google Scholar] [CrossRef] [PubMed]
  62. Padrez, Y.; Golubewa, L.; Bahdanava, A.; Jankunec, M.; Matulaitiene, I.; Semenov, D.; Karpicz, R.; Kulahava, T.; Svirko, Y.; Kuzhir, P. Nanodiamond surface as a photoluminescent pH sensor. Nanotechnology 2023, 34, 195702. [Google Scholar] [CrossRef] [PubMed]
  63. Stilbene 420 (27344-41-8, Exciton) Datasheet. Available online: https://exciton.luxottica.com/laser-dyes.html (accessed on 10 October 2025).
  64. Zapka, W.; Brackmann, U. Shorter Dye Laser Wavelengths from Substituted p-Terphenyls. Appl. Phys. 1979, 20, 283–286. [Google Scholar] [CrossRef]
  65. Brackmann, U. Lambdachrome® Laser Dyes, 3rd ed.; Lambda Physik AG: Göttingen, Germany, 2000; Available online: https://www.chemphys.lu.se/fileadmin/chemphys/General/Lamdachrome-laser-dyes.pdf (accessed on 26 August 2025).
  66. Peng, D.; Zhang, L.; Li, F.-F.; Cui, W.-R.; Liang, R.-P.; Qiu, J.-D. Facile and Green Approach to the Synthesis of Boron Nitride Quantum Dots for 2,4,6-trinitrophenol Sensing. ACS Appl. Mater. Interfaces 2018, 10, 7315–7323. [Google Scholar] [CrossRef]
  67. Angizi, S.; Hatamie, A.; Ghanbari, H.; Simchi, A.A. Mechanochemical Green Synthesis of Exfoliated Edge –Functionalized Boron Nitride Quantum Dots: Application to Vitamin C Sensing through Hybridization with Gold Electrodes. Appl. Mater. Interfaces 2018, 10, 28819–28827. [Google Scholar] [CrossRef] [PubMed]
  68. Lei, Z.; Xu, S.; Wan, J.; Wu, P. Facile Preparation and Multifunctional Applications of Boron Nitride Quantum Dots. Nanoscale 2015, 7, 18902–18907. [Google Scholar] [CrossRef] [PubMed]
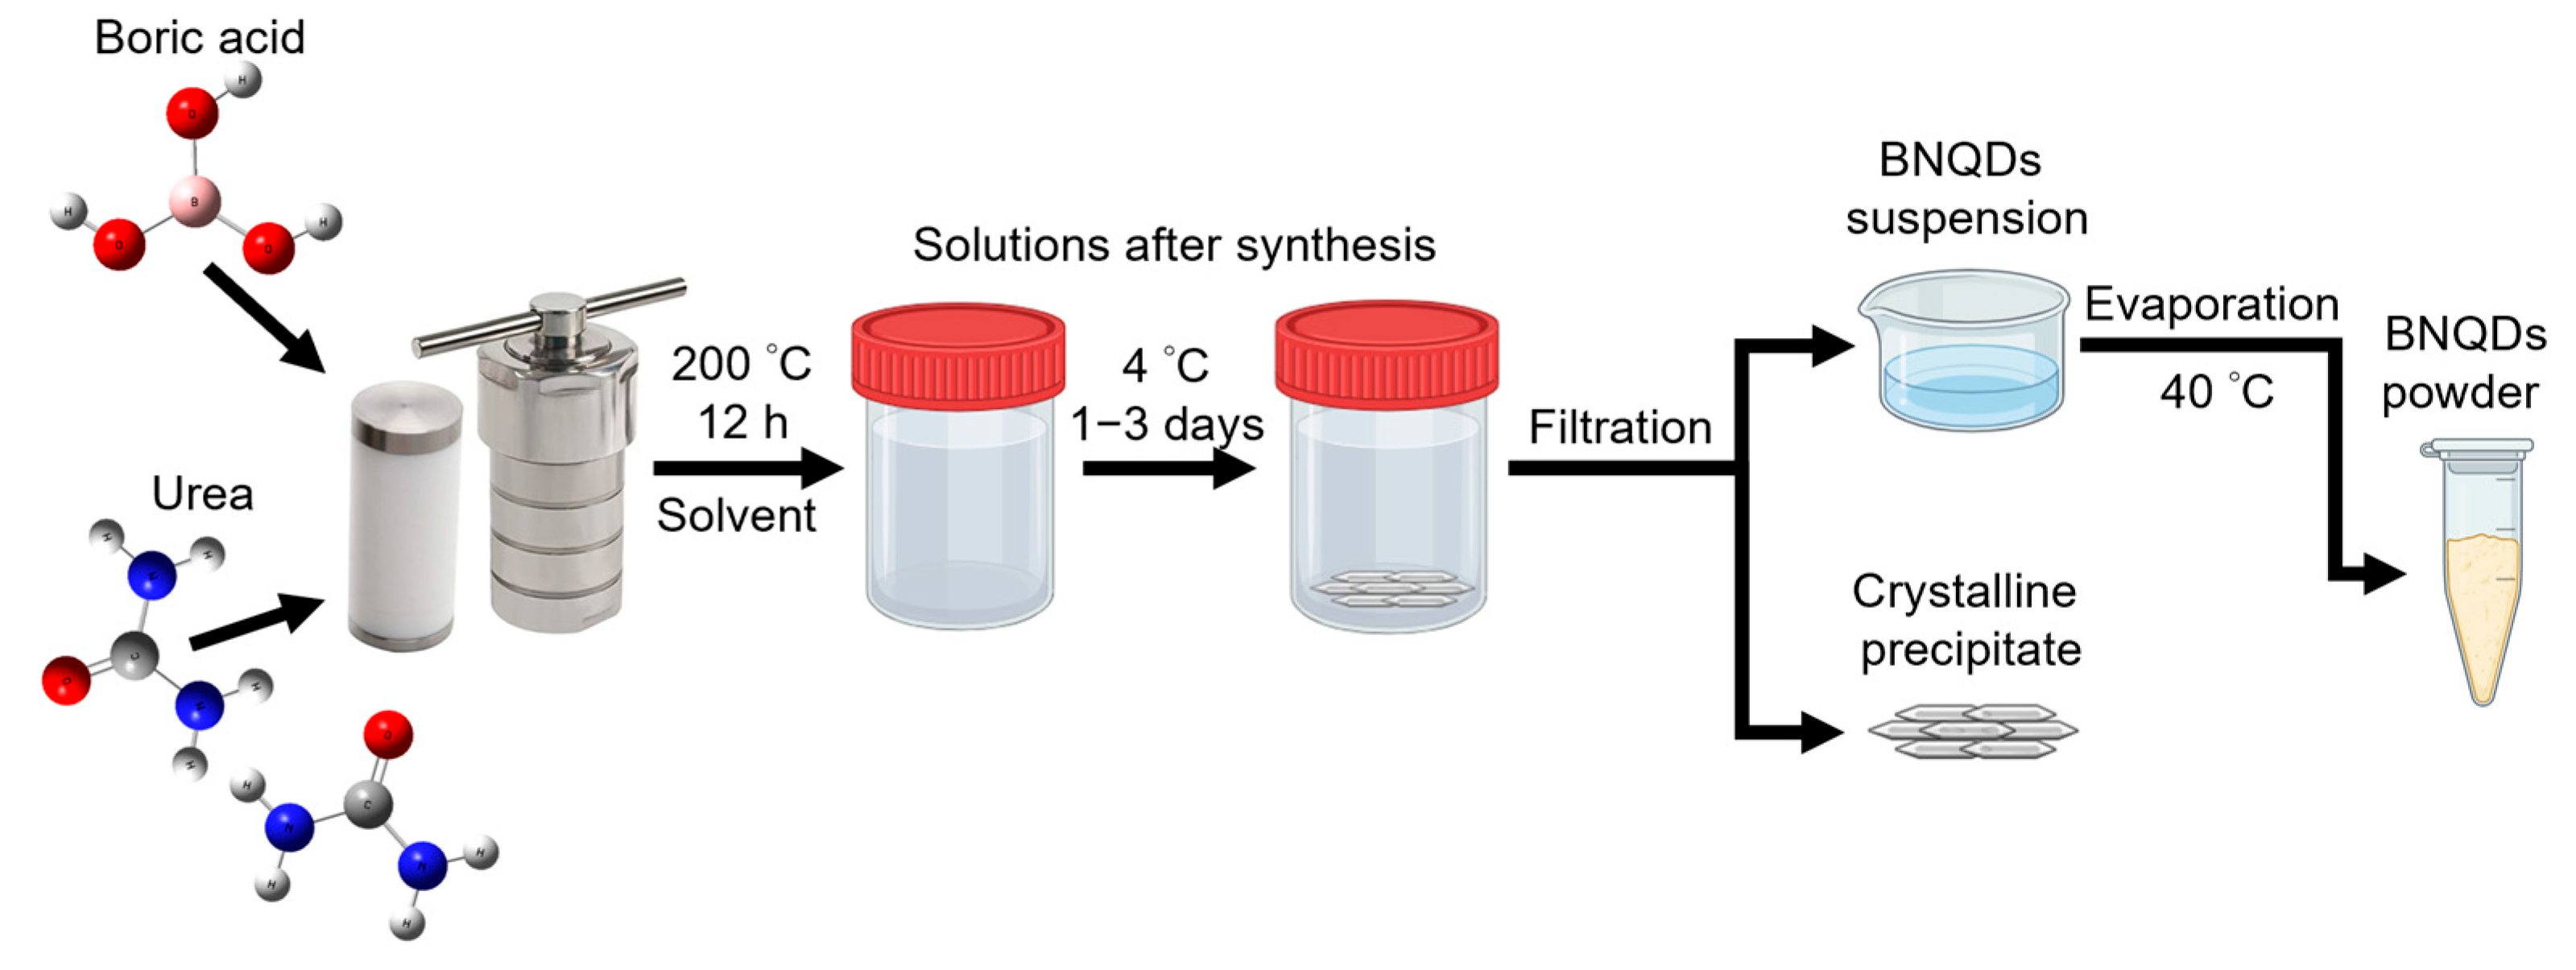
Figure 1. Schematic representation of BNQD synthesis.
Physchem 05 00046 g001
Figure 2. Structural characterization of BNQDs: (a) XRD; (b) FTIR spectra; (c) Raman spectra and (d) UV–vis spectroscopy of water suspensions of BNQDs. The colors behind the absorbance maxima indicate which spectrum the number refers to.
Physchem 05 00046 g002
Figure 3. PL spectra of water suspensions of BNQDs excited at (a) 240 nm, (b) 267 nm and (c) 320 nm. The colors behind the PL maxima indicate which spectrum the number refers to.
Physchem 05 00046 g003
Figure 4. Two-dimensional PLE maps of water suspensions of (a) C-BNQDs, (b) H-BNQDs, (c) E-BNQDs and (d) N-BNQDs.
Physchem 05 00046 g004
Figure 5. Absorption and PLE spectra of (a) C-BNQDs, (b) H-BNQDs, (c) E-BNQDs and (d) N-BNQDs. The PLE spectra of C- and E-BNQDs were measured at 360, 390, 400, and 430 nm, H- and N-BNQDs were recorded at 390, 400, and 410 nm.
Physchem 05 00046 g005
Figure 6. Structural characterization of C-BNQDs and E-BNQDs precipitates: (a) XRD and (b) FTIR spectra. To simplify the comparison of the precipitate structures with those of E- and C-BNQD, the same color ranges are shown as in Figure 2a,b. Background color explanation: light orange—OH groups, light green—C–B/N and B=N groups, light sky blue—B–N–B, B–O, C–N groups, light purple—B–N–O and N–B–O groups, pink—B–O, B–O–B, B–OH and O–B–O groups.
Physchem 05 00046 g006
Figure 7. Brightfield images, fluorescence microscopy and their merge of (ac) Control Vero cells and (df) cells incubated with C-BNQDs, respectively. Scale bar 20 μm. The excitation wavelength is 365 nm (DAPI). (g) Average histograms of the intensities of Control cells and cells incubated with C-BNQDs. Filled areas represent standard deviations of the data. Grey levels represent fluorescence intensity levels.
Physchem 05 00046 g007
Figure 8. Bio-imaging applications of C-BNQDs: (a) localization of C-BNQDs inside Vero cells; (b) afterglow of C-BNQDs; (c) possible mechanisms of radiative transitions, numbers correspond to each possible transition, the routes 3–5 correspond to the emission mechanisms available in the excitation/emission DAPI channel. Labels 1-B, 3-B, and C indicate the energy levels of corresponding defects. Note: Asterisk marks the radiative transitions not used for living cell imaging.
Physchem 05 00046 g008
Figure 9. Proposed mechanism of boron nitride quantum dot formation in reaction mixture during synthesis: (a) reactions in aqueous medium of boric acid/urea; initiation reactions of formation (b) “starting units” and (c) “starting blocks”; (d) proposed structures of BNQDs obtained during the hydrothermal/solvothermal synthesis.
Physchem 05 00046 g009
Table 2. The yield of the products after BNQD synthesis from boric acid and urea in different solvent systems.
Type BNQDsSolvent SystemYield of Powder After Evaporation (%)Yield of Precipitate (%)
C-BNQDsC2H5OH/NH3(aq)/H2O5.9526.76
H-BNQDsH2O27.54-
E-BNQDsC2H5OH13.3017.23
N-BNQDsNH3(aq)30.69-
Table 3. Chemical composition of BNQD samples.
ElementC-BNQDsH-BNQDsE-BNQDsN-BNQDs
wt.%at.%wt.%at.%wt.%at.%wt.%at.%
B14.6619.5218.6424.6217.5023.5016.3221.34
N7.868.085.015.106.957.205.115.16
O68.6361.6769.1461.7073.1066.3464.8257.30
C8.9510.737.228.582.442.9513.7616.21
Table 4. Particle size, polydispersity index, and zeta-potential of BNQDs.
C-BNQDsH-BNQDsE-BNQDsN-BNQDs
Hydrodynamic diameter (nm)680 ± 10720 ± 10580 ± 10770 ± 10
PDI0.321 ± 0.0260.332 ± 0.0400.306 ± 0.0150.380 ± 0.057
Zeta potential (mV)−32.7 ± 3.3−33.5 ± 4.1−29.2 ± 2.9−1.5 ± 0.2
Table 5. Chemical composition of C-BNQD and E-BNQD precipitates.
ElementC-BNQD PrecipitateE-BNQD Precipitate
wt.%at.%wt.%at.%
B18.3824.5622.1229.25
N5.755.937.307.44
O72.6265.5969.1761.69
C3.253.911.361.62
Table 6. Viability of Vero cells after subcultivation with BNQDs.
BNQD Concentration, µg/mLViability, %
6 h24 h
0100 ± 3100 ± 6
1096 ± 599 ± 8
10097 ± 789 ± 11
100091 ± 1081 ± 6
Note: data are presented as a percentage of the control sample.
Disclaimer/Publisher’s Note: The statements, opinions and data contained in all publications are solely those of the individual author(s) and contributor(s) and not of MDPI and/or the editor(s). MDPI and/or the editor(s) disclaim responsibility for any injury to people or property resulting from any ideas, methods, instructions or products referred to in the content.