Article

Random Forest-Based Machine Learning Model Design for 21,700/5 Ah Lithium Cell Health Prediction Using Experimental Data

School of Computing and Engineering, University of Huddersfield, Queensgate, Huddersfield HD1 3DH, UK
Physchem 2025, 5(1), 12; https://doi.org/10.3390/physchem5010012
Submission received: 30 December 2024 / Revised: 10 March 2025 / Accepted: 11 March 2025 / Published: 16 March 2025
(This article belongs to the Collection Batteries Beyond Mainstream)

Abstract

:
In this research, the use of machine learning techniques for predicting the state of health (SoH) of 5 Ah—21,700 lithium-ion cells were explored; data from an experimental aging test were used to build the prediction model. The main objective of this work is to develop a robust model for battery health estimation, which is crucial for enhancing the lifespan and performance of lithium-ion batteries in different applications, such as electric vehicles and energy storage systems. Two machine learning models: support vector regression (SVR) and random forest (RF) were designed and evaluated. The random forest model, which is a novel strategy for SoH prediction application, was trained using experimental features, including current (A), potential (V), and temperature (°C), and tuned through a grid search for performance optimization. The developed models were evaluated using two performance metrics, including R2 and root mean squared error (RMSE). The obtained results show that the random forest model outperformed the SVR model, achieving an R2 of 0.92 and an RMSE of 0.06, compared to an R2 of 0.85 and an RMSE of 0.08 for SVR. These findings demonstrate that random forest is an effective and robust strategy for SoH prediction, offering a promising alternative to existing SoH monitoring strategies.

1. Introduction

Lithium-ion batteries (LIBs) are a highly promising technology for contemporary energy storage systems, serving a diverse range of applications, including electric vehicles (EVs) and renewable energy storage solutions [1]. As battery capacity progressively diminishes over time due to aging and cycling, precise estimation of the state of health (SoH) becomes essential to ensure both safe operation and optimal performance [2]. The 21,700 lithium-ion cells (5 Ah) have started to be used in EVs and are particularly valued for their superior energy density in comparison to the 18,650 cells [3].
Battery state of health (SOH) modeling approaches can be classified into four categories: direct measurement methods, physics-based methods, data-driven approaches, and hybrid methods.
Coulomb counting (CC) and electrochemical impedance spectroscopy (EIS) fall under the direct measurement category. The CC method estimates battery capacity by tracking the flow of electric charge in and out of the battery during a full cycle. However, a key drawback of this method is that it is time-consuming and labor-intensive [4]. On the other hand, EIS is a real-time, non-invasive technique used to assess the internal resistance of batteries [5]. For instance, ref. [6] explored battery degradation through chemical kinetics. Despite its advantages, EIS is highly sensitive to changes in electrode interfaces. Consequently, any variations or contamination at the electrode–electrolyte interface can substantially affect impedance measurements, potentially leading to inaccurate interpretations of the battery’s SOH [4].
Physics-based models can be further categorized into two types: equivalent circuit models (ECMs) and electrochemical models (EMs). Both the ECM and electrochemical models are built on the complex dynamic mechanisms that govern battery degradation, offering valuable insights into the physical behavior of the battery. However, these models come with certain limitations. Their computational complexity can hinder their use in real-time state of health (SOH) estimation applications, as they often involve solving numerous non-linear partial differential equations, which can be difficult and time-consuming to address [7,8]. Electrochemical models [9], which are grounded in fundamental electrochemical principles and equations, are similarly constrained for real-time SOH estimation due to the complexity of the partial differential equations and the substantial computational resources they require [4].
Data-driven approaches, particularly those utilizing machine learning and deep learning, have emerged as promising methods for state of health (SOH) estimation, owing to the increased availability of large-scale battery operation data and advancements in computational power and artificial intelligence (AI) algorithms [4]. Unlike the physics-based approaches, which depend on detailed battery models, data-driven methods focus on identifying patterns and correlations directly between battery SOH and factors such as voltage, current, temperature, and other variables [10,11,12]. These approaches have proven effective in capturing complex, non-linear relationships, all while avoiding the need for intricate electrochemical modeling of the battery’s processes.
A variety of machine learning methods have been proposed in the literature for predicting the state of health (SoH) of lithium-ion batteries, with support vector regression (SVR) being one of the most widely utilized techniques. S. Jafari et al. [13] developed an SVR model for SoH prediction of lithium batteries using temperature, voltage, and current measurements. However, the process of mapping the kernel function introduces significant computational demands and requires substantial storage capacity, which represents a notable limitation of SVR. Additionally, the development of the SVR model, as well as the selection of the kernel function, is heavily reliant on the choice of features from the lithium-ion battery, the analysis of the feature structure, and the optimization of hyperparameters [14].
Artificial neural networks (ANNs), particularly deep neural networks (DNNs), have also shown considerable potential for SoH prediction due to their capacity to discern intricate patterns from high-dimensional datasets [15]. Nevertheless, these models typically demand vast amounts of data to achieve effective training [16]. Furthermore, gradient boosting machine (GBM) techniques, such as XGBoost and LightGBM, have been proposed for battery health estimation [17]. These models are noted for their robustness and strong performance in SoH prediction. However, they too require substantial computational resources and extensive hyperparameter tuning to achieve optimal results [18].
Random forest (RF) is an ensemble learning method that combines multiple decision trees to make predictive decisions. While random forest has been applied to various regression tasks, it remains underexplored for state of health (SoH) prediction in lithium-ion batteries, particularly for 21,700 cells [4,19,20]. Some research studies have focused on extracting health-related features from various datasets using random forest, conducting experiments with different types of cells, including the classic 18,650-type cells, pouch-type cells, and full battery packs. For instance, ref. [21] utilized data from the INR 18650-20R cell; ref. [22] examined the APR18650M1A; ref. [23] worked with the LG 18650HG; and [24] investigated a complete Battery Pack B0005. Additionally, ref. [25] conducted experiments on cycling nickel-manganese-cobalt (NMC)/graphite pouch cells.
However, in contemporary applications, particularly in electric vehicles (EVs), there is a growing trend toward using the newer 21,700-type cells. These cells offer approximately 50% more energy capacity compared to the 18,650 cells, making them more efficient for certain applications. As [26] notes, this means fewer cells are required to deliver the same amount of energy. Furthermore, the discharge capacities and energies for 21,700 cells are higher by approximately 51%, in the range of 0.5 C–3.75 C, as demonstrated in [27]. Recent studies, such as those in [24,25], highlight the advantages of random forest in handling non-linearity and high dimensionality and performing feature importance analysis. However, these studies primarily design models using only a single dataset, typically voltage, which limits the robustness of the SOH prediction by neglecting important features such as current and temperature.
Furthermore, there is limited comparative analysis in the literature regarding random forest’s performance against other existing methods, such as support vector regression and the gradient boosting machine, for 21,700 battery SoH estimation. Recent works have also proposed hybrid machine learning models that combine the strengths of different algorithms. For example, ref. [23] combined random forest with ANNs to enhance battery health prediction. Additionally, recurrent neural networks (RNNs), including long short-term memory (LSTM) networks, have been applied to time series-based SoH prediction [28]. While these models are particularly well suited for temporal data, they are often complex, computationally intensive, and require large datasets for effective training [29].
While several machine learning models have been explored for state of health estimation [4], Random forest has not been extensively studied, particularly for 21,700-type cells. These cells are expected to see widespread use in e-mobility applications and consumer products in the near future [30]. Additionally, a direct comparison between random forest and more established models, such as support vector regression and the gradient boosting machine, in terms of performance and interpretability remains largely unexplored. This study aims to address these gaps by experimentally evaluating random forest as an innovative approach for SOH prediction in 21,700 cells and comparing its performance with that of SVR.
The objectives of this study are to evaluate the performance of random forest for state of health assessment of 21,700 lithium-ion cells, to compare the performance of random forest with support vector regression in terms of R2, RMSE, and prediction accuracy, to optimize the hyperparameters of the random forest model to enhance its predictive capabilities, and to conduct a feature importance analysis to identify key parameters influencing battery degradation.
In this paper, random forest is proposed as a novel approach for SoH estimation of 21,700 lithium-ion cells. A comprehensive comparison between random forest and SVR is conducted, with a focus on prediction accuracy and error metrics. The study explores random forest’s hyperparameters and identifies the key features that influence SoH degradation. The results demonstrate that random forest outperforms SVR, achieving superior prediction accuracy and interpretability.
The structure of this paper is as follows: Section 2 presents machine learning-based SoH prediction models, Section 3 outlines the results and discussions, and Section 4 presents the conclusion with future research directions.

2. Machine Learning-Based SOH Prediction Models Design

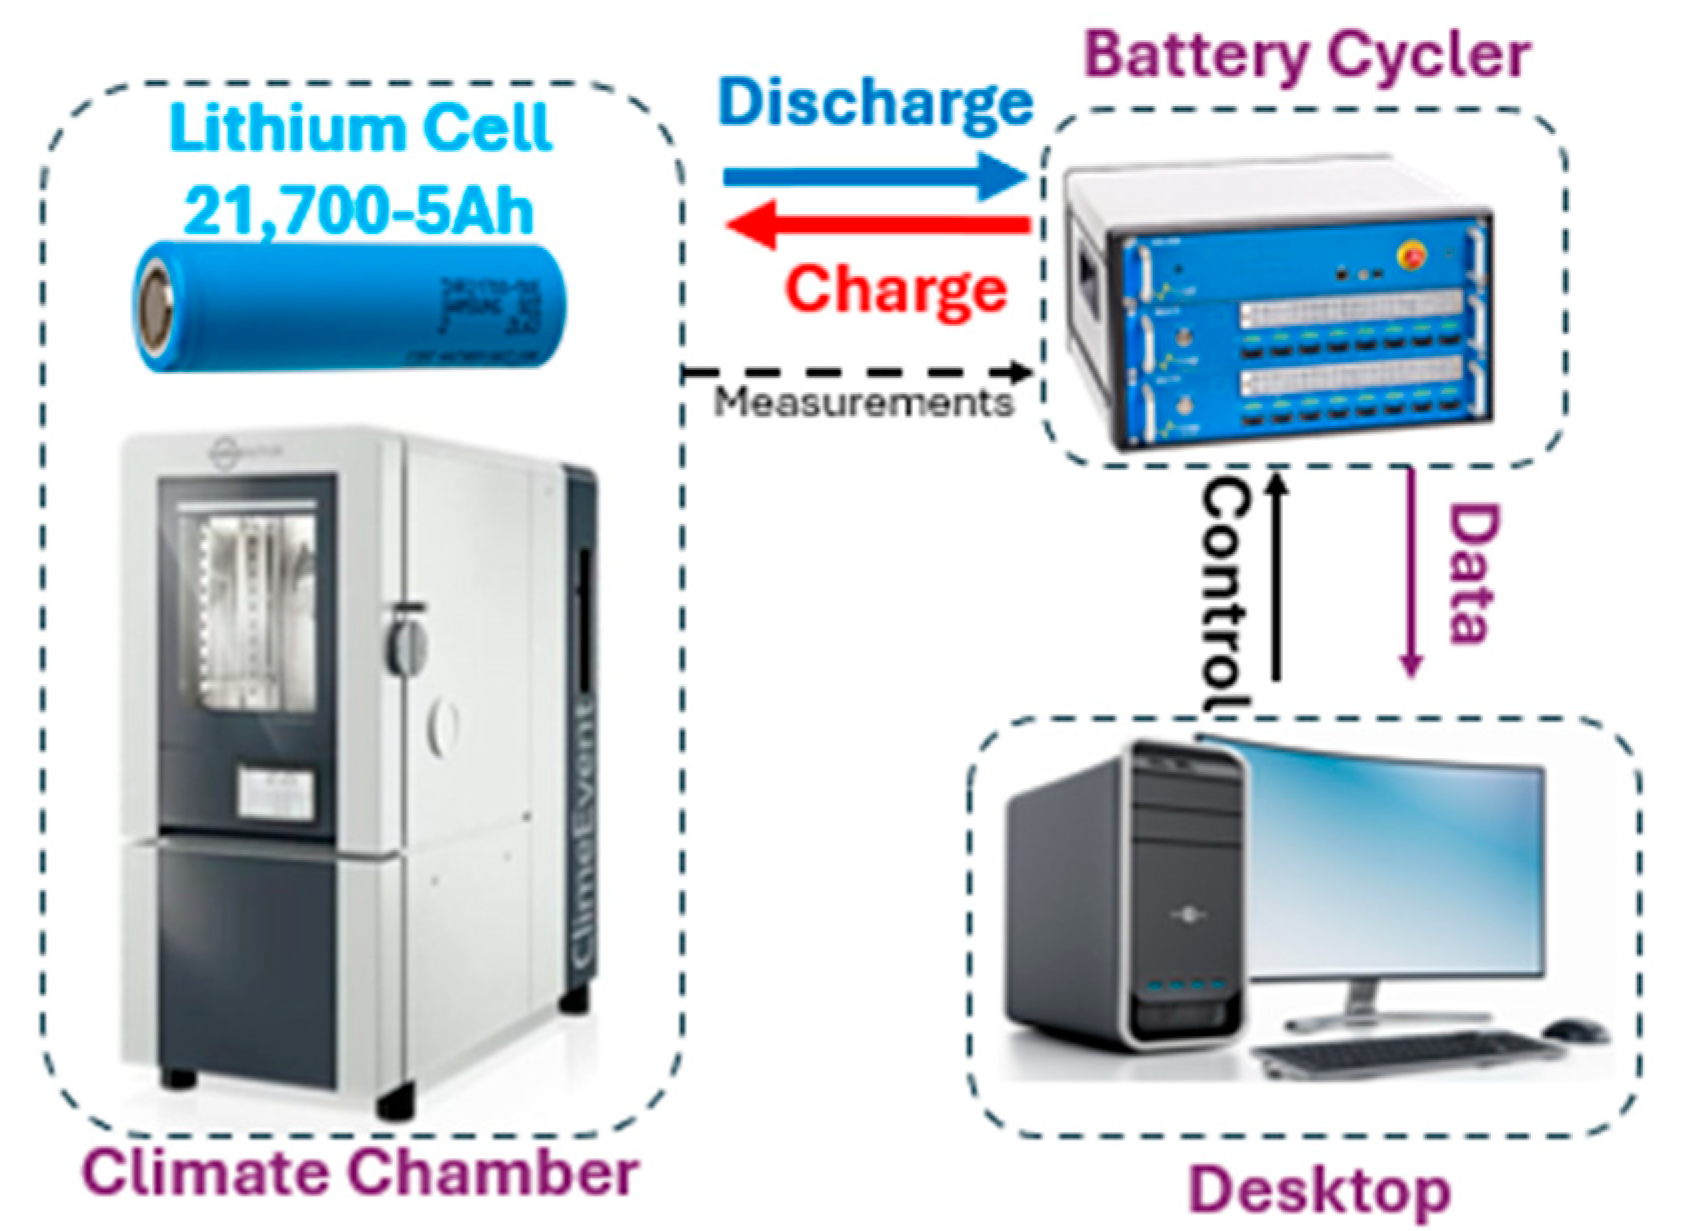
2.1. Data Collection

For this study, experimental aging data were used; the test was conducted on 21,700 lithium-ion cells with a capacity of 5 Ah. The cells underwent cycling tests to simulate real-world usage conditions, where they were fully charged and fully discharged repeatedly under 1 °C. The testing procedure was carried out in a climatic chamber to maintain a consistent temperature of 25 °C, ensuring stable test conditions throughout the cycle life; Figure 1 shows the experimental setup.
It was based on four main components:
  • ProDigitek battery cycler (BCS-800);
  • Cell under test (Samsung INR21700-50S—5 Ah—3.6 V);
  • Weiss Technik climate chamber;
  • Desktop.
The cell was monitored over the course of 300 charge–discharge cycles, as the 21,700-type cylindrical cells typically exhibit a maximum lifespan of approximately 300 cycles under 1 °C cycling conditions, as confirmed by multiple research studies, e.g., [31,32]. During these cycles, various parameters were recorded, including:
  • Voltage (V): Measured at the battery terminals.
  • Current (I): The charge and discharge currents.
  • Temperature (T): Surface cell temperature.
  • Capacity (C): The remaining capacity after each cycle.
This dataset represents the aging behavior of the 21,700 lithium-ion cells under typical cycling conditions. The actual state of health (SoH) was calculated (1) by dividing the remaining capacity after each cycle by the initial capacity.
SOH Actual = C k ( t )     ( Ah ) C Init   ( Ah ) × 100
where
  • Ck is the capacity at the k-th cycle;
  • Cinit is the initial capacity of the cell at the start of the test.

2.2. Data Preprocessing

Data preprocessing is essential to ensure that the models can learn effectively from the raw data. The following steps were applied to the raw data:
  • Outlier Removal:
Outlier detection and removal are crucial, especially in battery cycling data, where abnormal charge/discharge behavior or sensor malfunction can lead to extreme values. Previous studies in the field of battery modeling have emphasized the importance of removing outliers to improve the accuracy and robustness of predictive models. For instance, Meghana S. 2024 [33] demonstrated how outlier removal significantly improved the performance of machine learning models in battery aging and SoH estimation tasks. The presence of extreme values in the dataset may distort the relationships between input features and the targeted variable, leading to weak model performance.
In this research, Z-score standardization was employed to identify and remove outliers [34]. The Z-score of each data point is calculated as (2):
Z i = x i μ σ
where
  • xi is the observed value;
  • μ is the mean of the feature;
  • σ is the standard deviation of the feature.
Outliers were removed for any feature where the absolute value of Zi exceeded a threshold (typically, Z i > 3 ).
2.
Normalization:
Recent studies have shown that normalization plays a significant role in improving the performance of machine learning models for battery health prediction. Liu. et al. [35] demonstrated that normalization of battery voltage and temperature data resulted in more accurate SoH predictions using machine learning techniques. Ref. [35] noted that data normalization helped to stabilize the training process and avoid issues with convergence in neural networks for battery performance modeling. Moreover, recent literature has explored normalization strategies tailored for battery data. Mohammadrezaei M. et al. [36] compared various normalization methods, such as min–max versus z-score, in the context of lithium-ion battery aging prediction, showing that each method has its strengths depending on the dataset and the modeling approach. In the context of the state of health (SoH) estimation of lithium-ion batteries, the input features have been chosen as voltage, current, and temperature. The normalization process scales the features to a common range, ensuring that each feature contributes equally to the model. To scale the features into a common range (typically [0, 1]), min–max normalization was applied (3):
x norm = x min ( x ) max x min ( x )
where
  • x is the original feature value;
  • min(x) and max(x) are the minimum and maximum values of the feature across the dataset;
  • xnorm is the normalized value.
3.
Feature Engineering:
This feature is critical in capturing the dynamic behavior of the battery over time, as changes in voltage can indicate internal resistance increases or other degradation effects. A similar approach has been used in the literature to identify rapid shifts in battery voltage, which often correspond to the onset of capacity fade or accelerated degradation [37]. Furthermore, temperature gradients are another important feature, as rapid temperature changes during charge and discharge cycles can influence battery health and safety [38]. Recent studies have emphasized the importance of time-varying features such as voltage and temperature gradients for accurate SoH estimation. For example, applying rate-of-change metrics has been shown to improve prediction accuracy by capturing subtle patterns in degradation processes [39]. In particular, the voltage gradient can be indicative of charging efficiency or aging effects, such as electrolyte decomposition and solid electrolyte interphase (SEI) layer growth, which occur over extended cycles [40]. By extracting such features, it is possible to build a more robust understanding of battery behavior and improve the reliability of SoH models [41].
The rate of change of the voltage (Rvolts) between two consecutive cycles k and k + 1 was calculated as (4):
R volts = V k + 1 V k k + 1 k
where
  • Vk is the voltage at cycle k;
  • Vk+1 is the voltage at cycle k + 1.

2.3. Random Forest Model Design

Random forest is a widely recognized and powerful method for estimating the state of health (SoH) of batteries. It effectively handles non-linear relationships and is resistant to overfitting [22]. Recent studies show that random forest models outperform traditional regression techniques in terms of accuracy and robustness, particularly when working with large and complex datasets such as battery performance data [21].
The random forest algorithm is an ensemble learning technique that builds multiple decision trees and aggregates their outputs. Each decision tree is constructed by recursively splitting the data based on feature values, using hyperparameters that control the structure of the tree. The key hyperparameters are
D:The dataset;
Ntrees:The number of decision trees in the forest;
Dmax:The maximum depth of each tree;
Smin:The minimum number of samples required to split a node;
Sleaf:The minimum number of samples required to be in a leaf node.
The best combination of these parameters was selected based on performance metrics (R2 and RMSE) obtained through k-fold cross-validation, which helps to improve model generalization and reduce overfitting in battery SoH prediction [42]. The training process of each individual tree Ti is governed by these hyperparameters, where the tree construction can be summarized by (5):
T i = BuildTree ( D , S min , D max , S leaf )
For regression tasks, the prediction for a given sample x is the average of the predictions from all individual trees, as shown in Equation (6):
y ^ ( x ) = 1 N i = 1 N y i ^ ( x )
where
  • y i ^ ( x ) is the prediction from the i-th tree;
  • N is the total number of trees in the forest.
Each tree in the forest is trained on a bootstrapped sample of the training data, and the final output is obtained by averaging the predictions from all the trees. The model is trained to minimize the mean squared error, which is computed as (7):
MSE = 1 M i = 1 M ( y i y i ^ ) 2
where
  • M is the number of samples in the training dataset,
  • yi is the true label for sample i;
  • y i ^ is the predicted label for sample i.

2.4. Support Vector Regression Model Design

Support vector regression is another machine learning algorithm used for regression tasks. SVR maps the input data into a higher-dimensional space using a kernel function and performs linear regression in that space. SVR has also been applied to battery SoH estimation, with several studies demonstrating its ability to capture non-linearities in battery aging processes [43]. The kernel trick employed by SVR makes it an attractive alternative to other regression methods in cases where the data are not linearly separable, such as the voltage–temperature relationship in battery systems [44]. The SVR optimization problem can be defined as (8):
min w , b , ξ 1 2 w 2 + C i = 1 n ξ i
Subject to:
y i W T x i b ϵ + ξ i
W T x i + b y i ϵ + ξ i
ξ i 0 ,   i
where
  • w and b are the parameters of the hyperplane;
  • (xi) is the mapping function (kernel);
  • ϵ is the error tolerance margin;
  • ξi is the slack variable that allows for some errors in the model;
  • C is the regularization parameter controlling the trade-off between a low error on the training data and a large margin.

Hyperparameter Tuning for SVR

The hyperparameters for SVR that were tuned include the following:
  • Regularization parameter C controls the trade-off between achieving a low training error and low model complexity. It regulates the margin of tolerance for classification errors in the training data. A smaller value of C allows more slack (tolerance for errors) in the model, potentially resulting in a smoother decision boundary with higher bias and lower variance. A larger value of C reduces the tolerance for errors, leading to a more complex model that might overfit (higher variance).
  • Kernel Function: Radial Basis Function (RBF) kernel has been used; it is particularly suited for capturing complex non-linear relationships in the battery degradation data; this has been confirmed in recent studies focusing on battery performance prediction and degradation modeling [45]. The ability of the RBF kernel to transform data into higher-dimensional spaces makes it ideal for capturing the intricate behavior of battery systems over time [46]. Hyperparameter tuning is a critical step in ensuring that the SVR model performs optimally, as it directly influences the model’s generalization ability and prediction accuracy [13], where the kernel function is defined as (9):
K x , x = exp ( x x 2 2 σ 2 )
where
-
x and x′ are input vectors (samples);
-
||xx′||2 is the squared Euclidean distance between x and x′;
-
σ is the bandwidth parameter, which controls the spread or “width” of the kernel, determining the locality of influence for each data point. A smaller σ value results in a more localized influence, whereas a larger value leads to a broader influence.
  • Epsilon (ε) defines the margin of tolerance for error within which no penalty is applied. In other words, errors smaller than ϵ do not contribute to the loss function. The goal of SVR is to find a function f(x) that has at most ϵ deviation from the actual target values, while still being as flat as possible. This can be formulated as follows.

2.5. Performance Evaluation and Comparison

The performances of both the random forest and support vector regression models were evaluated using standard regression metrics:
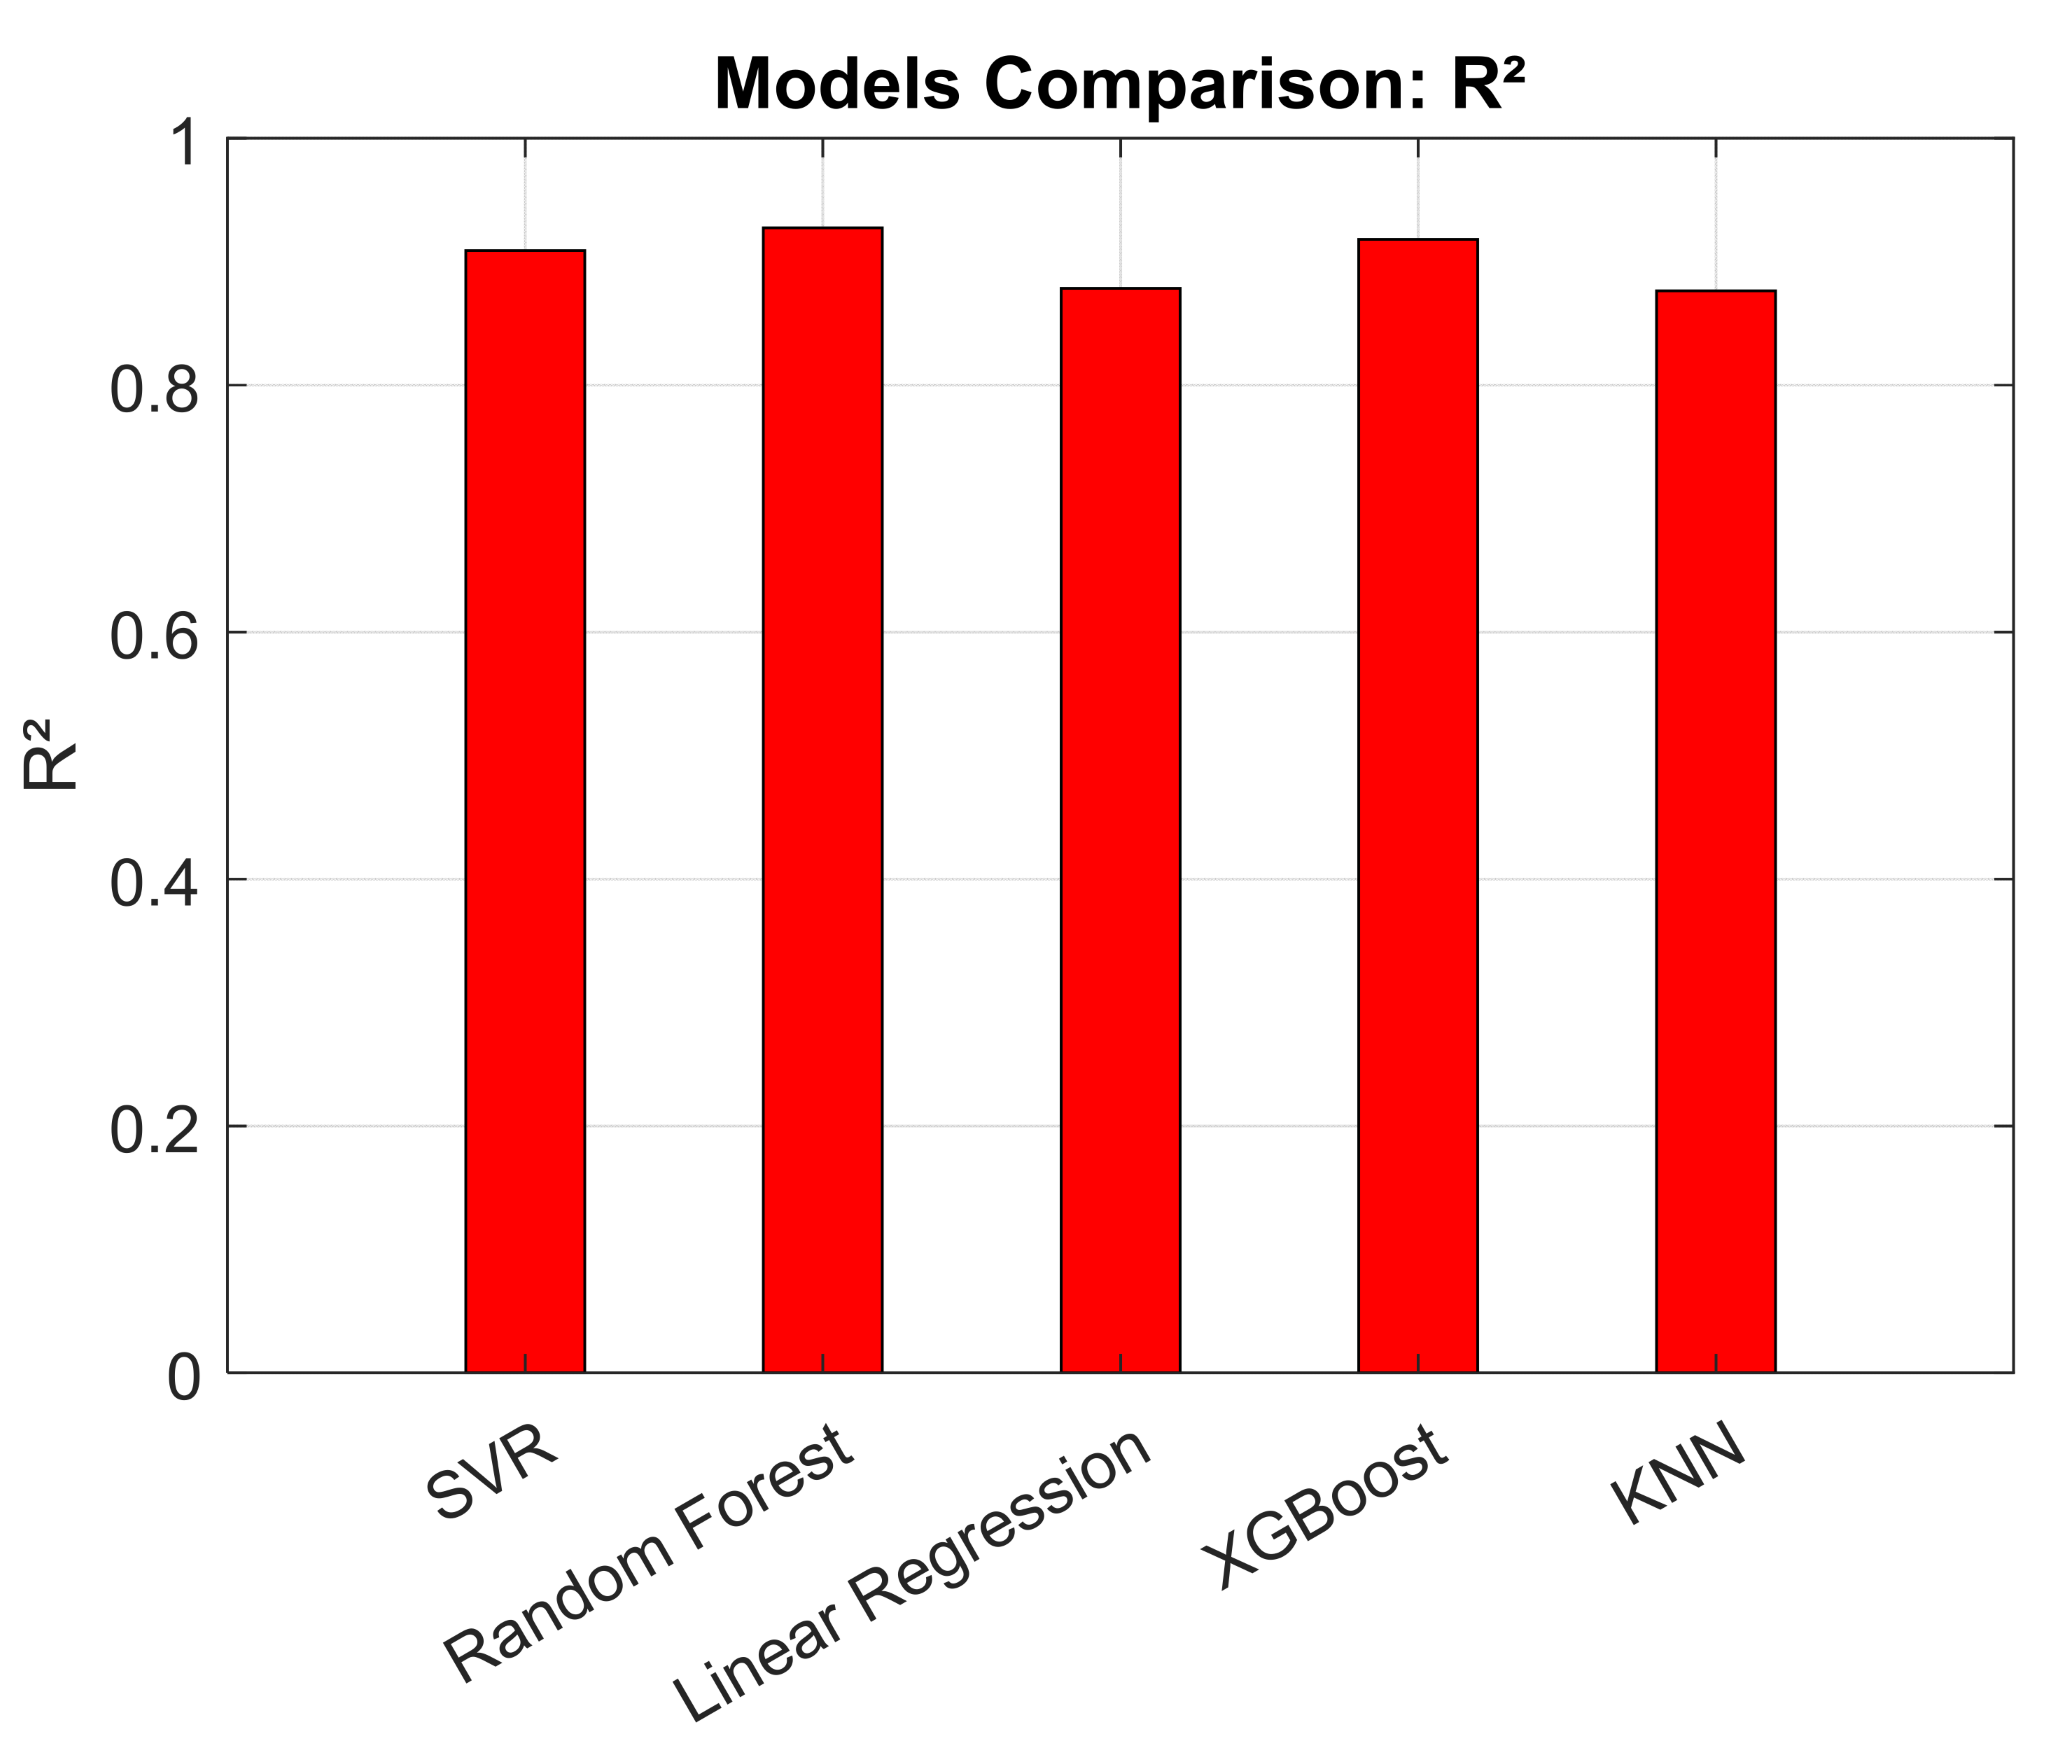
  • R2 (Coefficient of Determination): This metric is used to measure the proportion of variance in the dependent variable that is predictable from the independent variables. It is calculated as (10):
R 2 = 1 i = 1 M ( y i y ^ i ) 2 i = 1 M ( y i y ¯ ) 2
where
-
y i are the actual values of the dependent variable for the i-th data point;
-
y ^ i are the predicted values for the i-th data point;
-
y ¯ i is the mean of the actual values;
-
M is the number of samples in the dataset.
A higher R2 value indicates a better fit of the model to the data. R2 is commonly used for evaluating regression models in battery health predictions, where a high value suggests that the model is effectively capturing the dynamics of the battery’s degradation [47].
2.
RMSE (Root Mean Squared Error): RMSE is used to measure the average magnitude of the errors between the predicted and actual values. It is given by (11):
RMSE = 1 M i = 1 M ( y i y i ^ ) 2
RMSE is particularly sensitive to large errors and is often used to assess the performance of machine learning models in battery state of health (SoH) estimation [48].
3.
MAE (Mean Absolute Error): MAE measures the average magnitude of the errors in a set of predictions, without considering their direction. It is calculated as (12):
MAE = 1 M i = 1 M y i y i ^
MAE provides a more interpretable performance measure, as it gives a linear score that does not heavily penalize larger errors, making it a useful metric for battery degradation modeling [48].

3. Results and Discussion

In this section, we present the results of the machine learning models used to predict the state of health (SoH) of the 21,700 lithium-ion battery. The random forest (RF) and support vector regression (SVR) models were compared based on their performance metrics: R2 (coefficient of determination), RMSE (root mean squared error), and MAE (mean absolute error). The evaluation results provide insights into the effectiveness of these models in predicting the SoH based on the features derived from the experimental aging (cycling) test.

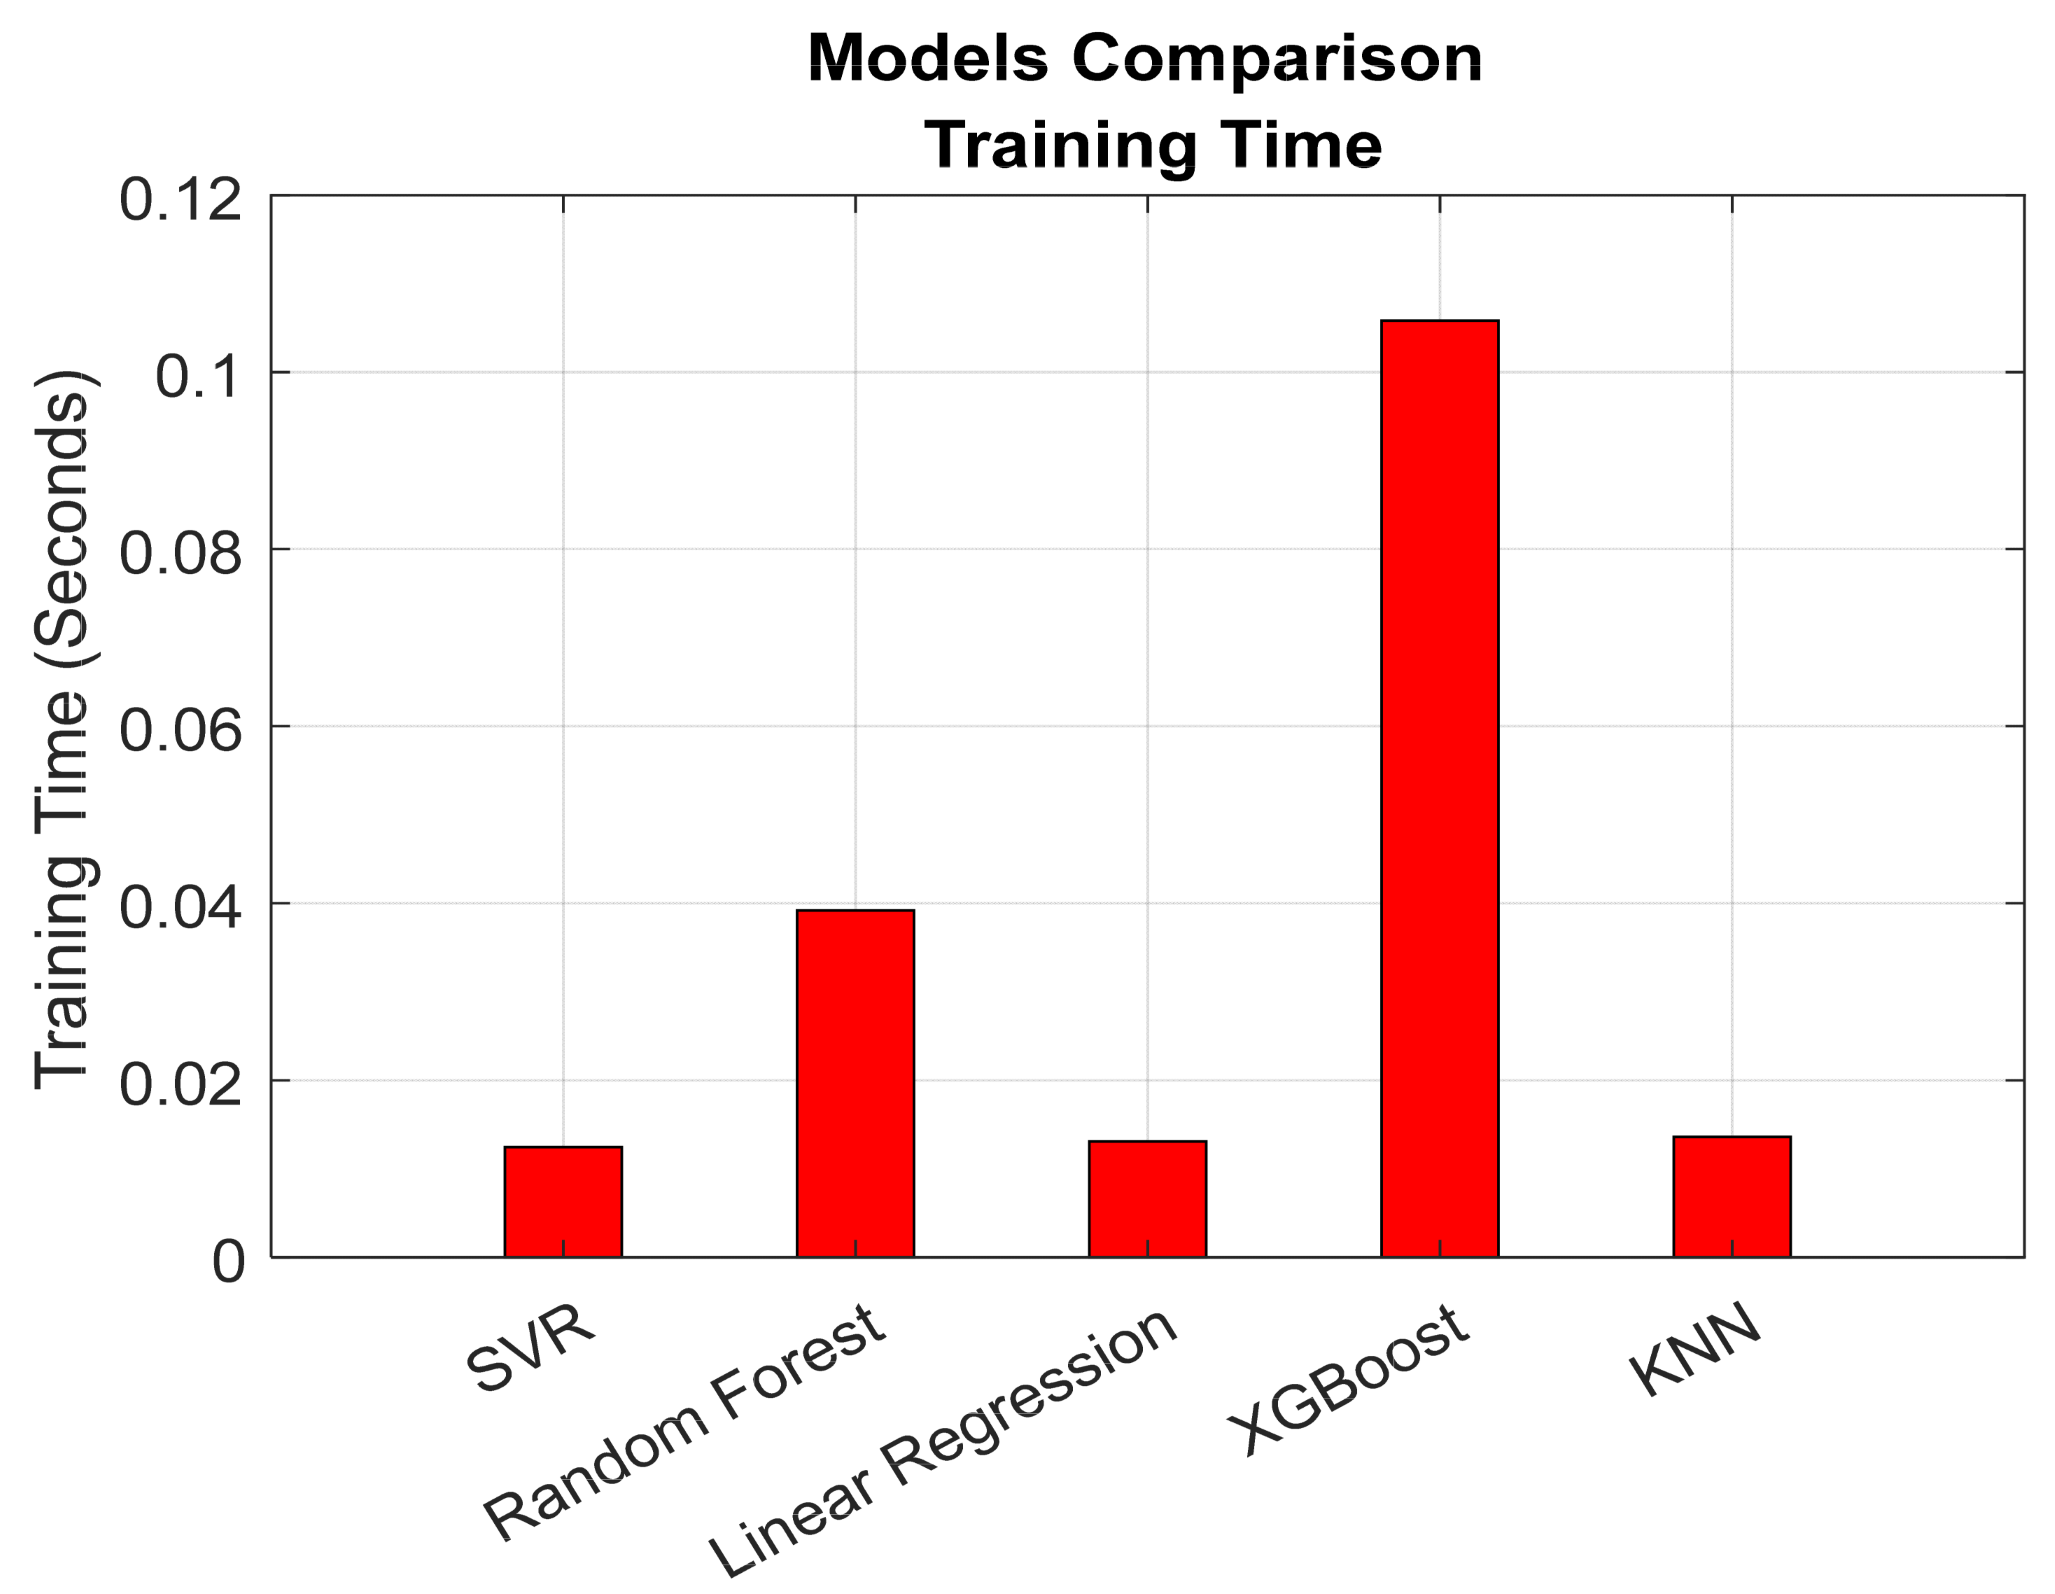
3.1. Different Models’ Metrics Performances

The evaluation results for both models are summarized in Figure 2 and Figure 3, which show the performance of the SVR, random forest, linear regression, XGBoost, and k-nearest neighbors (KNN) models in terms of R2 and RMSE.
The random forest model outperformed SVR in both R2 and RMSE, as indicated by the bar charts. In Figure 2, the random forest model achieved an R2 of 0.94, while the SVR model had an R2 of 0.909. Similarly, Figure 3 shows the RMSE values, where random forest showed a lower RMSE, indicating better predictive accuracy.
The support vector regression (SVR) model, using a radial basis function (RBF) kernel, also performed reasonably well in predicting the state of health of the lithium-ion battery, but was slightly outperformed by the random forest model. The SVR performance in terms of R2 and RMSE was slightly lower than random forest, which is shown in Figure 2 and Figure 3.
Upon careful analysis, it was found that the difference in computational time between the random forest model and the other models, such as KNN, LR, and SVR, was a mere 15 milliseconds (Figure 4). This is a marginal difference in speed; however, it is not of significant concern given that random forest consistently outperforms in areas such as predictive accuracy, scalability, and the provision of feature importance insights. These advantages make random forest the superior choice, particularly for long-term and reliable state of health (SoH) prediction, where the dataset is expected to expand over time.

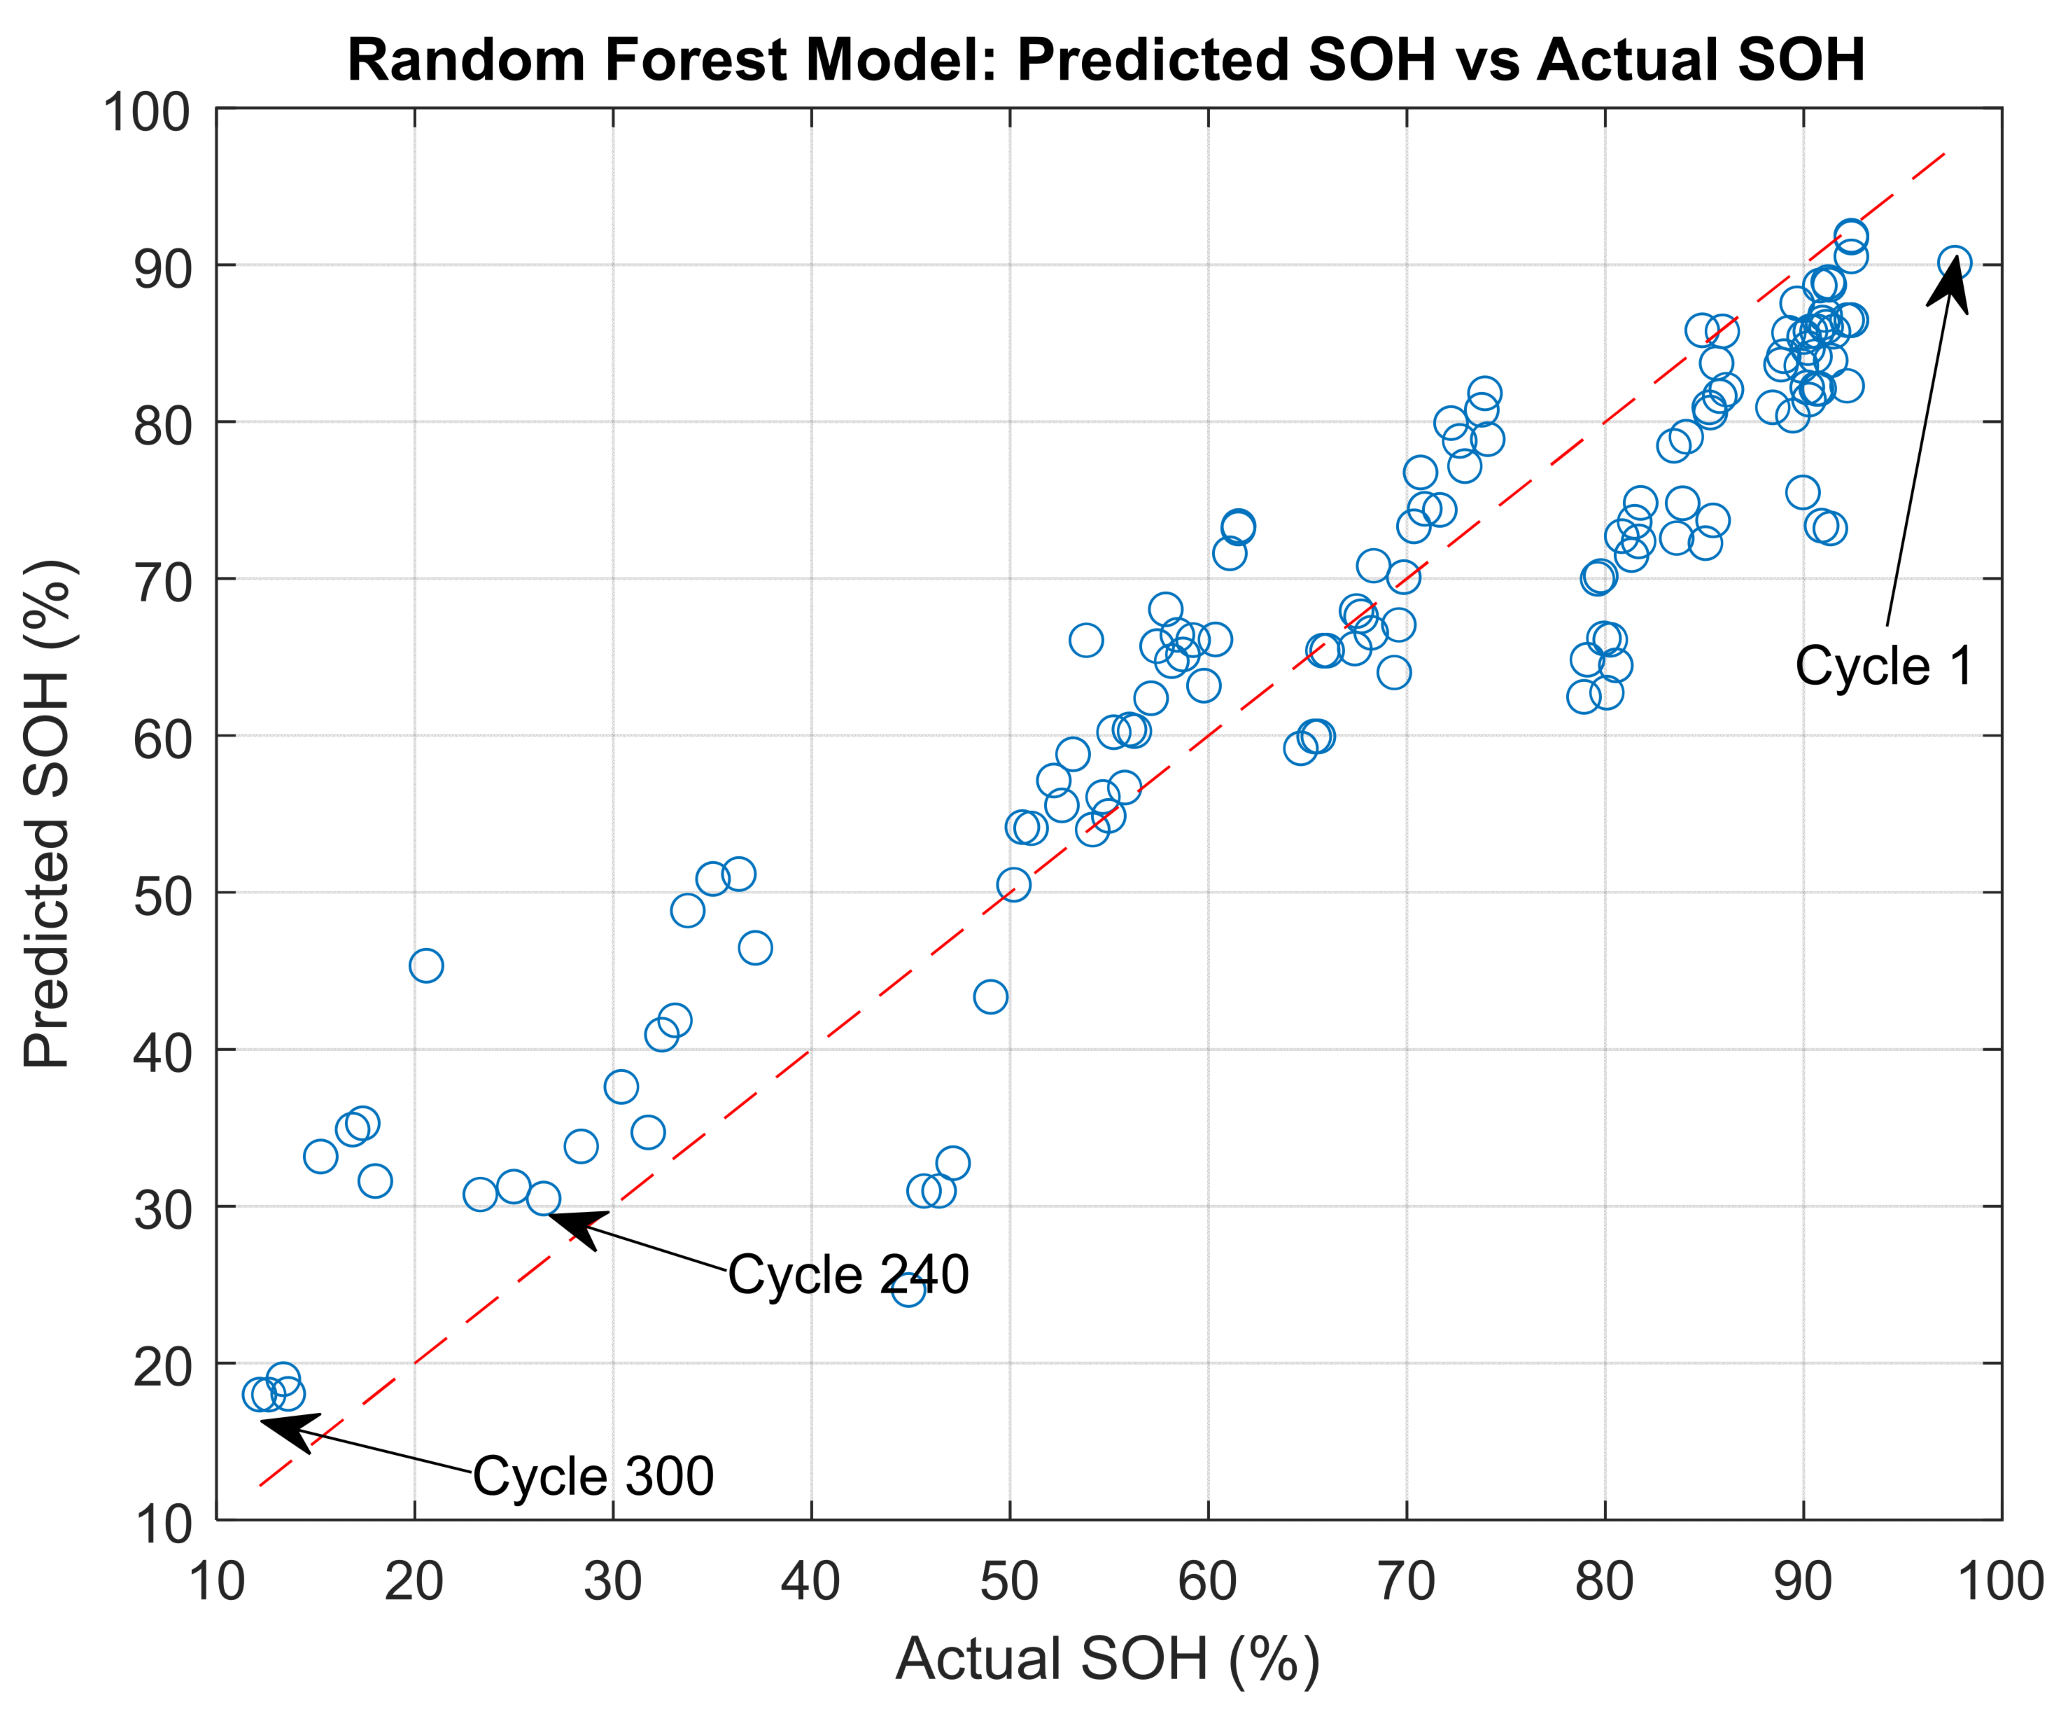
3.2. Random Forest Model Performance

Figure 5 (scatter plot) further supports these findings with a predicted (estimated SoH by the trained machine learning model (random forest) based on the input features (current (A), potential (V), temperature (°C)) vs. actual values (measured SOH using Equation (1), where SOH is determined by comparing the remaining capacity of the battery ( C k ( t ) ) to its initial capacity (Cinit)) plot for the random forest model. This plot visually illustrates how well the predicted SoH values match the actual values. The data points are closely aligned along the identity line, which indicates a good fit between the predicted and actual values. This indicates that random forest effectively captures the underlying patterns in the data, leading to accurate predictions.
Ideally, we are looking for those points which lie along the red dashed line, which represents the line of perfect predictions (estimations) (i.e., predicted values exactly equal to actual values). The closer the points are to this line, the better the model’s predictions. The developed model demonstrates greater accuracy for higher state of health (SOH) values, specifically those above 50%, which are particularly suitable for electric vehicle (EV) applications that typically utilize batteries with an SOH exceeding 80%.
The random forest (RF) model demonstrated strong performance due to its ability to handle complex interactions between input features such as current (A), potential (V), and temperature (°C). The feature importance refers to the relative contribution of each feature (current (A), potential (V), temperature (°C)) to the predictive SOH of the random forest model. It shows how much each feature influences the model’s ability to predict the SoH, with higher values indicating more influential features. This helps in understanding the model’s decision-making process and can guide further model refinement or interpretation of the data. The feature importance analysis shown in Figure 6 reveals that the most influential features for the SoH prediction were current (A) followed by the potential (V) and temperature (°C).
Additionally, Figure 7 presents a residual plot for the random forest model. Residuals, or the differences (Equation (13)) between the predicted and actual (experimental) SoH values, are shown against the predicted (estimated) SOH values. A red dashed line drawn in this plot represents the ideal case where predicted values = actual values. The absence of patterns in the residual plot suggests that the random forest model’s predictions are unbiased, with a max error of 5% (i.e., |Residual| < 5%), confirming its suitability for battery health prediction.
Residual = SOH Predicted SOH Actual
Figure 8 demonstrates the cumulative gains for the RF model. The cumulative gains plot for random forest is significantly higher than that for the random baseline, which illustrates that random forest is better at identifying and ranking samples according to their predicted SoH.
Moreover, Figure 9 shows a feature correlation matrix that visualizes the relationships between the different input features. This matrix confirms the importance of voltage and temperature as highly correlated with the state of health of the battery.
Figure 10 compares the cross-validation performance of the random forest model across 10 folds, showcasing its robust performance and stability.
Additionally, Figure 11 presents the learning curve for the random forest model, demonstrating how the model’s performance improves with increasing training data. As expected, the model’s training error decreases as the size of the training dataset increases, while the test error stabilizes, showing the model’s ability to generalize well to unseen data.
In conclusion, the random forest model consistently outperformed the support vector regression (SVR) model in predicting the state of health (SoH) of the lithium-ion battery. The R2 and RMSE values, along with the visualizations in the form of predicted vs. actual plots, residual plots, and feature importance graphs, confirmed that random forest is a robust and effective model for battery health prediction. SVR, while slightly less accurate, remains a viable option for applications with computational constraints. Future work may focus on further optimizing these models and exploring additional machine learning algorithms to enhance battery health prediction capabilities.

3.3. Discussion

The performance of the two primary models, support vector regression and random forest, was evaluated and compared using the coefficient of determination and root mean squared error. The following discusses the insights obtained from these metrics and compares the results with other popular machine learning models, including linear regression, XGBoost, and k-nearest neighbors.
The results demonstrate that random forest outperformed support vector regression in terms of R2 and RMSE, indicating that the RF model provided a better fit for the battery degradation data. Specifically, the R2 score for RF was 0.94, compared to 0.909 for SVR, with the latter achieving a slightly higher RMSE of 0.0638 compared to 0.0570 for RF. The out-of-bag (OOB) feature importance analysis performed for RF indicated that current was the most significant predictor of battery state of health (SoH), followed by voltage and temperature.
XGBoost, with its gradient boosting framework, achieved a higher R2 of 0.918 and a slightly better RMSE compared to SVR but was still outperformed by random forest. The higher performance of XGBoost is attributed to its ability to efficiently handle missing data and complex feature interactions. The k-nearest neighbors algorithm, which is based on the distance metric between data points, achieved a moderate R2 of 0.876 and an RMSE of 0.0651, which was similar to linear regression but better than SVR. KNN is highly sensitive to the scale of the data and the choice of the distance metric, which might explain its slightly worse performance in comparison to more sophisticated methods like random forest or XGBoost.
The importance of hyperparameter tuning was evident in the random forest model’s performance. By tuning the number of trees (Ntrees) using grid search, we found that the optimal number of trees was 100, which produced the best R2 value. In contrast, the SVR model used an RBF kernel with C = 1 and ε = 0.1, which provided reasonable results but was slightly outperformed by random forest in this study. The choice of kernel function in SVR has a significant impact on its performance, where an improper choice of kernel could lead to suboptimal performance in battery degradation tasks.
Figure 10 shows the cross-validation results for random forest, which showed a relatively stable performance across different folds, with an average RMSE of 0.058. This consistent performance across multiple subsets of data further supports the robustness of the random forest model.
Finally, Figure 11 provided valuable insights into overfitting and model performance as the training data size increased. Random forest has demonstrated improvement in performance with increasing training data. This trend suggests that random forest is less prone to overfitting and performs well even with limited data, making it a more robust choice for battery degradation prediction in practical scenarios where data might be scarce or noisy.
In conclusion, random forest proved to be the best-performing model for predicting battery state of health, followed by XGBoost and SVR, with linear regression and KNN being less effective. The results highlight the importance of feature selection, model tuning, and the choice of algorithm in handling the complexities of battery degradation prediction.

4. Conclusions

The results of this work demonstrate the effectiveness of random forest in predicting the state of health of lithium-ion 21,700—5 Ah cells, with the performance significantly outperforming other machine learning models, such as support vector regression, linear regression, XGBoost, and k-nearest neighbors (KNN). The evaluation metrics, specifically R2 and RMSE, highlight random forest’s ability to capture the non-linear relationships and complex interactions between features such as voltage, current, and temperature, which are crucial to accurately predicting battery degradation. With a high R2 score of 0.947 and a low RMSE of 0.057, random forest proved to be the most robust and effective model for this research.
In contrast, SVR, despite its popularity in regression tasks, showed slightly inferior performance in predicting battery SoH, with an R2 of 0.909 and an RMSE of 0.0638. This could be attributed to SVR’s limitation in handling the non-linear relationships in battery degradation data. The feature importance analysis, particularly in random forest, further confirmed the dominance of current as the most influential predictor of SoH, followed by voltage and temperature.
Additionally, the performance of other models, like XGBoost and KNN, was intermediate, with XGBoost performing slightly better than SVR but not reaching the performance of random forest. The learning curve analysis also revealed that random forest showed stable performance even with small amounts of training data, making it more adaptable in real-world scenarios where large datasets may not always be available.
One key aspect to explore in future work is the interpretability of machine learning models, particularly for random forest, which is often viewed as a “black-box” model. Methods like SHAP (Shapley additive explanations) or LIME (local interpretable model-agnostic explanations) could be employed to better understand how the model makes predictions and to highlight the contributions of individual features.

Funding

This research received no external funding.

Data Availability Statement

The data presented in this study are available on request from the corresponding author.

Conflicts of Interest

The author declare no conflict of interest.

References

  1. Kostenko, G.; Zaporozhets, A. Transition from Electric Vehicles to Energy Storage: Review on Targeted Lithium-Ion Battery Diagnostics. Energies 2024, 17, 5132. [Google Scholar] [CrossRef]
  2. Yarimca, G.; Cetkin, E. Review of Cell Level Battery (Calendar and Cycling) Aging Models: Electric Vehicles. Batteries 2024, 10, 374. [Google Scholar] [CrossRef]
  3. Baazouzi, S.; Feistel, N.; Wanner, J.; Landwehr, I.; Fill, A.; Birke, K.P. Design, Properties, and Manufacturing of Cylindrical Li-Ion Battery Cells—A Generic Overview. Batteries 2023, 9, 309. [Google Scholar] [CrossRef]
  4. Gong, J.; Xu, B.; Chen, F.; Zhou, G. Predictive Modeling for Electric Vehicle Battery State of Health: A Comprehensive Literature Review. Energies 2025, 18, 337. [Google Scholar] [CrossRef]
  5. Zhang, Y.; Tang, Q.; Zhang, Y.; Wang, J.; Stimming, U.; Lee, A.A. Identifying degradation patterns of lithium ion batteries from impedance spectroscopy using machine learning. Nat. Commun. 2020, 11, 1706. [Google Scholar] [CrossRef]
  6. Ouyang, M.; Feng, X.; Han, X.; Lu, L.; Li, Z.; He, X. A dynamic capacity degradation model and its applications considering varying load for a large format Li-ion battery. Appl. Energy 2016, 165, 48–59. [Google Scholar] [CrossRef]
  7. Barré, A.; Deguilhem, B.; Grolleau, S.; Gérard, M.; Suard, F.; Riu, D. A review on lithium-ion battery ageing mechanisms and estimations for automotive applications. J. Power Sources 2013, 241, 680–689. [Google Scholar] [CrossRef]
  8. Sylvestrin, G.R.; Maciel, J.N.; Amorim, M.L.M.; Carmo, J.P.; Afonso, J.A.; Lopes, S.F.; Ando, O.H., Jr. State of the Art in Electric Batteries’ State-of-Health (SoH) Estimation with Machine Learning: A Review. Energies 2025, 18, 746. [Google Scholar] [CrossRef]
  9. Park, J.; Jin, Y.; Kam, W.; Han, S. A practical semi-empirical model for predicting the SoH of lithium-ion battery: A novel perspective on short-term rest. J. Energy Storage 2024, 96, 12659. [Google Scholar] [CrossRef]
  10. Ren, Z.; Du, C. A review of machine learning state-of-charge and state-of-health estimation algorithms for lithium-ion batteries. Energy Rep. 2023, 9, 2993–3021. [Google Scholar] [CrossRef]
  11. Chen, L.; Wang, H.; Liu, B.; Wang, Y.; Ding, Y.; Pan, H. Battery state-of-health estimation based on a metabolic extreme learning machine combining degradation state model and error compensation. Energy 2021, 215, 119078. [Google Scholar] [CrossRef]
  12. Shen, S.; Sadoughi, M.; Li, M.; Wang, Z.; Hu, C. Deep convolutional neural networks with ensemble learning and transfer learning for capacity estimation of lithium-ion batteries. Appl. Energy 2020, 260, 114296. [Google Scholar] [CrossRef]
  13. Jafari, S.; Kim, J.; Choi, W.; Byun, Y.-C. Integrating Multilayer Perceptron and Support Vector Regression for Enhanced State of Health Estimation in Lithium-Ion Batteries. IEEE Access 2025, 13, 11463–11478. [Google Scholar] [CrossRef]
  14. Zhang, M.; Yang, D.; Du, J.; Sun, H.; Li, L.; Wang, L.; Wang, K. A Review of SOH Prediction of Li-Ion Batteries Based on Data-Driven Algorithms. Energies 2023, 16, 3167. [Google Scholar] [CrossRef]
  15. Jorkesh, S.; Ahmed, R.; Habibi, S.; Hosseininejad, R.; Xu, S. Battery State of Charge and State of Health Estimation Using a New Hybrid Deep Neural Network Approach. IEEE Access 2025, 13, 12566–12580. [Google Scholar] [CrossRef]
  16. Ramezani, S.B.; Cummins, L.; Killen, B.; Carley, R.; Amirlatifi, A.; Rahimi, S.; Seale, M.; Bian, L. Scalability, Explainability and Performance of Data-Driven Algorithms in Predicting the Remaining Useful Life: A Comprehensive Review. IEEE Access 2023, 11, 41741–41769. [Google Scholar] [CrossRef]
  17. Çetinus, B.; Oyucu, S.; Aksöz, A.; Biçer, E. The Role of Machine Learning in Enhancing Battery Management for Drone Operations: A Focus on SoH Prediction Using Ensemble Learning Techniques. Batteries 2024, 10, 371. [Google Scholar] [CrossRef]
  18. Manoharan, A.; Begam, K.M.; Aparow, V.R.; Sooriamoorthy, D. Artificial Neural Networks, Gradient Boosting and Support Vector Machines for electric vehicle battery state estimation: A review. J. Energy Storage 2022, 55, 105384. [Google Scholar] [CrossRef]
  19. Choi, H.; Son, H.; Choi, Y.H.; Youn, B.D.; Lee, G. Reliability-based design optimization of a pouch battery module using Gaussian process modeling in the presence of cell swelling. Struct. Multidiscip. Optim. 2023, 66, 227. [Google Scholar] [CrossRef]
  20. Liu, Z.; Tang, L.; Wang, H.; Huang, Z. Capacity Prediction Method of Lithium-Ion Battery in Production Process Based on Improved Random Forest. Energy Technol. 2024, 12, 2300891. [Google Scholar] [CrossRef]
  21. Wang, G.; Lyu, Z.; Li, X. An Optimized Random Forest Regression Model for Li-Ion Battery Prognostics and Health Management. Batteries 2023, 9, 332. [Google Scholar] [CrossRef]
  22. Yang, N.; Hofmann, H.; Sun, J.; Song, Z. Remaining Useful Life Prediction of Lithium-Ion Batteries with Limited Degradation History Using Random Forest. IEEE Trans. Transp. Electrif. 2024, 10, 5049–5060. [Google Scholar] [CrossRef]
  23. Garse, K.M.; Bairwa, K.N.; Roy, A. Hybrid Random Forest Regression and Artificial Neural Networks for Modelling and Monitoring the State of Health of Li-Ion Battery. J. Electr. Syst. 2024, 20, 2231–2243. [Google Scholar] [CrossRef]
  24. Wang, X.; Hu, B.; Su, X.; Xu, L.; Zhu, D. State of Health estimation for lithium-ion batteries using Random Forest and Gated Recurrent Unit. J. Energy Storage 2024, 76, 109796. [Google Scholar] [CrossRef]
  25. Li, Y.; Zou, C.; Berecibar, M.; Nanini-Maury, E.; Chan, J.C.-W.; Bossche, P.v.D.; Van Mierlo, J.; Omar, N. Random forest regression for online capacity estimation of lithium-ion batteries. Appl. Energy 2018, 232, 197–210. [Google Scholar] [CrossRef]
  26. Quinn, J.B.; Waldmann, T.; Richter, K.; Kasper, M.; Wohlfahrt-Mehrens, M. Energy Density of Cylindrical Li-Ion Cells: A Comparison of Commercial 18650 to the 21700 Cells. J. Electrochem. Soc. 2018, 165, A3284–A3291. [Google Scholar] [CrossRef]
  27. Waldmann, T.; Scurtu, R.-G.; Richter, K.; Wohlfahrt-Mehrens, M. 18650 vs. 21700 Li-ion cells—A direct comparison of electrochemical, thermal, and geometrical properties. J. Power Sources 2020, 472, 228614. [Google Scholar] [CrossRef]
  28. Tian, J.; Li, S.; Liu, X.; Wang, P. Long-short term memory neural network based life prediction of lithium-ion battery considering internal parameters. Energy Rep. 2022, 8 (Suppl. S10), 81–89. [Google Scholar] [CrossRef]
  29. Venugopal, P. State-of-Health Estimation of Li-ion Batteries in Electric Vehicle Using IndRNN under Variable Load Condition. Energies 2019, 12, 4338. [Google Scholar] [CrossRef]
  30. Bulla, M.; Schmandt, C.; Kolling, S.; Kisters, T.; Sahraei, E. An Experimental and Numerical Study on Charged 21700 Lithium-Ion Battery Cells under Dynamic and High Mechanical Loads. Energies 2023, 16, 211. [Google Scholar] [CrossRef]
  31. Petz, D.; Baran, V.; Park, J.; Schökel, A.; Kriele, A.; Kornmeier, J.R.; Paulmann, C.; Koch, M.; Nilges, T.; Müller-Buschbaum, P.; et al. Heterogeneity of Lithium Distribution in the Graphite Anode of 21700-Type Cylindrical Li-Ion Cells during Degradation. Batteries 2024, 10, 68. [Google Scholar] [CrossRef]
  32. Amamra, S.-A.; Tripathy, Y.; Barai, A.; Moore, A.D.; Marco, J. Electric Vehicle Battery Performance Investigation Based on Real World Current Harmonics. Energies 2020, 13, 489. [Google Scholar] [CrossRef]
  33. Sudarshan, M.; Gautam, R.; Singh, M.; García, R.E.; Tomar, V. A comparative analysis of the influence of data-processing on battery health prediction by two machine learning algorithms. J. Energy Storage 2024, 104, 114524. [Google Scholar] [CrossRef]
  34. Kim, T.; Kang, D.; Oh, C.-Y.; Kim, M.; Baek, J. Efficient On-Board Health Monitoring for Multicell Lithium-Ion Battery Systems Using Gaussian Process Clustering. In Proceedings of the 2018 IEEE Energy Conversion Congress and Exposition (ECCE), Portland, OR, USA, 23–27 September 2018; pp. 5604–5609. [Google Scholar] [CrossRef]
  35. Liu, P.; Liu, C.; Wang, Z.; Wang, Q.; Han, J.; Zhou, Y. A Data-Driven Comprehensive Battery SOH Evaluation and Prediction Method Based on Improved CRITIC-GRA and Att-BiGRU. Sustainability 2023, 15, 15084. [Google Scholar] [CrossRef]
  36. Mohammadrezaei, M.; Maleki, Z.; Tabesh, A.; Khajehoddin, S.A. A Framework for Normalizing Physical Features of Li-Ion Batteries to Form a Generic Health Estimation Model. IEEE Trans. Transp. Electrif. 2024, 10, 6880–6892. [Google Scholar] [CrossRef]
  37. Piao, C.; Sun, R.; Chen, J.; Liu, M.; Wang, Z. A feature extraction approach for state-of-health estimation of lithium-ion battery. J. Energy Storage 2023, 73, 108871. [Google Scholar] [CrossRef]
  38. Wang, J.; Zhang, C.; Meng, X.; Zhang, L.; Li, X.; Zhang, W. A Novel Feature Engineering-Based SOH Estimation Method for Lithium-Ion Battery with Downgraded Laboratory Data. Batteries 2024, 10, 139. [Google Scholar] [CrossRef]
  39. Maures, M.; Capitaine, A.; Delétage, J.-Y.; Vinassa, J.-M.; Briat, O. Lithium-ion battery SoH estimation based on incremental capacity peak tracking at several current levels for online application. Microelectron. Reliab. 2020, 114, 113798. [Google Scholar] [CrossRef]
  40. Andriunas, I.; Milojevic, Z.; Wade, N.; Das, P.K. Impact of solid-electrolyte interphase layer thickness on lithium-ion battery cell surface temperature. J. Power Sources 2022, 525, 231126. [Google Scholar] [CrossRef]
  41. Wang, J.; Zhang, C.; Zhang, L.; Su, X.; Zhang, W.; Li, X.; Du, J. A novel aging characteristics-based feature engineering for battery state of health estimation. Energy 2023, 273, 127169. [Google Scholar] [CrossRef]
  42. Huang, S.-C.; Tseng, K.-H.; Liang, J.-W.; Chang, C.-L.; Pecht, M.G. An Online SOC and SOH Estimation Model for Lithium-Ion Batteries. Energies 2017, 10, 512. [Google Scholar] [CrossRef]
  43. Wang, R.; Xu, X.; Zhou, Q.; Zhang, J.; Wang, J.; Ye, J.; Wu, Y. State of Health Estimation for Lithium-Ion Batteries Using Enhanced Whale Optimization Algorithm for Feature Selection and Support Vector Regression Model. Processes 2025, 13, 158. [Google Scholar] [CrossRef]
  44. Li, Q.; Li, D.; Zhao, K.; Wang, L.; Wang, K. State of health estimation of lithium-ion battery based on improved ant lion optimization and support vector regression. J. Energy Storage 2022, 50, 104215. [Google Scholar] [CrossRef]
  45. Feng, R.; Wang, S.; Yu, C.; Hai, N.; Fernandez, C. High precision state of health estimation of lithium-ion batteries based on strong correlation aging feature extraction and improved hybrid kernel function least squares support vector regression machine model. J. Energy Storage 2024, 90, 111834. [Google Scholar] [CrossRef]
  46. Li, Y.; Wang, S.; Chen, W.; Han, W. Holistic Comparison of Different Kernel Functions for Support Vector Regression Based on State-of-health Prediction of Lithium-ion Battery. In Proceedings of the 2020 11th International Conference on Prognostics and System Health Management (PHM-2020 Jinan), Jinan, China, 23–25 October 2020; pp. 40–46. [Google Scholar] [CrossRef]
  47. Gong, D.; Gao, Y.; Kou, Y.; Wang, Y. State of health estimation for lithium-ion battery based on energy features. Energy 2022, 257, 124812. [Google Scholar] [CrossRef]
  48. Xu, J.; Liu, B.; Zhang, G.; Zhu, J. State-of-health estimation for lithium-ion batteries based on partial charging segment and stacking model fusion. Energy Sci. Eng. 2023, 11, 383–397. [Google Scholar] [CrossRef]
Figure 1. Experimental setup.
Physchem 05 00012 g001
Figure 2. R2 comparison between SVR, random forest, and other models (linear regression, XGBoost, KNN).
Physchem 05 00012 g002
Figure 3. RMSE comparison between the models.
Physchem 05 00012 g003
Figure 4. Different models’ computational speed.
Physchem 05 00012 g004
Figure 5. Predicted SOH vs. actual SOH (random forest model).
Physchem 05 00012 g005
Figure 6. Feature importance (random forest model).
Physchem 05 00012 g006
Figure 7. Residual plot (random forest model).
Physchem 05 00012 g007
Figure 8. Cumulative gains (random forest vs. random).
Physchem 05 00012 g008
Figure 9. Feature correlation matrix for the training dataset.
Physchem 05 00012 g009
Figure 10. Cross-validation loss (random forest model).
Physchem 05 00012 g010
Figure 11. Learning curve (random forest model).
Physchem 05 00012 g011
Disclaimer/Publisher’s Note: The statements, opinions and data contained in all publications are solely those of the individual author(s) and contributor(s) and not of MDPI and/or the editor(s). MDPI and/or the editor(s) disclaim responsibility for any injury to people or property resulting from any ideas, methods, instructions or products referred to in the content.

