Article

Atomic-Scale Study of NASICON Type Electrode Material: Defects, Dopants and Sodium-Ion Migration in Na3V2(PO4)3

by
Vijayabaskar Seshan
1,
Poobalasuntharam Iyngaran
1,
Poobalasingam Abiman
1 and
Navaratnarajah Kuganathan
2,*
1
Department of Chemistry, University of Jaffna, Jaffna 40000, Sri Lanka
2
Department of Materials, Faculty of Engineering, Imperial College London, London SW7 2AZ, UK
*
Author to whom correspondence should be addressed.
Physchem 2025, 5(1), 1; https://doi.org/10.3390/physchem5010001
Submission received: 18 November 2024 / Revised: 23 December 2024 / Accepted: 27 December 2024 / Published: 30 December 2024
(This article belongs to the Collection Batteries Beyond Mainstream)

Abstract

:
Na3V2(PO4)3 (NVP), a NASICON-type material, has gained attention as a promising battery cathode owing to its high sodium mobility and excellent structural stability. Using computational simulation techniques based on classical potentials and density functional theory (DFT), we examine the defect characteristics, diffusion mechanisms, and dopant behavior of the NVP. The study found that the Na Frenkel defect is the most favorable intrinsic defect, supporting the desodiation process necessary for capacity and enabling vacancy-assisted Na-ion migration. The Na migration is anticipated through a long-range zig-zag pathway with an overall activation energy of 0.70 eV. K and Sc preferentially occupy Na and V sites without creating charge-compensating defects. Substituting Mg at the V site can simultaneously increase Na content by forming interstitials and reducing the band gap. Additionally, doping Ti at the V site promotes the formation of Na vacancies necessary for vacancy-assisted migration, leading to a notable improvement in electronic conductivity.

1. Introduction

The depletion of fossil fuel resources, coupled with growing environmental and geopolitical concerns, has accelerated the search for alternative energy sources including batteries. These alternatives help to generate clean electricity, store energy efficiently, and power transportation.
Rechargeable batteries offer a promising solution for efficient energy storage, playing a crucial role in the transition to renewable energy and the electrification of various sectors, particularly transportation [1,2,3]. Advancements in battery technology, along with solutions to challenges like cost, energy density, and recycling, will be key to achieving a cleaner, more sustainable energy future. While lithium-ion batteries (LIBs) have dominated the energy storage landscape for several decades due to their superior performance, the scarcity of lithium and the environmental and geopolitical challenges associated with its extraction raise concerns about their long-term sustainability [4,5,6]. To meet the growing demand for energy storage and reduce reliance on limited lithium resources, the development of alternative battery technologies, improved recycling practices, and material innovations are essential.
Sodium-ion batteries (SIBs) are attracting growing interest for grid storage applications primarily because of their cost-effectiveness [7,8] and the abundance of sodium compared to lithium [9,10]. Developing electrode and electrolyte materials for SIBs is crucial to their success, as these components largely determine the performance of a battery, including its energy density, cycle life, efficiency, and overall safety. The synthesis and testing of various sodium-based materials for SIBs including phosphates, fluorosulfates, pyrophosphates, and oxychlorides have shown promising results in enhancing battery performance. Research continues to focus on addressing challenges related to capacity, stability, and cost-effectiveness, with innovations in anode and cathode materials, as well as electrolytes, paving the way for the practical application of sodium-ion technology in large-scale energy storage systems.
Transition metal phosphates have attracted significant attention in recent years, primarily due to their unique structural characteristics derived from a framework of linked polyhedra, such as octahedra and tetrahedra [11,12,13,14,15,16]. This intricate structure facilitates efficient sodium ion diffusion and allows for the tuning of various properties to optimize electrochemical performance. NVP is a promising cathode material for sodium-ion batteries because of its high theoretical capacity, excellent structural stability, superior sodium conductivity, and robust thermal stability [17,18,19,20]. However, NVP exhibits low electronic conductivity, restricting its practical application. Various strategies have been implemented to overcome this limitation to enhance the electronic conductivity and operating voltage of NVP, thereby improving its electrochemical performance and the energy density of sodium-ion batteries [17]. Carbon coating is a promising method for enhancing the electronic conductivity of composite materials [17]. However, it does not address the intrinsic electronic and ionic conductivity of NVP [17]. Doping with heteroatoms is considered an effective modification strategy. Currently, doping NVP materials often involves introducing transition metal atoms to replace Na and V sites, which can significantly expand the lattice spacing, increase the voltage plateau, and enhance electronic conductivity [21,22,23,24]. In Si-substituted NVP, vanadium remains in a trivalent state, confirming the preservation of Na-ions in the synthesized compositions. The increased lattice volume, combined with the retained Na-ions, enhances Na-ion conductivity [22]. The substitution of Cr for vanadium in the NVP structure greatly enhanced the structural stability of the electrode, while the addition of a uniform, thin carbon coating improved its electrical conductivity. Remarkably, the NVCrP@C cathode demonstrated high electrochemical activity, enabled by multiple V3+/V4+/V5+ redox reactions induced by Cr3+ substitution, across a broad voltage range of 2.5–4.1 V [24].
Na-ion mobility is a crucial factor in determining the rate performance and cycling stability of Na-ion batteries. However, there is no consensus on the exact migration pathways of Na [25,26,27]. Early experimental studies indicated that Na-ion migration is relatively sluggish during electrochemical reactions. Theoretical studies, using different methodologies, have predicted different Na-ion migration pathways, each with distinct activation energies. While numerous experimental studies have investigated the electrochemical properties, preparation methods, cycling stability, and enhancements in electronic conductivity, relatively few theoretical studies have focused on Na-ion migration and the doping behavior of NVP. In a previous DFT simulation study, the substitution of P atoms with B atoms introduced positive doping, which enhanced structural stability, as indicated by increased cohesive energy, while also leading to lattice shrinkage. Furthermore, the incorporation of B atoms into the lattice raised the oxidation state of V atoms, resulting in higher operating voltages in B-doped NVP. However, the lattice shrinkage slightly impeded rate performance [28].
Atomistic simulation techniques based on either classical pair-wise potentials or density functional theory (DFT) are instrumental in elucidating the complex mechanisms behind defect formation, ion transport, and doping behavior in NVP. By providing critical insights, these simulations guide the development of high-performance electrode materials, contributing to more efficient and sustainable energy storage solutions in SIBs. Previous simulation studies on oxide materials have showcased the capability of atomistic techniques to uncover specific properties, including defect dynamics, electronic structures, and diffusion pathways, which are often challenging to explore experimentally [29,30,31,32,33,34,35]. Notably, the Li-ion diffusion pathways predicted in LiFePO4 using atomistic simulations demonstrated excellent agreement with neutron diffraction experiments [31].
This study combines classical pair-wise potentials and DFT to provide a detailed examination of the defect, diffusion, and dopant properties of NVP. The insights gained from this computational modeling will contribute to a deeper understanding of the electrochemical behavior and support the development of high-performance sodium-ion batteries.

2. Computational Methods

A classical simulation technique, utilizing the GULP code (General Utility Lattice Program) [36], was used to investigate intrinsic defects and Na+ ion diffusion. DFT simulations as implemented in the VASP code (Vienna Ab initio Simulation Package) [37] were conducted to compute charges on the relaxed configurations, validate the trends in defect energetics, and evaluate dopant solubility together with electronic structures.
The GULP code calculates the total lattice energy by accounting for both long-range and short-range interactions, with short-range ionic interactions modeled using Buckingham potentials (see Table 1) [38,39,40,41]. Structural relaxation was achieved through the Broyden–Fletcher–Goldfarb–Shanno (BFGS) algorithm [42]. The Mott–Littleton method [43] was used to model point defects and ion migration. Na-ion diffusion was simulated by defining two neighboring Na vacancy sites as the initial and final positions, with seven interstitial sites forming a linear diffusion path. Defect energies at seven positions along this path were calculated, taking the midpoint between two adjacent Na vacancy sites as the central reference to reduce systematic errors. The activation energy was determined by calculating the energy difference between the highest local energy at the saddle point along the diffusion path and the minimum energy required for Na vacancy formation, which is reported as the activation energy for the diffusion pathway.
All calculations in the DFT simulation employed a plane-wave basis set with a 500 eV cut-off, projected augmented wave (PAW) pseudopotentials [44], and a 4 × 4 × 4 Monkhorst–Pack [45] k-point mesh. The exchange-correlation energy was described using the PBE-GGA (Perdew, Burke, and Ernzerhof generalized gradient approximation) [46]. Full geometry optimizations were performed with the conjugate gradient algorithm [47] to a force tolerance of 0.001 eV/Å. Bader charge analysis [48] was conducted to estimate the effective charges on atoms in the relaxed configurations. All defects in the DFT simulations were treated as neutral.

3. Results

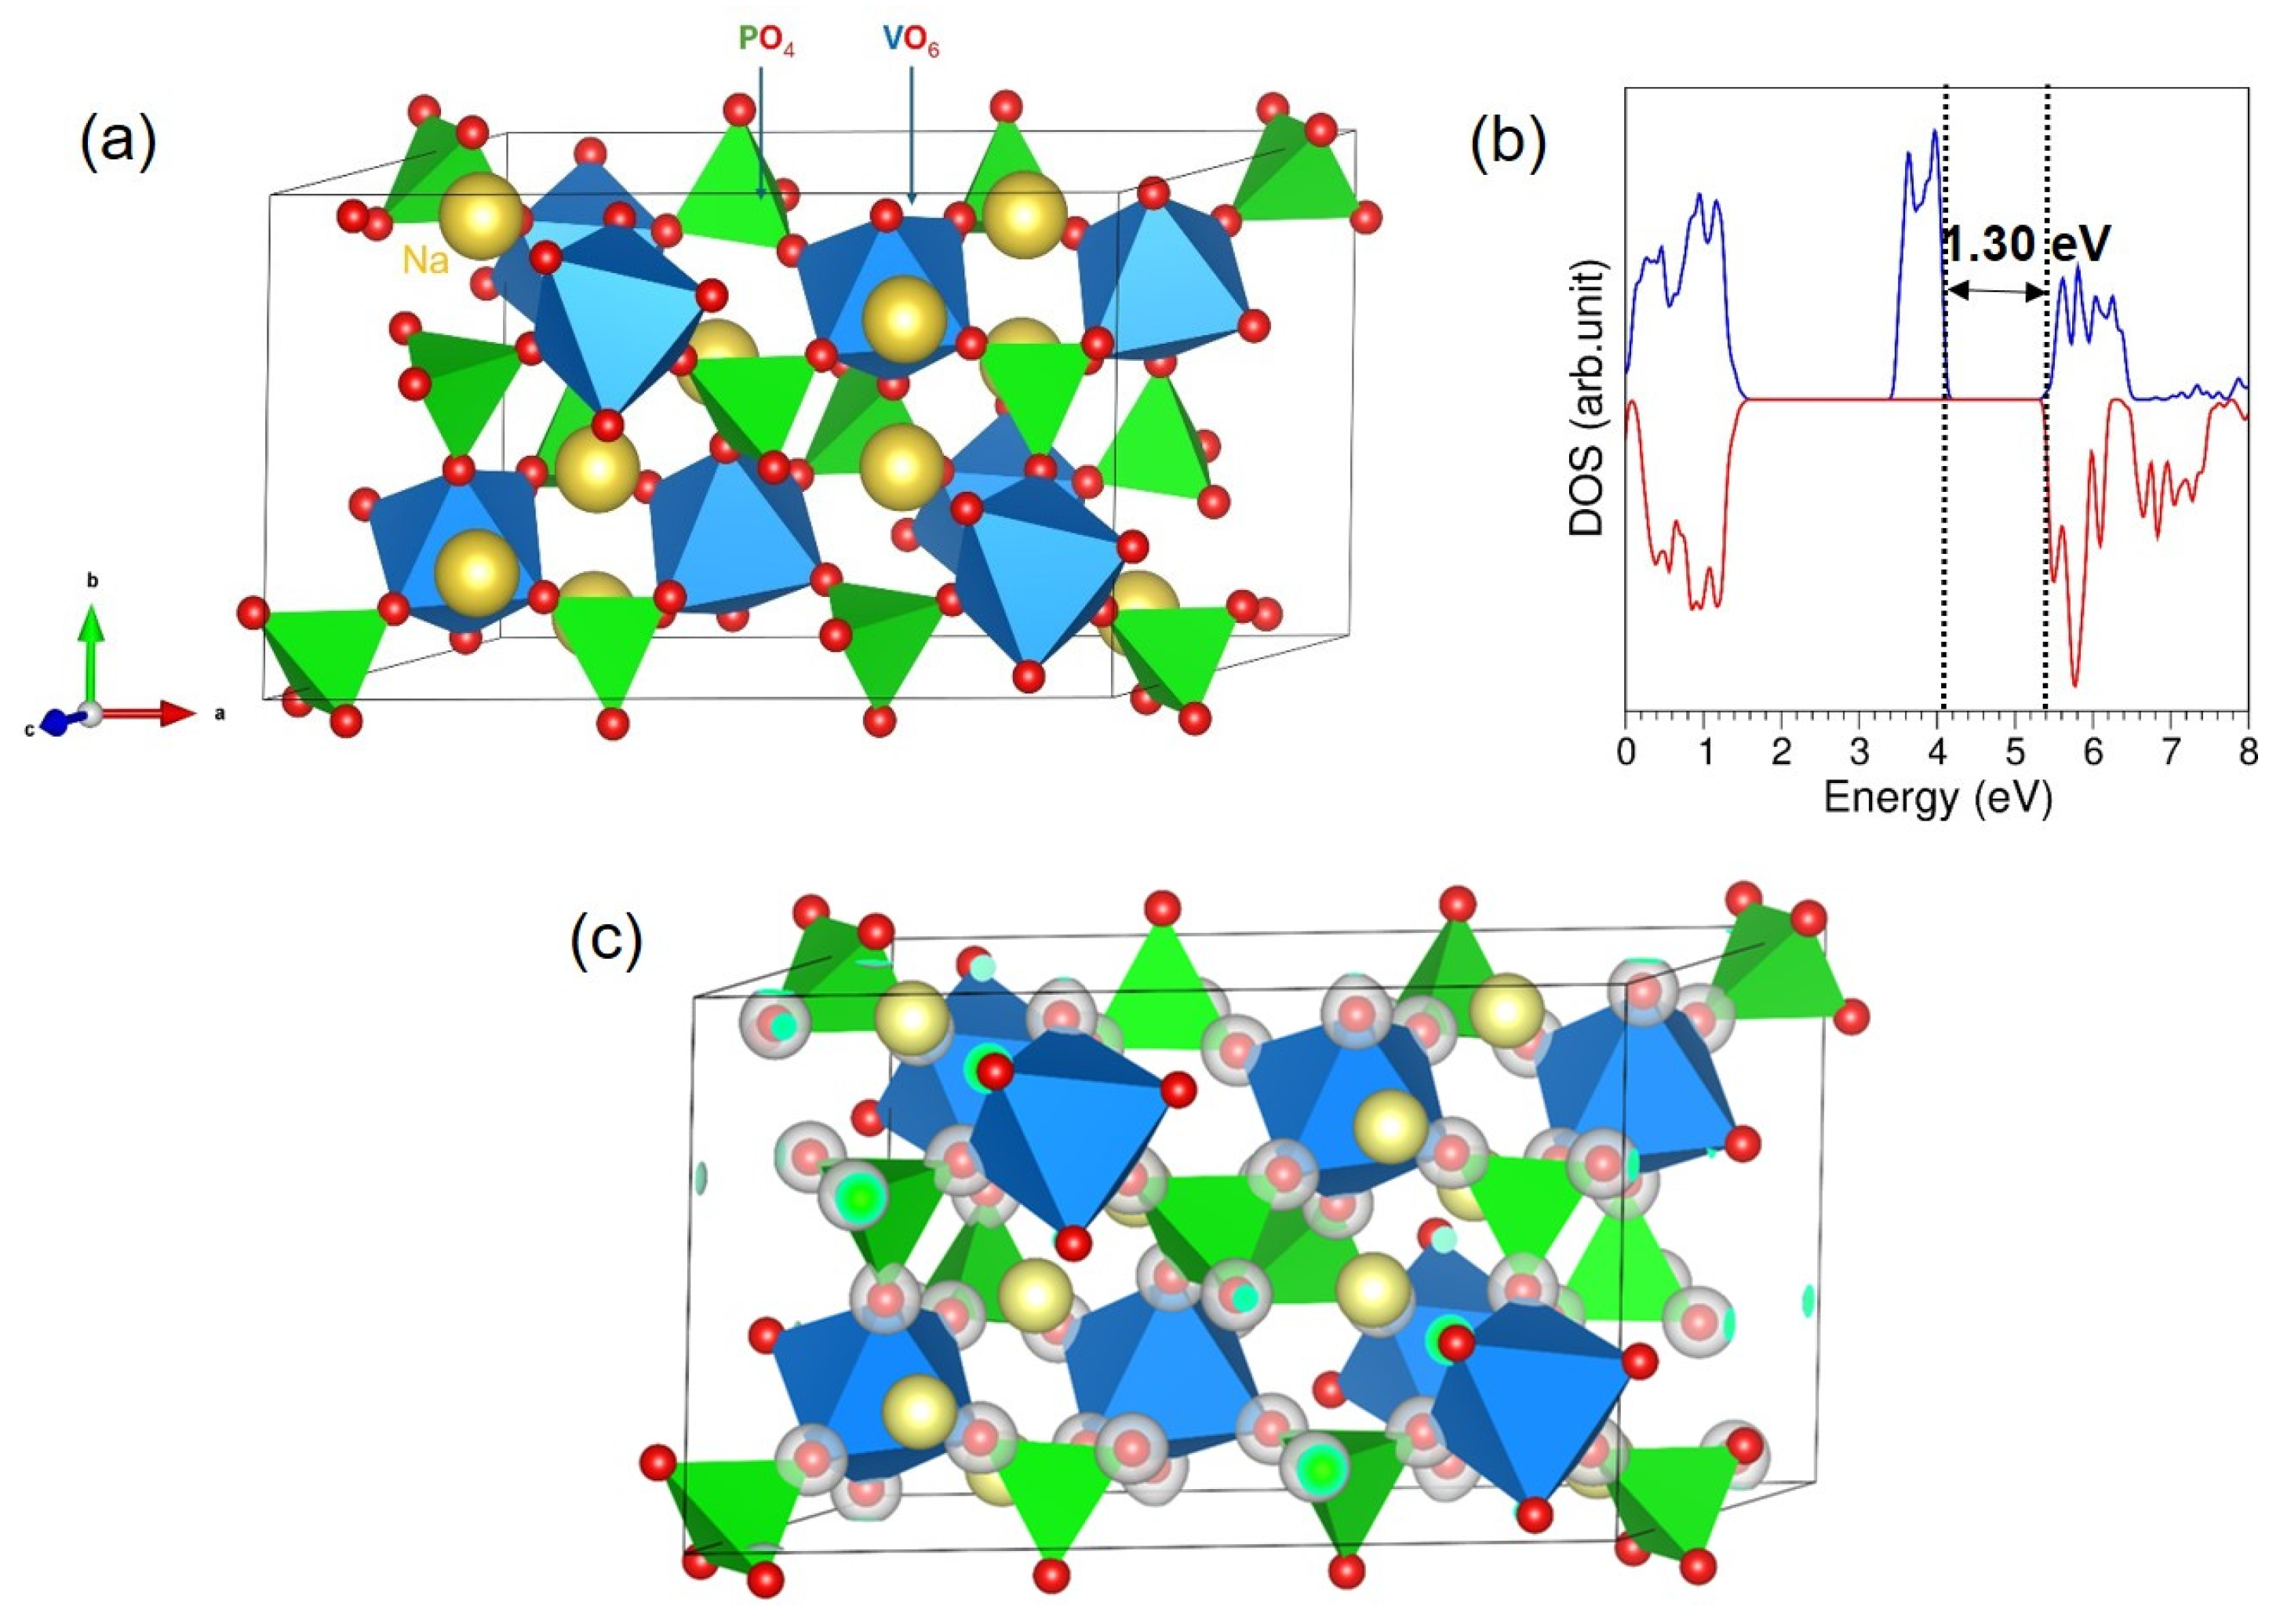
3.1. Crystal Structure of NVP

The crystal structure of NVP exhibits a monoclinic crystallographic structure with space group C2/c [49] (lattice parameters a = 15.34 Å, b = 8.93 Å, c = 8.89 Å, α = γ = 90.00°, β = 125.20°). The structure and chemical environment of P is formed by tetrahedral units of four O atoms and V is made up of octahedral units of six O atoms (see Figure 1a). The experimentally observed monoclinic crystal structure, derived from a combination of laboratory and synchrotron X-ray powder diffraction with single-crystal X-ray diffraction, was validated to assess the effectiveness of the classical pair potentials in the GULP code and the pseudopotentials and basis sets in the VASP code. The equilibrium lattice constants calculated using both methods agree with the experimental values (Table 2).
The total density of states (DOS) plot indicates that NVP exhibits semiconducting behavior with a band gap of 1.30 eV. Previous simulation studies have reported slightly larger band gap values, including 1.875 eV [50], 2.04 eV [51], 2.06 eV [52], 2.19 eV [53], and 3.32 eV [54]. This underestimation of the band gap is a common characteristic of GGA-PBE DFT calculations. The GGA + U method can increase the band gap by incorporating U Coulomb interactions.
Table 3 represents Bader charges for the elements in NVP. The Bader charge is a method used in computational chemistry to assign partial charges to atoms in a molecule or material based on the electron density. A Bader charge of +1.00 calculated for Na means it has lost approximately one electron and is in a +1 oxidation state. Vanadium has a Bader charge of +2.14. This suggests vanadium has lost more than two electrons, implying a +2 to +3 oxidation state. A Bader charge of +5.00 corresponds to a +5 oxidation state for P, which is typical for phosphorus in compounds like phosphate ( P O 4 3 ). A typical −2 oxidation state for oxygen indicates it has gained nearly two electrons.

3.2. Intrinsic Defects

Defects are localized imperfections within an otherwise perfect crystal lattice, typically occurring at or around a single lattice site on an atomic scale. These irregularities have a significant impact on the properties of materials, including mechanical strength, electrical conductivity, and chemical reactivity. Defects can be classified into main types including point defects, line defects, and planar defects [55]. Point defects are irregularities that occur at a single location within the crystal lattice and are commonly categorized as vacancies, interstitials, and substitutions. Line defects, or dislocations, are characterized by disruptions in the atomic arrangement along a one-dimensional line within the lattice. Unlike point defects, which affect individual atoms, line defects influence the mechanical properties of materials, particularly their strength and ductility. Planar defects refer to disruptions in the atomic arrangement along a two-dimensional plane in the crystal structure, such as grain boundaries, stacking faults, and twin boundaries. These defects can significantly impact material properties like strength, hardness, and resistance to deformation, as they influence the movement of dislocations within the lattice.
Formation energies for various point defects, including vacancies and interstitials, were calculated to investigate the electrochemical behavior of this electrode material. These point defects were combined to determine the energies associated with Frenkel and Schottky defects. Additionally, the anti-site defect, which can significantly impact the material’s ion diffusion properties, was also calculated. The following reaction equations describe the intrinsic defect processes using Kröger–Vink notation [56].
N a   F r e n k e l : N a N a X V N a + N a i
V   F r e n k e l : V V X V V + V i
O   F r e n k e l : O O X V O + O i
S c h o t t k y : 3 N a N a X + 2 V V X + 3 P P X + 12 O O X 3 V N a + 2 V V + 3 V P + 12 V O + N a 3 V 2 ( P O 4 ) 3
N a 2 O   S c h o t t k y : 2 N a N a i X + O O X 2 V N a + V O + N a 2 O
V 2 O 3   S c h o t t k y : 2 V V X + 3 O O X 2 V V + 3   V O + V 2 O 3
P 2 O 5   S c h o t t k y : 2 P P X + 5 O O X 2 V P + 5   V O + P 2 O 5
N a / V   a n t i s i t e   ( i s o l a t e d ) : N a N a X + V V X N a V + V N a
N a / V   a n t i s i t e   ( c l u s t e r ) : N a N a X + V V X { N a V + V N a } X
Table 4 displays the computed defect energies, highlighting that the predominant defect in this material is the Na Frenkel defect. These calculations reveal that the energy required to form a Na Frenkel defect is relatively low compared to other defects. This suggests that the Na-ion movement will be facilitated by vacancy formation. Using both methods, a similar trend is observed. The trend in defect energies is consistent across both methods, despite some differences in the absolute values. This variation is partly due to the absence of electronic contributions in the classical method and the treatment of defect charges as neutral in the DFT approach. The Na/V anti-site cluster is the second most favorable defect. The binding energy, calculated as the difference between the isolated and clustered forms of the anti-site defect, is −2.09 eV in the classical method and −2.23 eV in the DFT method. This negative binding energy indicates that the isolated defects spontaneously form clusters without requiring any additional energy. Anti-site defects have been confirmed through both experimental and computational studies in various oxide materials. The Schottky defects, except for the Na2O Schottky, were found to have higher energies (>4 eV), indicating that they are unlikely to occur at standard room temperature.

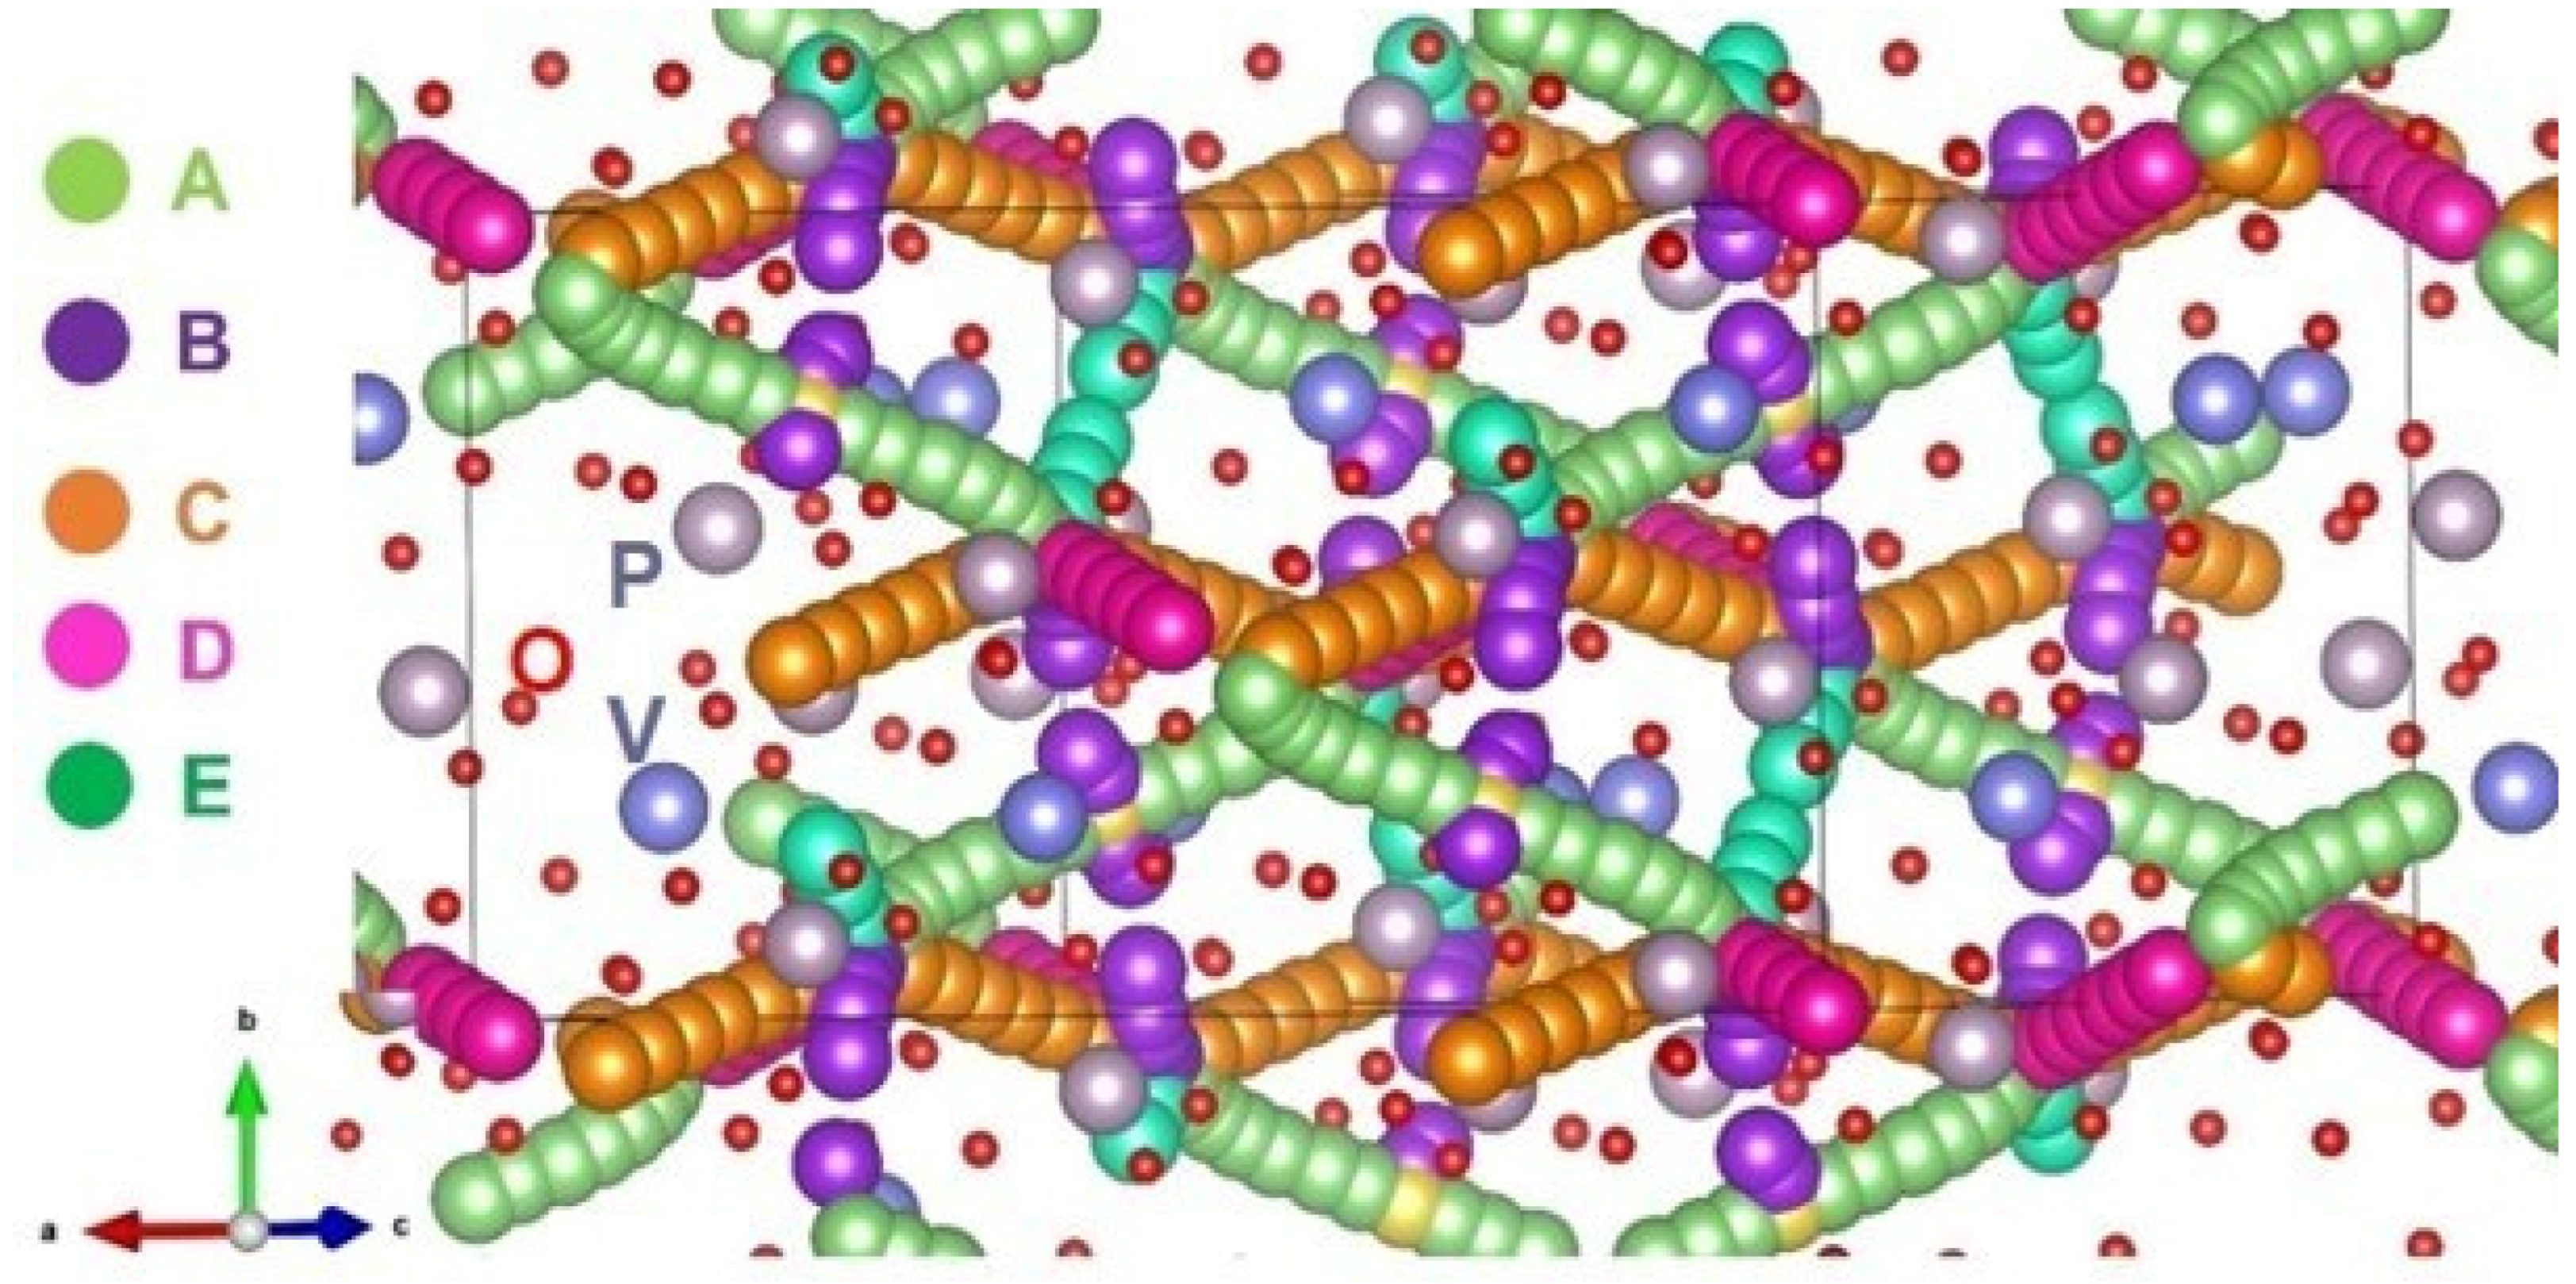
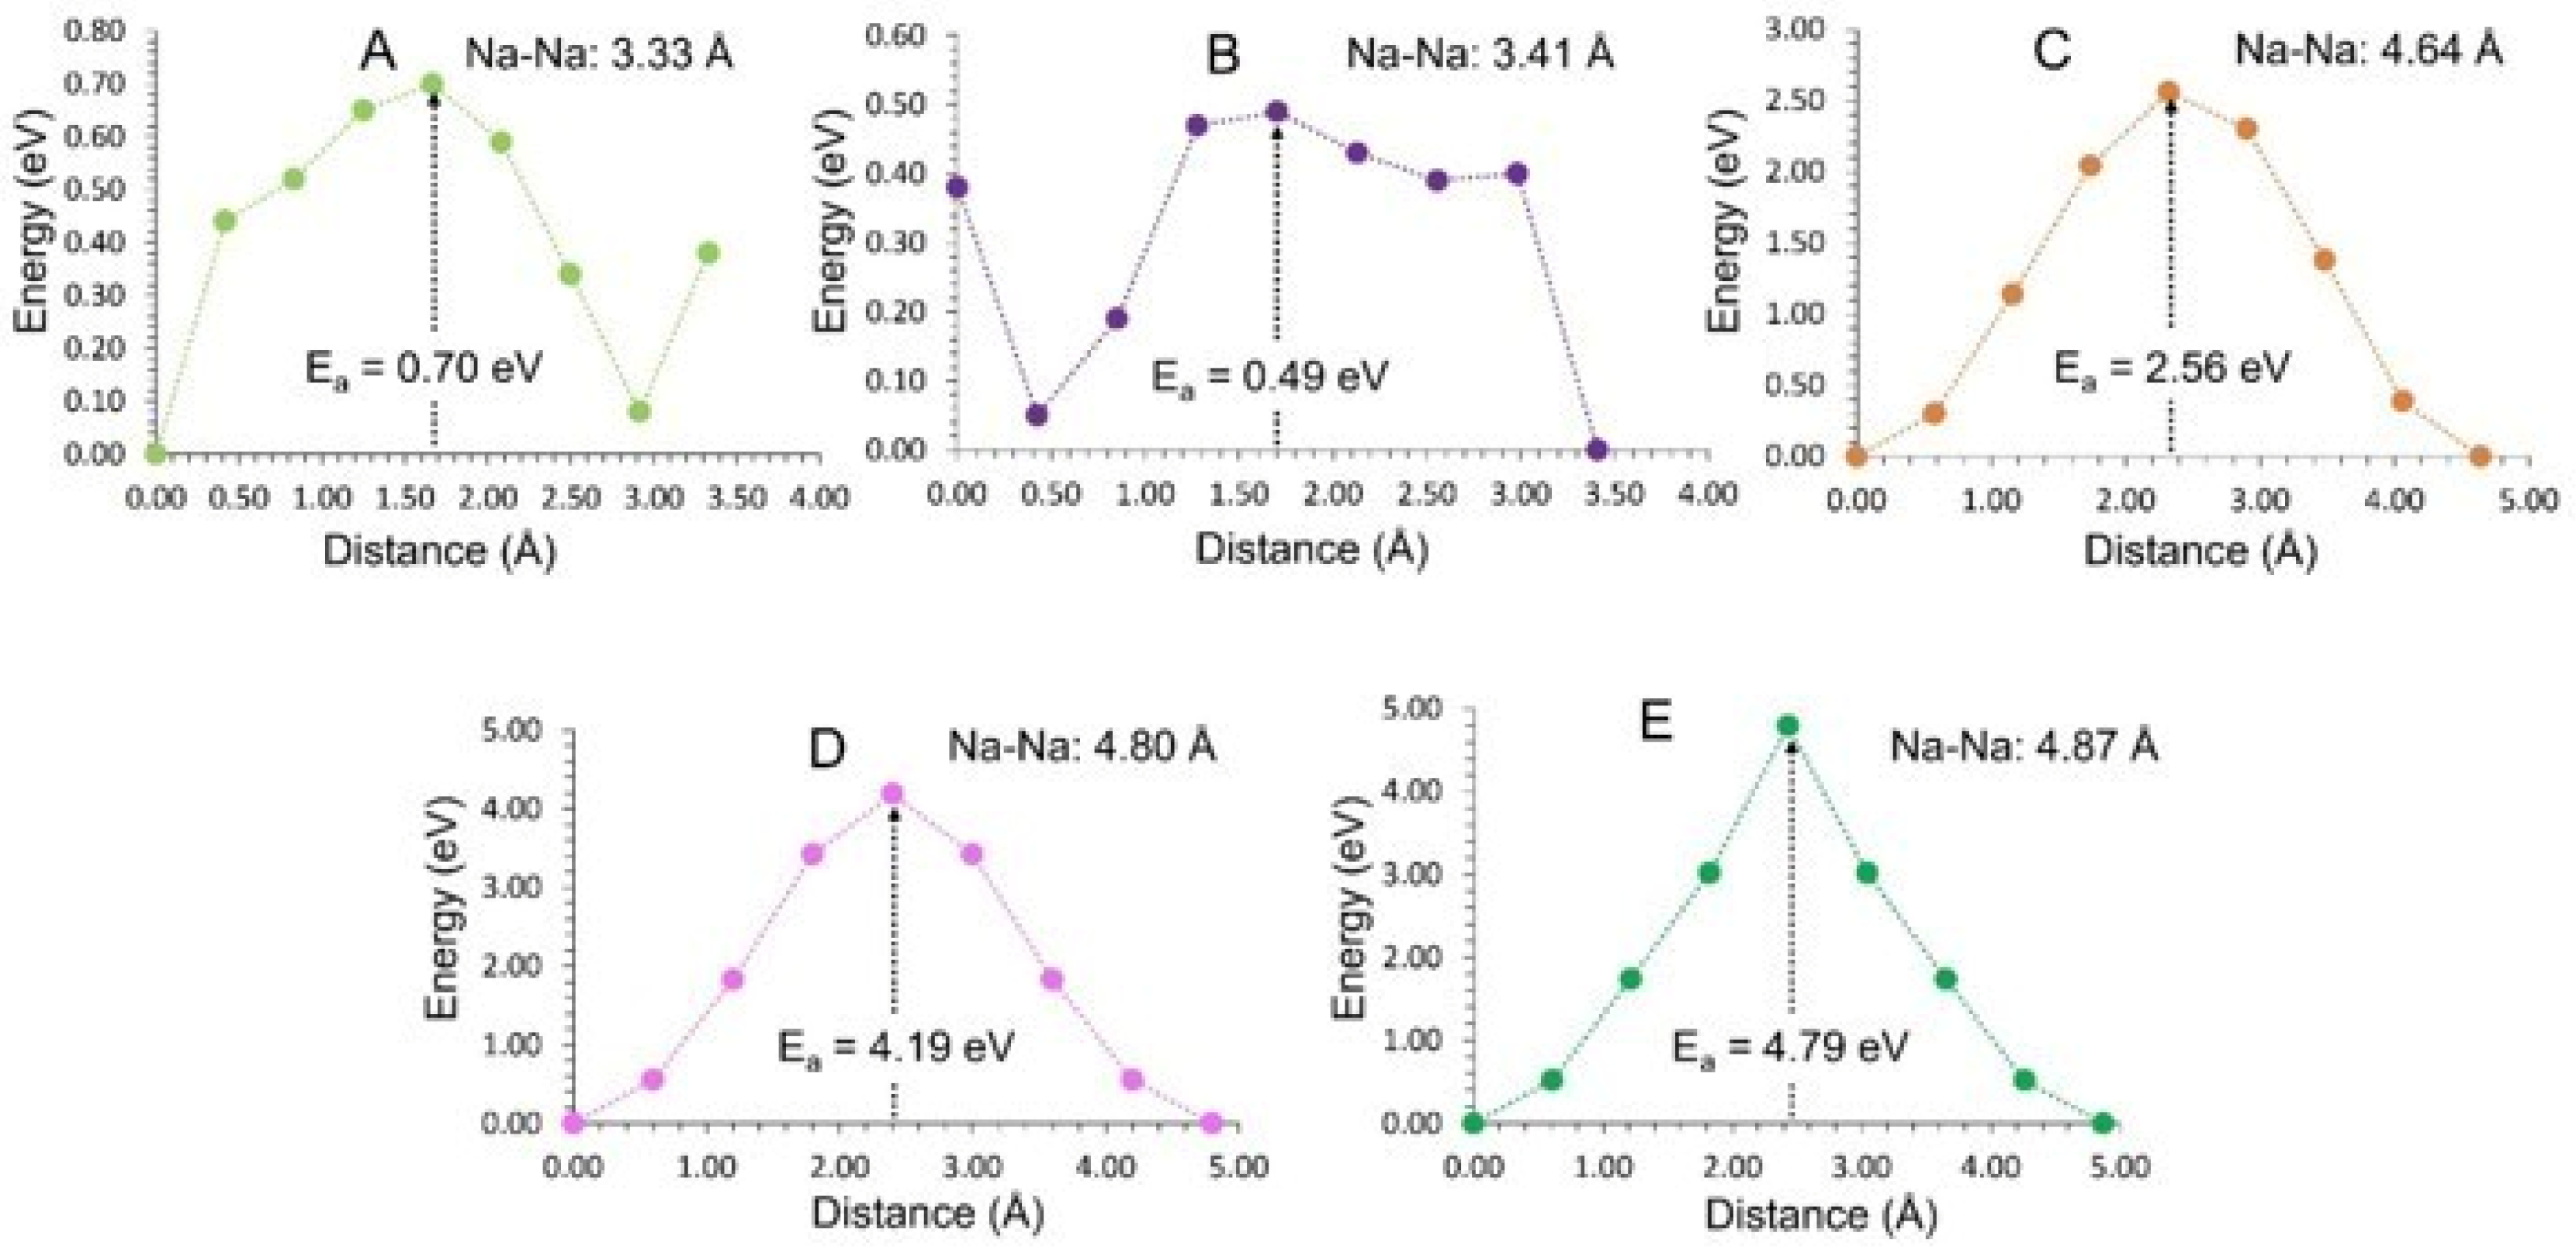
3.3. Diffusion of Na-Ions

Developing an efficient battery requires identifying an electrode or electrolyte material with high ionic conductivity and low activation energy. To evaluate its potential as a high-rate cathode material, static atomistic simulations based on the classical pair potentials were performed considering several plausible diffusion pathways that contribute to sodium ion conduction. Experimentally, exploring these pathways is challenging. Through classical atomic-level simulations, five distinct local Na hops involved in vacancy-mediated Na-ion migration (see Figure 2) were identified. The separations and corresponding activation energies for these local Na hops are presented in Table 5.
The migration pathway for Na+ ions through a local Na-Na hop with the lowest activation energy is found to be 0.49 eV. A lower activation energy value typically indicates that sodium ion migration along this pathway is more favorable and occurs more easily. The second most favorable local hop for sodium migration has an activation energy value of 0.70 eV (see Figure 3). Higher activation energies for other migration paths suggest that ion movement through these routes is less favorable compared to the lower-energy pathways. These activation energy values are crucial in determining the ease of ion diffusion, which plays a key role in the design and optimization of materials for applications like energy storage.
Various long-range diffusion pathways connecting local Na+ hops were also explored. One such pathway, denoted (A→B→A→B), follows a zig-zag pattern with Na-ion movement occurring within the bc plane (see Figure 2). The overall activation energy for this long-range migration pathway is the lowest at 0.70 eV. This information sheds light on the structural characteristics of the diffusion route, with the zig-zag pattern suggesting a specific directionality of Na-ion movement. In contrast, the activation energies for other long-range hops are significantly higher (>2.00 eV), making those pathways less favorable for ion migration. Consequently, these high-energy paths are excluded from further discussion.
In the literature, varying migration energies have been reported through alternative mechanisms. These discrepancies may arise from factors such as neutral defects or the size of the supercell. In the present simulation method, the migrating ions were treated as fully charged. The activation energies reported in a prior theoretical study show reasonable agreement with the values obtained in this work [27,57]. In a previous DFT simulation study, concerted ion-exchange ion migration was found to be the preferred pathway with an activation energy of 12.78 kcal mol−1 (0.55 eV). While this shows reasonable agreement with the values reported for paths A and B, a direct comparison is not feasible since their study considered a rhombohedral crystal structure, whereas the present study focuses on a monoclinic structure.

3.4. Solution of Dopants

Ionic dopants are commonly employed to enhance both the ionic conductivity and the chemical as well as mechanical stability of materials. Doping with various elemental additives has been used to improve the kinetics in Na3V2(PO4)3 [21,22,23,24,58,59,60]. In this study, isovalent and aliovalent dopants were explored to identify and forecast potentially valuable candidates for future experimental investigations. The work in this study involved DFT simulations for the dopant calculations. We utilized charge-compensating defects like interstitials, vacancies, and lattice energies to compute solution energies, thereby aiding in the prediction of promising dopants for further exploration.

3.4.1. Monovalent Dopants

The process of incorporating monovalent dopants (represented as M, where M = Li, K, or Rb) into the Na site can be expressed using the following equation in Kröger–Vink notation:
0.5 M 2 O + N a N a X M N a X + 0.5 N a 2 O
Table 6 compares the properties of three dopants (Li+, K+, and Rb+) based on their ionic radius, Bader charge, solution energy, M-O bond distances, and percentage change in lattice volume. Li+, with the smallest ionic radius of 0.76 Å, exhibits the highest Bader charge (+1.00 |e|), the shortest M-O bond distances (2.31 Å and 2.38 Å), and causes a slight lattice contraction (−0.65%). Its solution energy is the highest at 1.82 eV per dopant, indicating less favorable incorporation into the lattice. In contrast, K+ (1.38 Å) and Rb+ (1.52 Å) have lower Bader charges (+0.85 |e|), longer M-O bond distances (2.57 Å, 2.68 Å for K+; 2.66 Å, 2.78 Å for Rb+), and lead to lattice expansion (+1.51% for K+ and +2.19% for Rb+). Among the three, K+ has the lowest solution energy (1.24 eV per dopant), suggesting the most energetically favorable doping. These trends highlight how ionic size and charge influence lattice behavior and dopant incorporation energetics. In an experimental study by Shen et al. [61], strategic doping of an appropriate amount of K+ ions into the NVP was implemented. This modification increases the unit cell volume, thereby widening the sodium ion migration channels and significantly enhancing the rate performance of NVP.
The electronic DOS plot indicates that the doped configuration remains a semiconductor (see Figure 4a), though the band gap is slightly reduced to 1.10 eV. The states of K do not influence the Fermi level, as the p-states of K are localized deeper within the valence band (see Figure 4b). Additionally, the electron charge density is not concentrated on the K atom, which is consistent with its positive Bader charge (see Figure 4c).

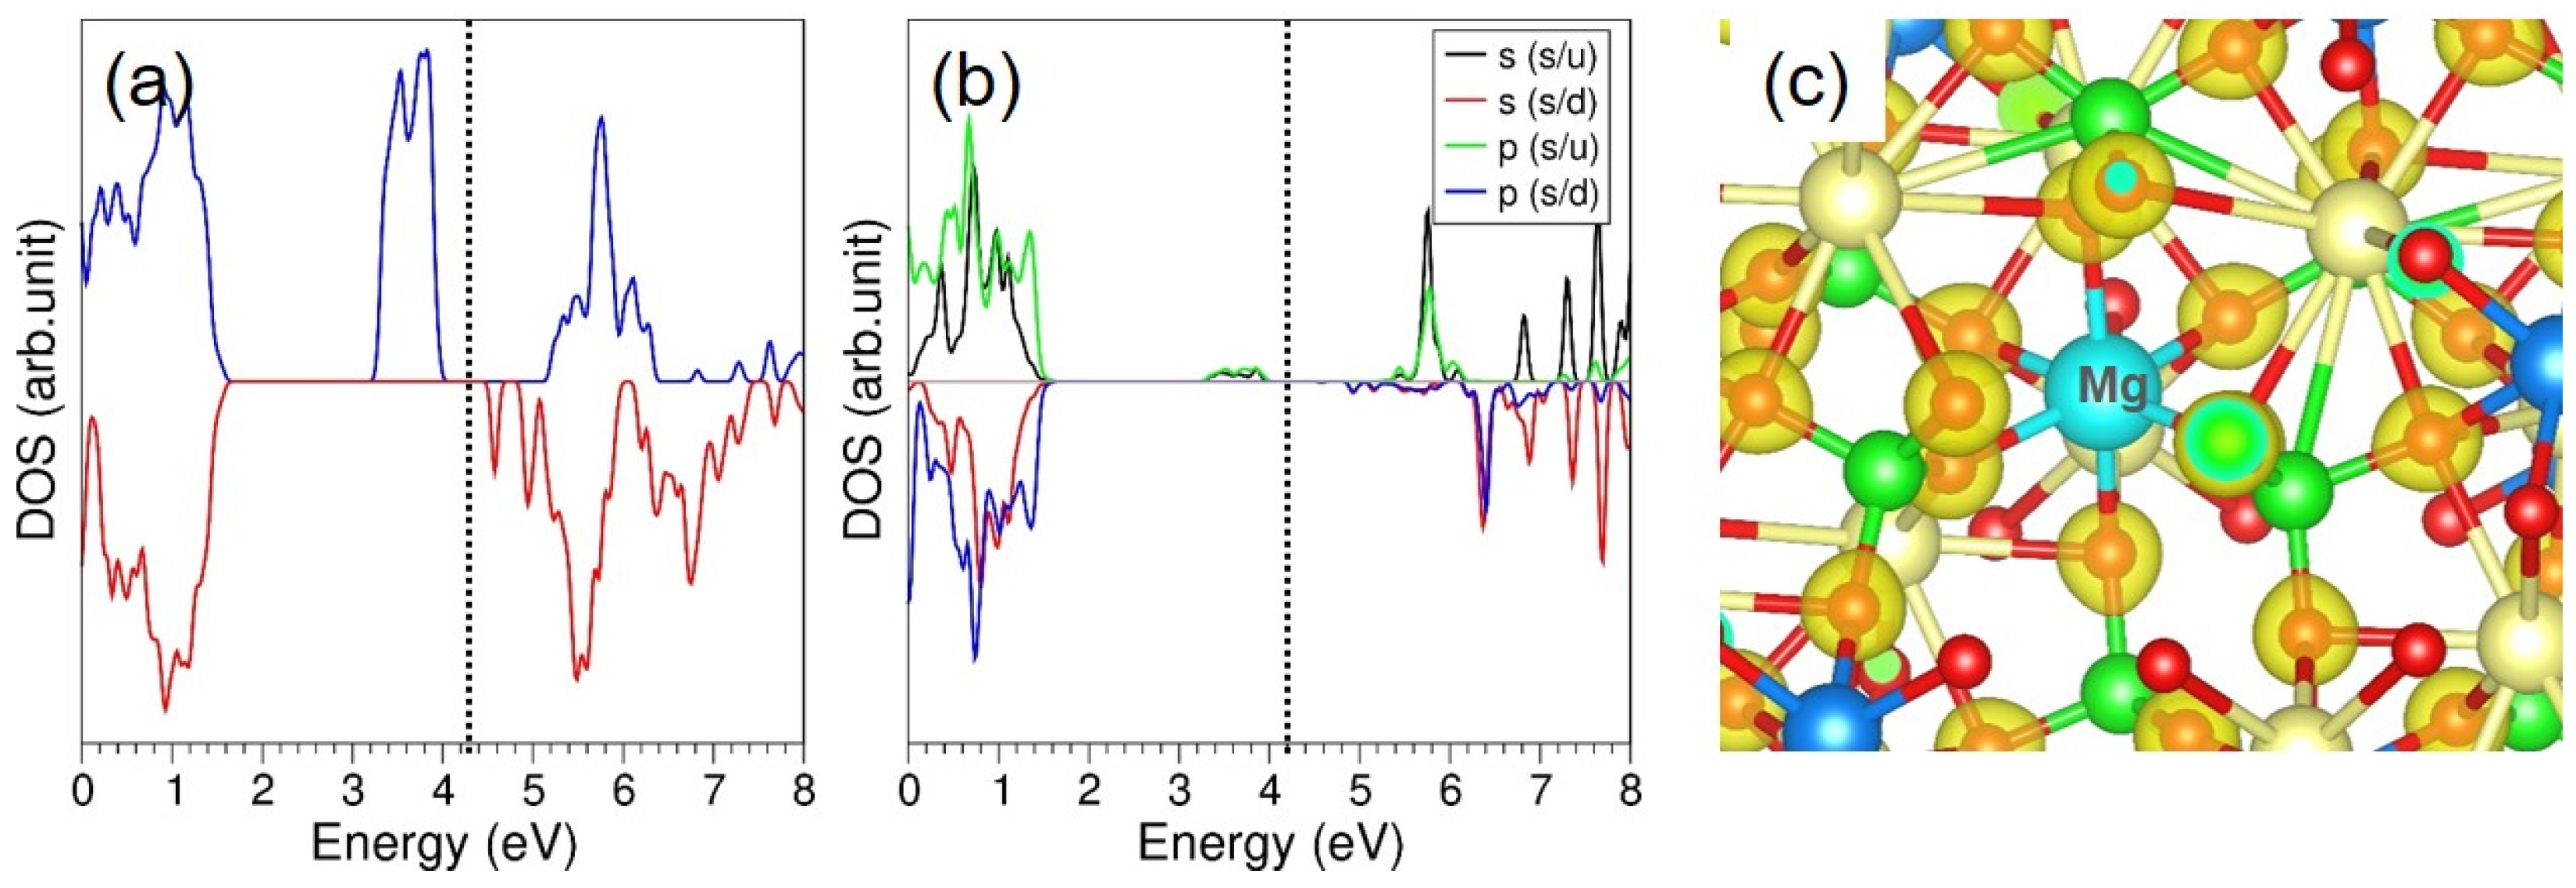
3.4.2. Divalent Dopants

Divalent dopants on the V site can introduce additional Na in the form of interstitials, as described by the following defect equation. This strategy has the potential to improve the capacity of rechargeable SIBs.
M O + V V X + 0.5 N a 2 O M V + N a i + 0.5 V 2 O 3
Table 7 compares various divalent dopants (Fe2+, Ni2+, Zn2+, Mn2+, Mg2+, Ca2+, Sr2+, and Ba2+). Smaller dopants, such as Fe2+ (0.61 Å) and Ni2+ (0.69 Å), have the highest Bader charges (+1.65 |e| and +1.40 |e|, respectively), shorter M-O bond distances (1.96–2.13 Å), and result in slight lattice contractions (−0.72% for Fe2+ and −0.21% for Ni2+). Their positive solution energies indicate less favorable incorporation, particularly for Fe2+ (1.42 eV). In contrast, larger dopants, such as Ca2+, Sr2+, and Ba2+, with ionic radii of 1.06 Å, 1.18 Å, and 1.35 Å, respectively, exhibit lower solution energies (−0.35, −0.15, and −0.02 eV, respectively) and significantly longer M-O bond distances (up to 2.62 Å for Ba2+). These dopants cause notable lattice expansions, reaching +2.67% for Ba2+. Mid-sized dopants, such as Mn2+ (0.83 Å) and Mg2+ (0.86 Å), balance these extremes, showing moderate lattice effects. Notably, Mn2+ achieves the most favorable solution energy (−0.15 eV) among the transition metal dopants. Overall, the trends reveal that ionic radius, Bader charge, and bond lengths dictate the structural and energetic impact of dopants, with larger ions leading to lattice expansion and smaller ions inducing contraction. The most favorable dopant is predicted to be Mg2+. This favorable dopant has been experimentally verified [62]. A series of Mg-doped Na3V2−xMgx(PO4)3 (x = 0–0.1) cathode materials were synthesized using a sol–gel method [61]. The study revealed that Mg doping significantly enhances the ionic and electronic conductivity of Na3V2−xMgx(PO4)3, leading to substantial improvements in both rate and cycling performance.
Doping Mg at the V site introduces additional peaks in the band gap, leading to a slight reduction in its width (see Figure 5a). However, the Mg states contribute minimally to these peaks (see Figure 5b). The electron density remains primarily localized throughout the lattice (see Figure 5c).

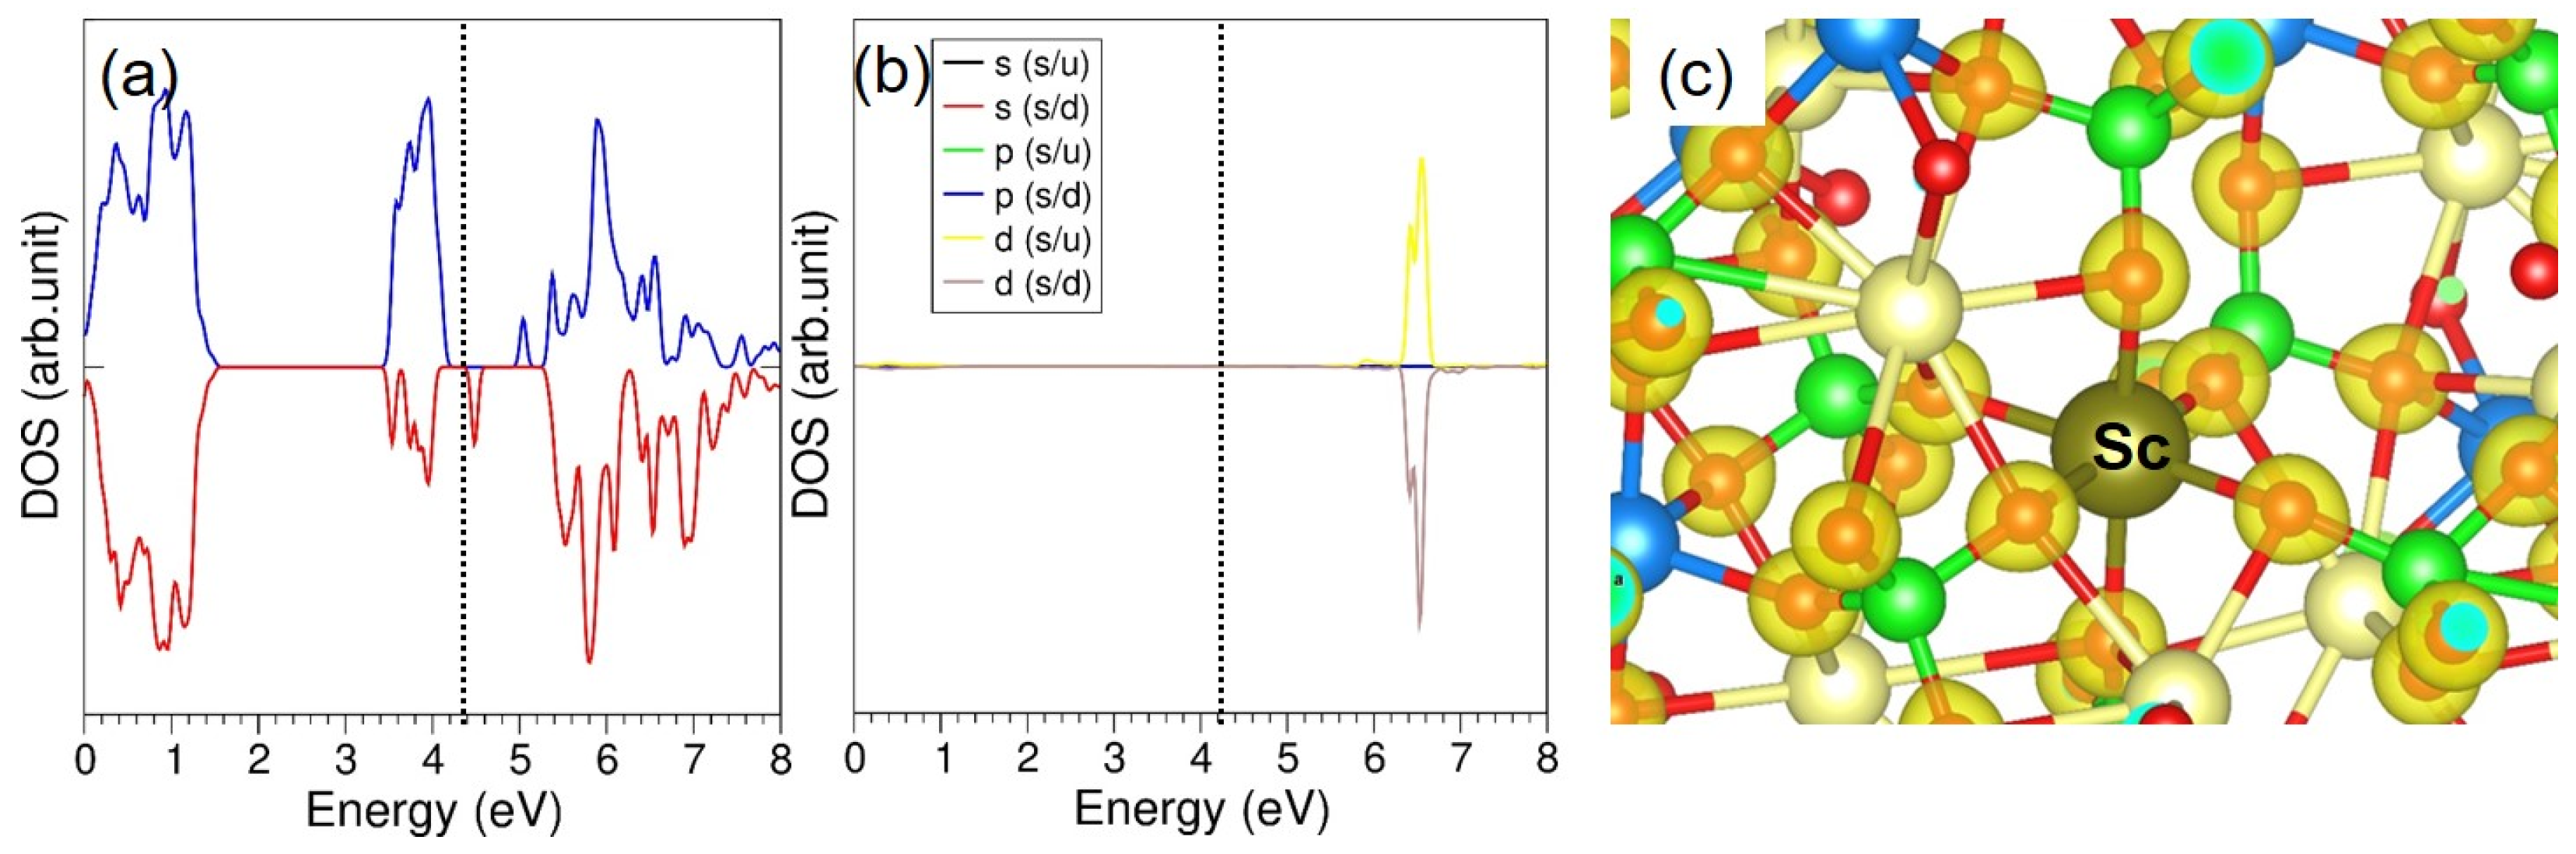
3.4.3. Trivalent Dopants

Next, trivalent dopants (M = Al, Ga, Sc, In, Y, and La) were considered on the V site. The process can be explained through the following equation.
0.5   M 2 O 3 + V V X M V X + 0.5 V 2 O 3
Smaller dopants (Al3+ and Ga3+) result in slight contraction (−0.73% and −0.21%, respectively), possibly due to the smaller ionic radius compared to the host material (see Table 8). La3+ (1.03 Å) causes a more significant expansion of the host lattice (+2.53%), which may be attributed to the larger ionic radius and the resulting strain in the lattice. The solution energies of Sc3+ and La3+ are more negative (indicating higher stability in the host), while Ga3+ and In3+ have less negative or even near-zero solution energies, suggesting less stability in the lattice. Most dopants have a formal charge of +3, but Sc3+ and Y3+ have slightly lower Bader charges, indicating that these dopants might have a slightly reduced effect on the electronic properties of NVP compared to others with a full +3 charge.
Experimental doping of Sc at the V site formed a more stable ScO6 octahedral unit, attributed to the larger ionic radius of Sc and stronger oxygen affinity [63]. This modification significantly improved the structural stability of NVP, protecting Na+ active sites from the effects of high current densities and consequently enhancing both rate performance and cycling stability. The exothermic solution energies calculated for the other dopants have also been experimentally validated. When Al3+ and Ga3+ ions substitute at the V site, their stronger and shorter M–O chemical bonds enhance the oxygen ligand framework (MO6), improving overall structural stability [64]. Meanwhile, larger metal ions such as Sc3+ and Y3+ act as pillar ions, reinforcing the crystal structure and widening Na+ diffusion channels, which results in higher ionic conductivity [64].
Sc-doped NVP demonstrates semiconducting behavior, characterized by the emergence of additional peaks and a reduction in the band gap (Figure 6a). The absence of Sc-related peaks within the band gap indicates that Sc occupies the V site with minimal distortion (Figure 6b). Furthermore, no charge transfer from the lattice to Sc is observed (Figure 6c).

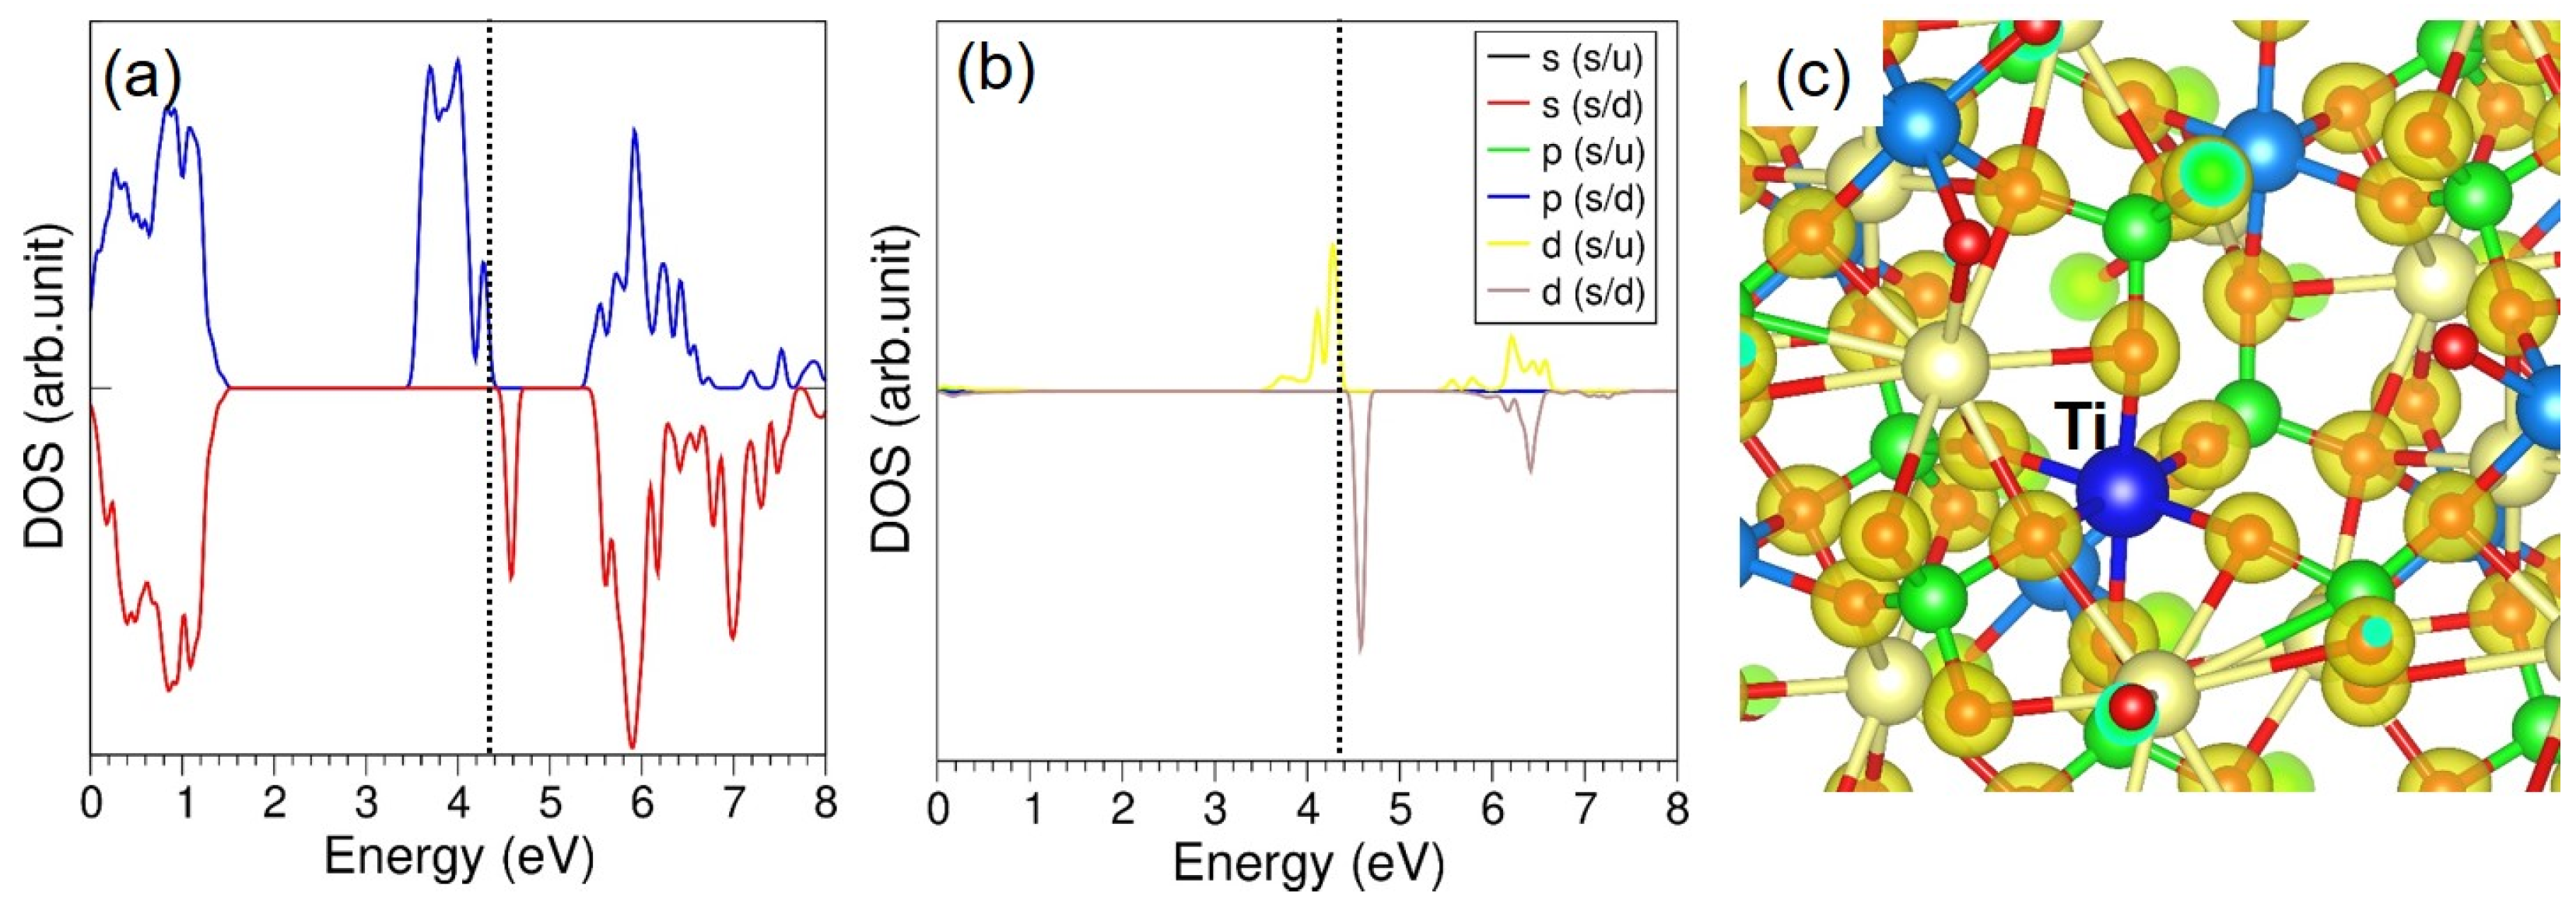
3.4.4. Tetravalent Dopants

The doping process of tetravalent dopants (M = Si, Ge, Ti, Sn, and Ce) over the trivalent V sites yields sodium vacancies. This can be shown using the following equation.
M O 2 + V V X + N a N a X M V + V N a + 0.5 V 2 O 3 + 0.5 N a 2 O
Through this doping process, we can further induce the vacancy-mediated Na ion diffusion in the material. Table 9 reports the solution energies of various dopants. Ti has the lowest solution energy due to having an almost similar ionic radius to V (0.64 Å). Table 10 lists the lattice parameters of various doped crystalline structures.
Si4+ has the smallest ionic radius and a high charge (+4), leading to a solution energy of 4.19 eV (relatively high, indicating it may not be as easily incorporated into the NVP) and a volume change of −1.00%, which means it causes a contraction in the host material due to its small size and strong ionic charge. Ge4+ is slightly larger and has a similar +4 charge, but its solution energy is lower (3.14 eV), suggesting it is more easily incorporated than Si4+. Volume change is near zero (+0.02%), indicating a minimal effect on the volume of the host. Ti4+ has a lower charge of +2.54, which results in a relatively lower solution energy (2.39 eV) and a ΔV/V of +0.56%, suggesting that it slightly expands the host lattice. Sn4+ with a +4 charge has a solution energy of 2.85 eV, indicating a reasonably stable incorporation in the host material. Its ΔV/V of +1.36% suggests it causes a more noticeable expansion of the lattice. Ce4+, with a +2.37 Bader charge and a solution energy of 2.94 eV, is the largest dopant in this group. The ΔV/V is +3.30%, indicating it leads to the most significant expansion of the lattice, possibly due to its relatively large size and lower charge.
Ti4+ has been extensively utilized to replace V3+ in phosphate cathode materials [65,66]. Ti-doped NVP materials have been synthesized using a one-step solid-phase method [66]. The incorporation of Ti4+ reduces the structural volume due to the smaller size of the TiO6 octahedron compared to the VO6 octahedron, while also generating additional Na site vacancies, which enhance Na+ diffusion [67].
The d-states of Ti interact with the Fermi level, resulting in a reduced band gap (Figure 7a,b). The doped Ti forms a TiO6 octahedron without any charge accumulation (Figure 7c).

4. Conclusions

This study employs a combination of simulation approaches, utilizing classical pairwise potentials and DFT, to investigate intrinsic defect processes, vacancy-assisted Na ion diffusion, and dopant incorporation in NVP. The Na Frenkel defect is identified as an energetically favorable process. Na ion diffusion follows a long-range zig-zag pathway with an activation energy of 0.70 eV, indicating moderate diffusivity. Solution energy calculations reveal that K on the Na site and Sc on the V site are energetically favorable substitutions. Introducing the divalent dopant Mg2+ at the V site appears promising for generating sodium interstitials. Additionally, incorporating the tetravalent dopant Ti4+ at the V site enhances Na vacancy concentration and reduces the band gap, thereby improving electronic conductivity.

Author Contributions

Conceptualization, V.S. and P.A.; methodology, V.S.; software, V.S.; validation, V.S., N.K. and P.I.; formal analysis, V.S.; investigation, V.S.; data curation, V.S.; writing—original draft preparation, V.S.; writing—review and editing, N.K.; visualization, P.A.; supervision, P.I. All authors have read and agreed to the published version of the manuscript.

Funding

This research received no external funding.

Data Availability Statement

Data are contained within the article, further inquiries can be directed to the corresponding author.

Acknowledgments

We thank the Department of Chemistry, University of Jaffna for providing computational facilities and support.

Conflicts of Interest

The authors declare no conflicts of interest.

References

  1. Goodenough, J.B.; Park, K.-S. The Li-Ion Rechargeable Battery: A Perspective. J. Am. Chem. Soc. 2013, 135, 1167–1176. [Google Scholar] [CrossRef] [PubMed]
  2. Khan, T.; Garg, A.K.; Gupta, A.; Madan, A.K.; Jain, P.K. Comprehensive review on latest advances on rechargeable batteries. J. Energy Storage 2023, 57, 106204. [Google Scholar] [CrossRef]
  3. Berg, E.J.; Villevieille, C.; Streich, D.; Trabesinger, S.; Novák, P. Rechargeable Batteries: Grasping for the Limits of Chemistry. J. Electrochem. Soc. 2015, 162, A2468. [Google Scholar] [CrossRef]
  4. Nitta, N.; Wu, F.; Lee, J.T.; Yushin, G. Li-ion battery materials: Present and future. Mater. Today 2015, 18, 252–264. [Google Scholar] [CrossRef]
  5. Manthiram, A. An Outlook on Lithium Ion Battery Technology. ACS Cent. Sci. 2017, 3, 1063–1069. [Google Scholar] [CrossRef]
  6. Grey, C.P.; Hall, D.S. Prospects for lithium-ion batteries and beyond—A 2030 vision. Nat. Commun. 2020, 11, 6279. [Google Scholar] [CrossRef]
  7. Singh, B.; Wang, Z.; Park, S.; Gautam, G.S.; Chotard, J.-N.; Croguennec, L.; Carlier, D.; Cheetham, A.K.; Masquelier, C.; Canepa, P. A chemical map of NaSICON electrode materials for sodium-ion batteries. J. Mater. Chem. A 2021, 9, 281–292. [Google Scholar] [CrossRef]
  8. Qiu, S.; Wu, X.; Wang, M.; Lucero, M.; Wang, Y.; Wang, J.; Yang, Z.; Xu, W.; Wang, Q.; Gu, M.; et al. NASICON-type Na3Fe2(PO4)3 as a low-cost and high-rate anode material for aqueous sodium-ion batteries. Nano Energy 2019, 64, 103941. [Google Scholar] [CrossRef]
  9. Zhang, H.; Qin, B.; Buchholz, D.; Passerini, S. High-Efficiency Sodium-Ion Battery Based on NASICON Electrodes with High Power and Long Lifespan. ACS Appl. Energy Mater. 2018, 1, 6425–6432. [Google Scholar] [CrossRef]
  10. Li, C.; Li, R.; Liu, K.; Si, R.; Zhang, Z.; Hu, Y.-S. NaSICON: A promising solid electrolyte for solid-state sodium batteries. Interdiscip. Mater. 2022, 1, 396–416. [Google Scholar] [CrossRef]
  11. Zhang, X.; Rui, X.; Chen, D.; Tan, H.; Yang, D.; Huang, S.; Yu, Y. Na3V2(PO4)3: An advanced cathode for sodium-ion batteries. Nanoscale 2019, 11, 2556–2576. [Google Scholar] [CrossRef] [PubMed]
  12. Samigullin, R.R.; Zakharkin, M.V.; Drozhzhin, O.A.; Antipov, E.V. Thermal Stability of NASICON-Type Na3V2(PO4)3 and Na4VMn(PO4)3 as Cathode Materials for Sodium-ion Batteries. Energies 2023, 16, 3051. [Google Scholar] [CrossRef]
  13. Chen, G.; Huang, Q.; Wu, T.; Lu, L. Polyanion Sodium Vanadium Phosphate for Next Generation of Sodium-Ion Batteries—A Review. Adv. Funct. Mater. 2020, 30, 2001289. [Google Scholar] [CrossRef]
  14. Kanwade, A.; Gupta, S.; Kankane, A.; Srivastava, A.; Yadav, S.C.; Shirage, P.M. Phosphate-based cathode materials to boost the electrochemical performance of sodium-ion batteries. Sustain. Energy Fuels 2022, 6, 3114–3147. [Google Scholar] [CrossRef]
  15. Cheng, Q.; Zhao, X.; Yang, G.; Mao, L.; Liao, F.; Chen, L.; He, P.; Pan, D.; Chen, S. Recent advances of metal phosphates-based electrodes for high-performance metal ion batteries. Energy Storage Mater. 2021, 41, 842–882. [Google Scholar] [CrossRef]
  16. El Aggadi, S.; Ennouhi, M.; Boutakiout, A.; El Hourch, A. Progress towards efficient phosphate-based materials for sodium-ion batteries in electrochemical energy storage. Ionics 2023, 29, 2099–2113. [Google Scholar] [CrossRef]
  17. Zhu, Y.; Xu, H.; Ma, J.; Chen, P.; Chen, Y. The recent advances of NASICON-Na3V2(PO4)3 cathode materials for sodium-ion batteries. J. Solid State Chem. 2023, 317, 123669. [Google Scholar] [CrossRef]
  18. Akçay, T.; Häringer, M.; Pfeifer, K.; Anhalt, J.; Binder, J.R.; Dsoke, S.; Kramer, D.; Mönig, R. Na3V2(PO4)3—A Highly Promising Anode and Cathode Material for Sodium-Ion Batteries. ACS Appl. Energy Mater. 2021, 4, 12688–12695. [Google Scholar] [CrossRef]
  19. Duan, W.; Zhu, Z.; Li, H.; Hu, Z.; Zhang, K.; Cheng, F.; Chen, J. Na3V2(PO4)3@C core–shell nanocomposites for rechargeable sodium-ion batteries. J. Mater. Chem. A 2014, 2, 8668–8675. [Google Scholar] [CrossRef]
  20. Stüble, P.; Müller, C.; Klemens, J.; Scharfer, P.; Schabel, W.; Häringer, M.; Binder, J.R.; Hofmann, A.; Smith, A. Enabling Long-term Cycling Stability of Na3V2(PO4)3/C vs. Hard Carbon Full-cells. Batter. Supercaps 2024, 7, e202300375. [Google Scholar] [CrossRef]
  21. Wu, T.; Sun, J.; Yap, Z.Q.J.; Ke, M.; Lim, C.Y.H.; Lu, L. Substantial doping engineering in Na3V2-xFex(PO4)3 (0 ≤ x ≤ 0.15) as high-rate cathode for sodium-ion battery. Mater. Des. 2020, 186, 108287. [Google Scholar] [CrossRef]
  22. Pal, S.K.; Thirupathi, R.; Chakrabarty, S.; Omar, S. Improving the Electrochemical Performance of Na3V2(PO4)3 Cathode in Na-Ion Batteries by Si-Doping. ACS Appl. Energy Mater. 2020, 3, 12054–12065. [Google Scholar] [CrossRef]
  23. Shen, W.; Li, H.; Wang, C.; Li, Z.; Xu, Q.; Liu, H.; Wang, Y. Improved electrochemical performance of the Na3V2(PO4)3 cathode by B-doping of the carbon coating layer for sodium-ion batteries. J. Mater. Chem. A 2015, 3, 15190–15201. [Google Scholar] [CrossRef]
  24. Lee, J.; Park, S.; Park, Y.; Song, J.; Sambandam, B.; Mathew, V.; Hwang, J.-Y.; Kim, J. Chromium doping into NASICON-structured Na3V2(PO4)3 cathode for high-power Na-ion batteries. Chem. Eng. J. 2021, 422, 130052. [Google Scholar] [CrossRef]
  25. Cushing, B.L.; Goodenough, J.B. Li2NaV2(PO4)3: A 3.7 V Lithium-Insertion Cathode with the Rhombohedral NASICON Structure. J. Solid State Chem. 2001, 162, 176–181. [Google Scholar] [CrossRef]
  26. Song, W.; Ji, X.; Wu, Z.; Yang, Y.; Zhou, Z.; Li, F.; Chen, Q.; Banks, C.E. Exploration of ion migration mechanism and diffusion capability for Na3V2(PO4)2F3 cathode utilized in rechargeable sodium-ion batteries. J. Power Sources 2014, 256, 258–263. [Google Scholar] [CrossRef]
  27. Song, W.; Ji, X.; Wu, Z.; Zhu, Y.; Yang, Y.; Chen, J.; Jing, M.; Li, F.; Banks, C.E. First exploration of Na-ion migration pathways in the NASICON structure Na3V2(PO4)3. J. Mater. Chem. A 2014, 2, 5358–5362. [Google Scholar] [CrossRef]
  28. Wang, Q.; Wang, Q.; Zhang, M.; Han, B.; Zhou, C.; Chen, Y.; Lv, G. A first-principles investigation of the influence of polyanionic boron doping on the stability and electrochemical behavior of Na3V2(PO4)3. J. Mol. Model. 2019, 25, 96. [Google Scholar] [CrossRef]
  29. Clarke, M.J.; Dawson, J.A.; Mays, T.J.; Islam, M.S. Atomistic Insights into the Effects of Doping and Vacancy Clustering on Li-Ion Conduction in the Li3OCl Antiperovskite Solid Electrolyte. ACS Appl. Energy Mater. 2021, 4, 5094–5100. [Google Scholar] [CrossRef]
  30. Famprikis, T.; Dawson, J.A.; Fauth, F.; Clemens, O.; Suard, E.; Fleutot, B.; Courty, M.; Chotard, J.-N.; Islam, M.S.; Masquelier, C. A New Superionic Plastic Polymorph of the Na+ Conductor Na3PS4. ACS Mater. Lett. 2019, 1, 641–646. [Google Scholar] [CrossRef]
  31. Fisher, C.A.J.; Prieto, V.M.H.; Islam, M.S. Lithium Battery Materials LiMPO4 (M = Mn, Fe, Co, and Ni): Insights into Defect Association, Transport Mechanisms, and Doping Behavior. Chem. Mater. 2008, 20, 5907–5915. [Google Scholar] [CrossRef]
  32. Kuganathan, N.; Kordatos, A.; Anurakavan, S.; Iyngaran, P.; Chroneos, A. Li3SbO4 lithium-ion battery material: Defects, lithium-ion diffusion and tetravalent dopants. Mater. Chem. Phys. 2019, 225, 34–41. [Google Scholar] [CrossRef]
  33. Kuganathan, N.; Chroneos, A. Na3V(PO4)2 cathode material for Na ion batteries: Defects, dopants and Na diffusion. Solid State Ion. 2019, 336, 75–79. [Google Scholar] [CrossRef]
  34. Famprikis, T.; Bouyanfif, H.; Canepa, P.; Zbiri, M.; Dawson, J.A.; Suard, E.; Fauth, F.; Playford, H.Y.; Dambournet, D.; Borkiewicz, O.J.; et al. Insights into the Rich Polymorphism of the Na+ Ion Conductor Na3PS4 from the Perspective of Variable-Temperature Diffraction and Spectroscopy. Chem. Mater. 2021, 33, 5652–5667. [Google Scholar] [CrossRef] [PubMed]
  35. Treacher, J.C.; Wood, S.M.; Islam, M.S.; Kendrick, E. Na2CoSiO4 as a cathode material for sodium-ion batteries: Structure, electrochemistry and diffusion pathways. Phys. Chem. Chem. Phys. 2016, 18, 32744–32752. [Google Scholar] [CrossRef]
  36. Gale, J.D.; Rohl, A.L. The General Utility Lattice Program (GULP). Mol. Simul. 2003, 29, 291–341. [Google Scholar] [CrossRef]
  37. Kresse, G.; Furthmüller, J. Efficient iterative schemes for ab initio total-energy calculations using a plane-wave basis set. Phys. Rev. B 1996, 54, 11169–11186. [Google Scholar] [CrossRef]
  38. Bush, T.S.; Gale, J.D.; Catlow, C.R.A.; Battle, P.D. Self-consistent interatomic potentials for the simulation of binary and ternary oxides. J. Mater. Chem. 1994, 4, 831–837. [Google Scholar] [CrossRef]
  39. Lewis, G.V.; Catlow, C.R.A. Potential models for ionic oxides. J. Phys. C Solid State Phys. 1985, 18, 1149. [Google Scholar] [CrossRef]
  40. Sauer, J.; Schröder, K.P.; Termath, V. Comparing the acidities of microporous aluminosilicate and silico-aluminophosphate catalysts: A combined quantum mechanics-interatomic potential function study. Collect. Czech. Chem. Commun. 1998, 63, 1394–1408. [Google Scholar] [CrossRef]
  41. Bispo, G.F.D.C.; Jackson, R.A.; Valerio, M.E.G. Modelling of Intrinsic Defects in CaYAl3O7. Acta Phys. Pol. A 2018, 133, 781–784. [Google Scholar] [CrossRef]
  42. Gale, J.D. GULP: A computer program for the symmetry-adapted simulation of solids. J. Chem. Soc. Faraday Trans. 1997, 93, 629–637. [Google Scholar] [CrossRef]
  43. Mott, N.F.; Littleton, M.J. Conduction in polar crystals. I. Electrolytic conduction in solid salts. Trans. Faraday Soc. 1938, 34, 485–499. [Google Scholar] [CrossRef]
  44. Blöchl, P.E. Projector augmented-wave method. Phys. Rev. B 1994, 50, 17953–17979. [Google Scholar] [CrossRef]
  45. Monkhorst, H.J.; Pack, J.D. Special points for Brillouin-zone integrations. Phys. Rev. B 1976, 13, 5188–5192. [Google Scholar] [CrossRef]
  46. Perdew, J.P.; Burke, K.; Ernzerhof, M. Generalized Gradient Approximation Made Simple. Phys. Rev. Lett. 1996, 77, 3865–3868. [Google Scholar] [CrossRef]
  47. Press, W.H.; Teukolsky, S.A.; Vetterling, W.T.; Flannery, B.P. Numerical Recipes in C, 2nd ed.; The Art of Scientific Computing, Cambridge University Press: Cambridge, UK, 1992. [Google Scholar]
  48. Henkelman, G.; Arnaldsson, A.; Jónsson, H. A fast and robust algorithm for Bader decomposition of charge density. Comput. Mater. Sci. 2006, 36, 354–360. [Google Scholar] [CrossRef]
  49. Chotard, J.-N.; Rousse, G.; David, R.; Mentré, O.; Courty, M.; Masquelier, C. Discovery of a Sodium-Ordered Form of Na3V2(PO4)3 below Ambient Temperature. Chem. Mater. 2015, 27, 5982–5987. [Google Scholar] [CrossRef]
  50. Rao, X.; Wang, J.; Yang, M.-A.; Zhao, H.; Li, Z. A superior Na3V2(PO4)3-based cathode enhanced by Nb-doping for high-performance sodium-ion battery. APL Mater. 2022, 10, 010701. [Google Scholar] [CrossRef]
  51. Zhou, M.; Zhou, X.; Li, L.; Chen, X.; Qiao, Z.; Chou, S. Emerging high voltage V4+/V5+ redox reactions in Na3V2(PO4)3-based cathodes for sodium-ion batteries. Chem. Sci. 2024, 15, 8651–8663. [Google Scholar] [CrossRef]
  52. Aragón, M.J.; Lavela, P.; Ortiz, G.F.; Tirado, J.L. Benefits of Chromium Substitution in Na3V2(PO4)3 as a Potential Candidate for Sodium-Ion Batteries. ChemElectroChem 2015, 2, 995–1002. [Google Scholar] [CrossRef]
  53. Liu, X.; Feng, G.; Wang, E.; Chen, H.; Wu, Z.; Xiang, W.; Zhong, Y.; Chen, Y.; Guo, X.; Zhong, B. Insight into Preparation of Fe-Doped Na3V2(PO4)3@C from Aspects of Particle Morphology Design, Crystal Structure Modulation, and Carbon Graphitization Regulation. ACS Appl. Mater. Interfaces 2019, 11, 12421–12430. [Google Scholar] [CrossRef] [PubMed]
  54. Park, J.-S.; Kim, J.; Jo, J.H.; Myung, S.-T. Role of the Mn substituent in Na3V2(PO4)3 for high-rate sodium storage. J. Mater. Chem. A 2018, 6, 16627–16637. [Google Scholar] [CrossRef]
  55. Wang, J.; Zhao, X.; Zou, G.; Zhang, L.; Han, S.; Li, Y.; Liu, D.; Fernandez, C.; Li, L.; Ren, L.; et al. Crystal-defect engineering of electrode materials for energy storage and conversion. Mater. Today Nano 2023, 22, 100336. [Google Scholar] [CrossRef]
  56. Kröger, F.A.; Nachtrieb, N.H. The Chemistry of Imperfect Crystals. Phys. Today 1964, 17, 66–69. [Google Scholar] [CrossRef]
  57. Wang, Q.; Zhang, M.; Zhou, C.; Chen, Y. Concerted Ion-Exchange Mechanism for Sodium Diffusion and Its Promotion in Na3V2(PO4)3 Framework. J. Phys. Chem. C 2018, 122, 16649–16654. [Google Scholar] [CrossRef]
  58. Shao, Y.; Qian, Y.; Zhang, T.; Zhang, P.; Wang, H.; Qian, T.; Yan, C. Doping modification of sodium superionic conductor Na3V2(PO4)3 cathodes for sodium-ion batteries: A mini-review. Inorg. Chem. Front. 2024, 11, 4552–4567. [Google Scholar] [CrossRef]
  59. Kuniyil, N.C.M.; Robin, R.; Kumarasamy, R.K.; Nishanthi, S.T.; Sathish, M. Tailoring of High-Valent Sn-Doped Porous Na3V2(PO4)3/C Nanoarchitechtonics: An Ultra High-Rate Cathode for Sodium-Ion Batteries. ACS Appl. Mater. Interfaces 2024, 16, 28599–28612. [Google Scholar] [CrossRef]
  60. Fang, J.; Wang, S.; Yao, X.; Hu, X.; Wang, Y.; Wang, H. Ration design of porous Mn-doped Na3V2(PO4)3 cathode for high rate and super stable sodium-ion batteries. Electrochim. Acta 2019, 295, 262–269. [Google Scholar] [CrossRef]
  61. Shen, L.; Li, Y.; Hu, C.; Huang, Z.; Wang, B.; Wang, Y.; Liu, Q.; Ye, F. A high-rate cathode material based on potassium-doped Na3V2(PO4)3 for high/low-temperature sodium-ion batteries. Mater. Today Chem. 2023, 30, 101506. [Google Scholar] [CrossRef]
  62. Li, H.; Yu, X.; Bai, Y.; Wu, F.; Wu, C.; Liu, L.-Y.; Yang, X.-Q. Effects of Mg doping on the remarkably enhanced electrochemical performance of Na3V2(PO4)3 cathode materials for sodium ion batteries. J. Mater. Chem. A 2015, 3, 9578–9586. [Google Scholar] [CrossRef]
  63. Dong, H.; Liu, C.; Huang, Q.; Sun, Z.; Liang, T.; Fan, C.; Chen, Y. Sc3+ substituted Na3V2(PO4)3 on N-doped porous carbon skeleton boosting high structural stability and superior electrochemical performance for full sodium ion batteries. J. Colloid Interface Sci. 2024, 667, 371–384. [Google Scholar] [CrossRef] [PubMed]
  64. Hu, J.; Li, X.; Liang, Q.; Xu, L.; Ding, C.; Liu, Y.; Gao, Y. Optimization Strategies of Na3V2(PO4)3 Cathode Materials for Sodium-Ion Batteries. Nano-Micro Lett. 2024, 17, 33. [Google Scholar] [CrossRef] [PubMed]
  65. Tong, S.; Pan, H.; Liu, H.; Zhang, X.; Liu, X.; Jia, M.; Kang, Y.; Yuan, Y.; Du, X.; Yan, X. Titanium Doping Induced the Suppression of Irreversible Phase Transformation at High Voltage for V-based Phosphate Cathodes of Na-Ion Batteries. ChemSusChem 2023, 16, e202300244. [Google Scholar] [CrossRef]
  66. Wang, D.; Bie, X.; Fu, Q.; Dixon, D.; Bramnik, N.; Hu, Y.-S.; Fauth, F.; Wei, Y.; Ehrenberg, H.; Chen, G.; et al. Sodium vanadium titanium phosphate electrode for symmetric sodium-ion batteries with high power and long lifespan. Nat. Commun. 2017, 8, 15888. [Google Scholar] [CrossRef]
  67. Ding, H.; He, X.; Tao, Q.; Teng, J.; Li, J. Ti-Doped Na3V2(PO4)3 Activates Additional Ti3+/Ti4+ and V4+/V5+ Redox Pairs for Superior Sodium Ion Storage. Energy Fuels 2023, 37, 4132–4142. [Google Scholar] [CrossRef]
Figure 1. (a) Crystal structure of Na3V2(PO4)3, (b) its DOS plot, and (c) charge density plot showing the accumulation of electron density on the oxygen atoms. The vertical dot lines corresponds to the Fermi energy level.
Physchem 05 00001 g001
Figure 2. Na ion migration pathways with different local Na-Na hops.
Physchem 05 00001 g002
Figure 3. Activation energies calculated for five different Na-Na local hops.
Physchem 05 00001 g003
Figure 4. (a) Total DOS plot calculated for the K-doped NVP, (b) atomic DOS plot of K, and (c) the charge density plot showing the localization of electrons around the dopant. The vertical dot lines corresponds to the Fermi energy level.
Physchem 05 00001 g004
Figure 5. (a) Total DOS plot calculated for the Mg-doped NVP, (b) atomic DOS plot of Mg, and (c) the charge density plot showing the localization of electrons around the dopant. The vertical dot lines corresponds to the Fermi energy level.
Physchem 05 00001 g005
Figure 6. (a) Total DOS plot calculated for the Sc-doped NVP, (b) atomic DOS plot of Sc, and (c) the charge density plot showing the localization of electrons around the dopant. The vertical dot lines corresponds to the Fermi energy level.
Physchem 05 00001 g006
Figure 7. (a) Total DOS plot calculated for the Ti-doped NVP, (b) atomic DOS plot of Ti, and (c) the charge density plot showing the localization of electrons around the dopant. The vertical dot lines corresponds to the Fermi energy level.
Physchem 05 00001 g007
Table 1. Buckingham potential parameters used to model the crystal structure of NVP [38,39,40,41].
InteractionA/eVρC/eV·Å6Y/eK/eV·Å−2
Na+–O2−1271.5040.30000.001.0099,999
V3+–O2−1790.200.30610.003.0036.27
P5+–O2−1273.420170.322720.005.0099,999
O2–O2−22764.00.149027.879–2.92281.64857
Two-body [Φij (rij) = Aij exp (−rij/ρij) − Cij/rij6] where A, ρ, and C are parameters reproducing the experimental data. The values of Y and K are shell charges and spring constants, respectively.
Table 2. Calculated lattice parameters of NVP together with corresponding experimental values.
Lattice PropertiesCalculatedExperiment [49]|∆|(%)
ClassicalDFTClassicalDFT
a (Å)15.2315.2515.340.670.59
b (Å)8.798.868.921.560.67
c (Å)8.908.858.890.150.45
α = γ (°)90.090.090.00.000.00
β (°)124.9125.8125.20.230.47
V (Å3)977.76969.1994.791.712.58
Table 3. Bader charges calculated on the atoms in the relaxed configuration of NVP.
AtomBader Charge (e)
Na+1.00
V+2.14
P+5.00
O−1.86
Table 4. Calculated reaction energies for intrinsic defect processes.
Defect ProcessEquation NumberDefect Energy (eV)/Defect
ClassicalDFT
Na Frenkel10.461.41
V Frenkel24.655.20
O Frenkel34.254.75
Schottky45.786.21
Na2O Schottky53.463.86
V2O3 Schottky64.975.25
P2O5 Schottky710.4012.46
Na/V Anti-site (isolated)83.043.96
Na/V Anti-site (cluster)90.951.73
Table 5. Calculated Na-Na separations together with their corresponding activation energies.
Na Local HopNa-Na Separation (Å)Activation Energy (eV)
A3.330.70
B3.410.49
C4.642.56
D4.804.19
E4.874.79
Table 6. Solution energies calculated for the monovalent dopants substituted on the Na site. Ionic radius, Bader charges on the dopant atoms, M-O distances, and volume change are also provided.
Dopant Ionic Radius of Dopant Ion (Å)Bader Charge on Dopant (|e|)Solution Energy (eV)/DopantM-O Distance
(Å)
Δ V V × 100 ( % )
Li+0.76+1.001.822.31, 2.38−0.65
K+1.38+0.851.242.57, 2.68+1.51
Rb+1.52+0.851.312.66, 2.78+2.19
Table 7. Solution energies calculated for the divalent dopants substituted on the V site. Ionic radius, Bader charges on the dopant atoms, M-O distances, and volume change are also provided.
Dopant Ionic Radius of Dopant Ion (Å)Bader Charge on Dopant (|e|)Solution Energy (eV)/DopantM-O Distance
(Å)
Δ V V × 100 ( % )
Fe2+0.61+1.651.421.96–2.02−0.72
Ni2+0.69+1.400.342.04–2.13−0.21
Zn2+0.74+1.470.422.10–2.24+0.11
Mn2+0.83+1.76−0.152.09–2.19+0.50
Mg2+0.86+2.00−0.372.05–2.12−0.07
Ca2+1.06+1.60−0.352.26–2.35+1.68
Sr2+1.18+1.63−0.152.41–2.54+2.18
Ba2+1.35+1.62−0.022.53–2.62+2.67
Table 8. Solution energies calculated for the trivalent dopants substitutionally doped on the V site. Ionic radius, Bader charges on the dopant atoms, M-O distances, and volume change are also provided.
Dopant IonsIonic Radius of Dopant Ion (Å)Bader Charge on Dopant (|e|)Solution Energy (eV)/DopantM-O Distance
(Å)
Δ V V × 100 ( % )
Al3+0.54+3.00−0.321.84–1.93−0.73
Ga3+0.62+3.00−0.081.98–2.02−0.21
Sc3+0.75+2.12−0.721.98–2.13+0.97
In3+0.81+3.00−0.132.18–2.21+1.41
Y3+0.90+2.27−0.572.11–2.27+2.24
La3+1.03+2.20−0.312.36–2.49+2.53
Table 9. Solution energies calculated for the monovalent dopants substituted on the Na site. Ionic radius, Bader charges on the dopant atoms, M-O distances, and volume change are also provided.
Dopant IonsIonic Radius of Dopant Ion (Å)Bader Charge on Dopant (|e|)Solution Energy (eV)/DopantM-O Distance Δ V V × 100 ( % )
Si4+0.40+4.004.191.74–1.85−1.00
Ge4+0.53+4.003.141.86–1.97+0.02
Ti4+0.61+2.542.391.91–2.07+0.56
Sn4+0.69+4.002.852.01–2.11+1.36
Ce4+0.87+2.372.942.14–2.33+3.30
Table 10. Crystalline structures of NVP upon doping of various dopants.
DopantLattice Parameters
a (Å)b (Å)c (Å)α (°)β (°)γ (°)
Li15.258.868.8689.9125.990.0
K15.238.238.9690.1125.290.0
Rb15.218.829.0190.1124.990.1
Fe15.218.838.8390.0125.890.0
Ni15.248.848.8490.0125.890.0
Zn15.268.858.8590.0125.890.0
Mn15.288.878.8690.1125.889.9
Mg15.248.858.8590.1125.890.0
Ca15.358.908.8990.2125.789.8
Sr15.438.898.8890.2125.689.7
Ba15.438.828.8589.8125.189.8
Al15.208.828.8289.9125.790.1
Ga15.248.858.8490.0125.790.0
Sc15.298.888.8790.1125.789.9
In15.338.898.8890.1125.789.9
Y15.378.928.9090.1125.789.9
La15.458.918.8890.1125.689.7
Si15.268.848.8490.0125.890.0
Ge15.358.858.8790.0125.790.0
Ti15.388.998.9090.0126.190.0
Sn15.478.868.9090.0125.890.0
Ce15.668.828.9390.0126.790.0
Disclaimer/Publisher’s Note: The statements, opinions and data contained in all publications are solely those of the individual author(s) and contributor(s) and not of MDPI and/or the editor(s). MDPI and/or the editor(s) disclaim responsibility for any injury to people or property resulting from any ideas, methods, instructions or products referred to in the content.

