Article

Pagodane—Solution and Solid-State Vibrational Spectra

1
ISIS Neutron and Muon Facility, STFC Rutherford Appleton Laboratory, Chilton, Oxfordshire OX11 0QX, UK
2
Leeds Mathematics School, 105, Albion Street, Leeds LS1 5AP, UK
3
Alcester Grammar School, Alcester, Warwickshire B49 5ED, UK
4
Scientific Computing Department, STFC Rutherford Appleton Laboratory, Chilton, Oxfordshire OX11 0QX, UK
*
Author to whom correspondence should be addressed.
Physchem 2024, 4(4), 524-535; https://doi.org/10.3390/physchem4040036
Submission received: 18 October 2024 / Revised: 4 November 2024 / Accepted: 12 November 2024 / Published: 6 December 2024
(This article belongs to the Section Experimental and Computational Spectroscopy)

Abstract

In the present study, we report infrared and Raman spectra in both solution and the solid state, together with a state-of-the art inelastic neutron scattering spectrum, of the unusual molecule pagodane. Periodic DFT calculations have enabled a complete assignment of all the modes. The isolated molecule has D2h symmetry, which is reduced to Ci in the solid state. However, the preservation of the centre of symmetry means that the selection rules for infrared and Raman spectroscopy are almost unchanged. The exceptions are the D2h Au modes that are forbidden in the isolated molecule but become allowed in the solid state. These have been located in the solid-state spectra.

Graphical Abstract

1. Introduction

Pagodane (C20H20, [1.1.1.1]-pagodane, undecacyclo-[9.9.0.01,5.02,12.02,18.03,7.06,10.08,12.011,15.013,17.316,20]-eicosane) was first synthesised in 1983 by Prinzbach [1]. The structure of the isolated molecule is shown in Figure 1a; the trivial name derives from its resemblance to an eastern temple and its reflection in water. The material was synthesised in the hope that it would provide an alternative route to its isomer, dodecahedrane [2], shown in Figure 1b. This was later shown to be correct [3].
Pagodane is a highly unusual molecule. While all of the carbon atoms have sp3 hybridisation, all of the C–C–C bond angles are less than the 109.5° expected for tetrahedral carbon atoms. Rather, they range from ~90° in the central cyclobutane ring to 103.6° in the “wings” of the pagoda. The C–C bond lengths are also exceptional: the central cyclobutane ring has C–C distances of 2 × 1.549 and 2 × 1.573 Å (i.e., it is rectangular, not square), both of which are significantly elongated relative to the normal length of 1.53(1) Å. The unique geometry means that pagodane has a significant ring strain (Estr) present: Estr = 399 kJ mol−1 [4]. Despite this, the molecule is remarkedly stable; it melts at 243 °C and is stable in the gas phase to at least 600 °C [3]. For pagodane and its derivatives, the M+ signals are generally the most intense in the electron impact mass spectrum and a defined fragmentation pattern is not evident [3]. All of this attests to the exotic nature of this molecule.
In CDCl3 solution, the 1H and 13C NMR spectra show that pagodane has D2h symmetry [1]. In the solid state [4], the molecule occupies a Ci site in the triclinic space group P 1 ¯ (No. 2). As far as we are aware, there are no reports of the vibrational spectra of pagodane in solution and the only solid-state data are the inelastic neutron scattering (INS) spectrum [5]. INS [6] spectroscopy has the advantage that there are no selection rules, so all of the modes are allowed and, in principle, observable. However, the best resolution obtainable is generally inferior to that of infrared or Raman spectroscopies, and, for reasons explained elsewhere [7], there is no useful information in the C–H stretch region around 3000 cm−1. The absence of selection rules also means that, for powders, there is no symmetry information available.
The aim of this work is to characterise pagodane by vibrational spectroscopy in solution and in the solid state. This will allow us to investigate the consequences of the change in symmetry between the two phases.

2. Materials and Methods

The sample of pagodane was kindly supplied by the late Professor Horst Prinzbach and is the same as that used in earlier work [5]. Spectra in CDCl3 (99.8 atom % D, Aldrich, Gillingham, UK) solution were recorded at room temperature.
Room temperature solution and solid-state Raman spectra (256 scans at 4 cm−1 resolution with 500 mW laser power, 8 times zero-filling) in a quartz cuvette were recorded with a Bruker (Billerica, MA, USA) FT–Raman spectrometer with 1064 nm excitation.
Room temperature solution and solid-state infrared spectra (256 scans at 4 cm−1 resolution with eight times zero-filling) were recorded with a Bruker (Billerica, MA, USA) Vertex 70 FTIR spectrometer over the range 50–4000 cm−1 using a Bruker Diamond ATR accessory.
The INS spectrum was recorded using TOSCA [8,9] at ISIS [10]. The sample size was 300 mg and the measurement time was ~12 h.
It is not customary to show error bars for spectroscopic data, but these are clearly relevant for comparison of observed and calculated spectra [11,12]. A discussion of errors is given in the Supplementary Material (Figure S1).
Dispersion-corrected (DFT-D) periodic calculations were carried out starting from the room temperature structure [4] with the plane wave pseudo-potential method as employed in the CASTEP code (version 23.1) [13]. Exchange and correlation were approximated using the Perdew–Burke–Ernzerhof (PBE) functional [14] with the Tkatchenko–Scheffler dispersion correction scheme [15] within the generalised gradient approximation. On-the-fly-generated norm-conserving pseudopotentials were used. The plane wave cut-off energy was 720 eV and the Brillouin zone sampling of electronic states used an 8 × 7 × 9 regular grid (i.e., Monkhorst–Pack sampling [16,17]), symmetry-reduced to 252 k-points. The atomic positions were optimised to reduce forces below |0.01| eV Å−1. The calculation was repeated with the same initial structure, but, in this case, the lattice parameters were simultaneously relaxed to a pressure of ~0.1 MPa. For the isolated molecule calculations, one molecule of pagodane was placed at the centre of a 12 × 12 × 12 Å cell in space group Pmmm (No. 47). This ensures that the idealised D2h symmetry is enforced. The same parameters were used for the geometry optimization as for the experimental cell, except that electronic sampling was only performed at the Γ-point in the Brillouin zone. Phonon transition energies were obtained by the diagonalization of dynamical matrices computed using density-functional perturbation theory (DFPT) [18]. In the fully optimised cell, this was performed over a 3 × 3 × 4 q-point mesh, while at the experimental lattice, a 2 × 2 × 2 mesh was used. DFPT was also used to obtain the dielectric response and the Born effective charges (“the linear relation between the force on an atom and the macroscopic electric field” [19]) from which the mode oscillator strength tensor and infrared absorptivity were calculated. Raman activities were computed using a hybrid method combining density functional perturbation theory with finite displacements [20]. For all the calculated systems, the atomic displacements in each mode were output by CASTEP enabling mode assignment by the visualization of the modes in Materials Studio [21] and giving sufficient input data to generate the INS spectrum in the incoherent approximation with AbINS [22]. Finer q-point sampling in AbINS was obtained by writing the force constants, allowing AbINS to request Fourier interpolation by Euphonic [23]. Individual mode intensities were obtained for the Γ-point modes by using a Python workflow to access routines within AbINS (see Data Availability Statement).
It is emphasised that for all the calculated spectra shown, the transition energies have not been scaled.

3. Results and Discussion

3.1. Selection Rules

An isolated, D2h, pagodane molecule, C20H20, has (3 × 40) − 6 = 114 internal modes (Γmol). These are distributed as follows (1):
Γmol = 18Ag + 14B1g + 12B2g + 13B3g + 12Au + 14B1u +16B2u + 15B3u
The representation (1) can be decomposed into the 20 C–H stretch modes (ΓCH) (2) and the remaining modes (Γrem) (3):
ΓCH = 4Ag + 3B1g + 1B2g + 2B3g + 1Au + 2B1u +4B2u + 3B3u
Γrem = 14Ag + 11B1g + 11B2g + 11B3g + 11Au + 12B1u +12B2u +12B3u
Of these, all gerade (g) modes are Raman allowed and infrared forbidden and B1u, B2u, and B3u modes are infrared-allowed and Raman forbidden, while the Au modes are forbidden in both the infrared and Raman spectra.
The correlation method [24] for pagodane in the P 1 ¯ crystal is straightforward because there is only one molecule (i.e., Z = 1) in the primitive unit cell, so there is no factor group splitting. In addition, the site group and the factor group are the same. This means that all of the D2h gerade modes correlate to Ag in the crystal; similarly, all of the D2h ungerade (u) modes correlate to Au in the crystal. The selection rules are particularly simple: all Ag modes are Raman allowed and infrared forbidden and vice versa for the Au modes. In principle, this means that, together, all of the modes are present in the infrared and Raman spectra, including those that are inactive under D2h symmetry. Note that all the modes are allowed in the INS spectrum. However, a mode can be allowed but still have vanishingly small intensity. This is true of all three forms (infrared, Raman, and INS) of vibrational spectroscopy. In practice, all three methods are usually required for a complete analysis.

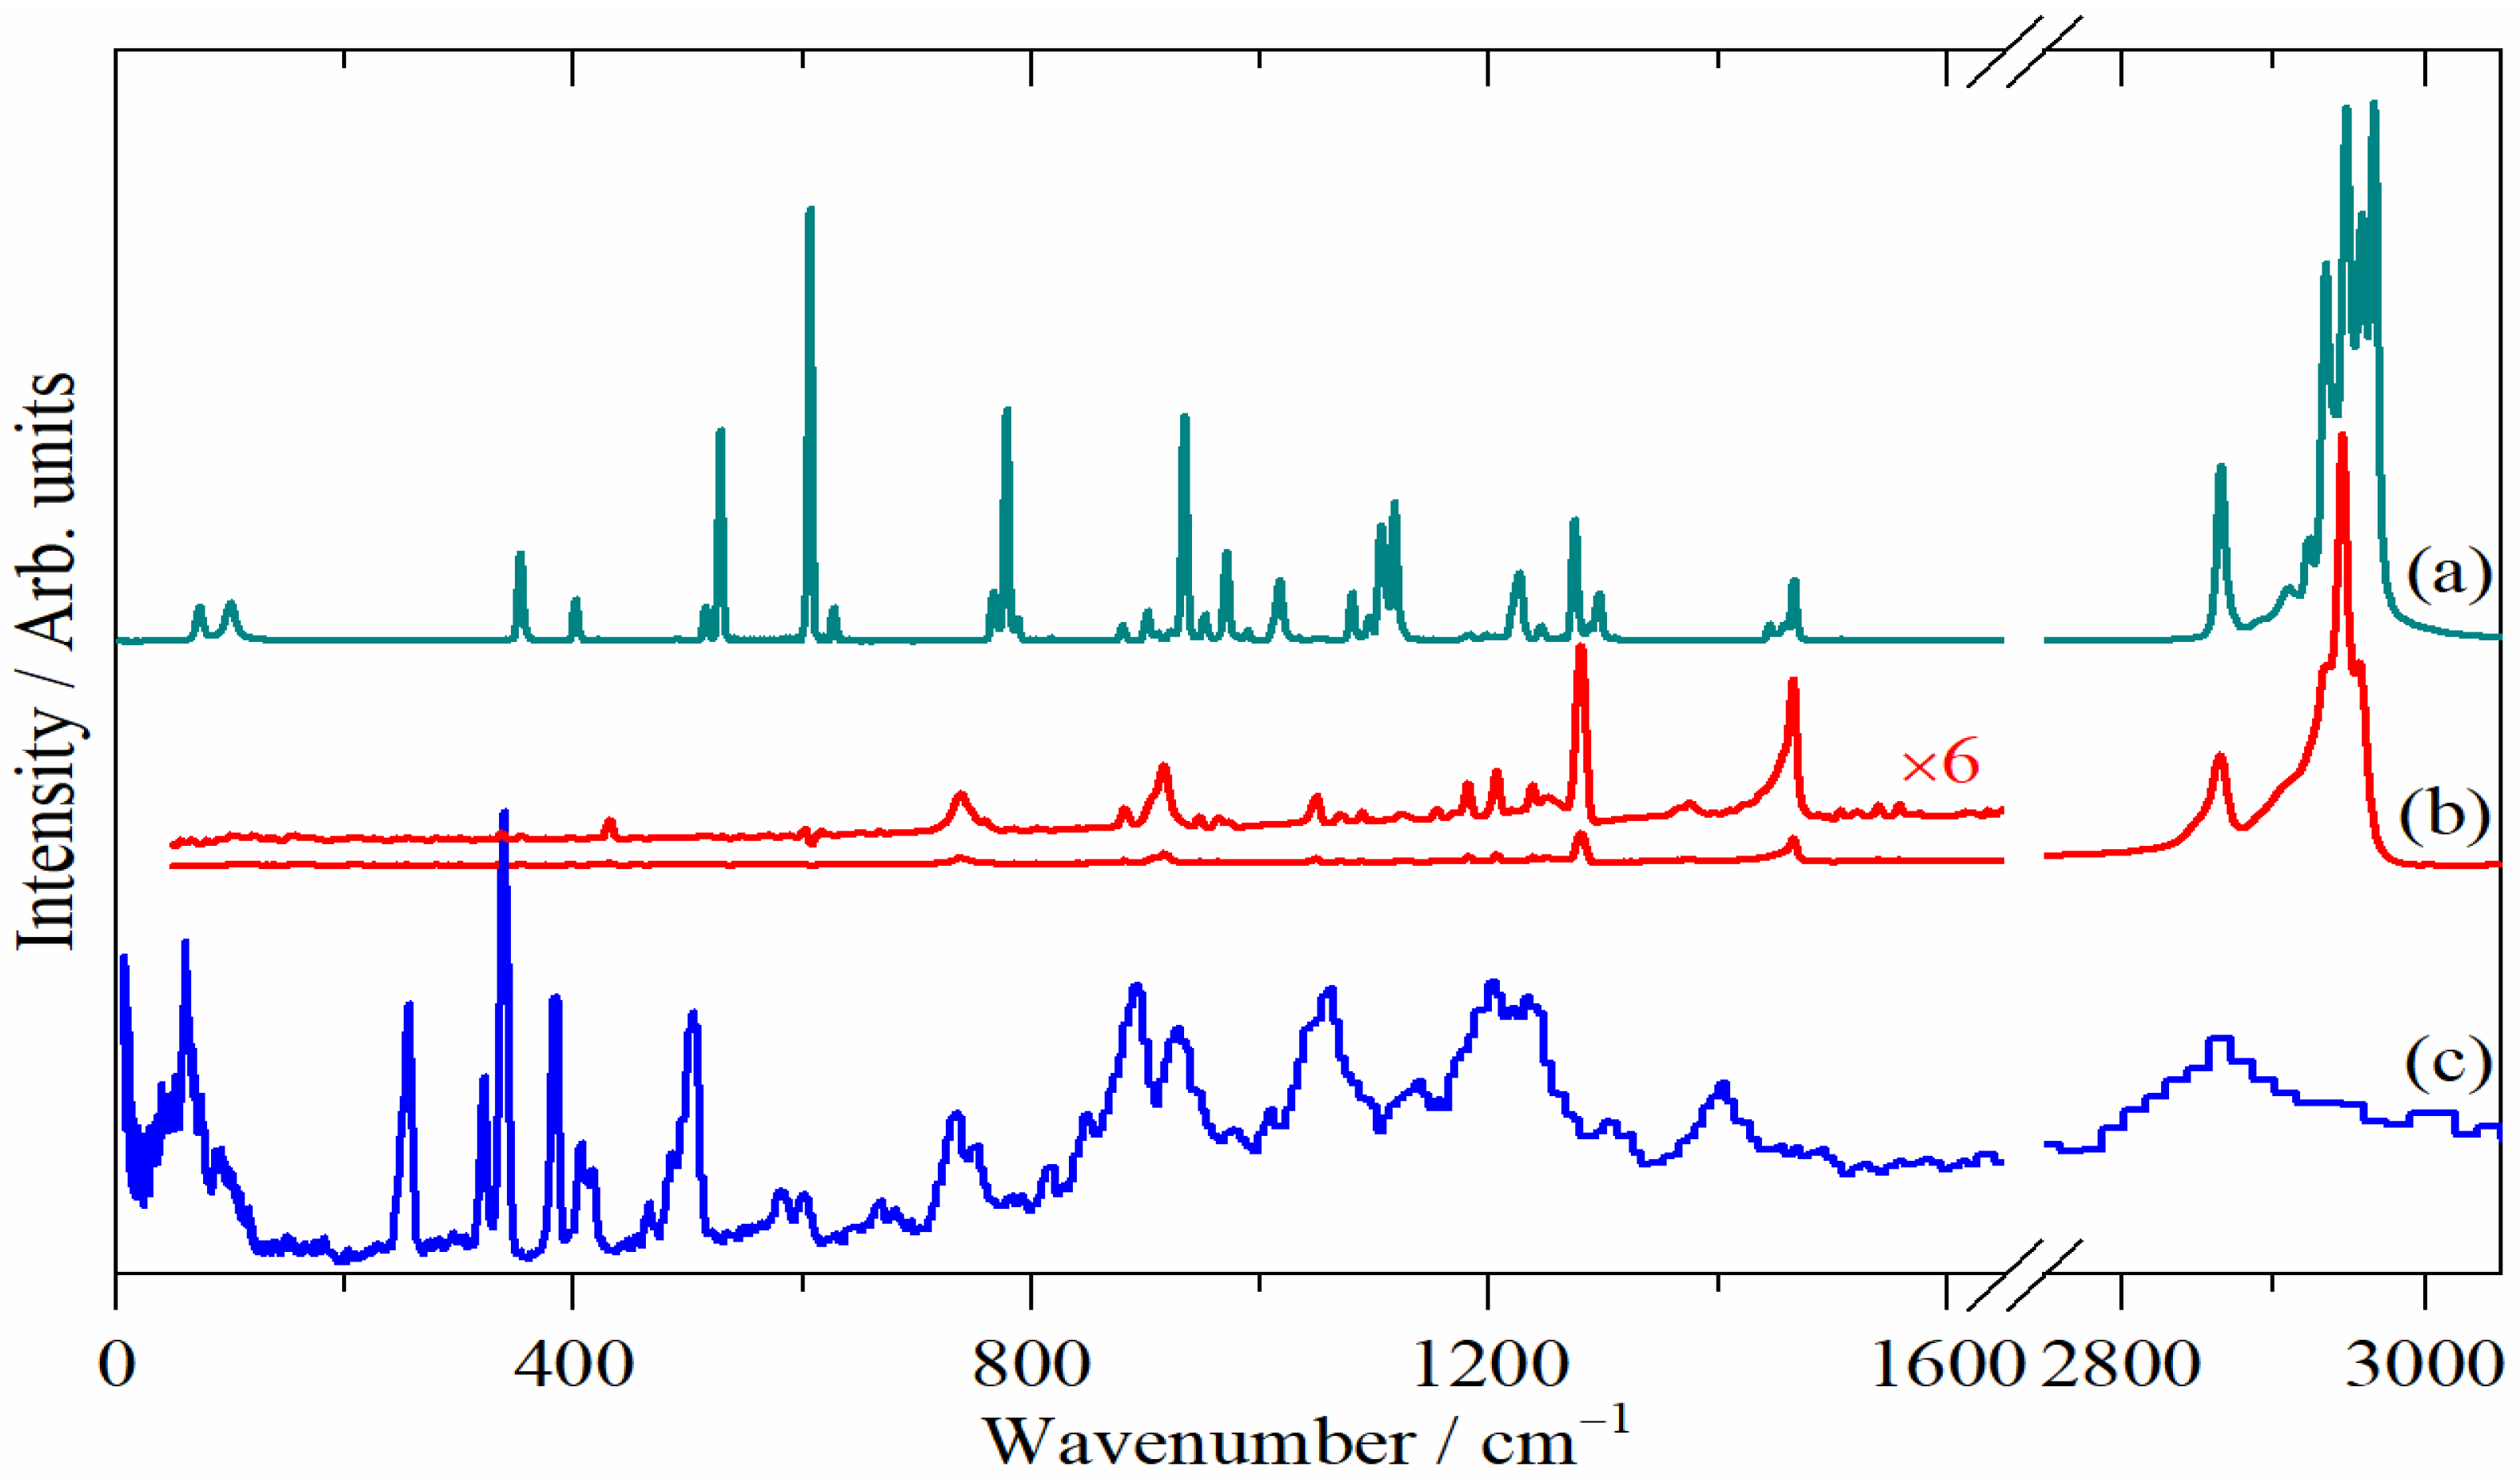
3.2. Pagodane in Solution

Figure 2 and Figure 3 compare the infrared and Raman spectra, respectively, of pagodane in CDCl3 solution (the solvent has been subtracted, see Figures S2 and S3 for the spectra before subtraction) with the calculated spectra for an isolated, D2h, pagodane molecule. It can be seen that (within the limitations of the signal-to-noise ratio) there is an excellent concordance between the experimental and calculated spectra. In particular, there are no additional modes present in the experimental spectra, consistent with the D2h symmetry. This is in complete agreement with the conclusions from the 1H and 13C NMR studies [1].

3.3. Pagodane in the Solid State

The structure of pagodane in the solid state is shown in Figure 4. The infrared, Raman, and INS spectra of pagodane in the solid state are shown in Figure 5. The INS spectrum was re-recorded (in 2024) for this work from the original sample [5]. The comparison of the two data sets (see Figure S4) shows that there is a wavenumber dependent offset in the old data, most likely caused by a sample misalignment. This is discussed further in the Supplementary Material. The 2024 data have a better resolution and a higher signal-to-noise ratio than the old (2000) data, a consequence of the improvements in the instrument over time.
The complementarity of the three forms of vibrational spectroscopy is apparent and is essential for a complete assignment. The infrared and Raman spectra allow the C–H stretch region to be observed, where, as noted earlier [7], the INS spectrum provides no useful information. However, the INS spectrum provides access to the lattice mode region below 200 cm−1 and enables the skeletal deformations in the 200–650 cm−1 range to be seen.
It is apparent that the spectra conform to those expected for an alkane [25]: C–H stretch modes below 3000 cm−1, CH2 scissors ~1450 cm−1 and CH2 twist/rock at 1200–1300 cm−1. However, to go beyond simple group-frequency correlations, computational studies are required.

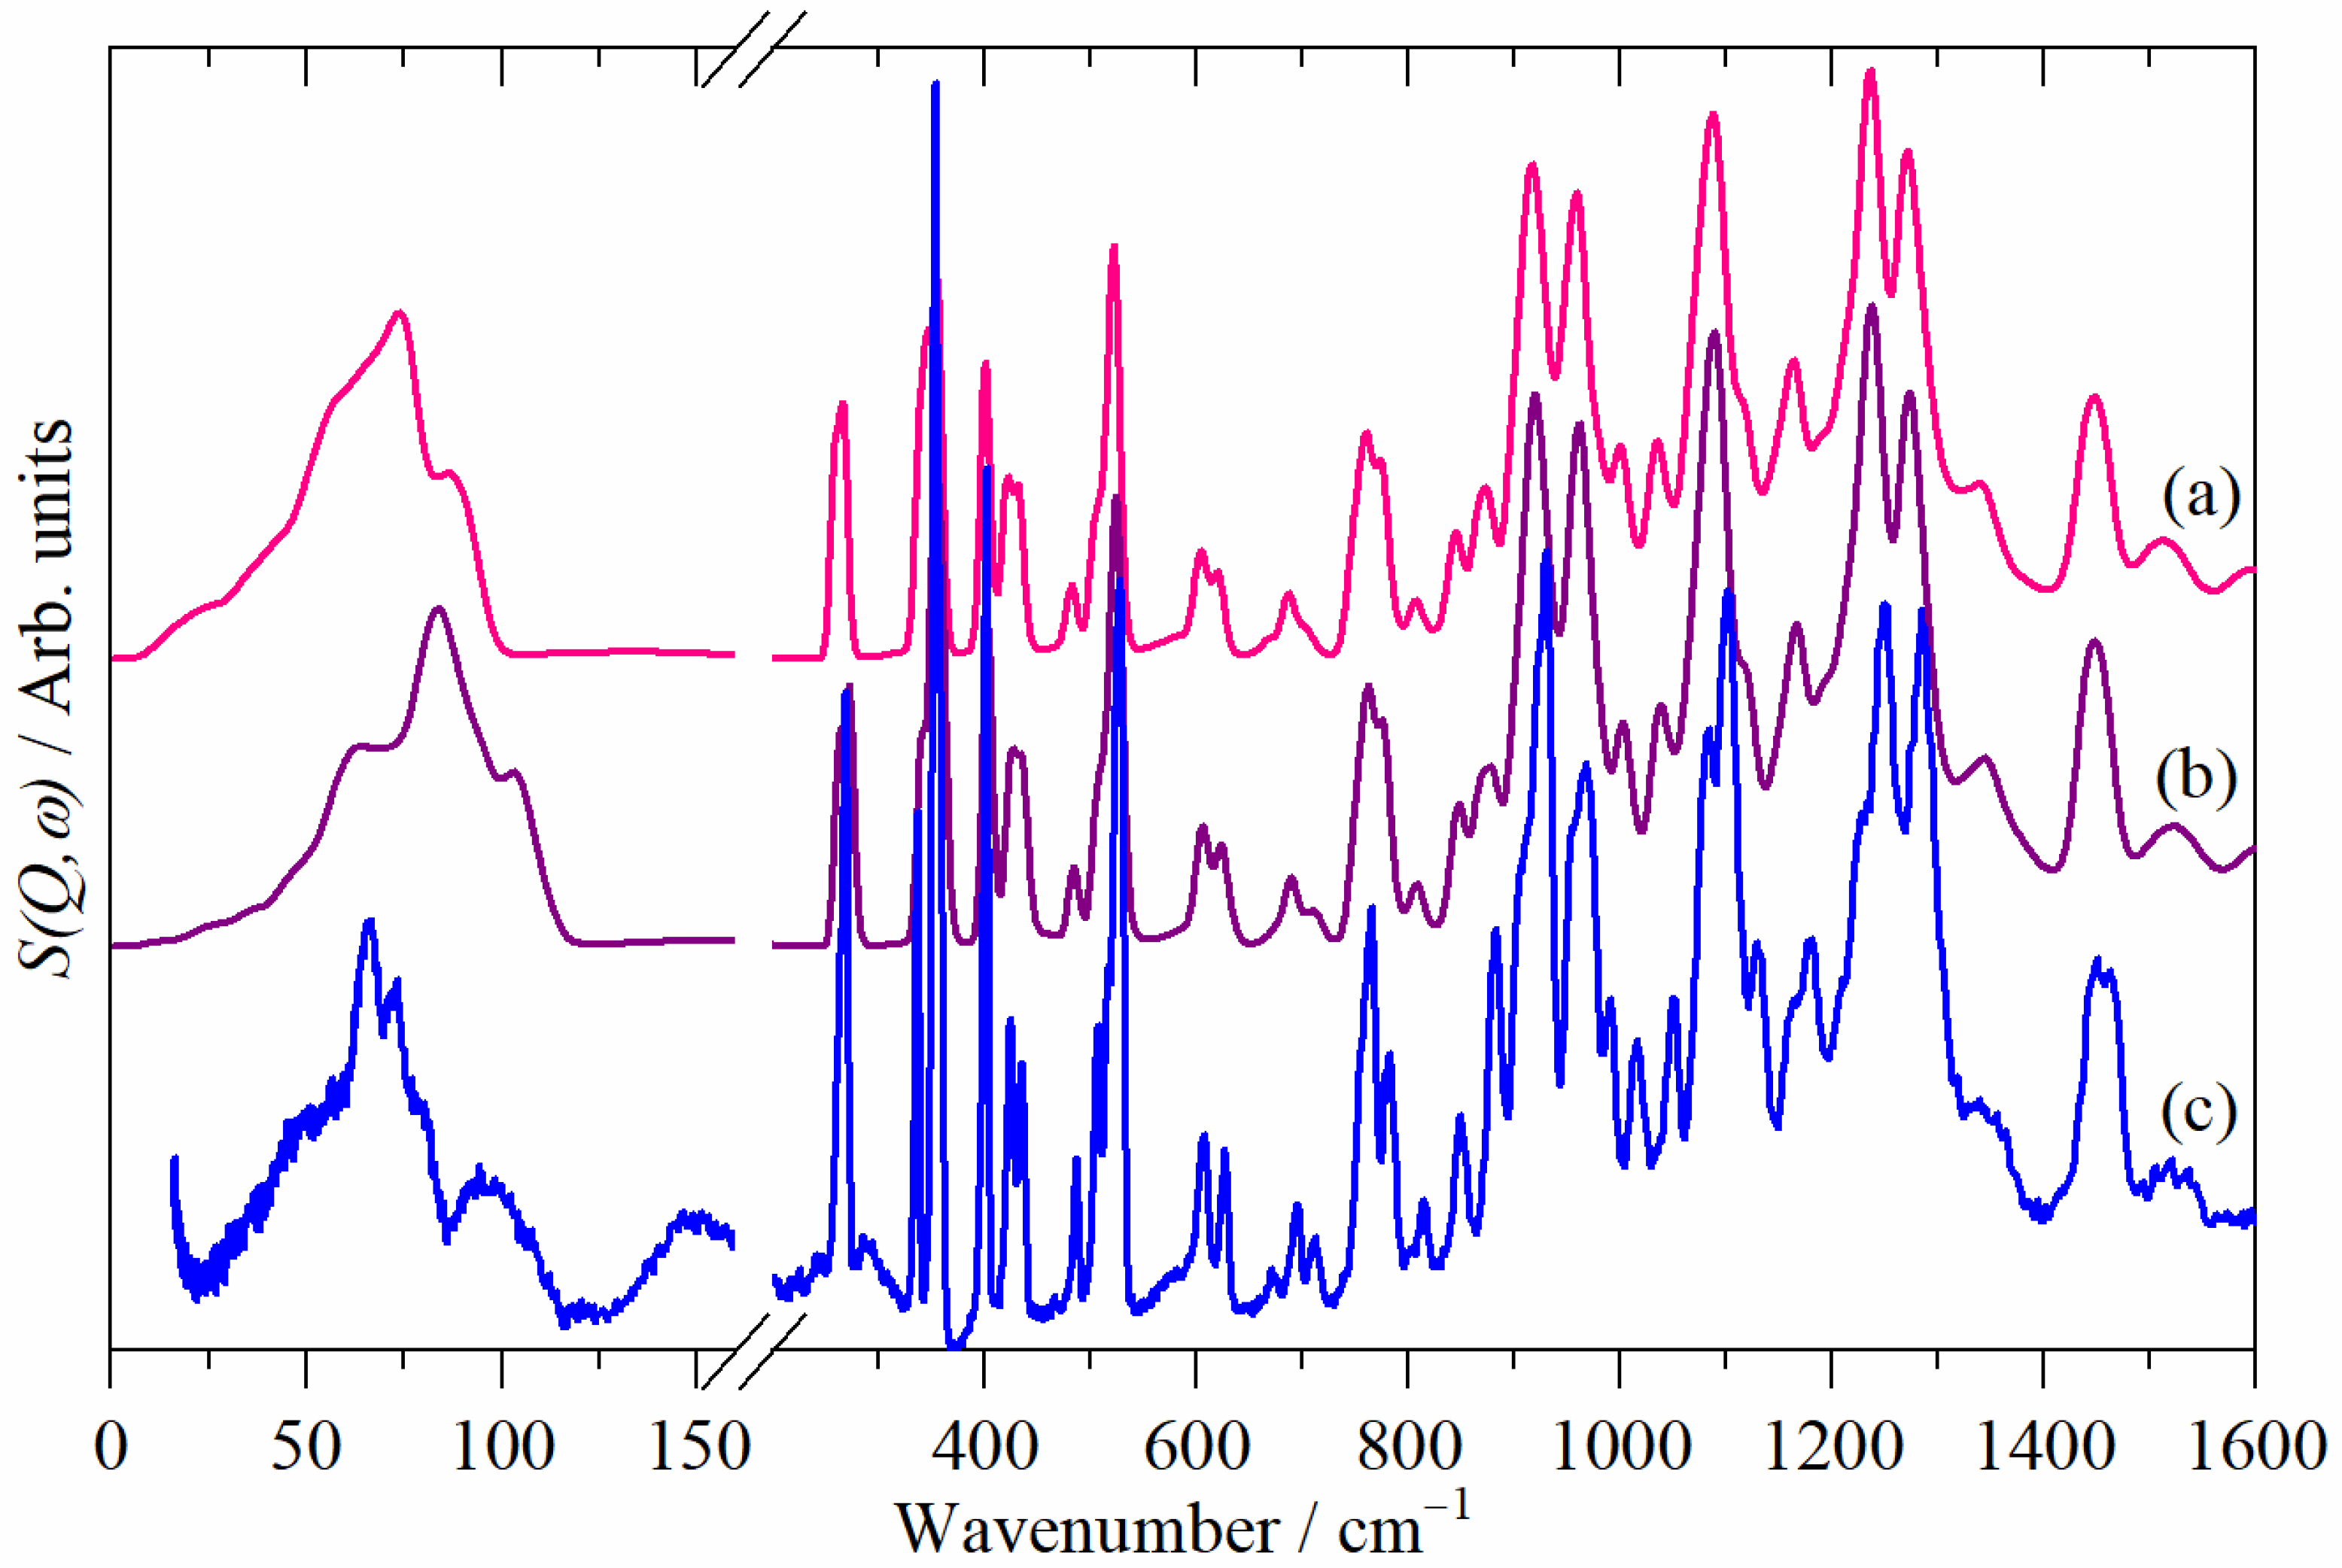
3.4. Computational Studies

Previous work [5] carried out both isolated molecule calculations and periodic calculations of the complete unit cell. The latter were restricted to the Brillouin zone Γ-point, where the infrared and Raman modes occur. They also used the experimental room temperature structure [4]. We have repeated and extended these calculations. We have calculated the spectrum not just at the Γ-point but across the entire Brillouin zone. This is important to properly simulate the INS spectrum. INS spectroscopy is sensitive to all wavevectors [6] (a consequence of the neutron having mass), so if there is any vibrational dispersion (variation of transition energy with wavevector), this is present in the INS spectrum. In particular, the acoustic translational modes will show dispersion (they have zero energy at the Γ-point).
In addition to calculating the spectra at the room temperature lattice parameters, we have also carried out simultaneous lattice and geometry optimization. The lattice optimization results in only modest changes to the structure (experimental values [4] in parentheses {}): a = 7.206 {7.304(5)}, b = 8.041 {8:182(4)}, c = 6.136 {6:336(3)} Å, α = 104.061 {105:50(4)}, β = 111.411 {112:07(5)}, γ = 64.155 {64:97(5)}° and V = 296.353 {315.294} Å3. The volume change is only −6.4%.
Table S1 compares the experimental [4] and calculated structural data from this and previous work [5]. The calculations reproduce the experimental structure very well: all of the calculated bond lengths are within 0.003 Å of the experimental values. This is true for the calculations at the experimental lattice parameters and with optimised lattice parameters.
A comparison of the observed and calculated INS spectra is a stringent test of a calculation [6]. Figure 6 compares the experimental spectrum with that calculated at the experimental lattice parameters and after allowing the lattice parameters to optimise (the atom sites were optimised in both cases). A complete list of the observed and calculated transition energies for both the solution and solid-state data are given in Table S2. The spectrum can be divided into three regions: the lattice mode region below 200 cm−1, the “fingerprint region” 200–1600 cm−1 and the C–H stretch region. We will consider each of these separately.

3.4.1. The Lattice Mode Region (<200 cm−1)

In the lattice mode region below 200 cm−1, the two calculated spectra, Figure 6a,b, diverge from each other. This is a consequence of the lattice parameter optimization: at the experimental lattice parameters, this corresponds to a pressure of −0.7 GPa (indicating that it is energetically favourable to contract) versus 0 GPa for the fully optimised structure. The increased pressure results in a hardening of the lattice modes for the fully optimised structure. Although neither structure exactly replicates the experimental spectrum in this region, the lattice optimised structure provides a better match, so we will use this for the assignments.
The low energy region is particularly sensitive to the reciprocal-space sampling. Figure 7 shows the convergence with increasing cut-off for the fully optimised structure (that for the geometry-only structure is shown in Figure S5). It can be seen with a 60 Å cut-off, corresponding to 10 × 9 × 11 q-point sampling, the spectrum is acceptably smooth and shows good correspondence with the experimental data (Figure 6c). We note that the internal mode region (>200 cm−1) is much less sensitive to the cut-off.
A crystal that only has one formula unit in the primitive cell will only have acoustic translational modes. By definition, these have zero energy at the Brillouin zone Γ-point, so do not appear in either the Raman or the infrared spectra. As seen in the dispersion curves, Figure 8, away from the Γ-point, the transition energies are positive. (The dispersion curves for the geometry-optimised-only structure are shown in Figure S6). The acoustic modes are responsible for the intensity below 60 cm−1.
The three librational modes are calculated at 68, 96 and 112 cm−1 at the Γ-point. Two of these are seen in the Raman spectrum at 73 and 100 cm−1. The INS spectrum shows maxima at 62, 75, and 91 cm−1. However, this is complicated by all three modes showing some dispersion and one of the acoustic modes rising to ~100 cm−1 away from the Γ-point.

3.4.2. The Fingerprint Region (200–1600 cm−1)

From Figure 6, it can be seen that for the INS, in the 200–1600 cm−1 region, the two calculated spectra are essentially identical and match the experimental spectrum extremely well. The improved resolution as compared to the previous work [5] provides a more exacting comparison.
In this region, 11 of the 12 Au modes that are forbidden in the infrared and Raman spectra of the ideal D2h molecule occur (Equations (2) and (3)). These become infrared-allowed modes in the solid state, so a comparison of the solution and solid-state infrared spectra should readily identify these. Unfortunately, our solution data are not good enough for this purpose so we will use the calculated infrared spectra of the isolated and solid-state pagodane and compare them to the INS and infrared of the solid state. Figure 9 shows the comparison, it also indicates where the D2h forbidden modes occur in the solid state. We note the excellent agreement between the observed and calculated infrared spectra and that the agreement for the Raman spectra is similarly good; see Figure S7.
Modes 1 and 2 exhibit strong modes in the INS but have essentially zero intensity in the infrared spectrum. Mode 3 has little calculated intensity in either the infrared or the INS and occurs close to two Au modes that derive from D2h-allowed modes. There is a weak shoulder at 749 cm−1 on the low energy side of the INS feature at 765 cm−1, so this is assigned as the third mode. We assign mode 4 as part of the pronounced shoulder at 911 cm−1, which is part of the 935 cm−1 INS band. A shoulder is apparent in the infrared spectrum at the same energy, consistent with this assignment. For mode 5, three modes are apparent in the solid-state infrared spectrum, whereas there is only one in the isolated molecule. The additional mode is because an allowed, but very weak, D2h mode gains intensity in the solid state. Mode 5 is assigned at 963 cm−1. Modes 6 and 7 are seen in the infrared spectrum at 1070 and 1091 cm−1. Mode 8 is at 1156 cm−1, with a somewhat stronger intensity than predicted. Mode 9 is a weak band at 1219 cm−1. Mode 10 is also very weak but is clearly visible at 1248 cm−1. Mode 11 is calculated to have a low intensity and occurs in a region where there are some combination bands present; it also has low calculated INS intensity, and there are also other modes present. Two bands are seen at 1365 and 1375 cm−1. It is apparent from Figure 9 that, in this region, the calculated transition energies underestimate the true values, so we assign the 1365 cm−1 band to the Au mode and the 1375 cm−1 band to a combination mode. There are two possibilities for this 102 (R) + 1280 (IR) = 1382 cm−1 and 936 (R) + 430 (IR) = 1366 cm−1.
The other notable aspect about the INS spectrum in this region is that it is resolution-limited [8,26]. This is unusual; commonly, it is the sample effects that dominate, and the instrumental resolution does not contribute to the observed line widths. In the present case, the narrow lines can be attributed to the sample being highly crystalline and the absence of dispersion in the internal modes, as shown by the flat dispersion curves in Figure 8.
We note that there is better agreement between the observed and calculated INS spectra in this work than the previous study [5] because the wavenumber axis is correct in the present case.

3.4.3. The C–H Stretch Region (>2800 cm−1)

The infrared and Raman spectra of the C–H stretch region are shown in Figure 10. As noted earlier, the INS spectrum provides no useful information in this region. The comparison of the experimental solution and solid-state spectra show that they are very comparable: the bands occur in almost the same position in both phases and the envelopes are similar. As would be expected, the solid-state spectra show more structure.
In contrast to the fingerprint region, the calculated spectra of the isolated molecule that using the experimental lattice parameters and the full optimisation are distinctly different from each other. They are also all upshifted relative to the experimental spectra. Although the upshifts are significant, 50–100 cm−1, the relative error is still small, 1.6–2.6%. Differences between experimental and calculated transition energies in this region are usually ascribed to anharmonicity (the calculations assume a harmonic potential). However, this does not account for why the calculations diverge amongst themselves.
We believe the most likely explanation is the difference in the intermolecular interactions. In the isolated molecule, the shortest intermolecular contact is 5.5 Å (i.e., between the periodic images); at the experimental lattice parameters, it is 2.3 Å and with the optimised lattice parameters, it is 2.2 Å. These result in a progressive decrease in the average C–H bond length from 1.0981 to 1.0973 to 1.0962 Å and a resultant increase in the transition energies.
The usual assignment of the bands at 2865 and 2946 cm−1 would be the symmetric and asymmetric methylene stretch modes [27], and the mode animations confirm this assignment. Assignments of tertiary R3C–H (R = organic) stretch modes are scarce, with 2890 cm−1 as the accepted value [25]. In the present case, the animations show that they occur on both sides of the asymmetric methylene stretch and that there is some mixing with it. They also show that the “axial” hydrogens (those on the “roof” of the pagoda) are at lower energy than those of the “equatorial” hydrogens (those pointing horizontally in Figure 1, left), although there is some mixing, as exemplified by the highest energy Raman mode, which is an in-phase stretch of all the tertiary hydrogens.

4. Conclusions

In the present study, we have provided the first reported infrared and Raman spectra in both solution and the solid state, together with a state-of-the art INS spectrum, of the unusual molecule pagodane. Periodic DFT calculations have enabled a complete assignment of all the modes. Our mode assignments are in agreement with previous work [5] but are more extensive.
For the molecules dodecahedrane [28] and centrohexaindane [29], where the isolated molecule has Ih and Td symmetry, respectively, the lower site symmetry in the solid state, (Th and C1, respectively) results in significant differences in the spectra between that of the free molecule and when in the solid state. In the present case, the spectra in the two states are remarkably similar. This is because the inversion centre is present in both circumstances, so only the g modes are allowed in the Raman, and only the u modes are infrared-allowed (except for Au) in the free molecule with D2h symmetry. In the solid state, all the D2h g modes map to Ag, and all of the D2h u modes map to Au. There are no crossovers (i.e., u → g or g → u), so no Raman active modes become infrared-allowed and vice versa. The only difference is that the D2h Au modes become infrared-allowed in the solid state.

Supplementary Materials

The following supporting information can be downloaded at https://www.mdpi.com/article/10.3390/physchem4040036/s1. Figure S1: INS spectrum of pagodane including error bars, Figure S2: Infrared spectra of pagodane in CDCl3 solution; Figure S3: Raman spectra of pagodane in CDCl3 solution; Figure S4: Comparison of the INS spectra of pagodane recorded in 2000 and 2024; Figure S5: Calculated dispersion curves for pagodane at the experimental lattice parameters; Figure S6: Comparison of the solid-state Raman spectra of pagodane and that generated from the lattice and geometry optimised calculation; Figure S7: Comparison of the solid-state Raman spectra of pagodane and that generated from the lattice and 83 geometry optimised calculation; Table S1: Comparison of the experimental and calculated structural data from this and previous work; Table S2. Observed infrared, Raman, and INS transition energies, ab initio transition energies, infrared and Raman intensities, and assignments for pagodane.

Author Contributions

Conceptualization, S.F.P.; investigation, S.F.P., H.E.M., C.T.W. and A.J.J.; writing—original draft preparation, S.F.P.; writing—review and editing, S.F.P., H.E.M., C.T.W. and. A.J.J.; supervision, S.F.P. All authors have read and agreed to the published version of the manuscript.

Funding

The Science and Technology Facilities Council (STFC) funded this research.

Data Availability Statement

The original data presented in the study are openly available in eData: the STFC Research Data Repository at https://edata.stfc.ac.uk/handle/edata/965 (accessed on 13 November 2024). The computational workflow to compute fundamental mode intensities using AbINS is available at https://doi.org/10.5281/zenodo.13902560 (accessed on 13 November 2024). The computational workflow to study q-point convergence is available at https://doi.org/10.5281/zenodo.13902655 (accessed on 13 November 2024).

Acknowledgments

The STFC Rutherford Appleton Laboratory is thanked for access to neutron beam facilities. Computing resources (time on the SCARF compute cluster for the CASTEP calculations) was provided by STFC’s e-Science facility. This research has been performed with the aid of facilities at the Research Complex at Harwell, including the FT–Raman spectrometer. The authors would like to thank the Research Complex for access to, and support of, these facilities and equipment.

Conflicts of Interest

The authors declare no conflicts of interest.

References

  1. Fessner, W.-D.; Prinzbach, H.; Riho, C. Pagodane—An undecacyclic C20H20-polyquinane. Tetrahedron Lett. 1983, 24, 5857–5860. [Google Scholar] [CrossRef]
  2. Ternansky, R.J.; Balogh, D.W.; Paquette, L.A. Dodecahedrane. J. Am. Chem. Soc. 1982, 104, 4503–4504. [Google Scholar] [CrossRef]
  3. Prinzbach, H.; Weber, W. From an insecticide to Plato’s universe—The pagodane route to dodecahedranes: New pathways and new perspectives. Angew. Chem. Int. Ed. Engl. 1994, 33, 2239–2257. [Google Scholar] [CrossRef]
  4. Prakash, G.K.S.; Krishnamurthy, V.V.; Herges, R.; Bau, R.; Yuan, H.; Olah, G.A.; Fessner, W.-D.; Prinzbach, H. [1.1.1.1] and [2.2.1.1] Pagodane dications: Frozen two-electron Woodward-Hoffmann transition state models. J. Amer. Chem. Soc. 1988, 110, 7764–7772. [Google Scholar] [CrossRef]
  5. Allis, D.G.; Prinzbach, H.; Hudson, B.S. Inelastic neutron scattering spectra of pagodane: Experiment and DFT calculations. Chem. Phys. Lett. 2004, 386, 356–363. [Google Scholar] [CrossRef]
  6. Mitchell, P.C.H.; Parker, S.F.; Ramirez-Cuesta, A.J.; Tomkinson, J. Vibrational Spectroscopy with Neutrons, with Applications in Chemistry, Biology, Materials Science and Catalysis; World Scientific: Singapore, 2005. [Google Scholar]
  7. Parker, S.F.; Lennon, D.; Albers, P.W. Vibrational spectroscopy with neutrons—A review of new directions. Appl. Spec. 2011, 65, 1325–1341. [Google Scholar] [CrossRef]
  8. Parker, S.F.; Fernandez-Alonso, F.; Ramirez-Cuesta, A.J.; Tomkinson, J.; Rudić, S.; Pinna, R.S.; Gorini, G.; Fernández Castañon, J. Recent and future developments on TOSCA at ISIS. J. Phys. Conf. Ser. 2014, 554, 12003. [Google Scholar] [CrossRef]
  9. Pinna, R.S.; Rudić, S.; Parker, S.F.; Armstrong, J.; Zanetti, M.; Škoro, G.; Waller, S.P.; Zacek, D.; Smith, C.A.; Capstick, M.J.; et al. The neutron guide upgrade of the TOSCA spectrometer. Nucl. Instrum. Methods Phys. Res. Sect. A 2018, 896, 68–74. [Google Scholar] [CrossRef]
  10. The ISIS Neutron and Muon Source. Available online: https://www.isis.stfc.ac.uk/Pages/About.aspx (accessed on 31 July 2024).
  11. Griffiths, P.R.; de Haseth, J.A. Fourier Transform Infrared Spectrometry; Wiley-Interscience: New York, NY, USA, 1986. [Google Scholar]
  12. Rossi Albertini, V.; Colognesi, D.; Tomkinson, J. A study on the calibration of a time-focused inelastic neutron scattering spectrometer. J. Neutron. Res. 2000, 8, 245–259. [Google Scholar] [CrossRef]
  13. Clark, S.J.; Segall, M.D.; Pickard, C.J.; Hasnip, P.J.; Probert, M.I.J.; Refson, K.; Payne, M.C. First principles methods using CASTEP. Z. Krist. 2005, 220, 567–570. [Google Scholar] [CrossRef]
  14. Perdew, J.P.; Burke, K.; Matthias Ernzerhof, M. Generalized gradient approximation made simple. Phys. Rev. Lett. 1996, 77, 3865–3868. [Google Scholar] [CrossRef]
  15. Tkatchenko, A.; Scheffler, M. Accurate molecular van der Waals interactions from ground-state electron density and free-atom reference data. Phys. Rev. Lett. 2009, 102, 073005. [Google Scholar] [CrossRef]
  16. Monkhorst, H.J.; Pack, J.D. Special points for Brillouin-zone integrations. Phys. Rev. B 1976, 13, 5188–5192. [Google Scholar] [CrossRef]
  17. Pack, J.D.; Monkhorst, H.J. “Special points for Brillouin-zone integrations”—A reply. Phys. Rev. B 1977, 16, 1748–1749. [Google Scholar] [CrossRef]
  18. Refson, K.; Tulip, P.R.; Clark, S.J. Variational density-functional perturbation theory for dielectrics and lattice dynamics. Phys. Rev. B 2006, 73, 155114. [Google Scholar] [CrossRef]
  19. Gonze, X.; Lee, C. Dynamical matrices, Born effective charges, dielectric permittivity tensors, and interatomic force constants from density-functional perturbation theory. Phys. Rev. B 1997, 55, 10355–10368. [Google Scholar] [CrossRef]
  20. Milman, V.; Perlov, A.; Refson, K.; Clark, S.J.; Gavartin, J.; Winkler, B. Structural, electronic and vibrational properties of tetragonal zirconia under pressure: A density functional theory study. J. Phys. Condens. Matter 2009, 21, 485404. [Google Scholar] [CrossRef]
  21. Biovia Materials Studio. Available online: https://www.3ds.com/products-services/biovia/products/molecular-modeling-simulation/biovia-materials-studio (accessed on 12 July 2024).
  22. Dymkowski, K.; Parker, S.F.; Fernandez-Alonso, F.; Mukhopadhyay, S. AbINS: The modern software for INS interpretation. Phys. B 2018, 551, 443–448. [Google Scholar] [CrossRef]
  23. Fair, R.L.; Jackson, A.J.; Voneshen, D.J.; Jochym, D.B.; Le, M.D.; Refson, K.; Perring, T.G. Euphonic: Inelastic neutron scattering simulations from force constants and visualization tools for phonon properties. J. Appl. Cryst. 2022, 55, 1689–1703. [Google Scholar] [CrossRef]
  24. Fateley, W.G.; Dollish, F.R.; McDevitt, N.T.; Bentley, F.F. Infrared and Raman Selection Rules for Molecular and Lattice Vibrations: The Correlation Method; Wiley-Interscience: New York, NY, USA, 1972. [Google Scholar]
  25. Lin-Vien, D.; Colthup, N.B.; Fateley, W.G.; Grasselli, J.G. The Handbook of Infrared and Raman Characteristic Frequencies of Organic Molecules; Academic Press: Boston, MA, USA, 1991. [Google Scholar]
  26. Perrichon, A. On the spectral resolution of the broad-band indirect-geometry time-of-flight neutron spectrometer TOSCA. Nucl. Instrum. Methods Phys. Res. A 2022, 1041, 167401. [Google Scholar] [CrossRef]
  27. Bellamy, L.J. The Infrared Spectra of Complex Molecules, 3rd ed.; Chapman and Hall: London, UK, 1975; p. 16. [Google Scholar]
  28. Hudson, B.S.; Allis, D.G.; Parker, S.F.; Ramirez-Cuesta, A.J.; Braden, D.A.; Herman, H.; Prinzbach, H. The infrared, Raman and inelastic neutron scattering spectra of dodecahedrane: An Ih molecule in Th site symmetry. J. Phys. Chem. A 2005, 109, 3418–3424. [Google Scholar] [CrossRef] [PubMed]
  29. Parker, S.F.; Fortes, A.D.; Nye, D.W.; Day, S.J.; Kuck, D. Centrohexaindane, a unique polyaromatic hydrocarbon bearing the rare Cq(Cq)4 core: Inelastic neutron scattering, infrared and Raman spectroscopy. Chem. Eur. J. 2023, 29, e202302057. [Google Scholar] [CrossRef] [PubMed]
Figure 1. Idealised structures of (a) D2h pagodane and (b) Ih dodecahedrane.
Physchem 04 00036 g001
Figure 2. (a) Infrared spectrum of pagodane in CDCl3 solution (solvent subtracted) and (b) calculated infrared spectrum of D2h pagodane.
Physchem 04 00036 g002
Figure 3. (a) Raman spectrum of pagodane in CDCl3 solution (solvent subtracted) and (b) calculated Raman spectrum of D2h pagodane. The asterisks denote pagodane peaks.
Physchem 04 00036 g003
Figure 4. Solid-state structure of pagodane showing views along (a) the a-axis, (b) the a-axis, and (c) the c-axis.
Physchem 04 00036 g004
Figure 5. Solid-state spectra of pagodane: (a) Raman spectrum, (b) infrared spectrum, and (c) INS spectrum [5]. (a,b) were recorded at room temperature and (c) was recorded at ~20 K.
Physchem 04 00036 g005
Figure 6. INS spectra of pagodane: (a) generated after geometry optimisation only, (b) generated after lattice and geometry optimisation and (c) experimental INS spectrum at ~20 K.
Physchem 04 00036 g006
Figure 7. Convergence of the lattice- and geometry-optimised INS simulation of pagodane, with respect to q-point sampling (defined by real space cut-off). The plot is limited to the low-energy region including the slowly converging lattice modes.
Physchem 04 00036 g007
Figure 8. Calculated dispersion curves of pagodane after lattice and geometry optimisation. The colours are a guide to the eye to allow the modes to be tracked across the Brillouin zone.
Physchem 04 00036 g008
Figure 9. Infrared spectra of pagodane: (a) experimental solid state, (b) calculated solid state after lattice and geometry optimization, (c) isolated molecule, and (d) INS spectrum. The dashed vertical lines indicate the Au modes that are forbidden in the D2h-isolated molecule but become allowed in the solid state. In (d), the vertical bars show the calculated INS intensity; those in orange are the Au modes that are forbidden in the D2h-isolated molecule. The transition energies of the 11 modes are indicated by the numbered dashed vertical lines.
Physchem 04 00036 g009
Figure 10. Infrared (left panel) and Raman (right panel) spectra of pagodane in the C–H stretch region: (a) experimental solid state, (b) calculated solid state after lattice and geometry optimization, (c) calculated solid state after geometry optimization at the experimental lattice parameters, (d) isolated D2h molecule, and (e) experimental solution spectrum.
Physchem 04 00036 g010
Disclaimer/Publisher’s Note: The statements, opinions and data contained in all publications are solely those of the individual author(s) and contributor(s) and not of MDPI and/or the editor(s). MDPI and/or the editor(s) disclaim responsibility for any injury to people or property resulting from any ideas, methods, instructions or products referred to in the content.

