1. Introduction
Statistically, CO
2 accounts for approximately 70% of global greenhouse gas emissions [
1,
2]. As the primary driver of climate change, the accumulation of CO
2 in the atmosphere has led to a significant rise in global temperatures, resulting in adverse environmental impacts such as rising sea levels, increased frequency of extreme weather events, and loss of biodiversity [
3,
4]. To combat these challenges, substantial efforts have been made to develop technologies that reduce CO
2 emissions and mitigate their effects on the environment. Carbon capture and storage (CCS) techniques have shown significant potential for reducing CO
2 emissions from industrial sources. CCS involves a three-step process designed to mitigate CO
2 emissions from industrial processes and fossil fuel combustion. The first step is capturing CO
2 emissions at their source, such as power plants or industrial facilities. The captured CO
2 is then compressed and transported to a storage site via pipelines, ships, or trucks. Finally, the CO
2 is injected deep underground into geological formations, such as depleted oil and gas reservoirs or saline aquifers, where it is stored permanently to prevent its release into the atmosphere [
5,
6,
7]. Despite its potential, the implementation of CCS faces several technical and economic challenges. Technologically, the integrity of CO
2 storage in geological reservoirs poses high risks of leakage, leading to concerns about liability and inadequate storage capacity in different regions. Economically, the process requires significant capital investment in CO
2 capture, purification, liquefaction, transportation, and sequestration. Moreover, the energy-intensive nature of these processes can lead to an overall increase in energy consumption, offsetting some of the benefits of reduced CO
2 emissions. [
8,
9,
10].
In response to the limitations of CCS, CO
2 recycling has emerged as a complementary and sustainable alternative. CO
2 recycling techniques involve converting captured CO
2 into valuable chemicals and fuels, thereby transforming a major pollutant into useful products. This approach not only helps in reducing the amount of CO
2 released into the atmosphere but also provides economic incentives by generating revenue from the sale of these products. Examples of CO
2-derived products include urea, salicylic acid, and polycarbonates [
9]. Among various CO
2 recycling methods, the hydrogenation of CO
2 into methane (CH
4)—known as CO
2 methanation—is particularly promising due to its potential to integrate with renewable energy sources and contribute to the production of natural gas and brings potential elimination of the challenges of geological CO
2 storage [
11,
12,
13].
The primary source of methane today is fossil natural gas, but as this resource is finite and climate change concerns grow, research on alternative methanation methods has intensified [
14]. The methanation process involves the catalytic conversion of CO
2 and hydrogen (H
2) into methane (CH
4) and water (H
2O). This reaction, first introduced by Sabatier and Senderens in 1902, is exothermic and releases a significant amount of heat. Moreover, research into converting CO
2 to CH
4 in the Power to Methane system (PtM) by reacting it with renewable H
2 is underway within the framework of Power to Gas (PtG) technology [
15].
Methanation involves the production of methane from hydrogen and carbon oxides. These carbon oxides could be carbon monoxide, referring to CO methanation, or carbon dioxide, which refers to CO
2 methanation. Both reactions are exothermic and release high amounts of heat [
16,
17].
Also, the reverse water–gas shift reaction (RWGS) is always accompanied by the CO methanation reaction and is, therefore, also present during CO
2 methanation [
14]:
Catalytic methanation of CO
2 over fixed-bed reactors is generally performed at temperatures between 150 and 550 °C, depending on the nature of the catalyst used [
18,
19,
20].
The methanation reaction requires an efficient, economical, and selective catalyst [
8,
21]. The activity of a catalyst is influenced by the material it comprises, making the correct selection of the support material an important factor [
15,
16,
22]. Catalysts can be noble metals (primarily ruthenium (Ru) and rhodium (Rh)) and non-noble metals (nickel (Ni), cobalt (Co), or iron (Fe)) [
13].
Ru is the most active metal for the methanation reaction. Ru- and Rh-based catalysts are widely investigated due to their high activity and selectivity in the CO
2 methanation process at low temperatures [
8,
13,
23,
24]. Despite Ru being one of the cheaper noble metals, its use may entail some economic unsustainability due to relatively high loading [
13].
Nickel (Ni) catalysts are frequently used due to their low cost, availability, and adequate performance [
8,
25,
26]. Ni-based catalysts exhibit excellent selectivity for CH
4 formation [
13,
27]. However, the activity of these catalysts is limited to low temperatures below 250 °C [
8].
Recent advancements in catalyst development for CO
2 methanation have focused on enhancing the performance and stability of these materials to make the process more economically viable. Researchers have made significant progress by doping Ni-based catalysts with rare earth elements. These modifications have been shown to improve the catalysts’ activity and stability, addressing issues like low-temperature activity, dispersion, and resistance to sintering [
28,
29].
Additionally, novel support materials such as carbon nanotubes and mesoporous silica have been explored to further improve catalyst dispersion and resistance to agglomeration. These materials provide a high surface area and better structural integrity, which are crucial for maintaining catalyst performance over extended periods [
30]. Such innovations are essential for achieving higher conversion efficiencies and longer lifetimes of catalysts, ultimately enhancing the economic feasibility of the CO
2 methanation process [
30].
The design of the reactor and the optimization of process parameters are critical for maximizing the efficiency of the CO
2 methanation process. Different reactor designs, such as fixed-bed reactors, fluidized-bed reactors, and membrane reactors, have been studied for their suitability in methanation. Fixed-bed reactors are commonly used due to their simplicity and ease of operation, but they may suffer from issues such as hotspot formation and catalyst deactivation. Fluidized-bed reactors, on the other hand, offer better temperature control and improved mass transfer but are more complex to operate and maintain [
31,
32].
Recent research has also focused on optimizing process parameters such as temperature, pressure, and reactant ratios to enhance methanation efficiency. Studies have shown that lower temperatures and higher pressures favor methane production while minimizing CO formation [
32]. Additionally, the hydrogen-to-carbon dioxide (H
2/CO
2) ratio plays a significant role in determining the efficiency of the reaction. A stoichiometric ratio of 4:1 is generally considered optimal, but variations in this ratio can significantly affect the yield and selectivity of the process [
18,
32,
33].
Numerous studies have been conducted to explore the thermodynamics, kinetics, and catalytic mechanisms of CO
2 methanation. For example, Sharma et al. investigated the CO
2 methanation on Ru-doped ceria and found that Ru enhances the activity and stability of the catalyst at low temperatures [
23]. Similarly, Wei and Jinlong provided an overview of the methanation process, highlighting the importance of catalyst selection and reaction conditions in achieving high conversion efficiencies [
24].
Other researchers, such as Kopyscinski et al., reviewed the production of synthetic natural gas (SNG) from coal and dry biomass, emphasizing the technological advancements and challenges associated with methanation. Their work underscores the potential of CO
2 methanation as a sustainable alternative for natural gas production, especially when integrated with renewable energy sources [
22]. These studies collectively contribute to a deeper understanding of the methanation process and provide valuable insights for optimizing industrial applications.
This study compares various simulation approaches for CO
2 methanation processes, aiming to identify optimal conditions. It employs both numerical methods and an analytical approach developed in Microsoft Excel (Microsoft 365 MSO, version 2401 Build 16.0.17231.20236) to evaluate the available capabilities in chemical process simulation software. While commercial options are popular, a study highlights the accessibility and advantages of open-source software [
34]. Specifically, COCO, built on CAPE-OPEN technology, offers a comprehensive environment for steady-state process simulation, facilitating thorough process assessment and optimization [
35]. On the other hand, DWSIM, with its strong thermodynamic engine and standalone thermodynamic library (DTL), provides robust analysis capabilities but may face challenges in dynamic simulations due to iteration complexities [
36].
This research underscores the importance of selecting appropriate simulation tools for methanation process optimization. COCO emerges as a valuable resource, providing access to CAPE-OPEN technology and facilitating interoperability testing within the framework [
35]. Conversely, DWSIM offers powerful thermodynamic capabilities but may require additional considerations for dynamic simulations due to its modular solution techniques [
36]. By comparing these approaches, this study contributes to a deeper understanding of methanation process simulation and aids in guiding software selection for chemical process engineers and researchers.
2. Materials and Methods
The steady-state methanation process was simulated at thermodynamic equilibrium with three distinct approaches: an analytical method and two different numerical methods. Simulations were performed considering only the CO
2 methanation and RWGS reactions; thus, unwanted reactions such as coke formation were not considered. As this was a theoretical study, other important parameters such as catalyst choice, reaction kinetics, and transport were also omitted. The analytical method was executed using the Microsoft Excel platform, involving a stoichiometric approach to solving the material balance equations using equilibrium constants. This method provides a straightforward and accessible way to analyze the methanation process, leveraging the capabilities of Excel for data manipulation and calculation as Pashchenko (2020) proved in his study [
37].
Considering the CO
2 methanation reaction, the equilibrium constant for partial pressures is defined as,
With
being the total pressure,
the partial pressure of each constituent
i,
the reference pressure (1 bar), and
the molar fraction value, the resulting equilibrium constant equation is as follows:
As for the RWGS reaction, the equilibrium constant equation is given by:
Another expression for equilibrium constants utilizing Gibbs free energy can be employed to solve the system of material balance equations. This expression is given by:
This method allows for determining the molar fraction of each component in the reaction products using the thermodynamic equilibrium state.
The numerical methods employed were simulations using COCO (CAPE-OPEN to CAPE-OPEN) and DWSIM, both free and open-source chemical process simulation software. COCO, more precisely the CAPE-OPEN Flowsheet Environment (COFE), offers a comprehensive environment for steady-state process simulation, facilitating thorough process assessment and optimization. DWSIM, with its strong thermodynamic engine and standalone thermodynamic library (DTL), provides robust analysis capabilities but may face challenges in dynamic simulations due to iteration complexities.
Simulations with both numerical software used the Peng–Robinson (version 1.1) thermodynamic package and assumed the ideal gas law.
Simulations for the methanation process utilize a pure source of CO
2 and H
2 with a stoichiometric ratio of 1 mole of CO
2 to 4 moles of H
2 and a total intake of fuel of 5 kmol/min. The effect of temperature, pressure, hydrogen-to-carbon (H
2/CO
2) ratio, and heat balance was studied to evaluate the optimal operational conditions for each process. Temperatures ranged from 300 °C to 550 °C as pressure ranged from 1 bar to 25 bars. H
2/CO
2 ratios of 2 and 3 were considered, but higher ratios were also investigated by [
38].
Results from all models were evaluated and compared to assess validation.
For COCO simulations, the simulation model used is presented in
Figure 1. The flowsheet consisted of 1 mixer, 1 compressor, 1 heater, and a single equilibrium reactor that operates isothermally.
DWSIM simulations utilized a different flowsheet where one additional reactor was needed, as shown in
Figure 2. This measure was necessary due to convergence errors when both reactions occurred in the same reactor. Consequently, two distinct reactors operating under isothermal conditions were used.
The first reactor is where the CO2 methanation reaction occurs (named the “Methanation Reactor”), and the second reactor is used for the RWGS reaction (named the “RWGS Reactor”). Convergence was achieved, and simulations were successfully validated.
3. Results and Discussion
3.1. Methane Production
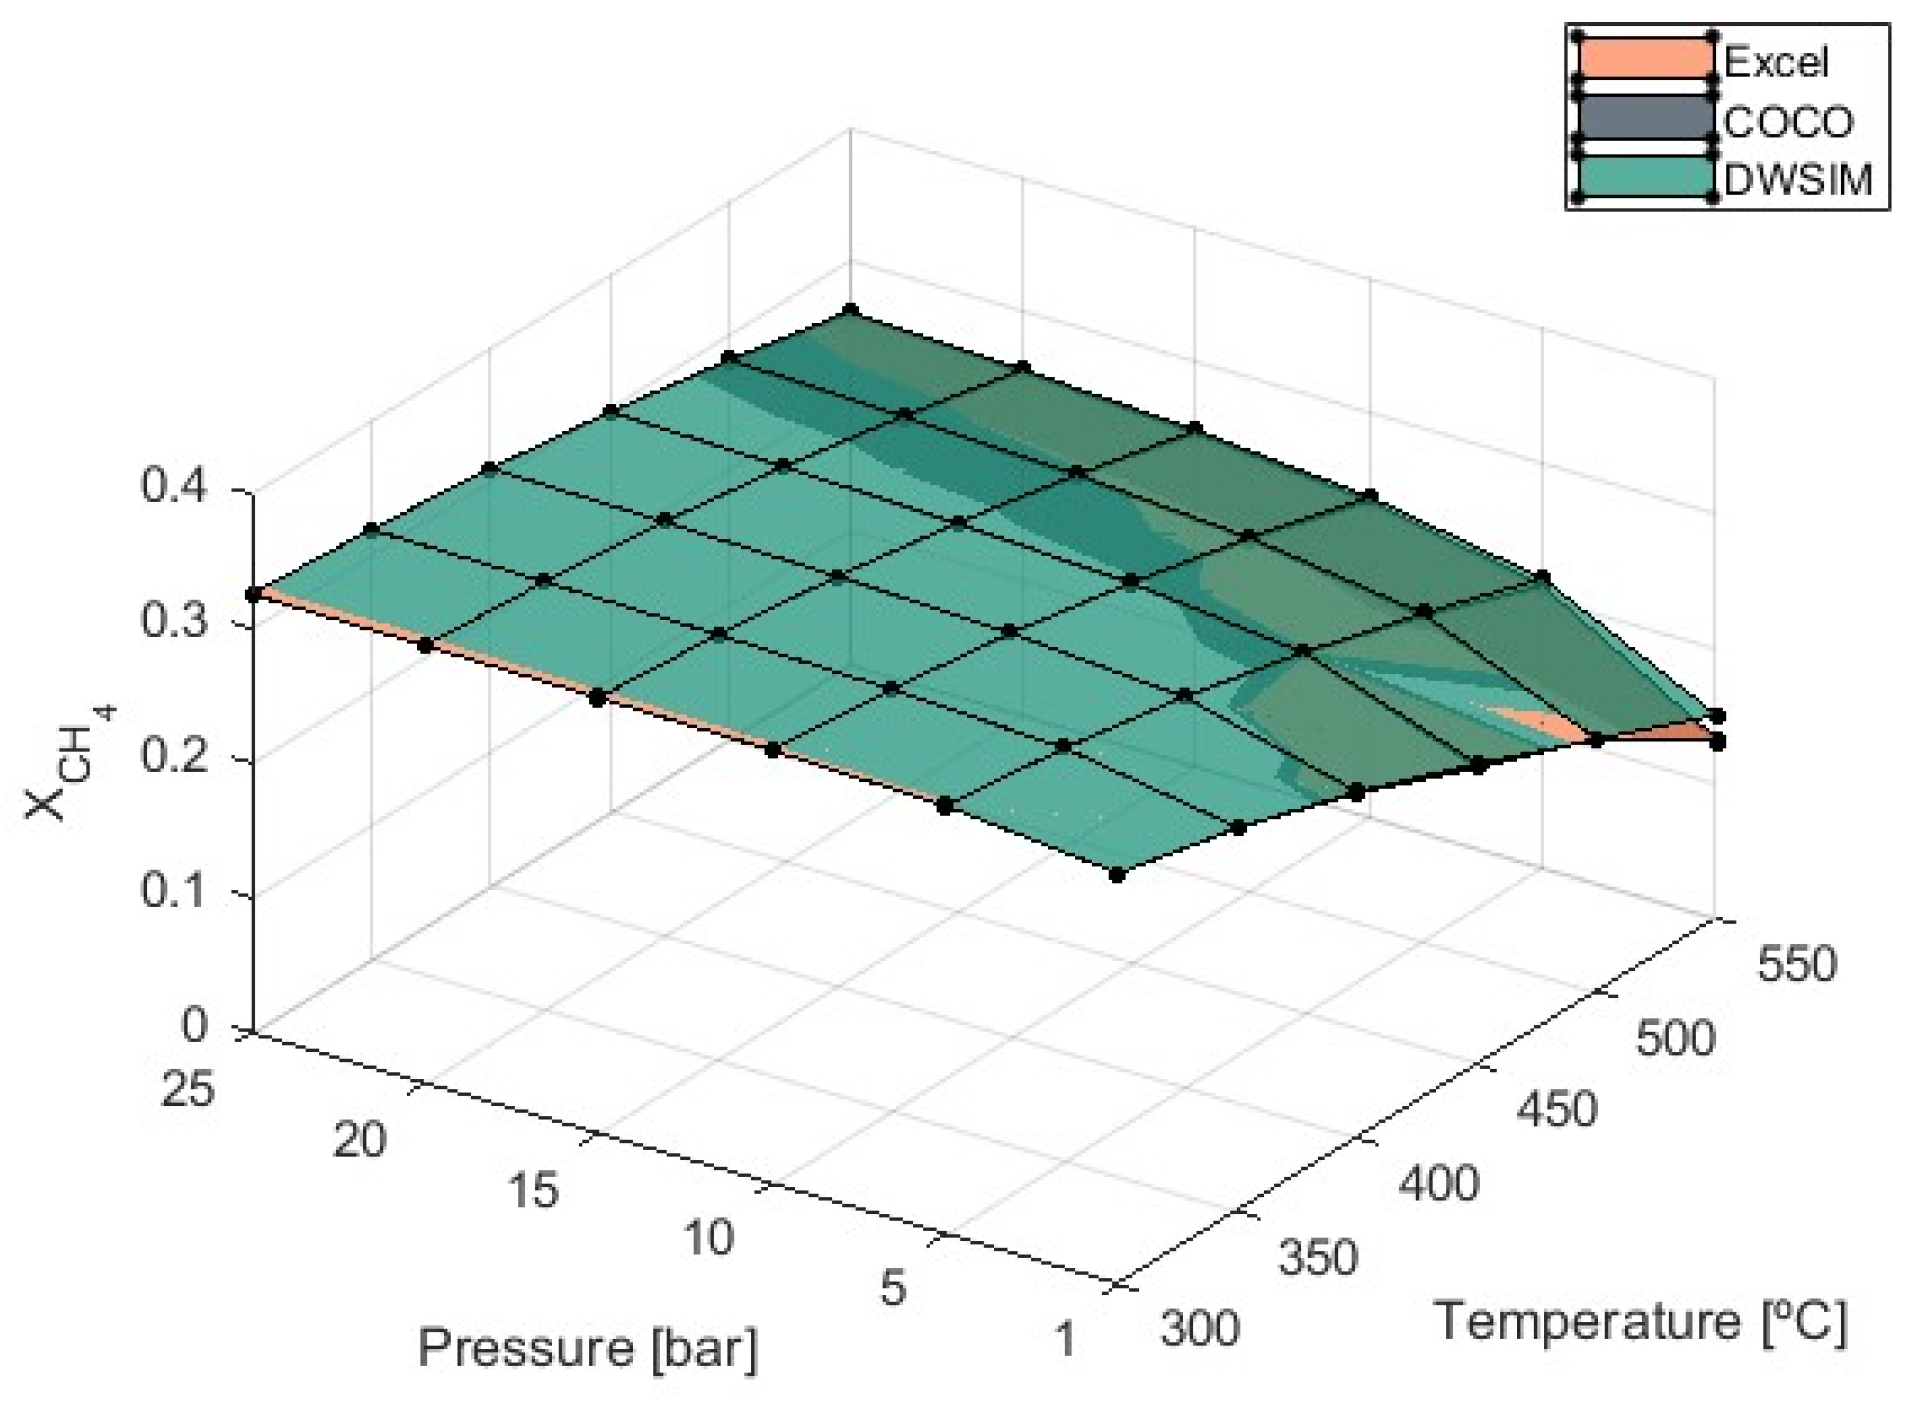
The combination of the methanation reaction and the RWGS reaction generates an overall exothermic process, and due to this, it is expected that lower temperatures would favor the production of methane. The graph presented in
Figure 3 confirms that CH
4 formation decreases as the temperature increases, while higher pressures favor the reaction and, thus, increase
.
Optimal theoretical conditions for methane formation were determined at 300 °C and 25 bar of pressure, resulting in a CH
4 molar fraction of 0.325 from all three simulation models. Additionally, pressure’s influence on
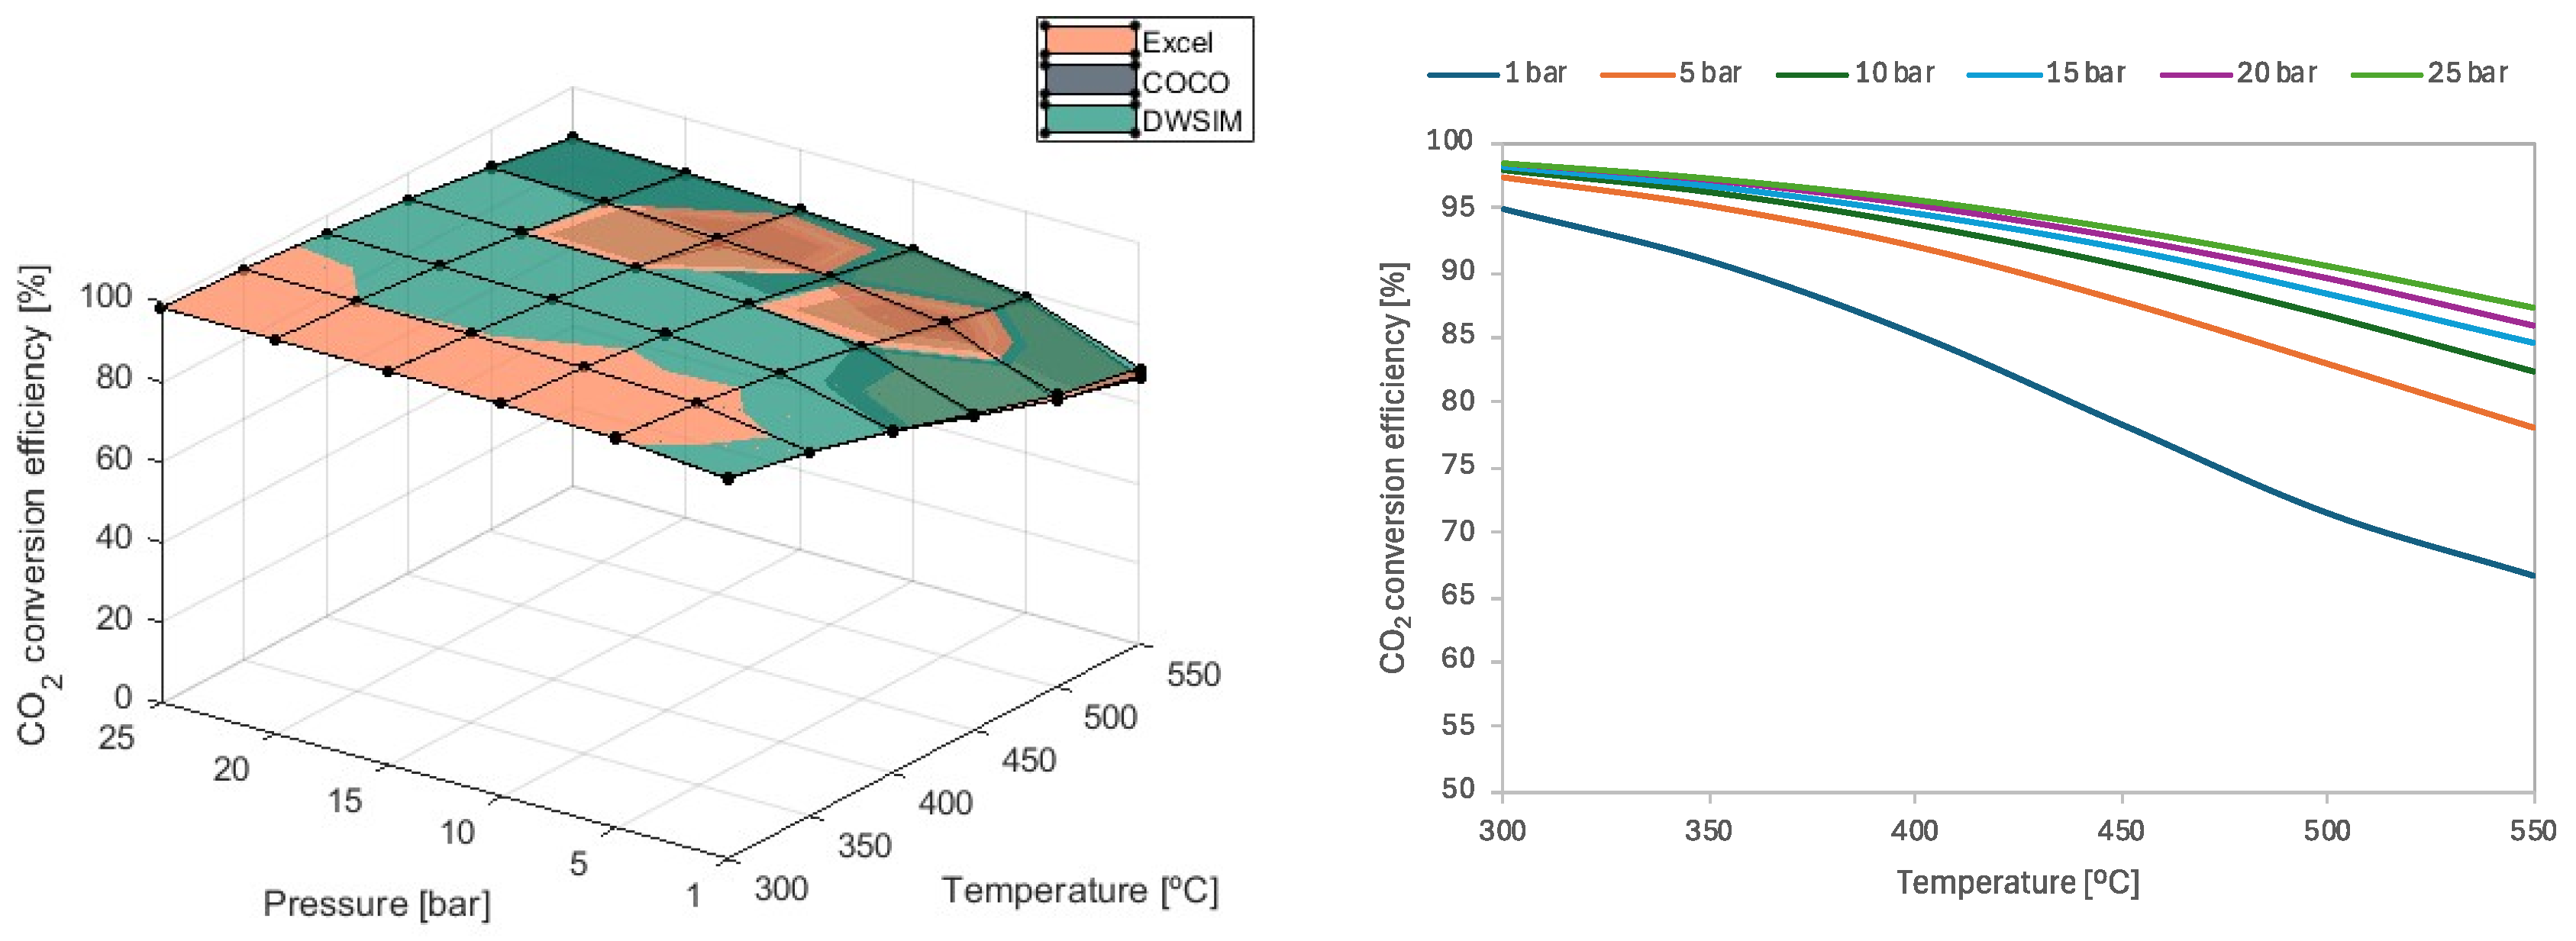
is reduced when temperatures are kept low. This suggests that if the heat of the reaction is not managed well and the system temperature increases, higher pressures will be required to achieve better conversion efficiency, as shown in
Figure 4.
For temperatures such as 300 °C and 350 °C, CO2 conversion efficiency above 90% is achieved using any value for pressure. On the other hand, pressure starts to play an important role in conversion efficiency when increasing the temperature of the reaction. For instance, using 1 bar of pressure at higher temperatures results in a 14% decrease in conversion efficiency compared to a reaction pressure of 5 bars. Similarly, when pressures of 5 bars are used, the unfavorable effect on conversion efficiency is reduced to an average of 5% when compared to results obtained with P = 10 bars. As the system’s pressure increases, this negative effect lessens. Consequently, the use of greater pressure may not be worth the cost of implementation, even if efficiency increases slightly. These results align with the literature presented by Schaaf et al., which investigated the thermodynamic aspects of CO2 methanation.
All three simulation models provided matching results and were validated. At P = 1 bar, DWSIM simulation results were shown to be slightly superior to Microsoft Excel and COCO results, with differences growing as the temperature increased. This discrepancy reached a maximum value of 13.1% at T = 550 °C and 1 bar.
3.2. Carbon Monoxide and Carbon Dioxide Molar Fraction
To enhance CO
2 conversion during the methanation process, the RWGS reaction utilizes CO
2 and H
2 to produce CO and H
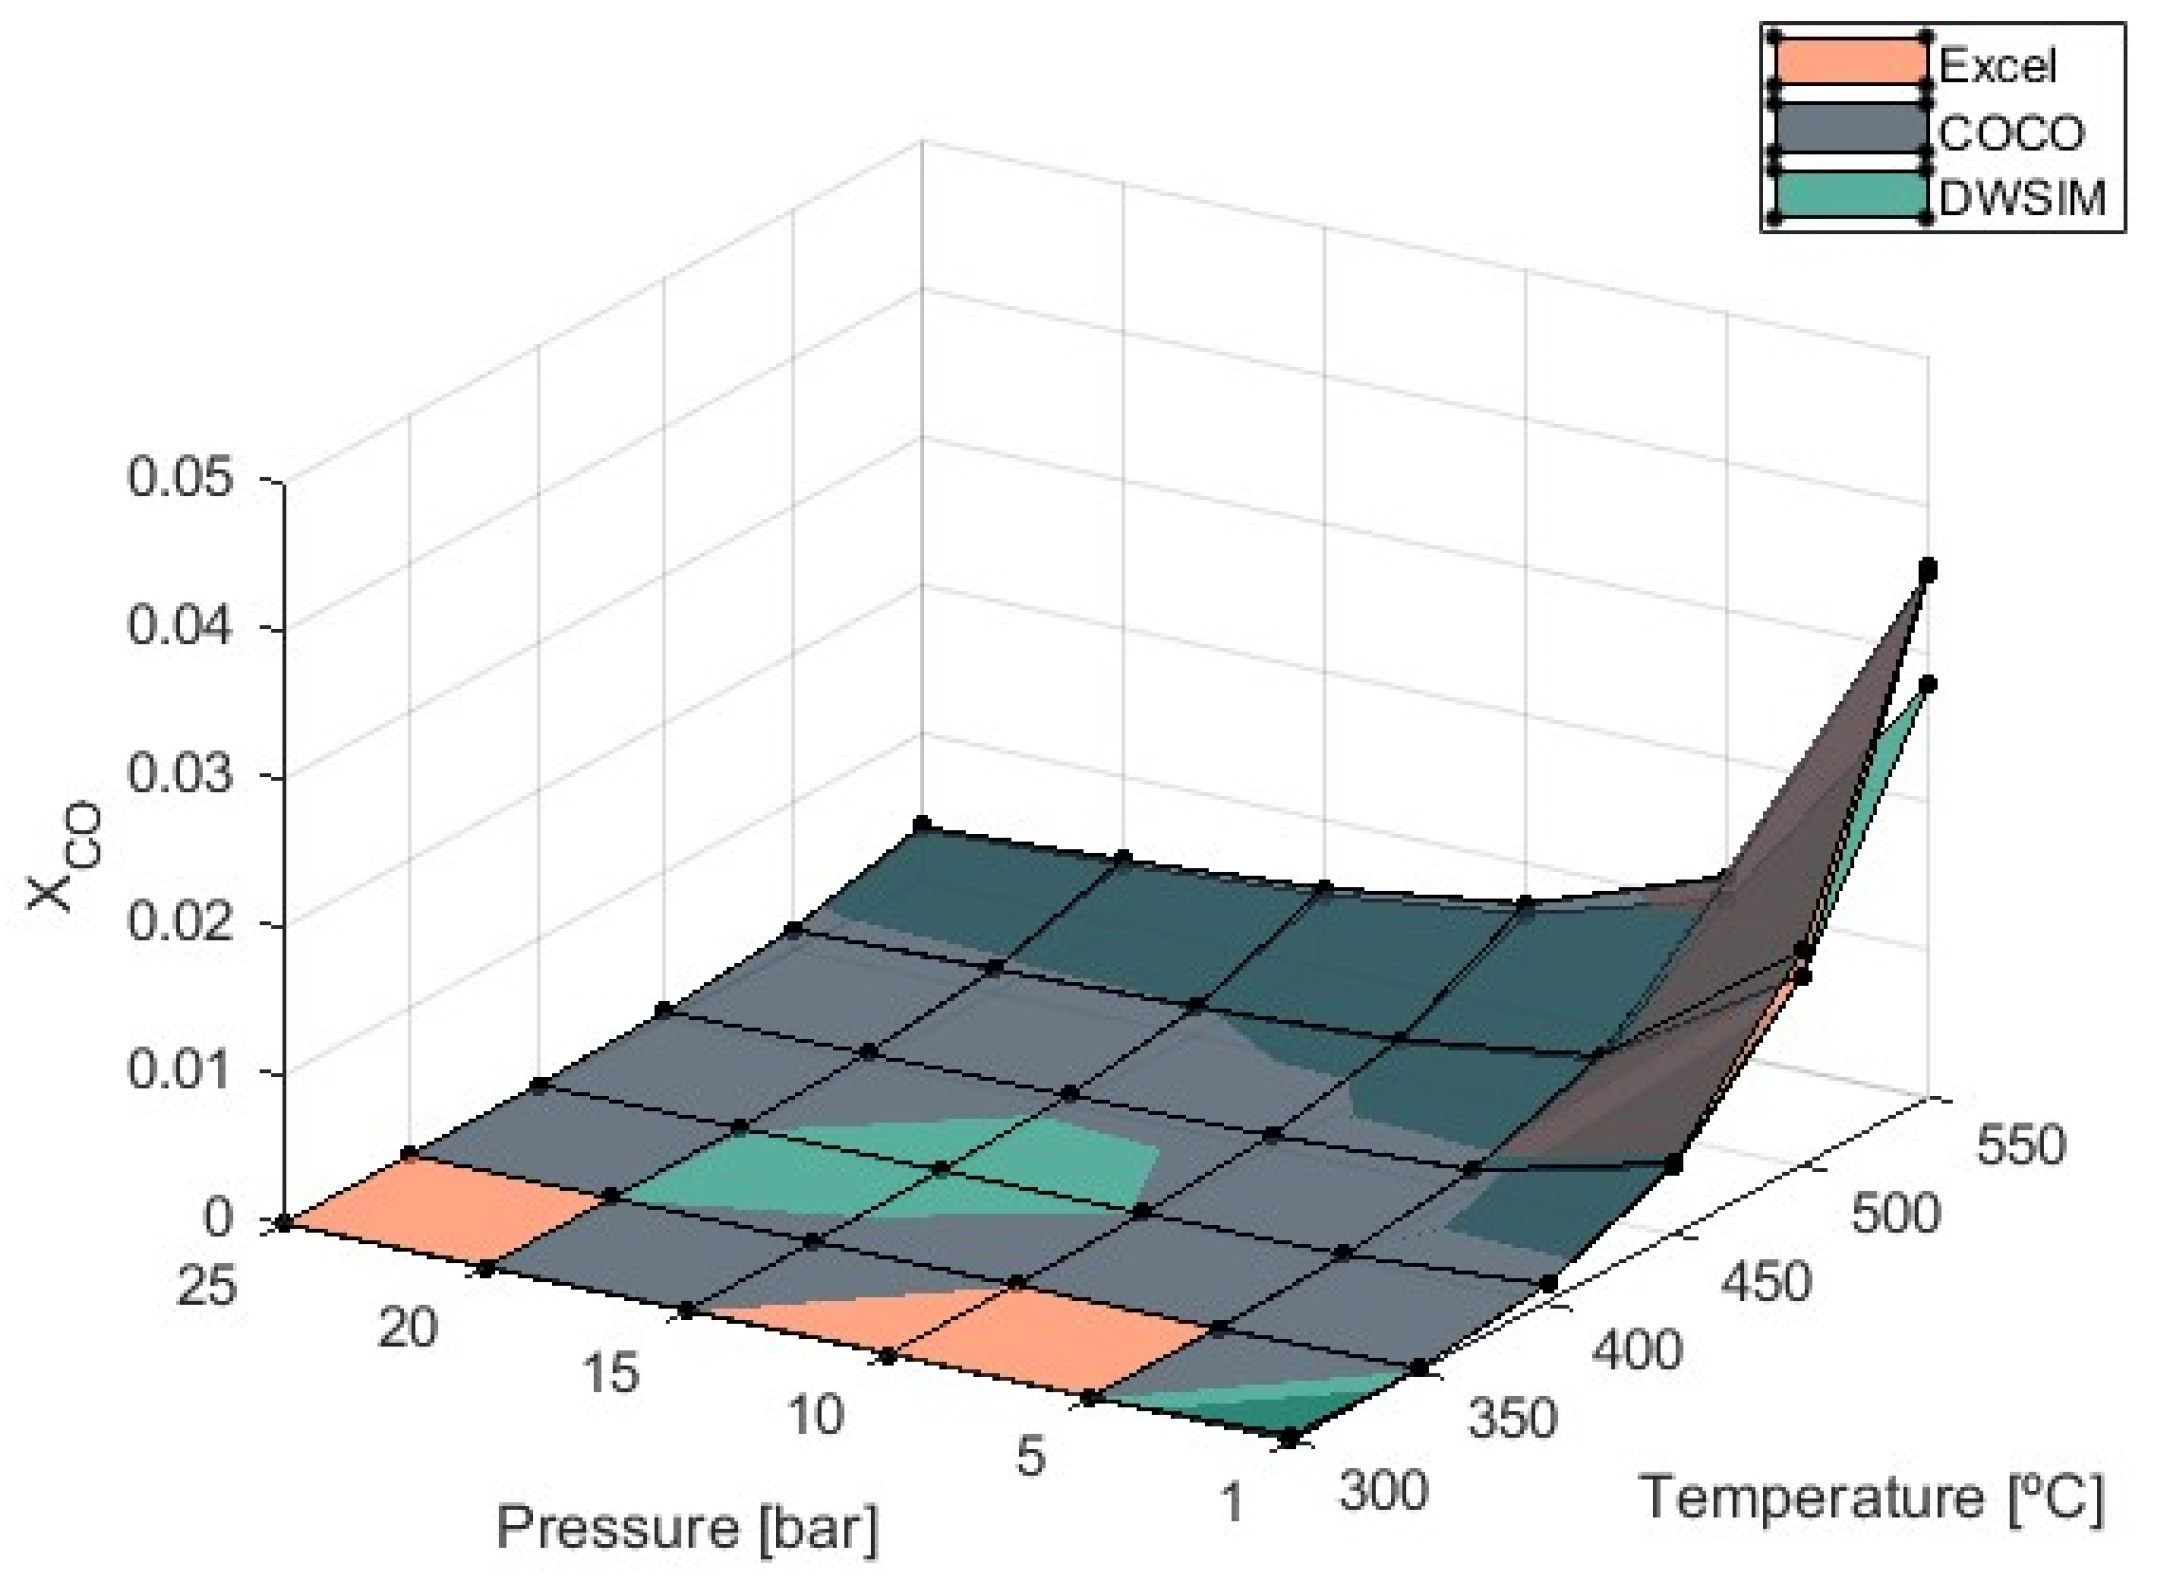
2O. This reaction is endothermic and favored by high temperatures, as shown in
Figure 5.
As the temperature in the reactor rises, CO
2 conversion to CH
4 decreases, and the RWGS reaction initiates the formation of CO. Controlling CO formation is crucial in avoiding catalyst deactivation [
39].
According to the graph in
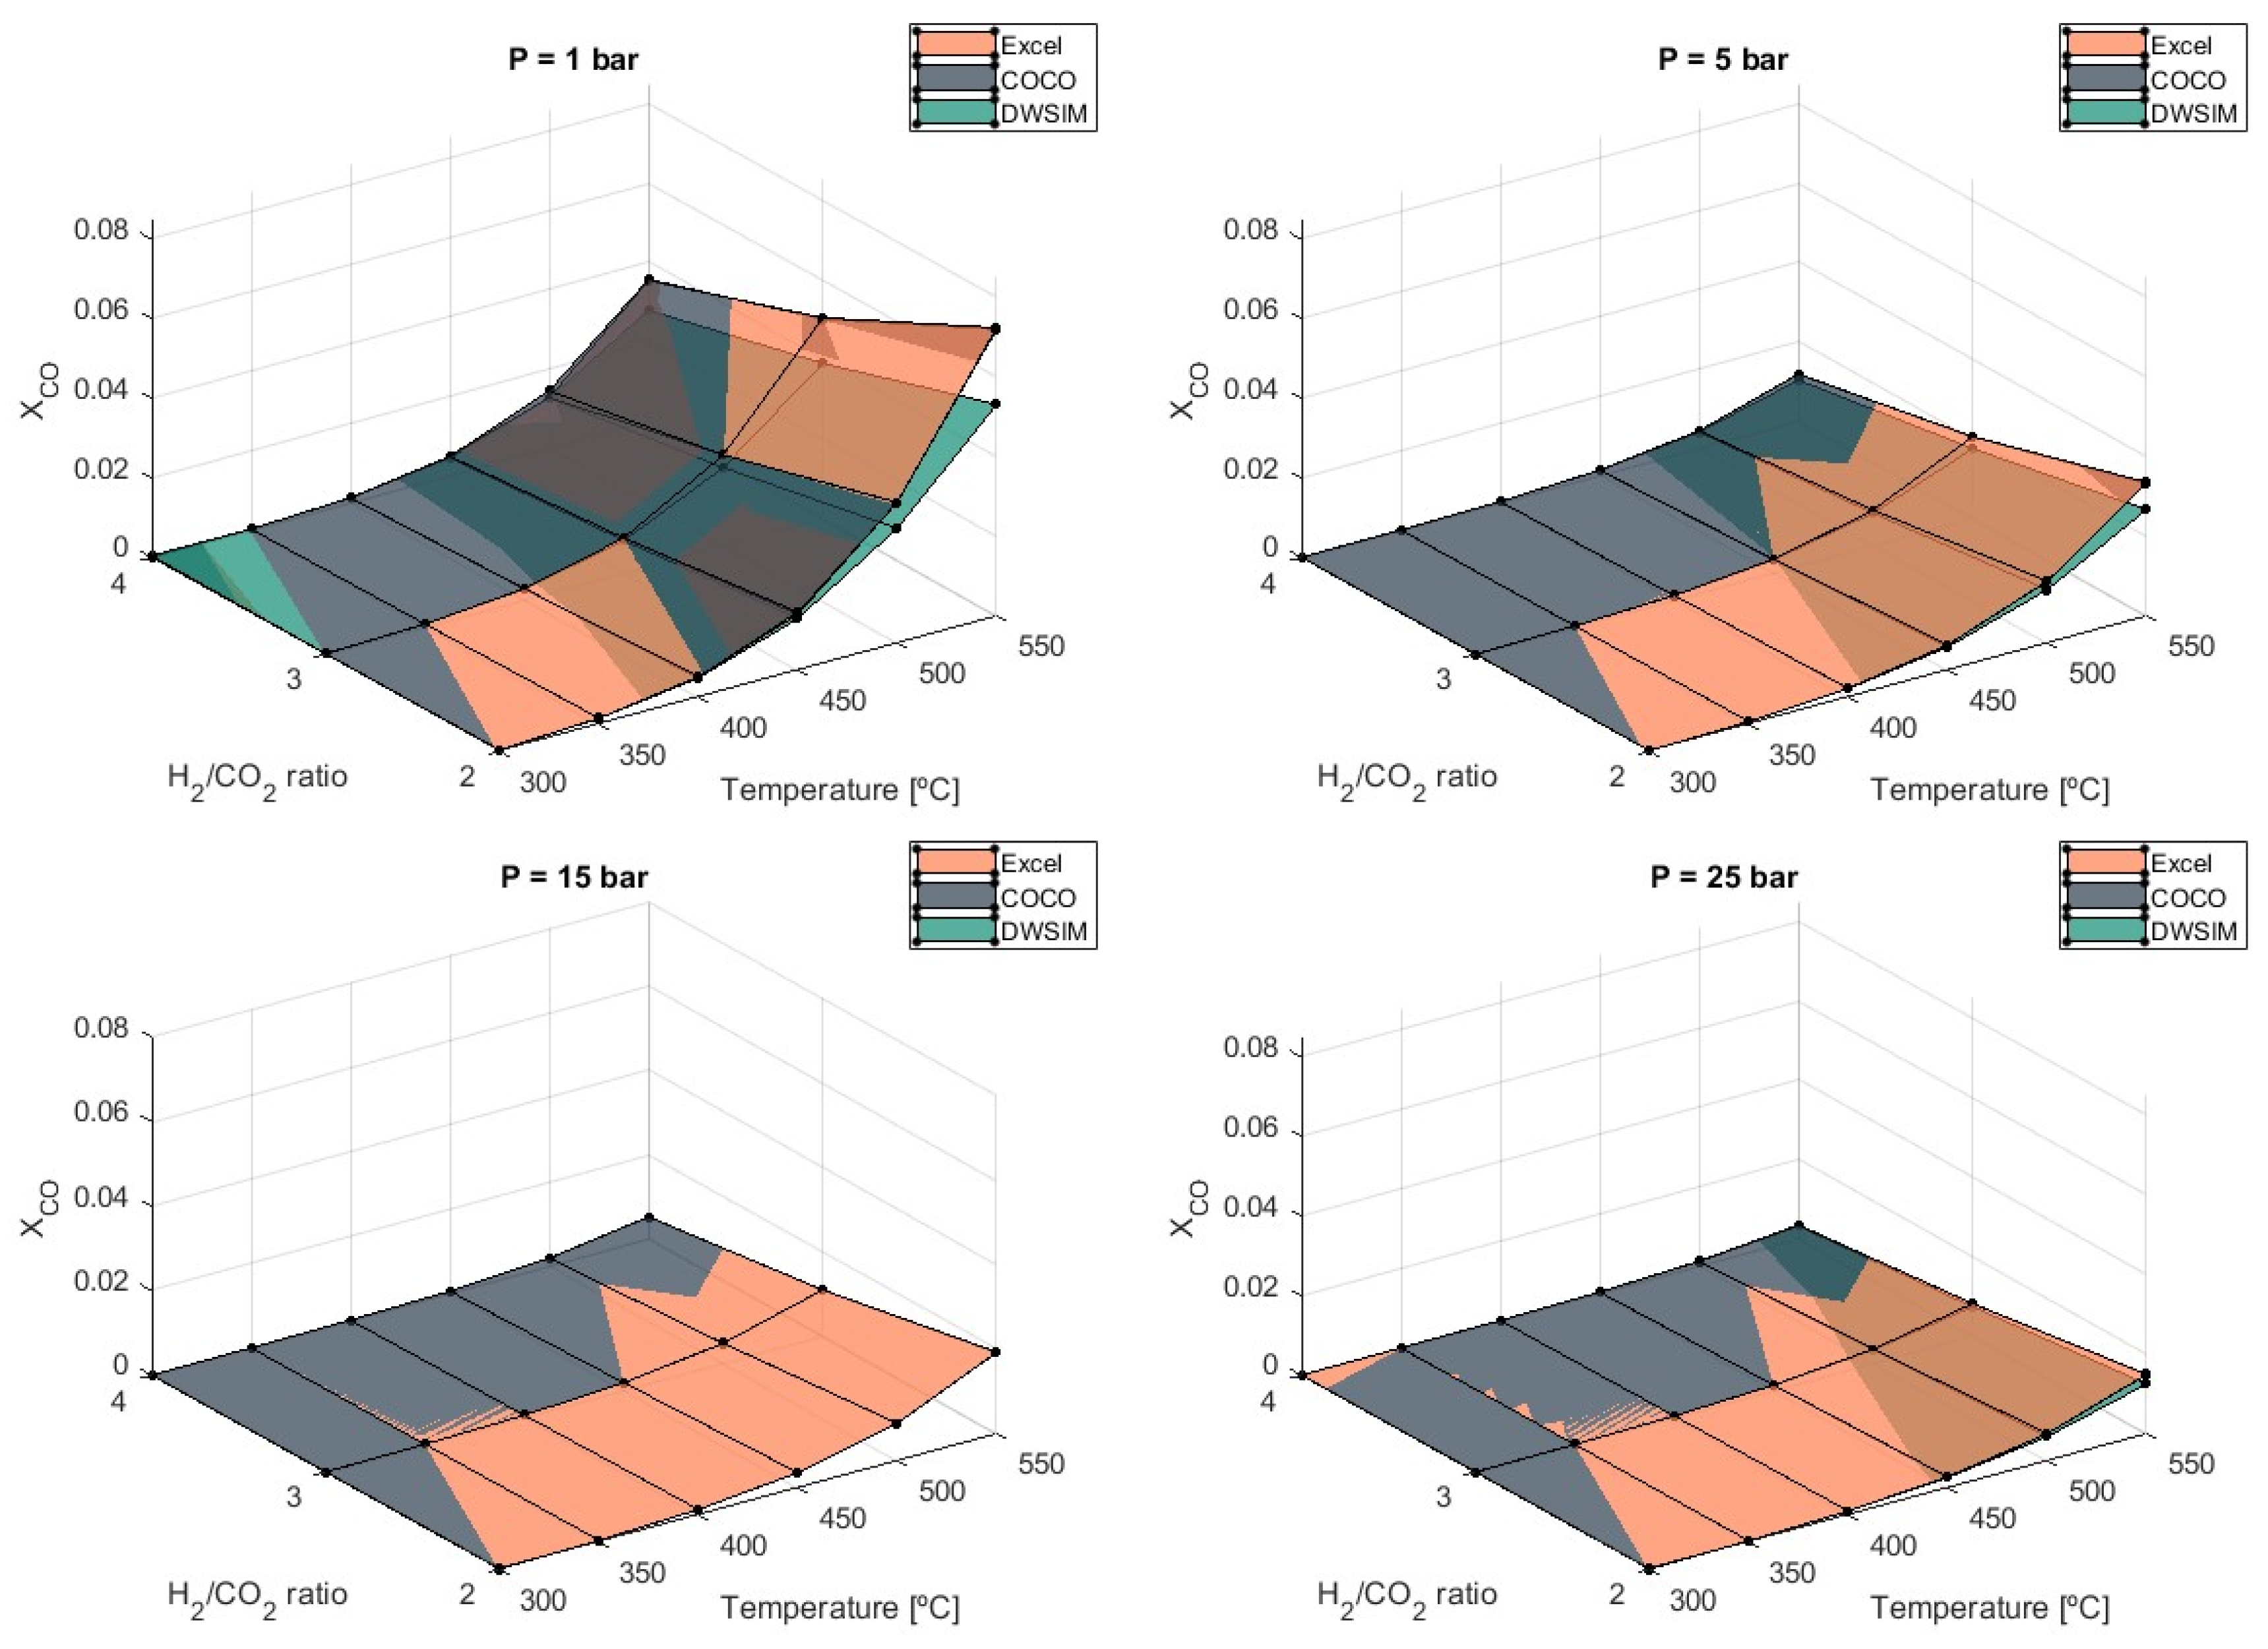
Figure 5, the endothermic nature of the RWGS reaction raises the values of
as the temperature increases, indicating that the process should proceed at lower temperatures. If higher temperatures are used, the formation of CO significantly amplifies when temperatures reach 450 °C, especially at pressures of 1 bar.
Simulations report a 244% increase in when temperatures rise from 500 °C to 550 °C and a 297% increase when temperatures of 450 °C over 400 °C are considered at 1 bar of pressure. Maximum values were obtained by COCO simulations, with equal to 0.036 at T = 550 °C and P = 25 bar. Under these maximum production state circumstances, Microsoft Excel simulations produced equal to 0.035, and DWSIM simulations produced 0.028. As CO production increased, it was verified that the divergence of DWSIM results compared to the other two models also increased. Unlike DWSIM simulations, which show a 12% lower compared to the other models, COCO and Microsoft Excel simulations produced results with differences of less than 1%.
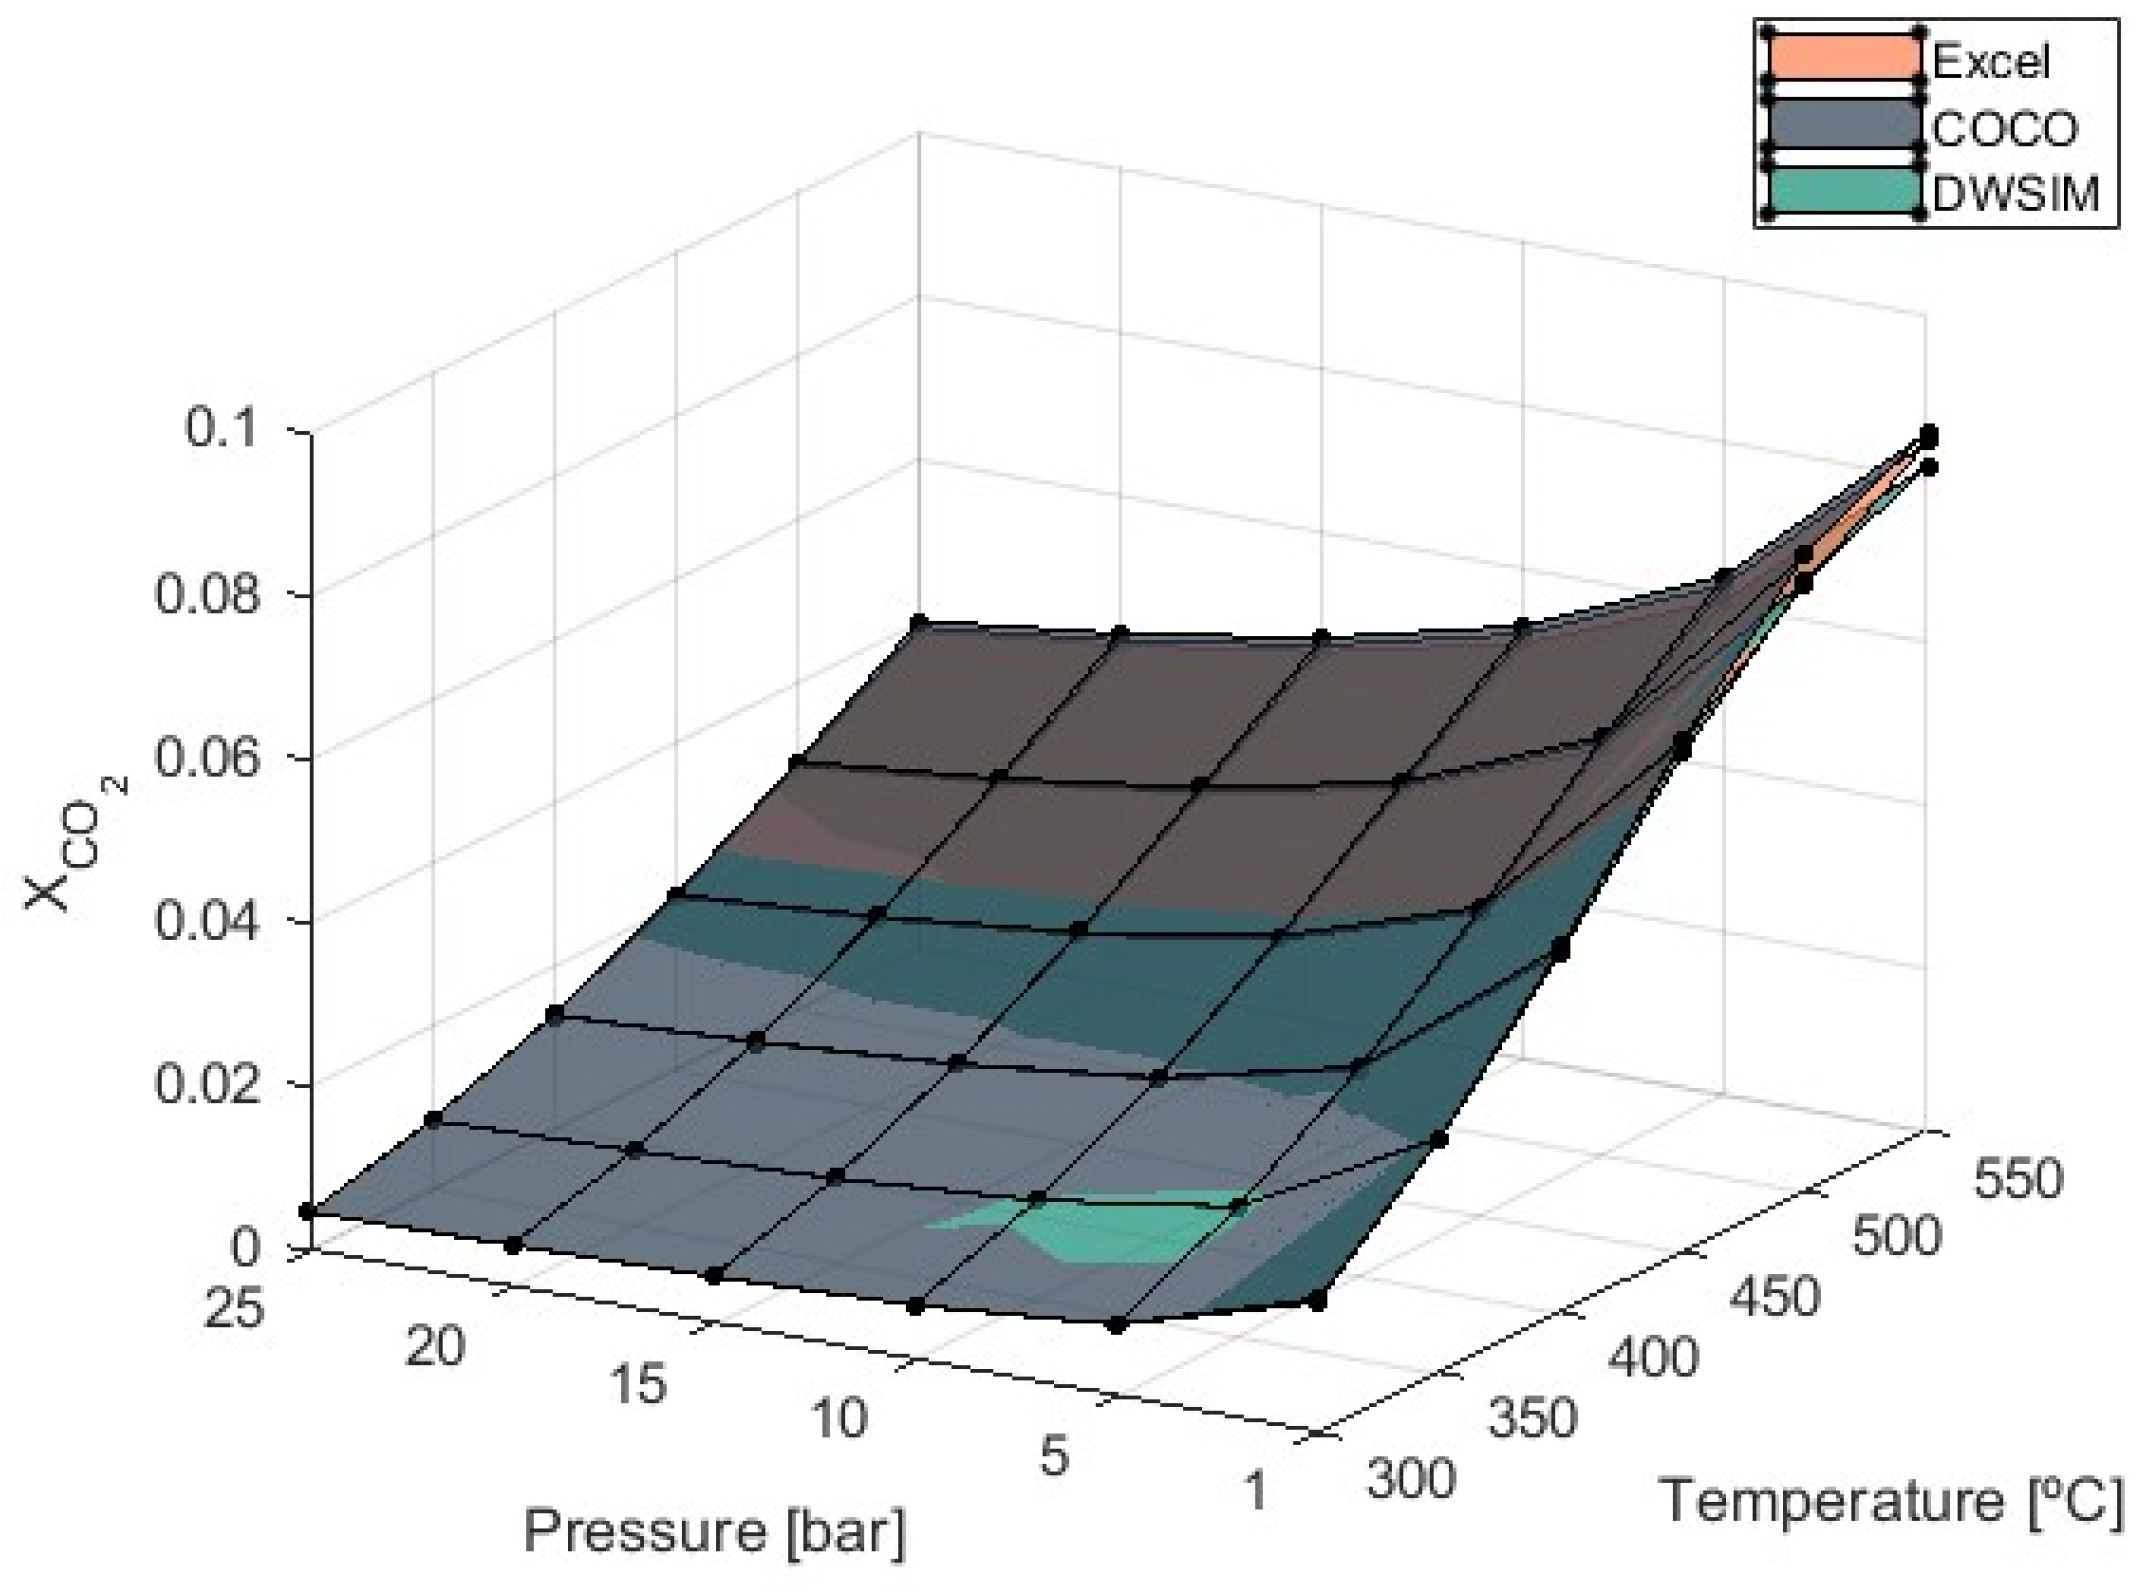
Figure 6 illustrates the influence of temperature and pressure on the CO
2 molar fraction in the products of the reaction.
It was previously determined that increasing the pressure and decreasing the reaction temperature would reduce the presence of CO2 in the reaction products due to increased reaction efficiency. Maximum values of equal to 0.084, 0.086, and 0.081 were obtained at T = 550 °C and P = 1 bar from Microsoft Excel (version 2406), COCO (version 3.7), and DWSIM (version 8.3.4) simulations, respectively. Once again, DWSIM simulations provided results that were, on average, 4% lower compared to the other models.
3.3. Heat Balance
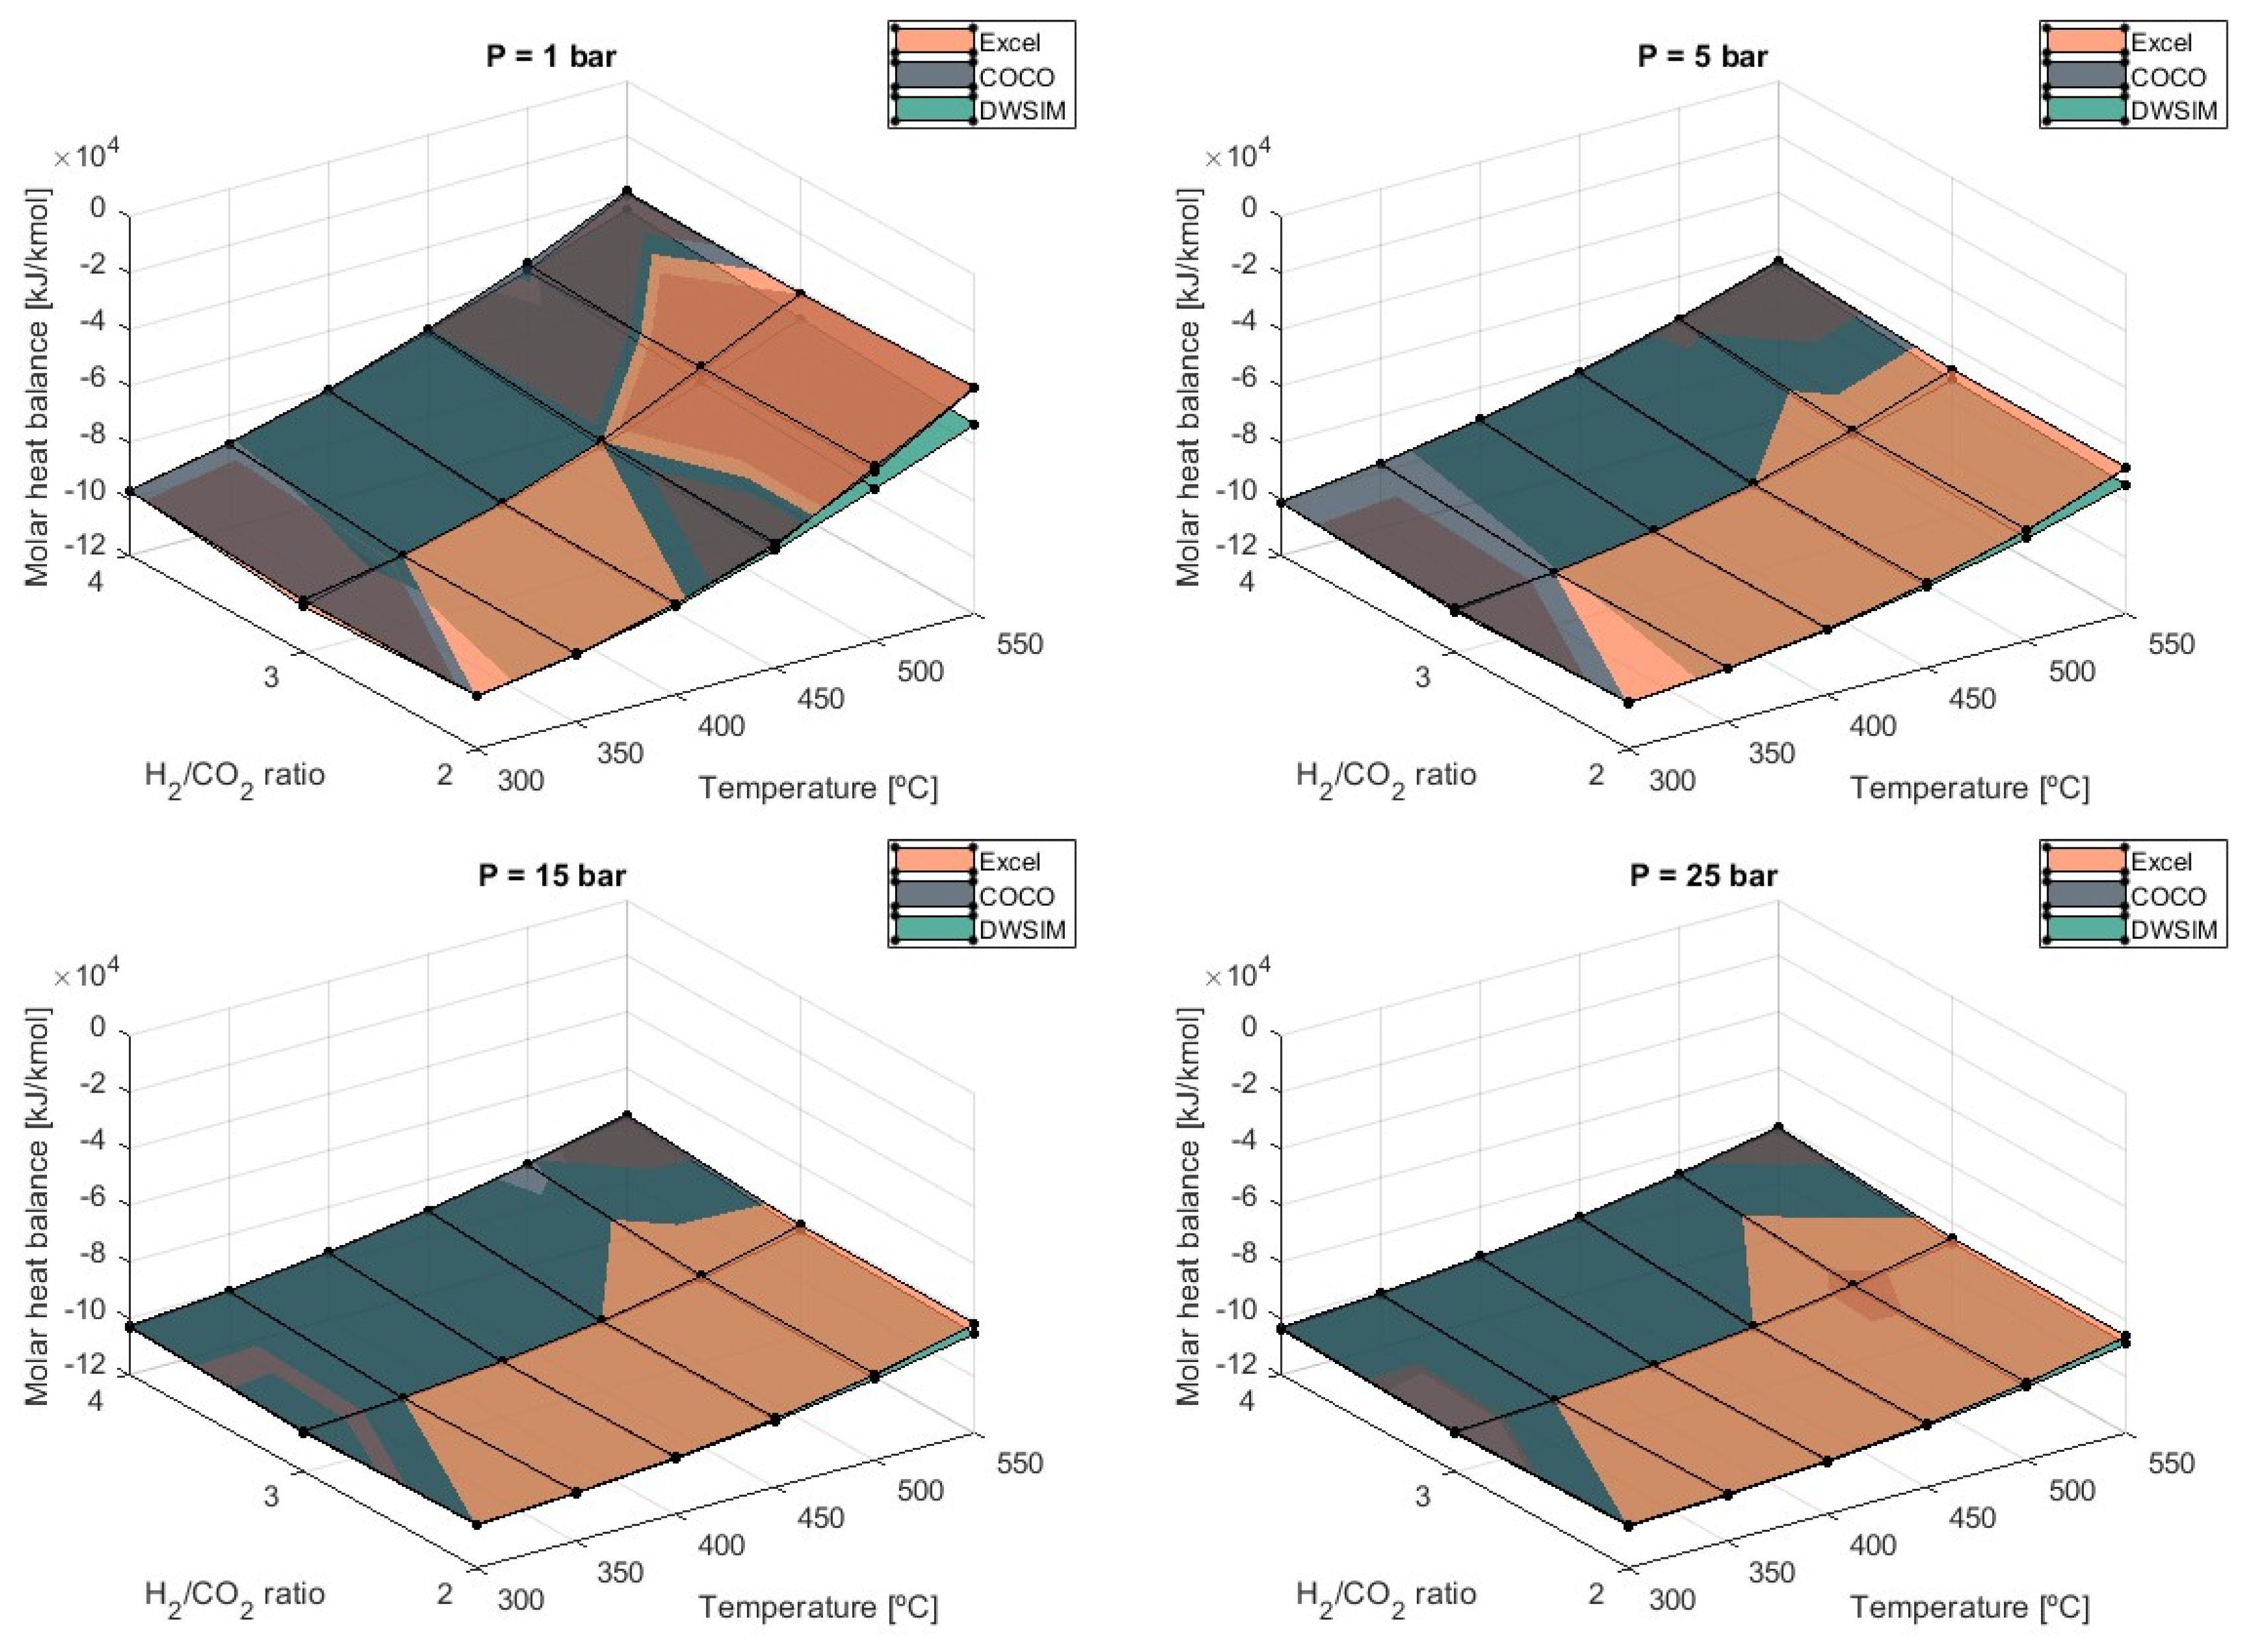
Heat balance values obtained are negative due to the exothermic nature of the methanation process, indicating that heat is released during the reaction. Managing this energy output might be difficult and can lead to reaction failure [
40].
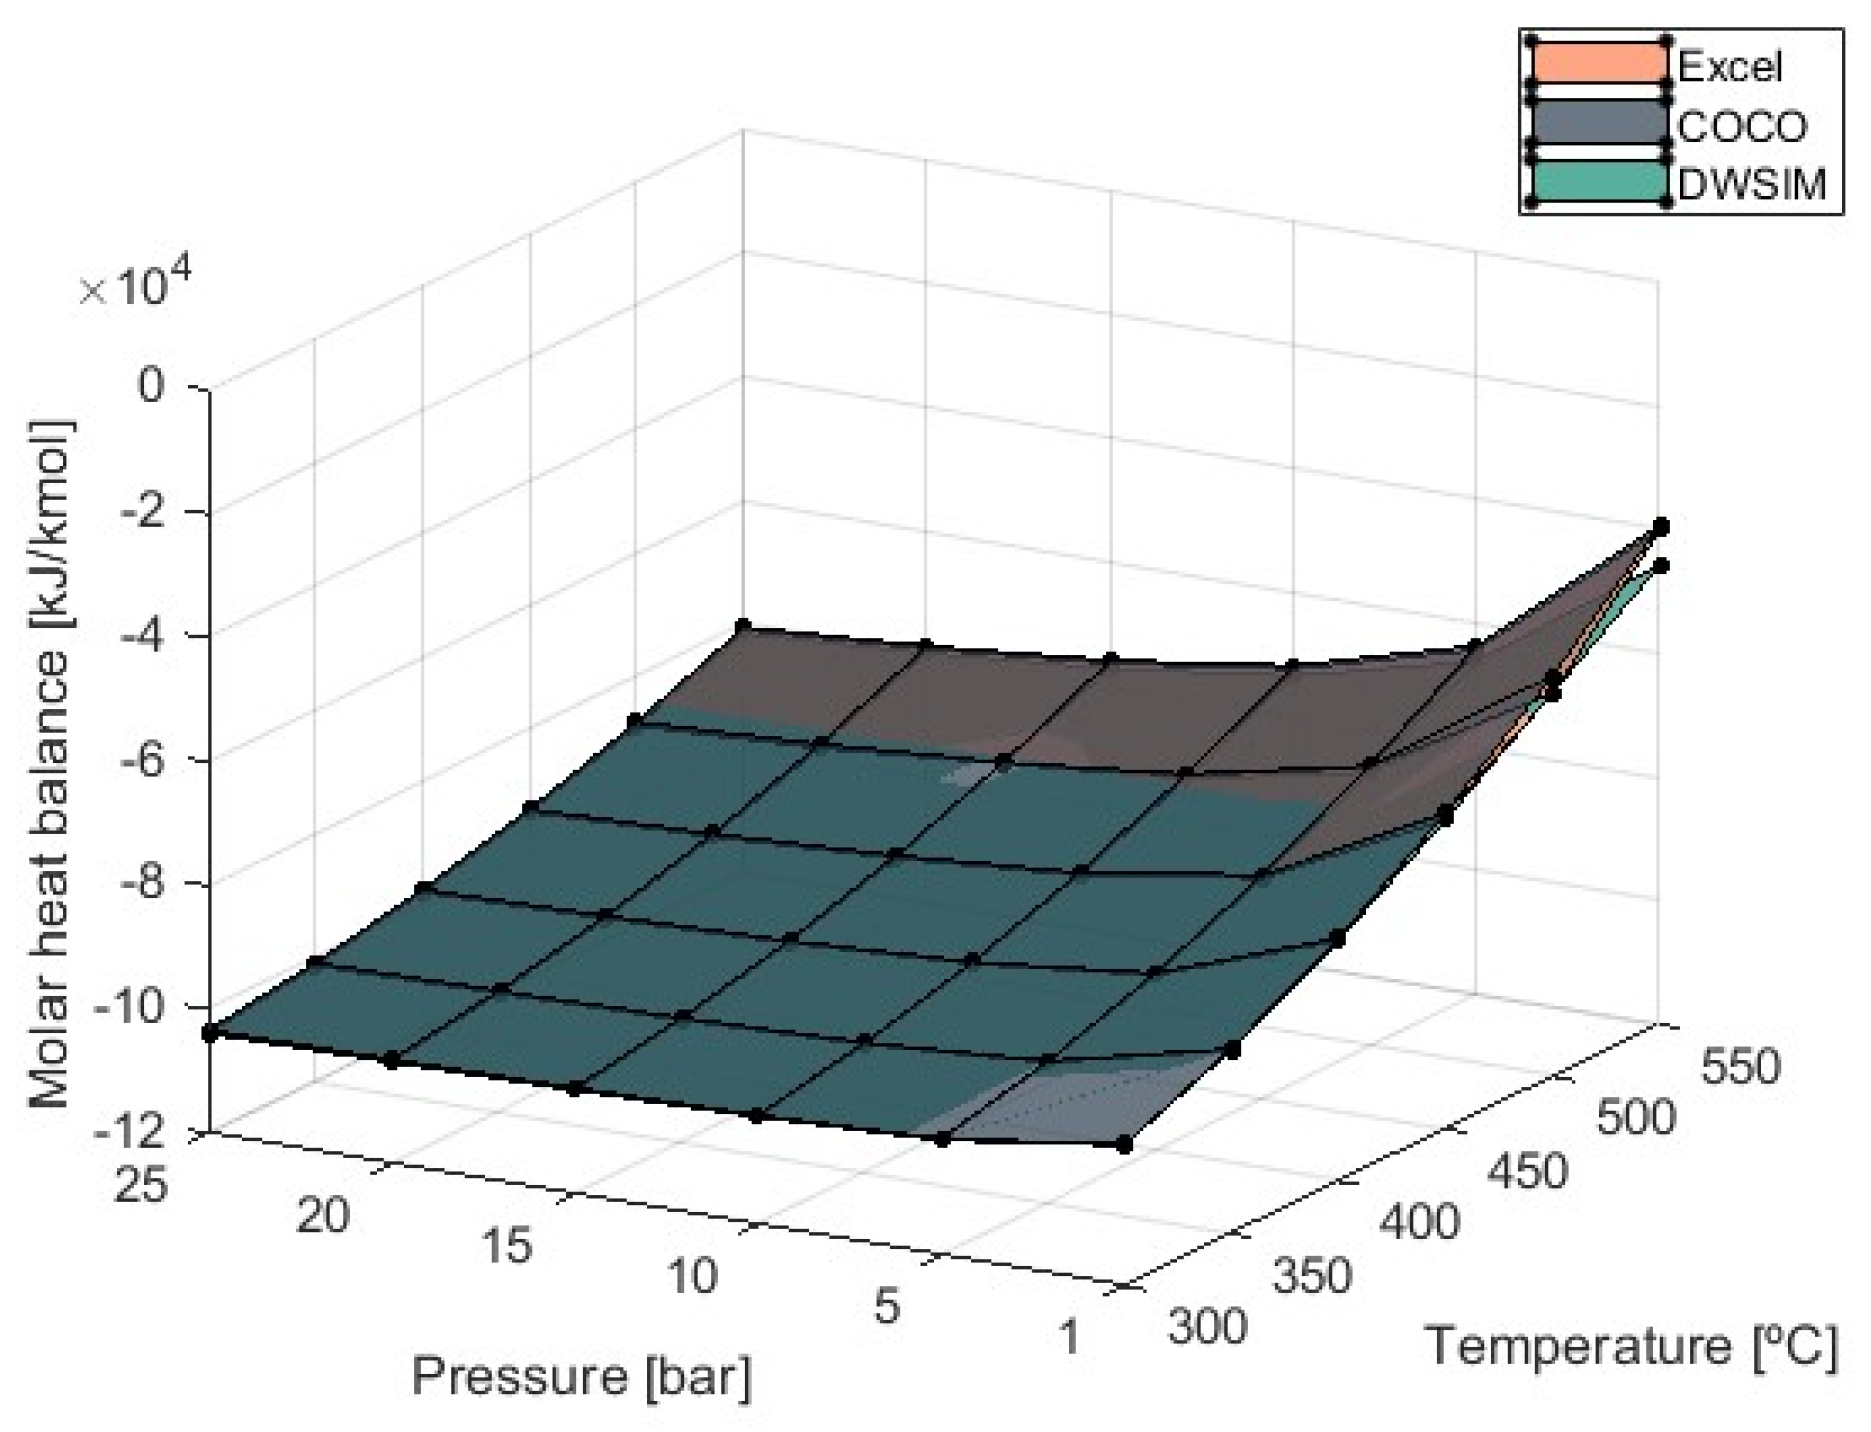
Figure 7 shows the results regarding molar heat balance obtained from the simulations performed.
The value of the equilibrium constant for the methanation reaction increases as temperatures lower, and thus, the products’ enthalpy is higher. This signifies that the heat balance is maximized at lower temperatures and can reach an estimated value of −103,923 kJ/kmol at 300 °C and 25 bar of pressure according to the results obtained from the DWSIM simulations. This amount of heat exchanged can be lowered by increasing the temperature at the detriment of efficiency. Pressure also has a negative effect because higher values tend to increase the heat balance, especially with higher temperatures in use. Overall, there is no significant difference in results obtained from each simulation model, and they are in agreement. Despite this, a deviation begins to appear at 1 bar of pressure and high temperatures when DWSIM simulations resulted in a heat balance higher in modulus compared to COCO and Microsoft Excel results. At T = 550 °C, DWSIM-generated values are 16.4% higher in modulus.
3.4. Hydrogen-to-Carbon Dioxide (H2/CO2) Ratio Study
Another important study conducted in this work was to evaluate the influence of non-stoichiometric molar fractions of H
2 and CO
2.
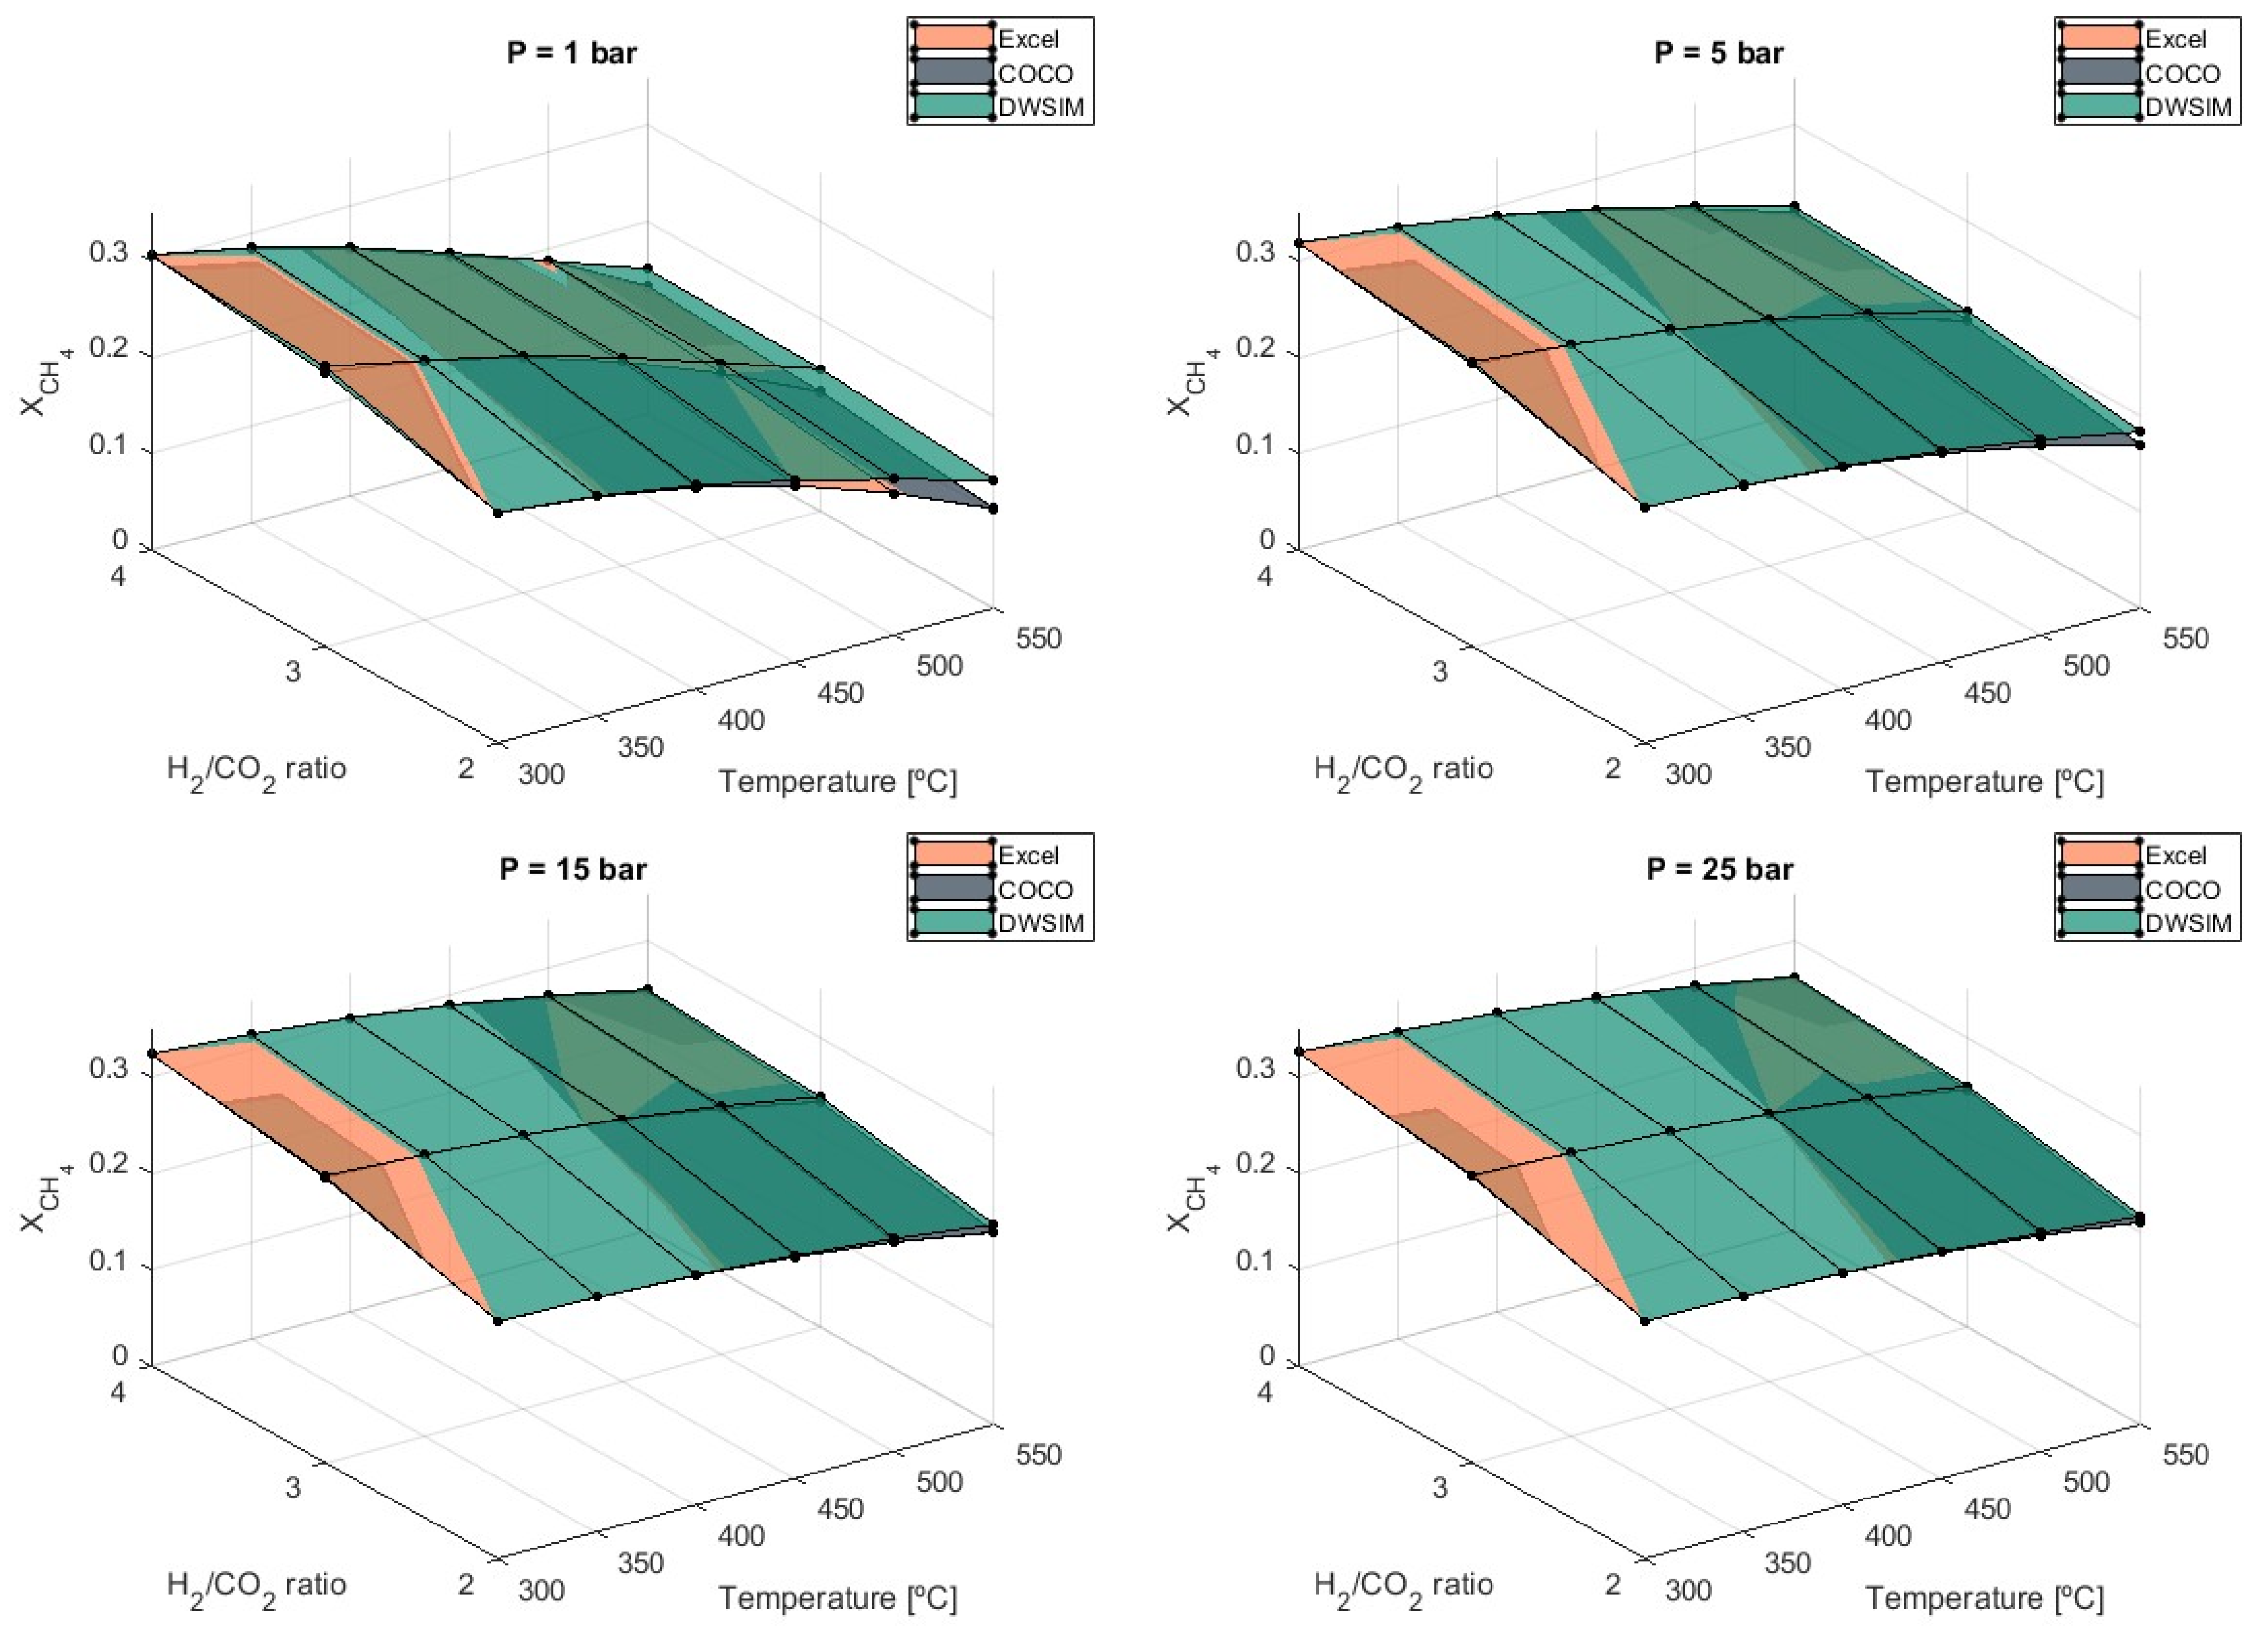
Figure 8 shows the methane production obtained for each H
2/CO
2 ratio that was used.
It is confirmed that the stoichiometric ratio of 4 can produce the highest yield of methane during the reaction. Simulation results indicate an average decrease in by 18.4% when H2/CO2 = 2 is used over H2/CO2 = 3 and 7.1% when H2/CO2 = 3 is compared to the stoichiometric ratio. For an H2/CO2 = 2, the lowest production of methane is achieved at 1 bar and T = 550 °C with .103, according to results from simulations carried out in Microsoft Excel. Differences in results between the three simulation models increase as the temperature rises and lower pressures are applied. In general, results obtained from DWSIM are higher under these conditions.
CO
2 conversion efficiency is severely affected by the H
2/CO
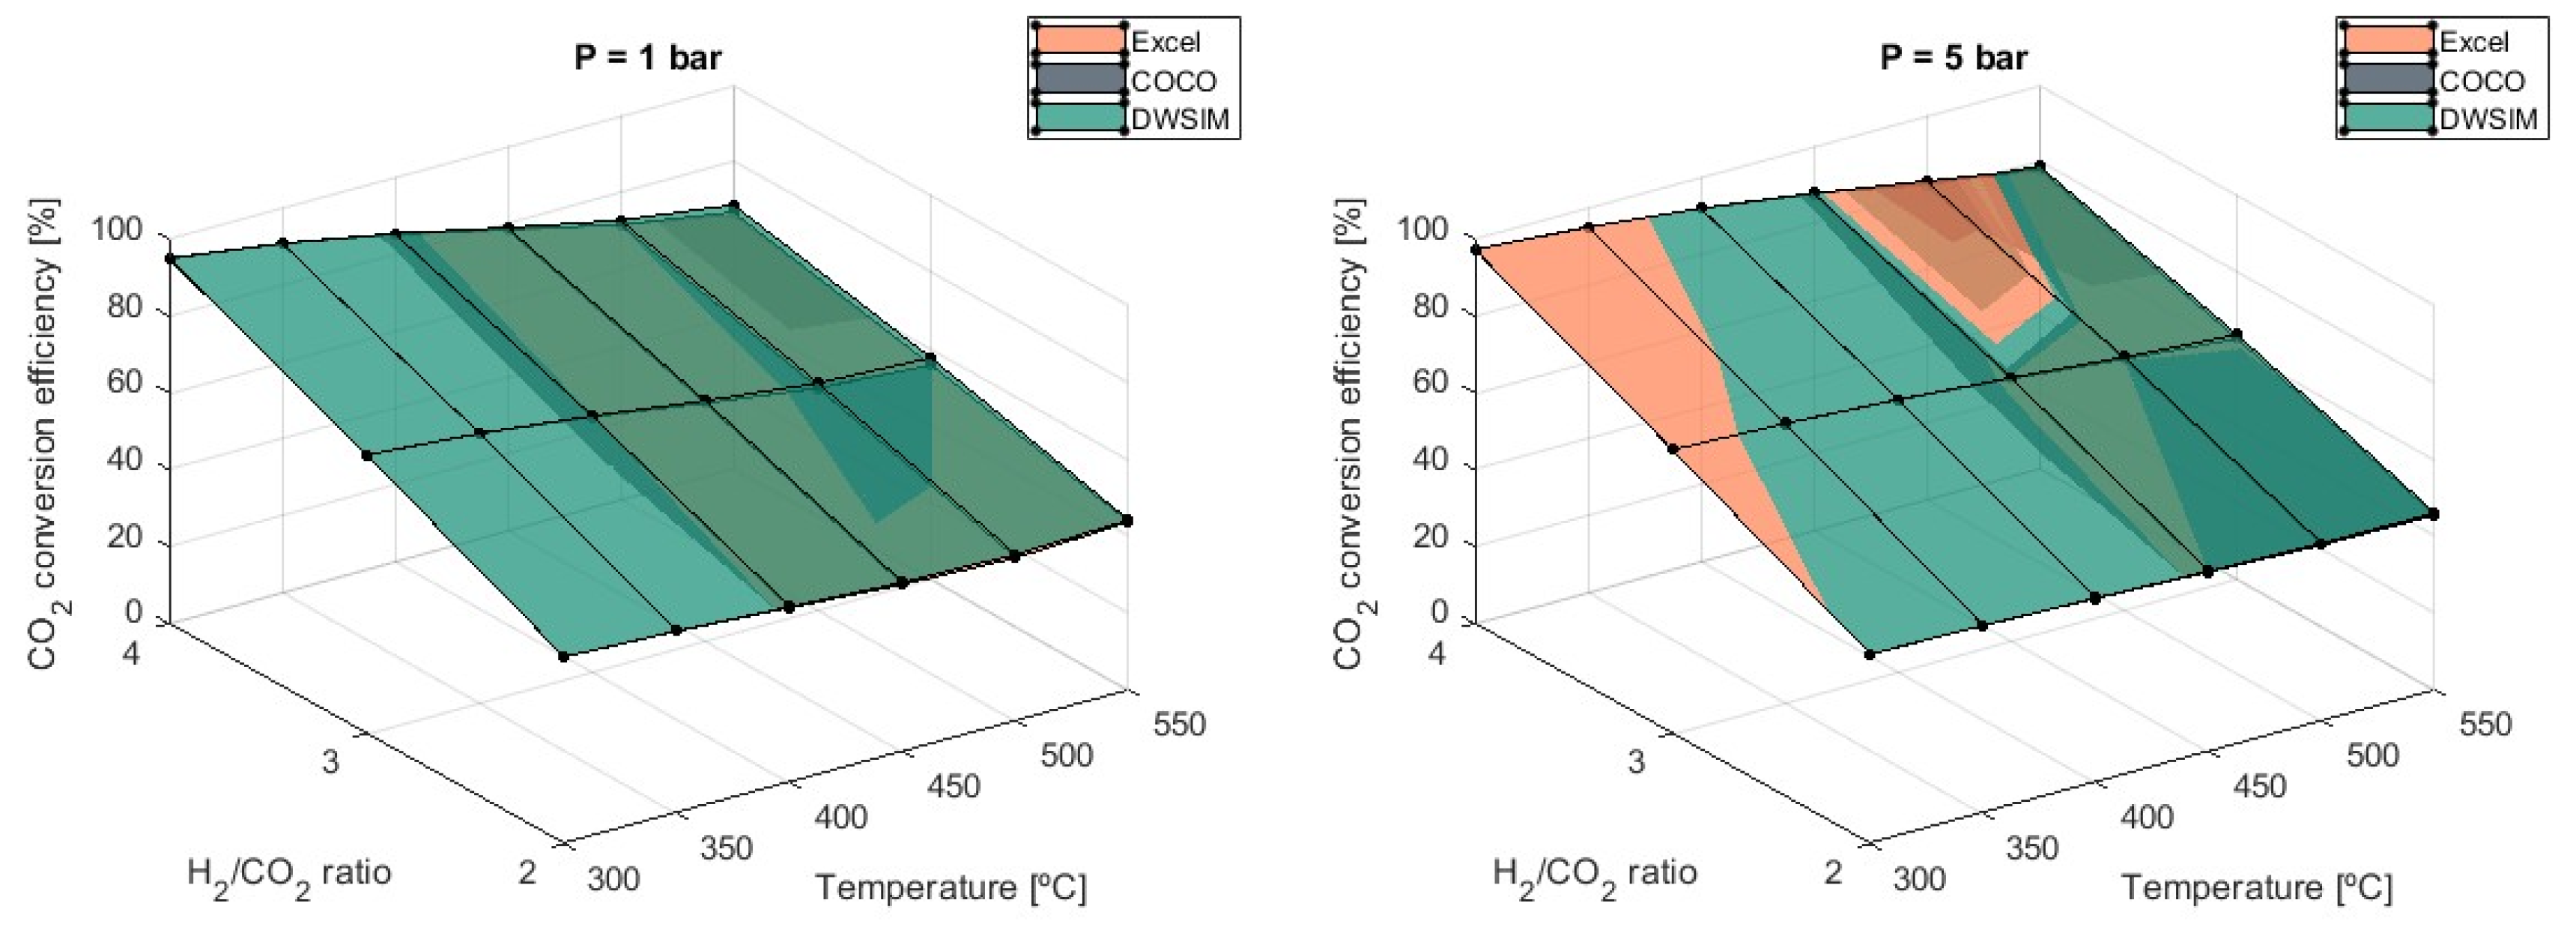
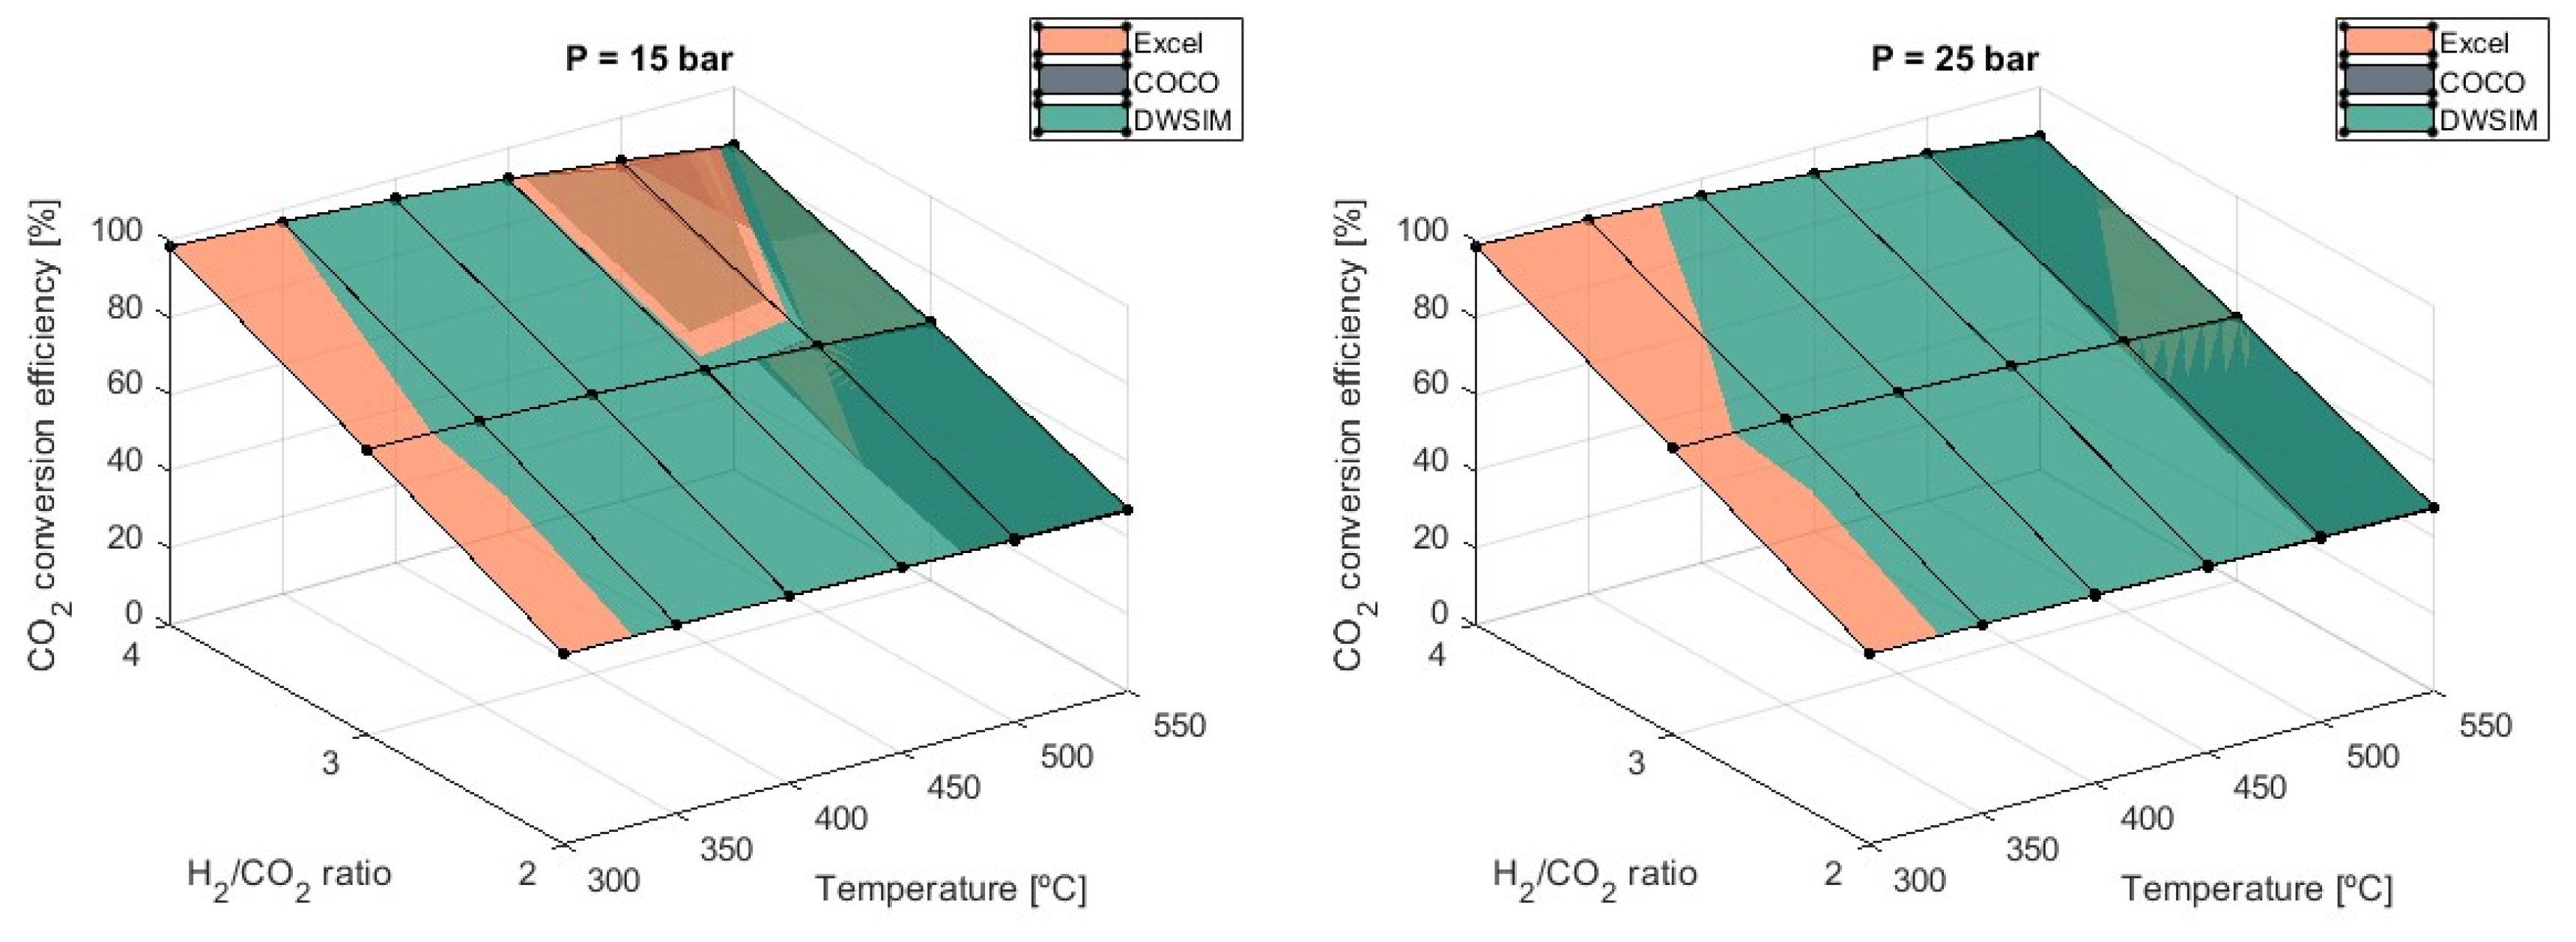
2 ratio, with subsequent lower efficiency as the ratio decreases, as shown in
Figure 9.
Using a ratio of 3 leads to a 33% lower efficiency than a ratio of 4, and this value will decrease an additional 22% if the lowest value of H2/CO2 = 2 is used. Results from the three models are in agreement, and no significant differences are reported.
The CO molar fraction also seems to be severely affected by the H
2/CO
2 ratio since lower values of this ratio tend to increase the presence of CO in the products of the reaction. Although this is true, differences are significant only when temperatures are increased, and pressures are kept low. This conclusion can be supported by the graphs presented in
Figure 10, which indicate that a reduction in the H
2/CO
2 ratio by 1 unit can increase
by 41% at T = 550 °C and P = 1 bar.
Maximum values of CO formation are achievable under these conditions with 0.072 (H2/CO2 = 2), 0.050 (H2/CO2 = 3), and 0.035 (H2/CO2 = 4), according to simulations performed in Excel and COCO. DWSIM simulation results at 1 bar and 5 bars are, on average, 5% lower than results from other models. At pressures equal to or above 15 bars, results obtained from all simulation models agree. When the optimal temperature and pressure conditions for maximum CH4 selectivity are considered, the H2/CO2 ratio does not affect . On the other hand, the stoichiometric H2/CO2 ratio should be considered as a general rule.
When the H
2/CO
2 ratio is reduced, the reaction contains more CO
2 in both the reactants and the products. Furthermore, the products of the reaction experience a greater increase in enthalpy, resulting in a higher heat balance, as shown in
Figure 11. However, the heat balance will still be more affected by the choice of temperature and pressure than the H
2/CO
2 ratio. According to the results, no significant alteration in the heat balance was verified across all temperature and pressure ranges when considering the H
2/CO
2 ratio of 2 over 3. However, a general 5% increase in the heat balance is confirmed when an H
2/CO
2 ratio of 3 is used instead of the stoichiometric ratio.
5. Conclusions
This study conducted a comprehensive thermodynamic equilibrium evaluation of the steady-state methanation process, comparing an analytical method to free and open-source simulation programs such as COCO and DWSIM. The analytical method, developed using Microsoft Excel and based on solving material balance equations from equilibrium constants, provided a reliable benchmark for validating simulation results.
Optimal operating conditions were determined and validated by all simulation models, with results indicating that lower temperatures and higher pressures (such as 300 °C and 25 bars) significantly enhance methanation efficiency. These conditions promote methane production while limiting carbon oxide formation, aligning with theoretical expectations. Notably, the evaluation of the hydrogen-to-carbon ratio revealed that the stoichiometric ratio yields the highest conversion efficiency, a finding that emphasizes the importance of precise reactant control in optimizing the process.
Despite the overall agreement among the simulation models, minor differences, particularly in heat balance predictions from DWSIM at higher temperatures, suggest that the choice of simulation tool can influence the thermodynamic predictions. These findings underscore the need for careful selection and validation of simulation models in process design.
Additionally, this study highlights the practical implications of using free and open-source software for industrial applications. The accessibility and cost-effectiveness of these tools make them particularly advantageous for engineers and researchers operating within budget constraints. The ability of COCO and DWSIM to produce results consistent with the rigorous analytical method reinforces their potential as reliable alternatives to proprietary software.
Furthermore, this study emphasizes the importance of integrating both analytical and simulation approaches to achieve a comprehensive understanding of the methanation process. The validated optimal conditions serve as a valuable reference for future research and industrial applications, ensuring that process designs are both efficient and effective.
This evaluation not only validates the use of COCO and DWSIM for methanation process simulations but also provides a robust framework for future studies. The successful demonstration of the analytical method in Excel as a benchmark tool encourages its adoption for other chemical processes, paving the way for more accessible and cost-effective process optimization solutions.


