Article

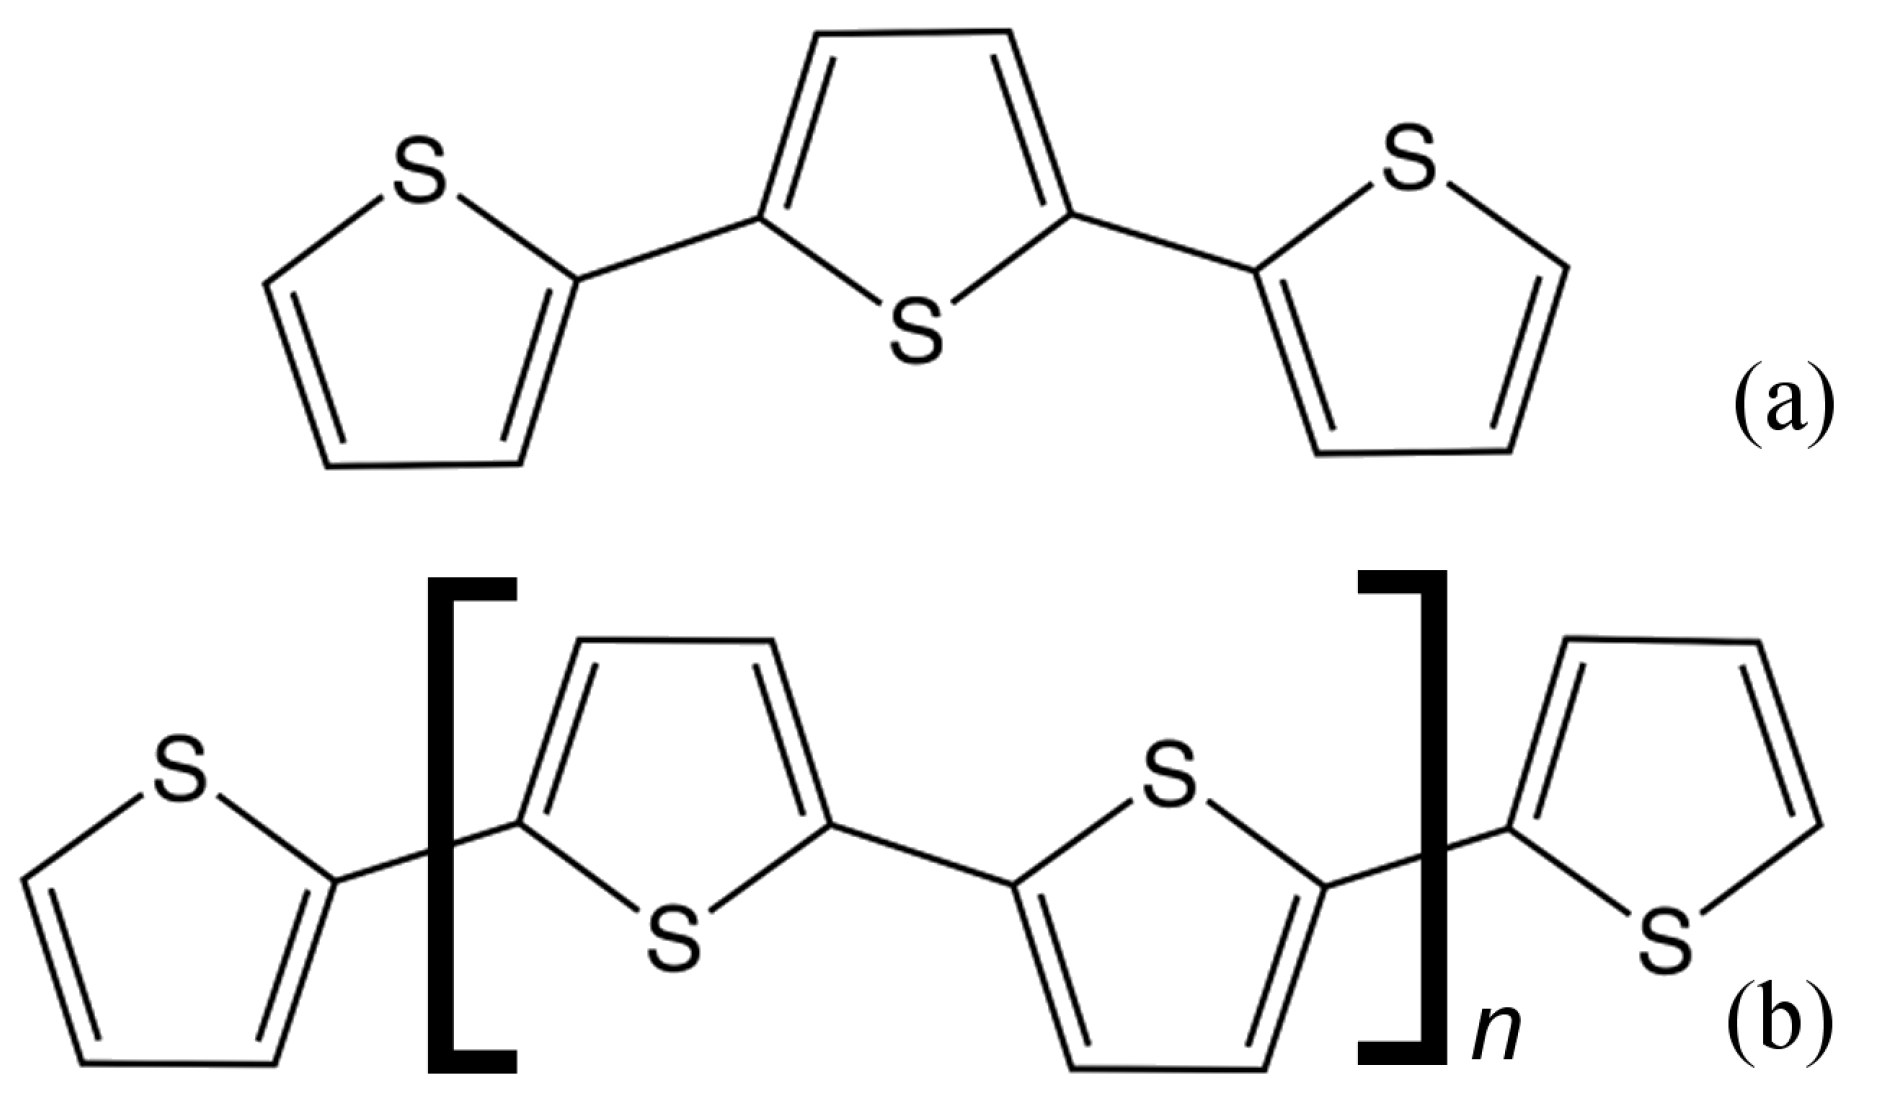
A Multi-Wavelength Raman Study of Some Oligothiophenes and Polythiophene

by
Stewart F. Parker
1,*,
Jessica E. Trevelyan
1,
Timothy Smith
2 and
Kenneth P. J. Williams
2
1
ISIS Neutron and Muon Facility, STFC Rutherford Appleton Laboratory, Chilton, Oxfordshire OX11 0QX, UK
2
Renishaw PLC, New Mills, Wotton-under-Edge, Gloucestershire GL12 8JR, UK
*
Author to whom correspondence should be addressed.
Physchem 2023, 3(2), 210-219; https://doi.org/10.3390/physchem3020014
Submission received: 14 December 2022 / Revised: 2 March 2023 / Accepted: 18 April 2023 / Published: 20 April 2023

Abstract

:
We have measured the Raman spectra of some oligothiophenes (bithiophene, terthiophene, quarterthiophene, sexithiophene and octithiophene) and polythiophene with wavelengths from 325–1064 nm (3.815–1.165 eV). All of the materials give good quality spectra with 1064 nm excitation, although there is weak background fluorescence for some of them. The UV lines of 405 and 324 nm generally provide good-quality spectra, albeit with significant fluorescence for bithiophene and quarterthiophene. Surprisingly, there is little difference between the relative intensities (i.e., the ratio of a band’s intensity as compared to the strongest band) of the spectra with the different excitation wavelengths. However, close inspection of the 2000–3200 cm−1 region of octithiophene and polythiophene with 325 and 405 nm excitation shows several modes in this region that can be assigned to combinations and overtones involving the ~1440 cm−1 C–C ring stretch that do not appear with 1064 nm excitation. The presence of overtones and combinations with anomalously large intensities is a hallmark of resonance Raman spectroscopy.

1. Introduction

The award [1] of the Nobel Prize for Chemistry in 2000 for the discovery of conducting polymers confirmed their importance as materials. Their usefulnessarises from their electronic properties and, potentially, low production and installation costs because they are lightweight and solution-processable [2,3,4]. Organic light-emitting diodes (OLEDs) [5] are a particularly important application of conducting polymers; others include their use as solar cells [6,7]. There are many materials available; however, oligothiophenes [8] and polythiophene [9] have attracted particular interest due to their chemical stability and electrical conductivity when doped.
The structures of the materials studied in this work are shown in Figure 1. Single crystal X-ray diffraction (XRD) studies of bithiophene [10,11] (Figure 1b, n = 0), terthiophene [12,13] (Figure 1a), quarterthiophene [14] (Figure 1b, n = 1), sexithiophene [15] (Figure 1b, n = 2), octithiophene [16] (Figure 1b, n = 3) and powder XRD of polythiophene [17,18] (Figure 1b, n = ∞) have established that all of them are essentially planar in the solid state, especially the longer examples. The ideal conformation is shown in Figure 1b, which results from polymerisation at the 2- and 5-positions of thiophene. This gives the characteristic S-up, S-down, S-up conformation that is favourable for conduction.
In addition to their intrinsic interest as materials [19], the oligothiophenes are used as model compounds to understand the spectroscopy of polythiophene [20]. For both of these reasons, the vibrational spectra of the oligothiophenes have been extensively investigated by infrared, Raman and inelastic neutron scattering spectroscopies: bithiophene [21,22,23,24], terthiophene [25], quarterthiophene [21,24,25,26,27,28], sexithiophene [15,21,25,26,27,29] and octithiophene [26]. The spectroscopy of polythiophene has been comprehensively studied [30,31,32,33,34,35,36]. As we have shown elsewhere [36], the spectra of the oligothiophenes rapidly converge with increasing size to that of polythiophene.
Raman spectroscopy is especially useful for studies involving the oligothiophenes and polythiophene. This arises because it is sensitive to the chain length and the conformation: whether the thiophene units are linked at the α position (as shown in Figure 1) or at the β position (the 3 and 4 positions of thiophene) [37]. This has been used in several recent studies to investigate how the thiophenes are bonded to graphite [37] or carbon nanotubes [38] for applications as sensors, to a polymer in molecular wires [39] and on an aluminium substrate [40] for use as electrodes. However, it is not clear what is the optimum excitation wavelength for such studies. While there have been a number of studies [20,32,33] that used more than one Raman excitation wavelength, there has not been a systematic study that looked at a range of wavelengths for a range of oligothiophenes and polythiophene itself. Here, we use excitation wavelengths from 1064 to 325 nm to investigate the Raman spectra of bithiophene, terthiophene, quarterthiophene, sexithiophene, octithiophene and polythiophene. We consider the signal-to-noise and signal-to-background for each spectrum and make recommendations on which wavelengths to use for future studies.

2. Materials and Methods
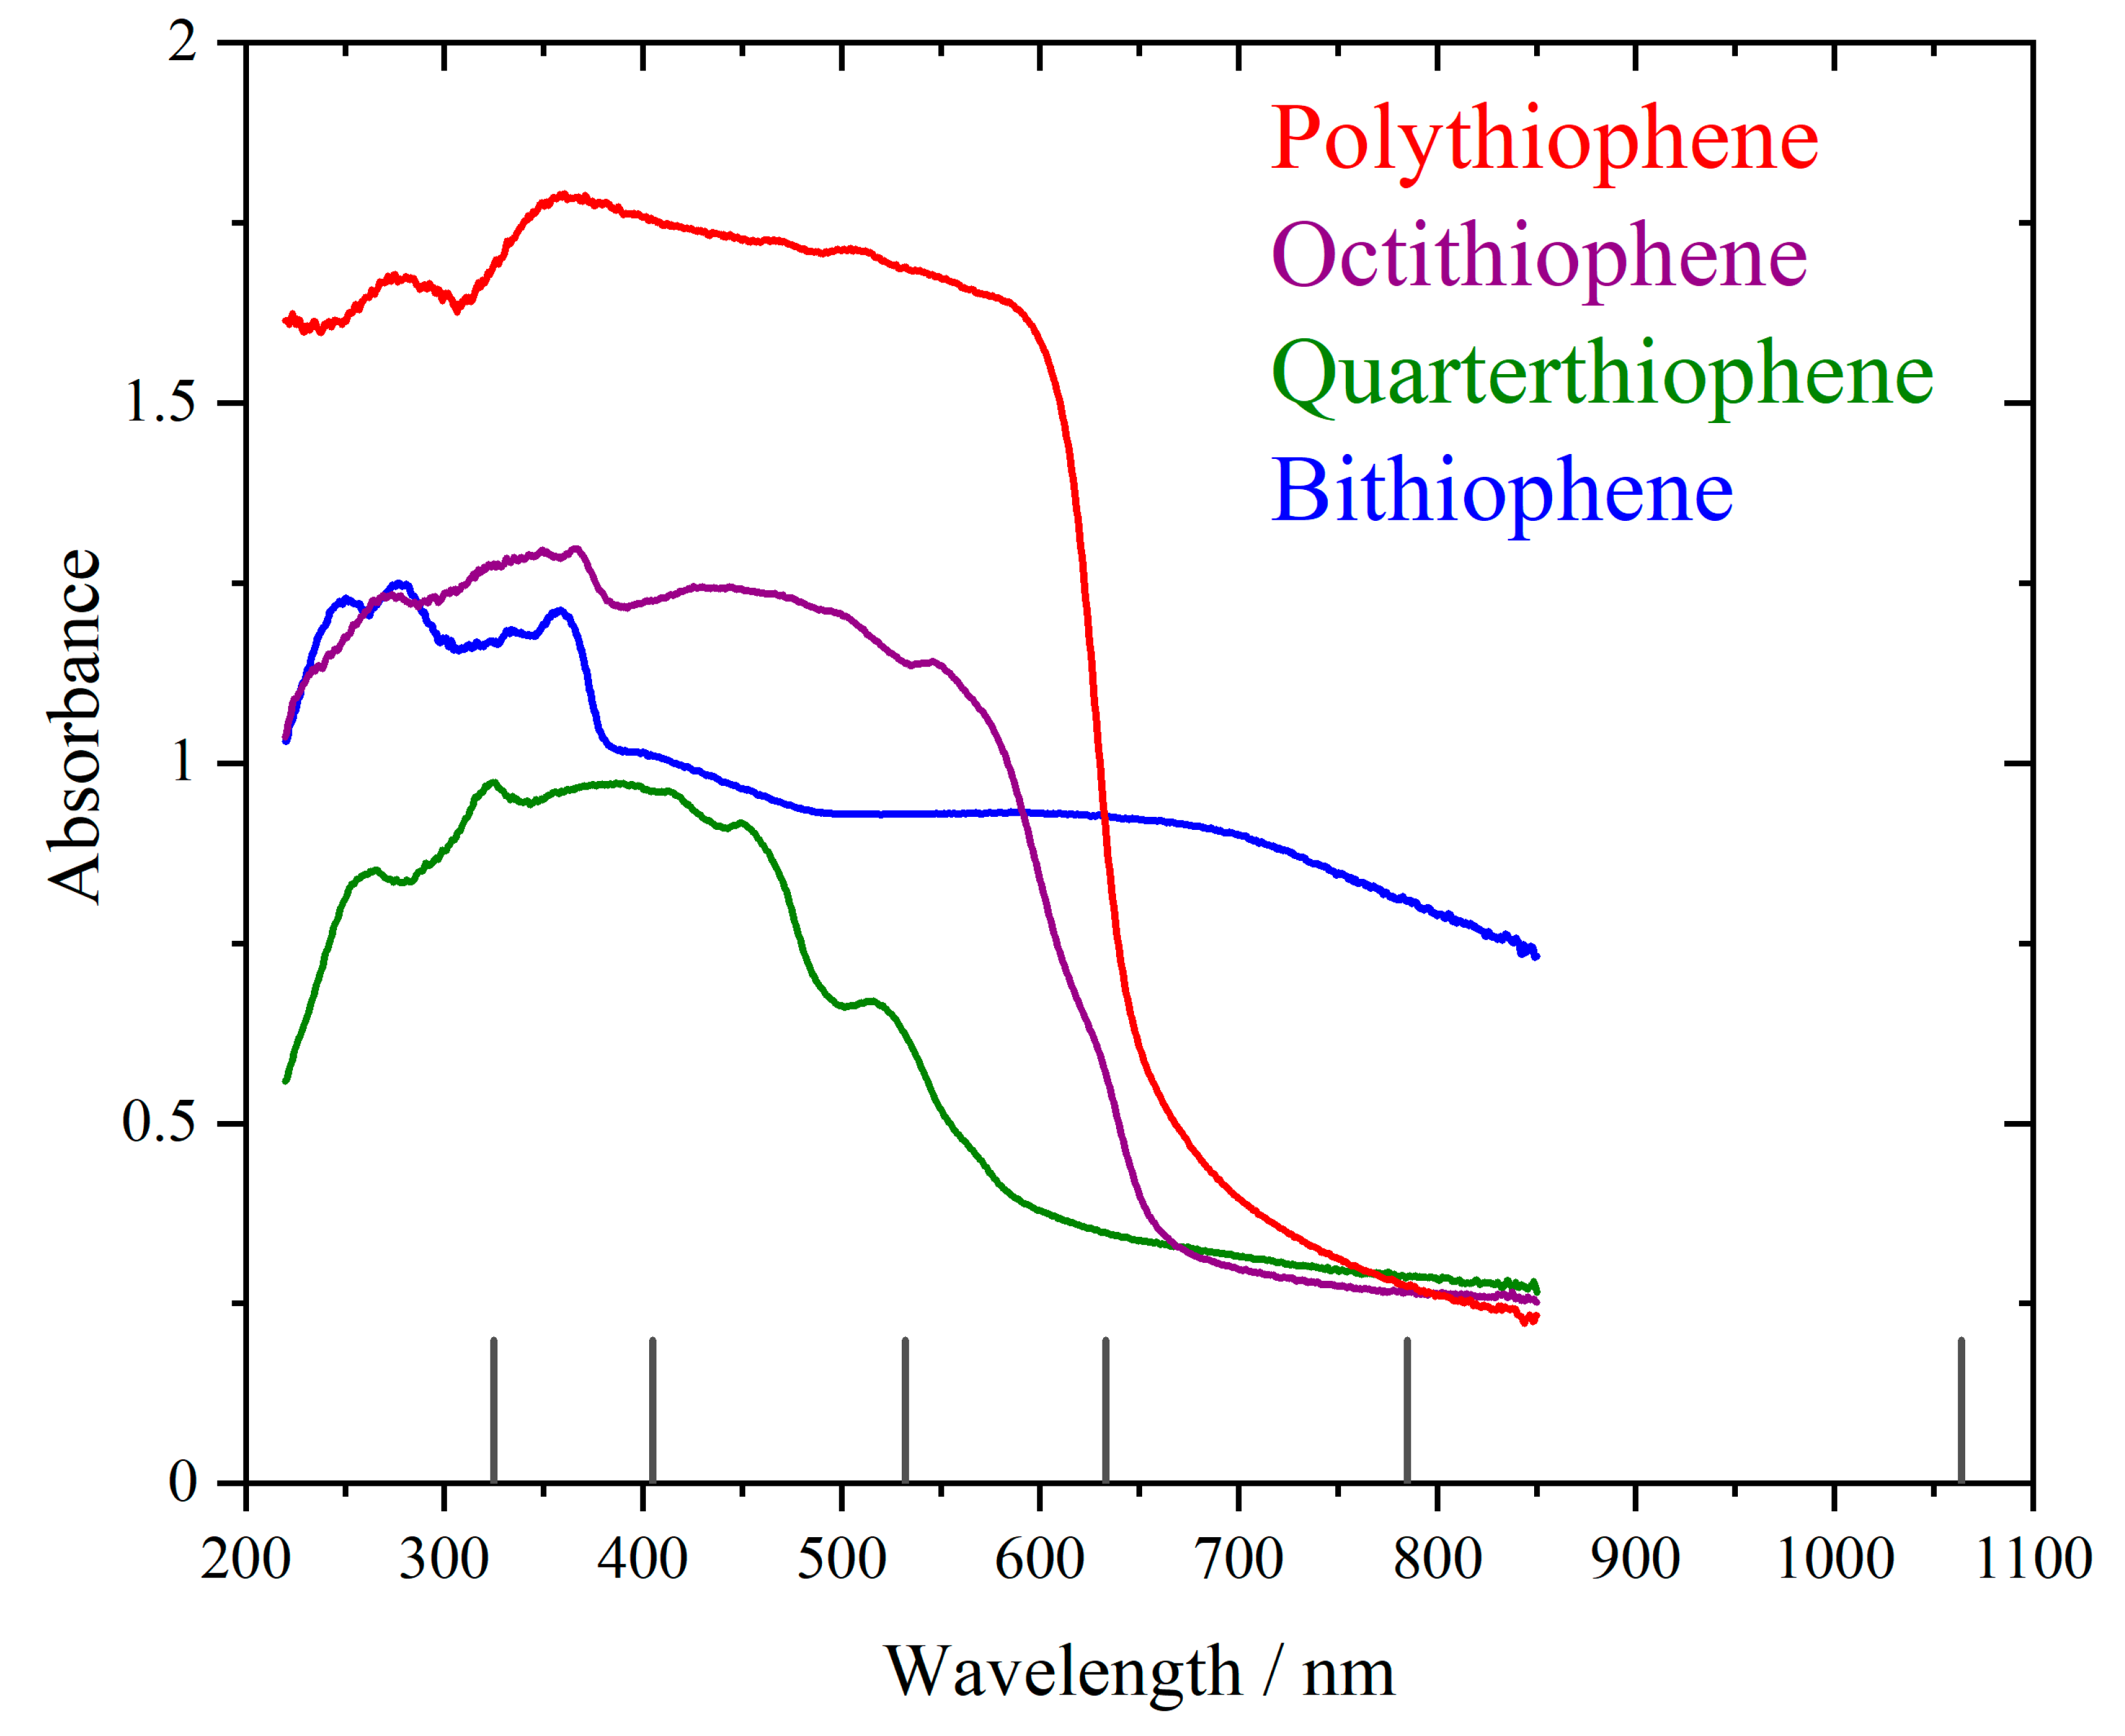
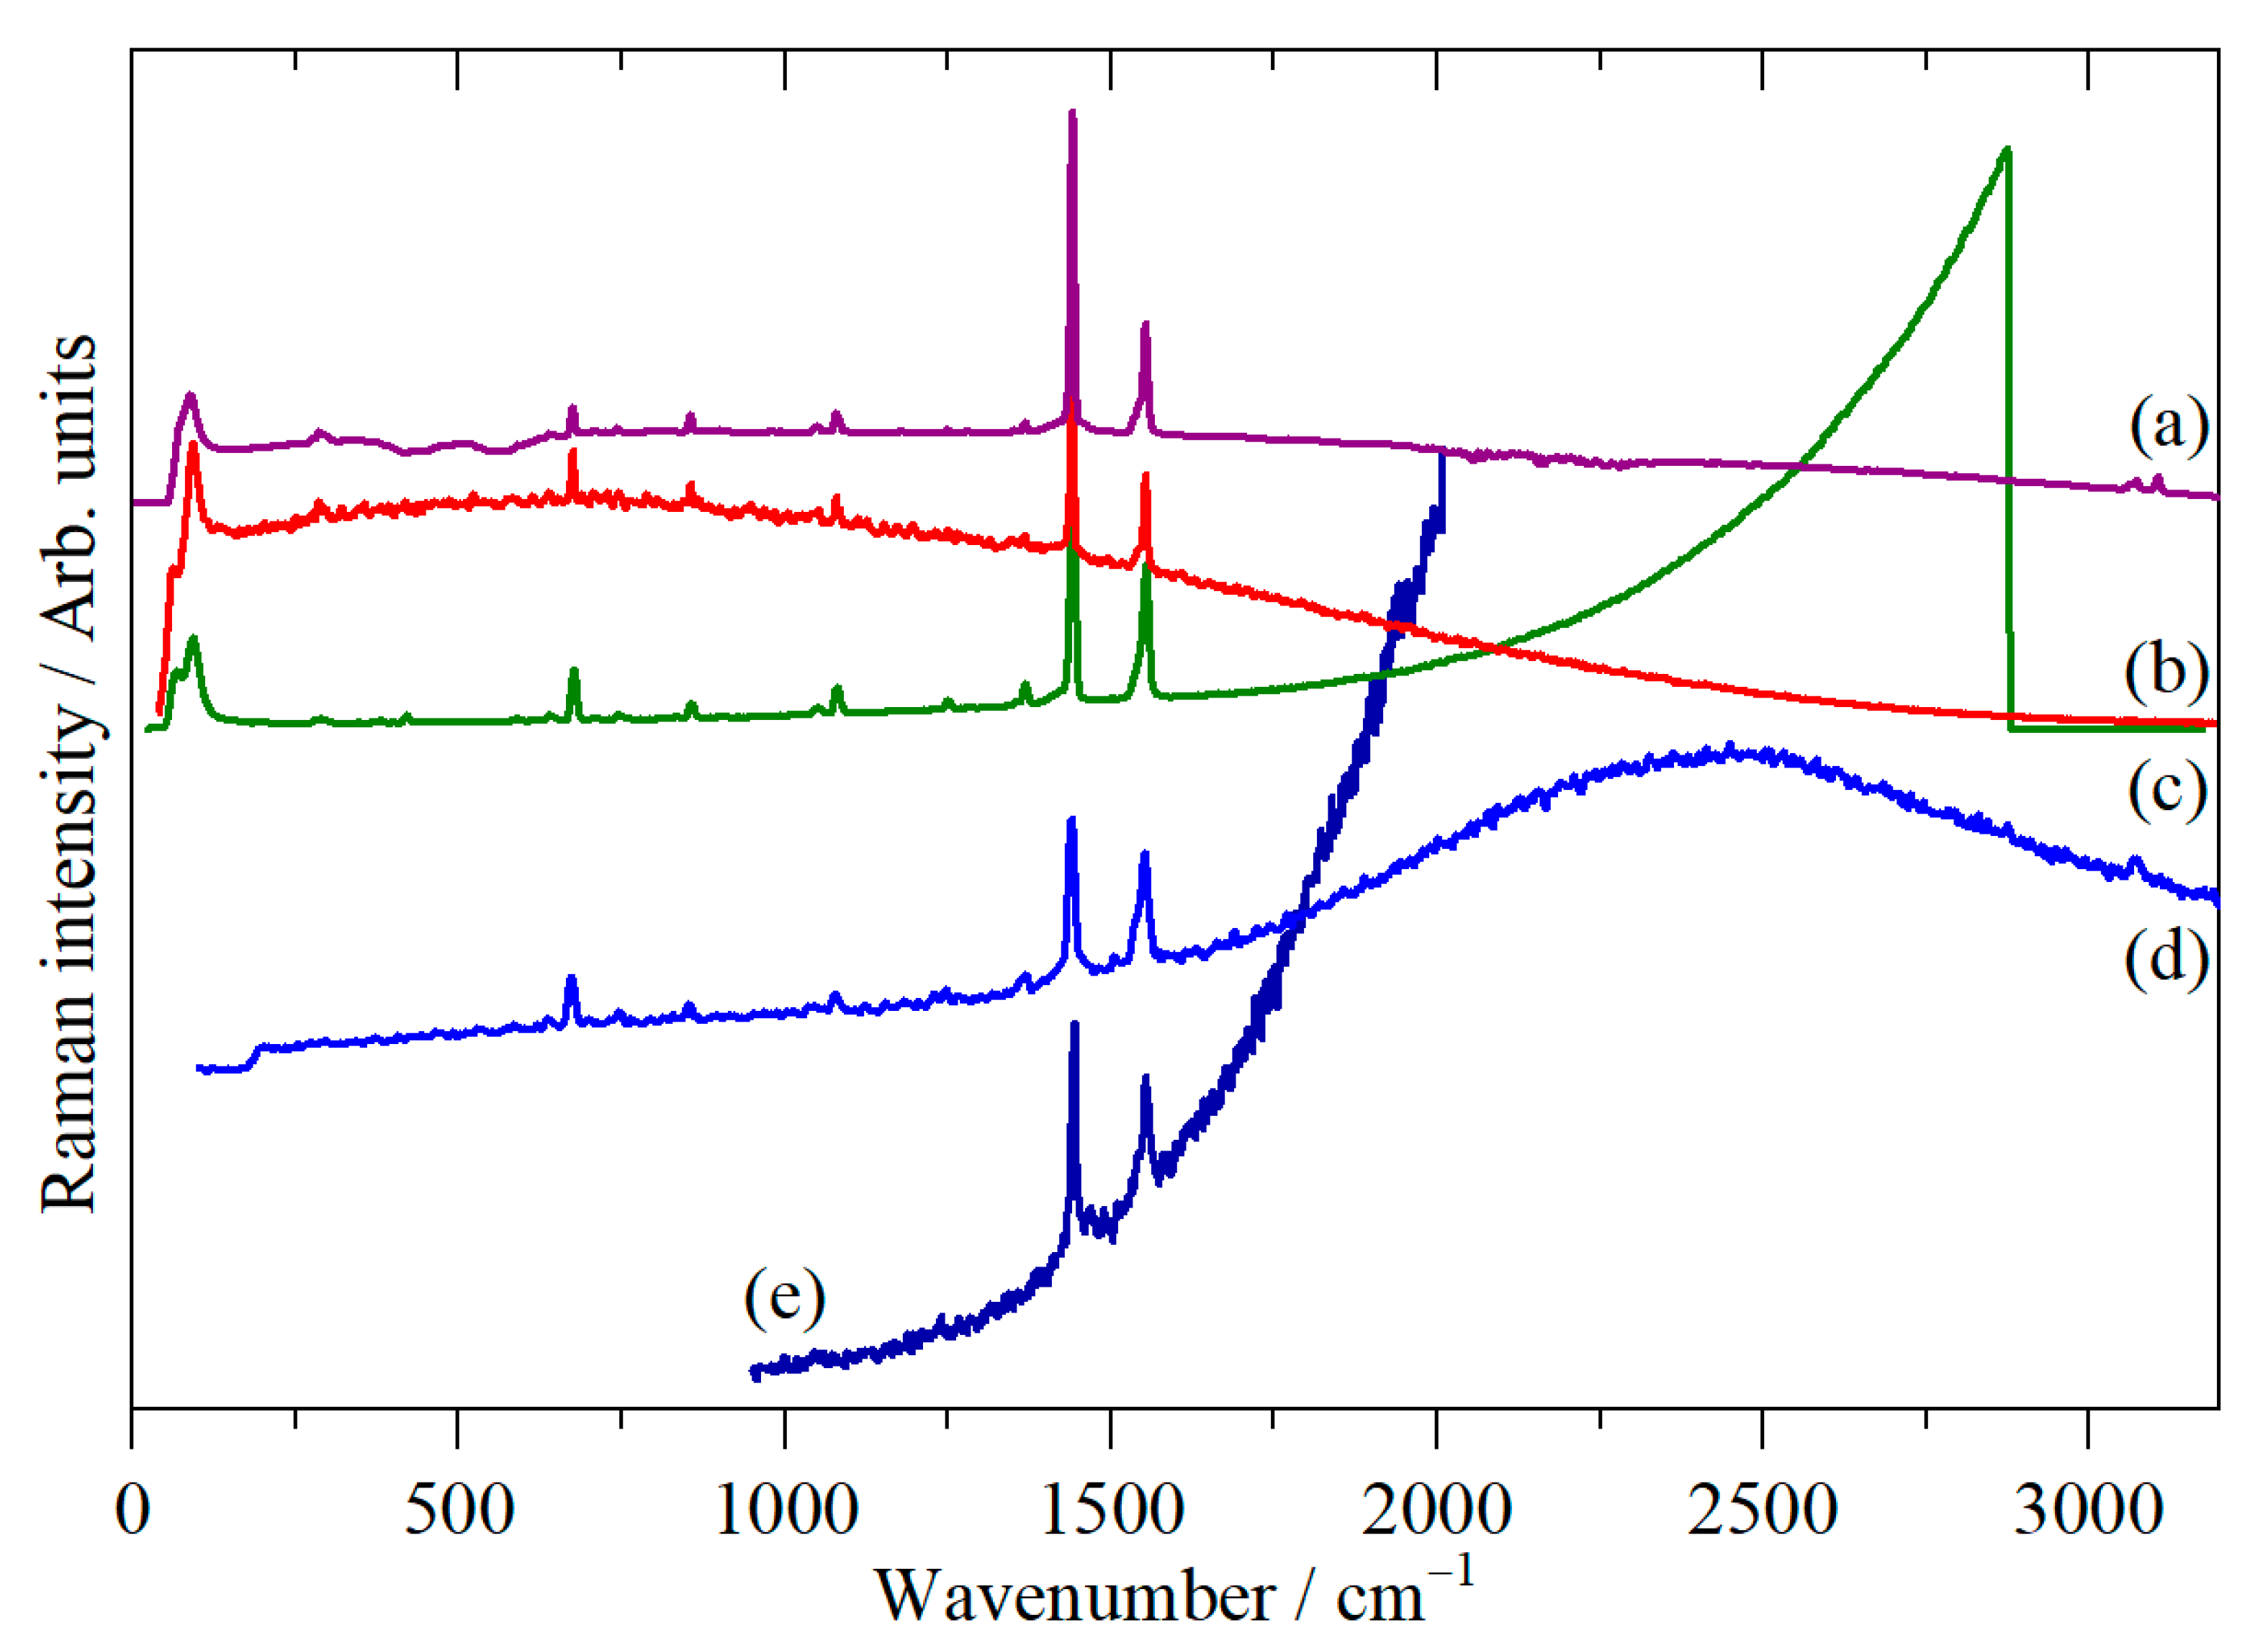
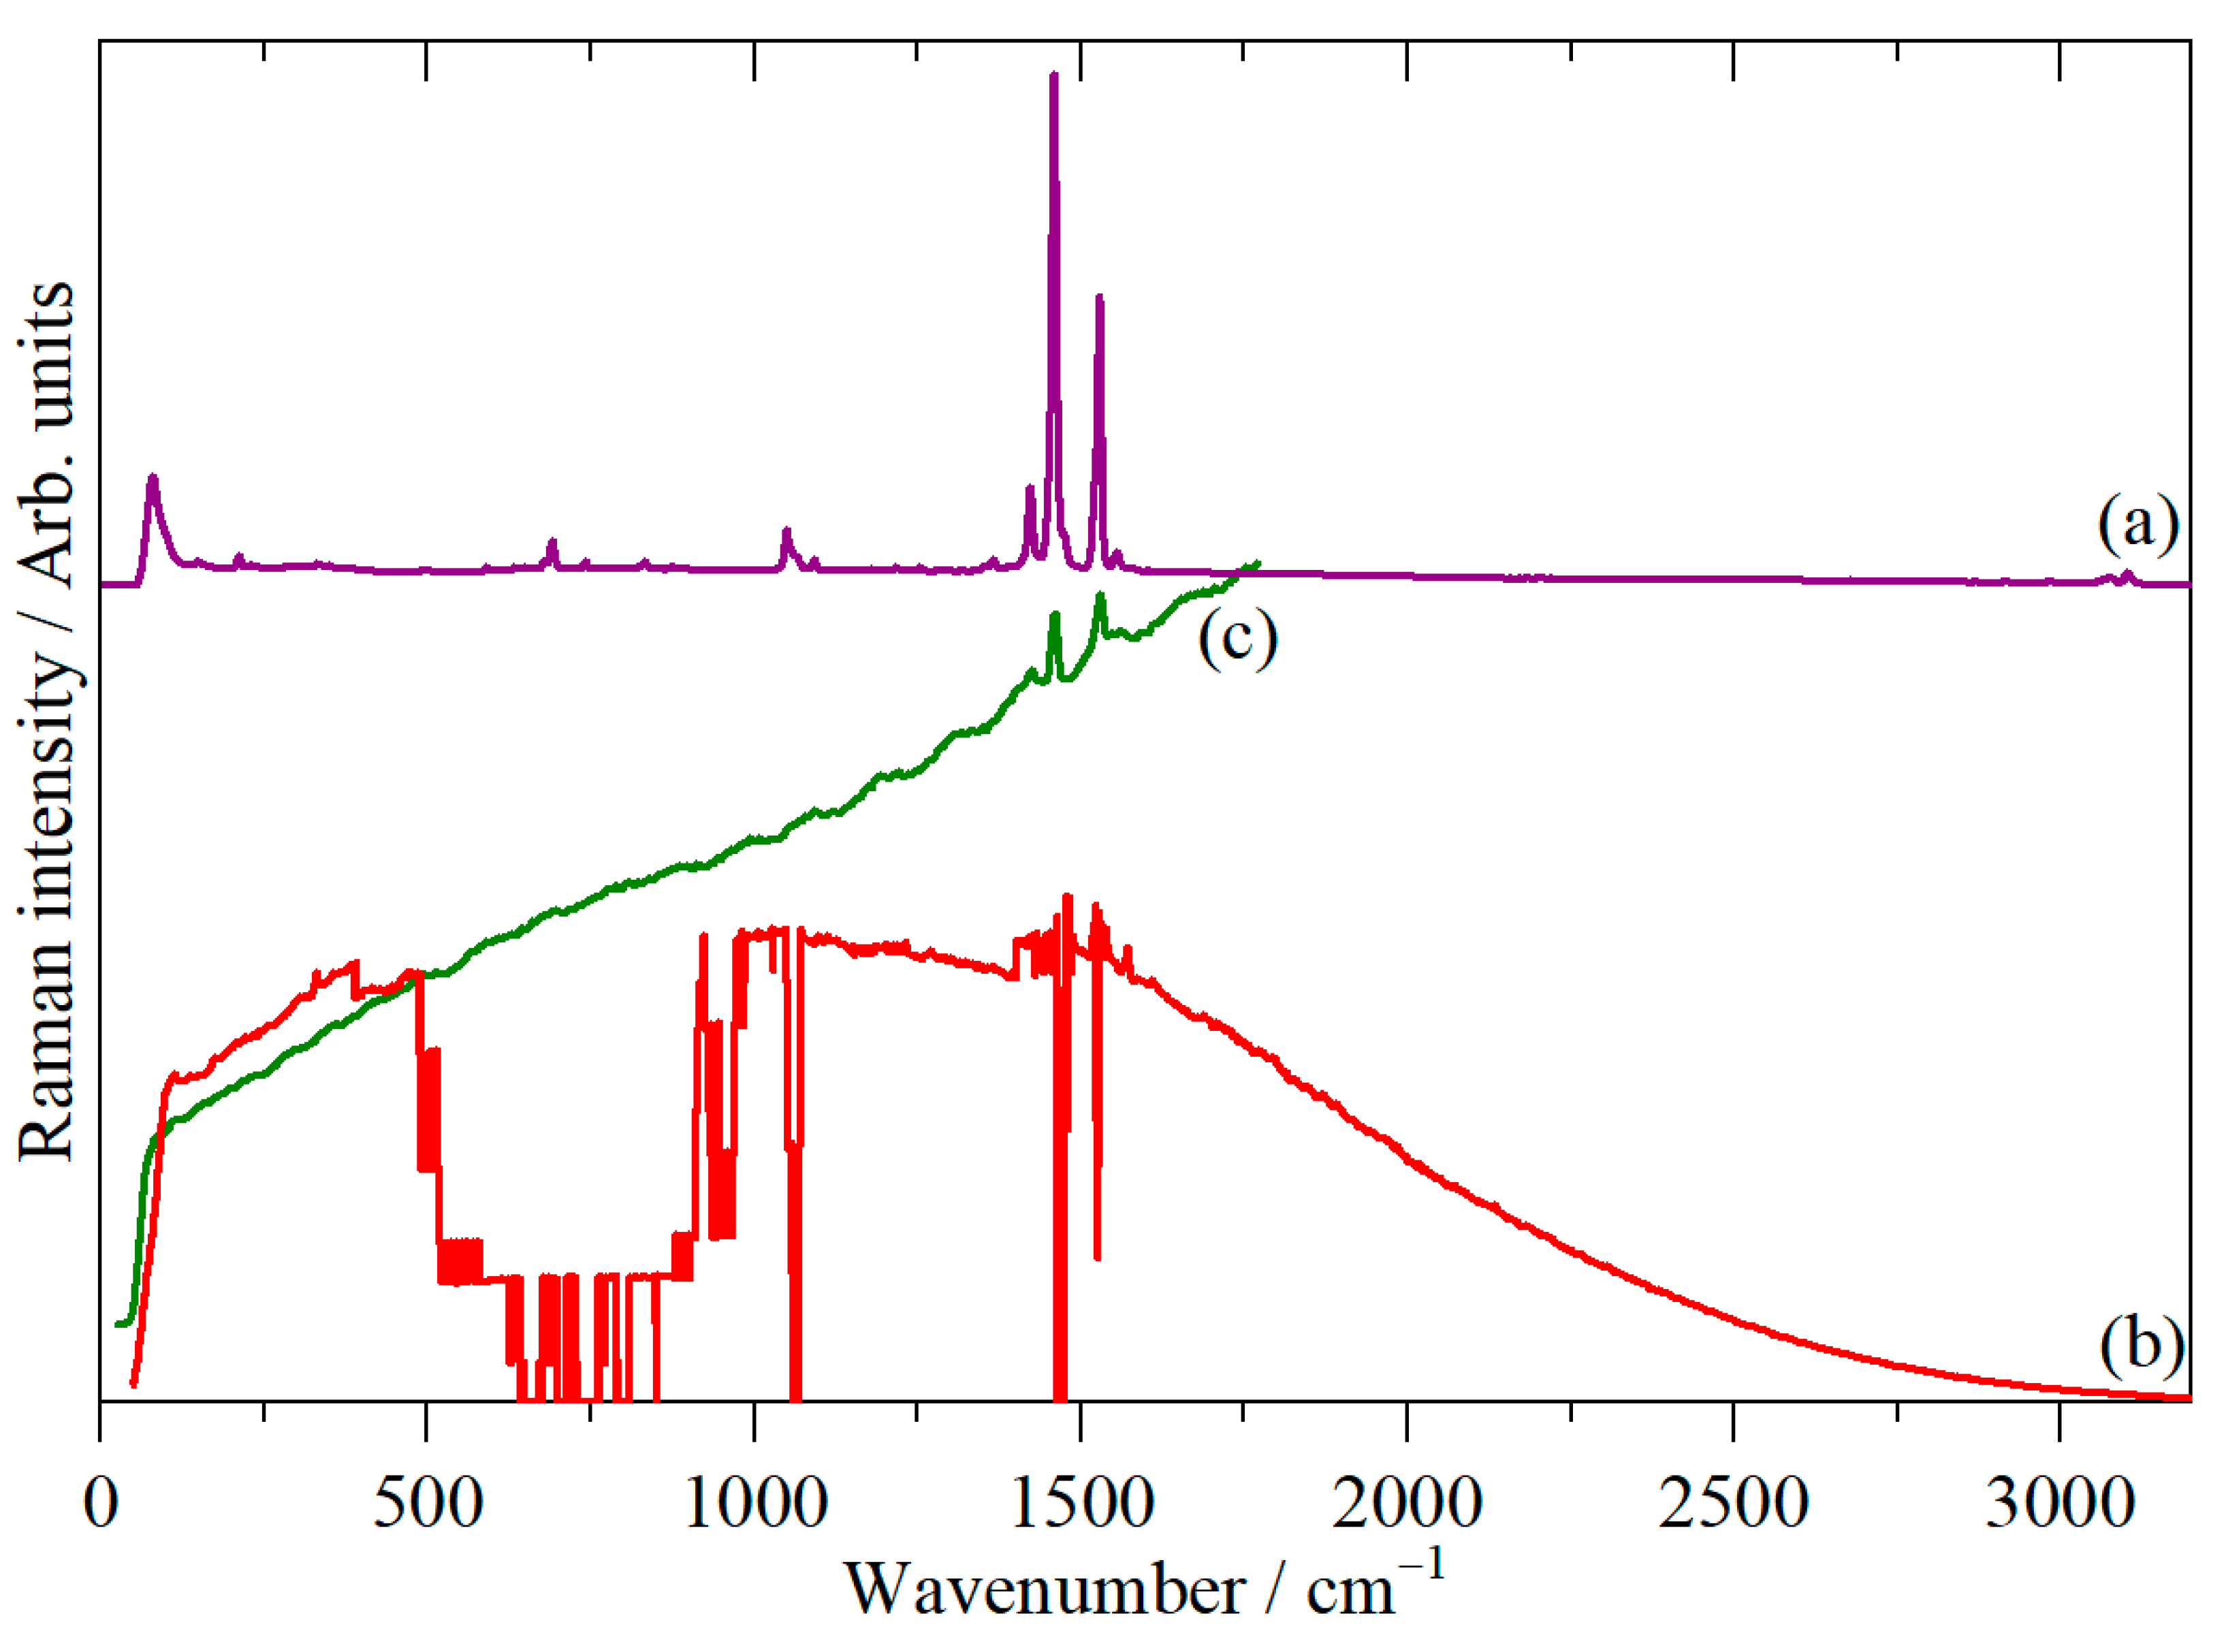
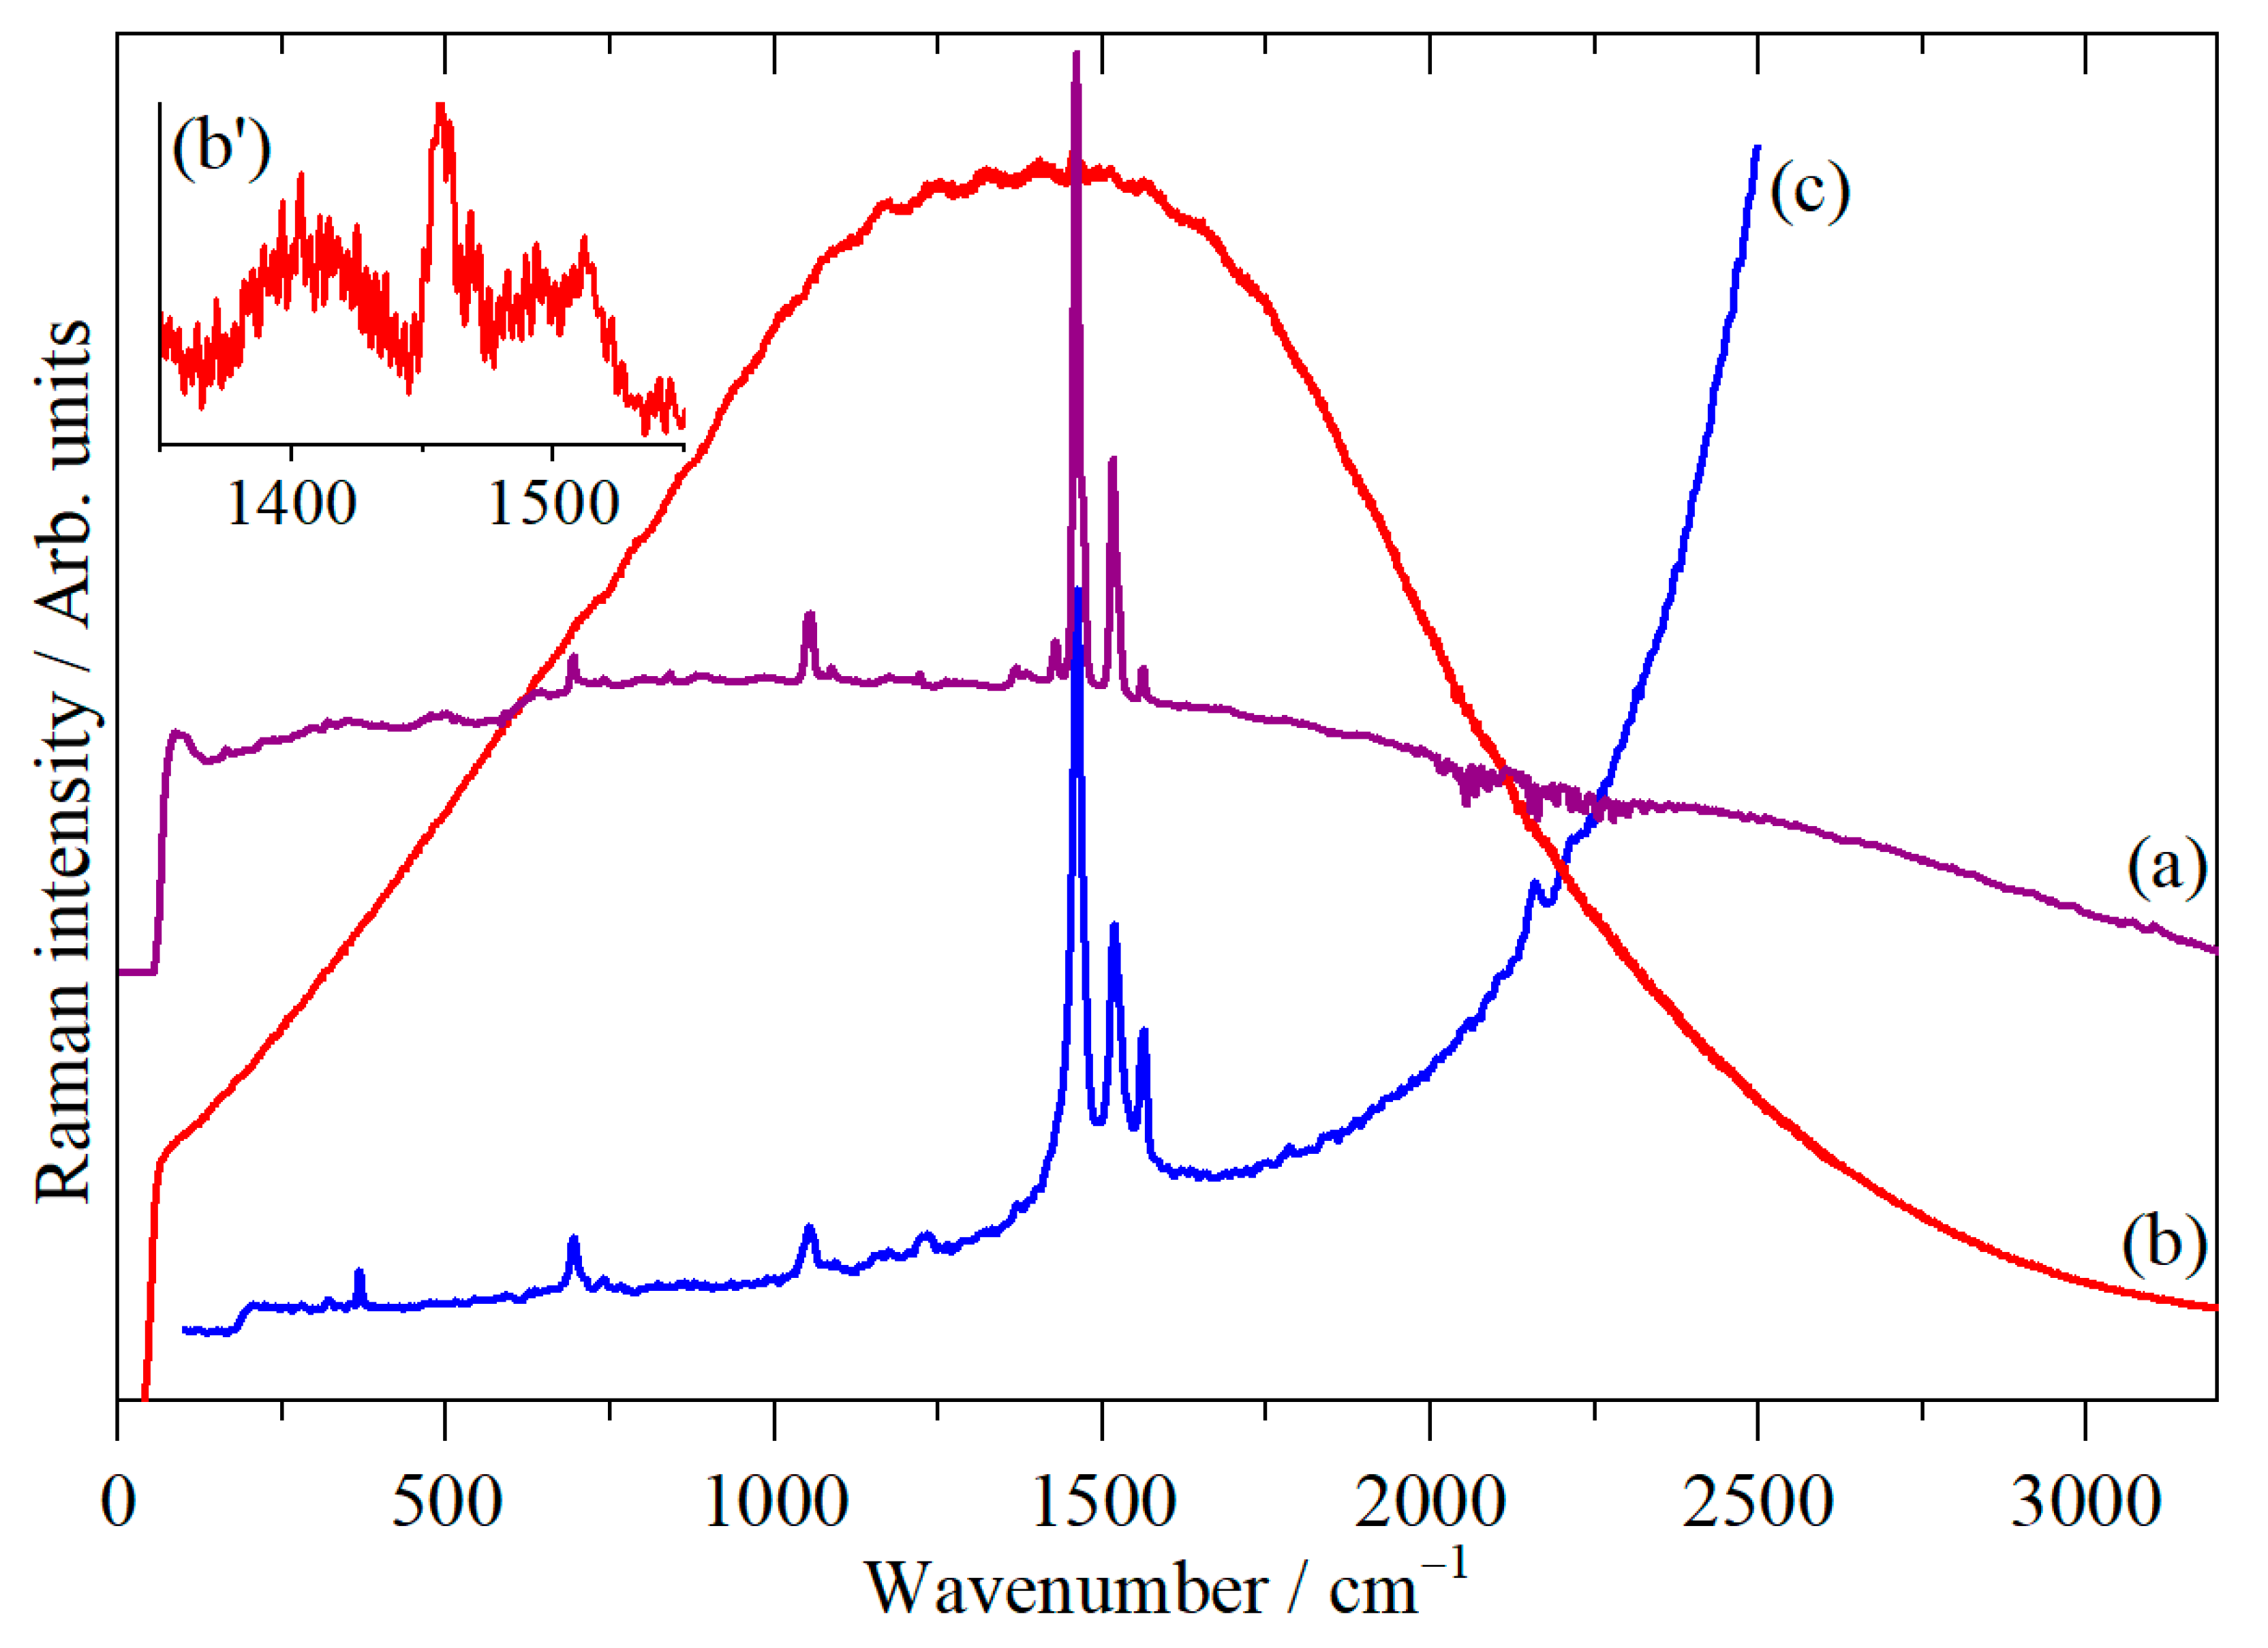
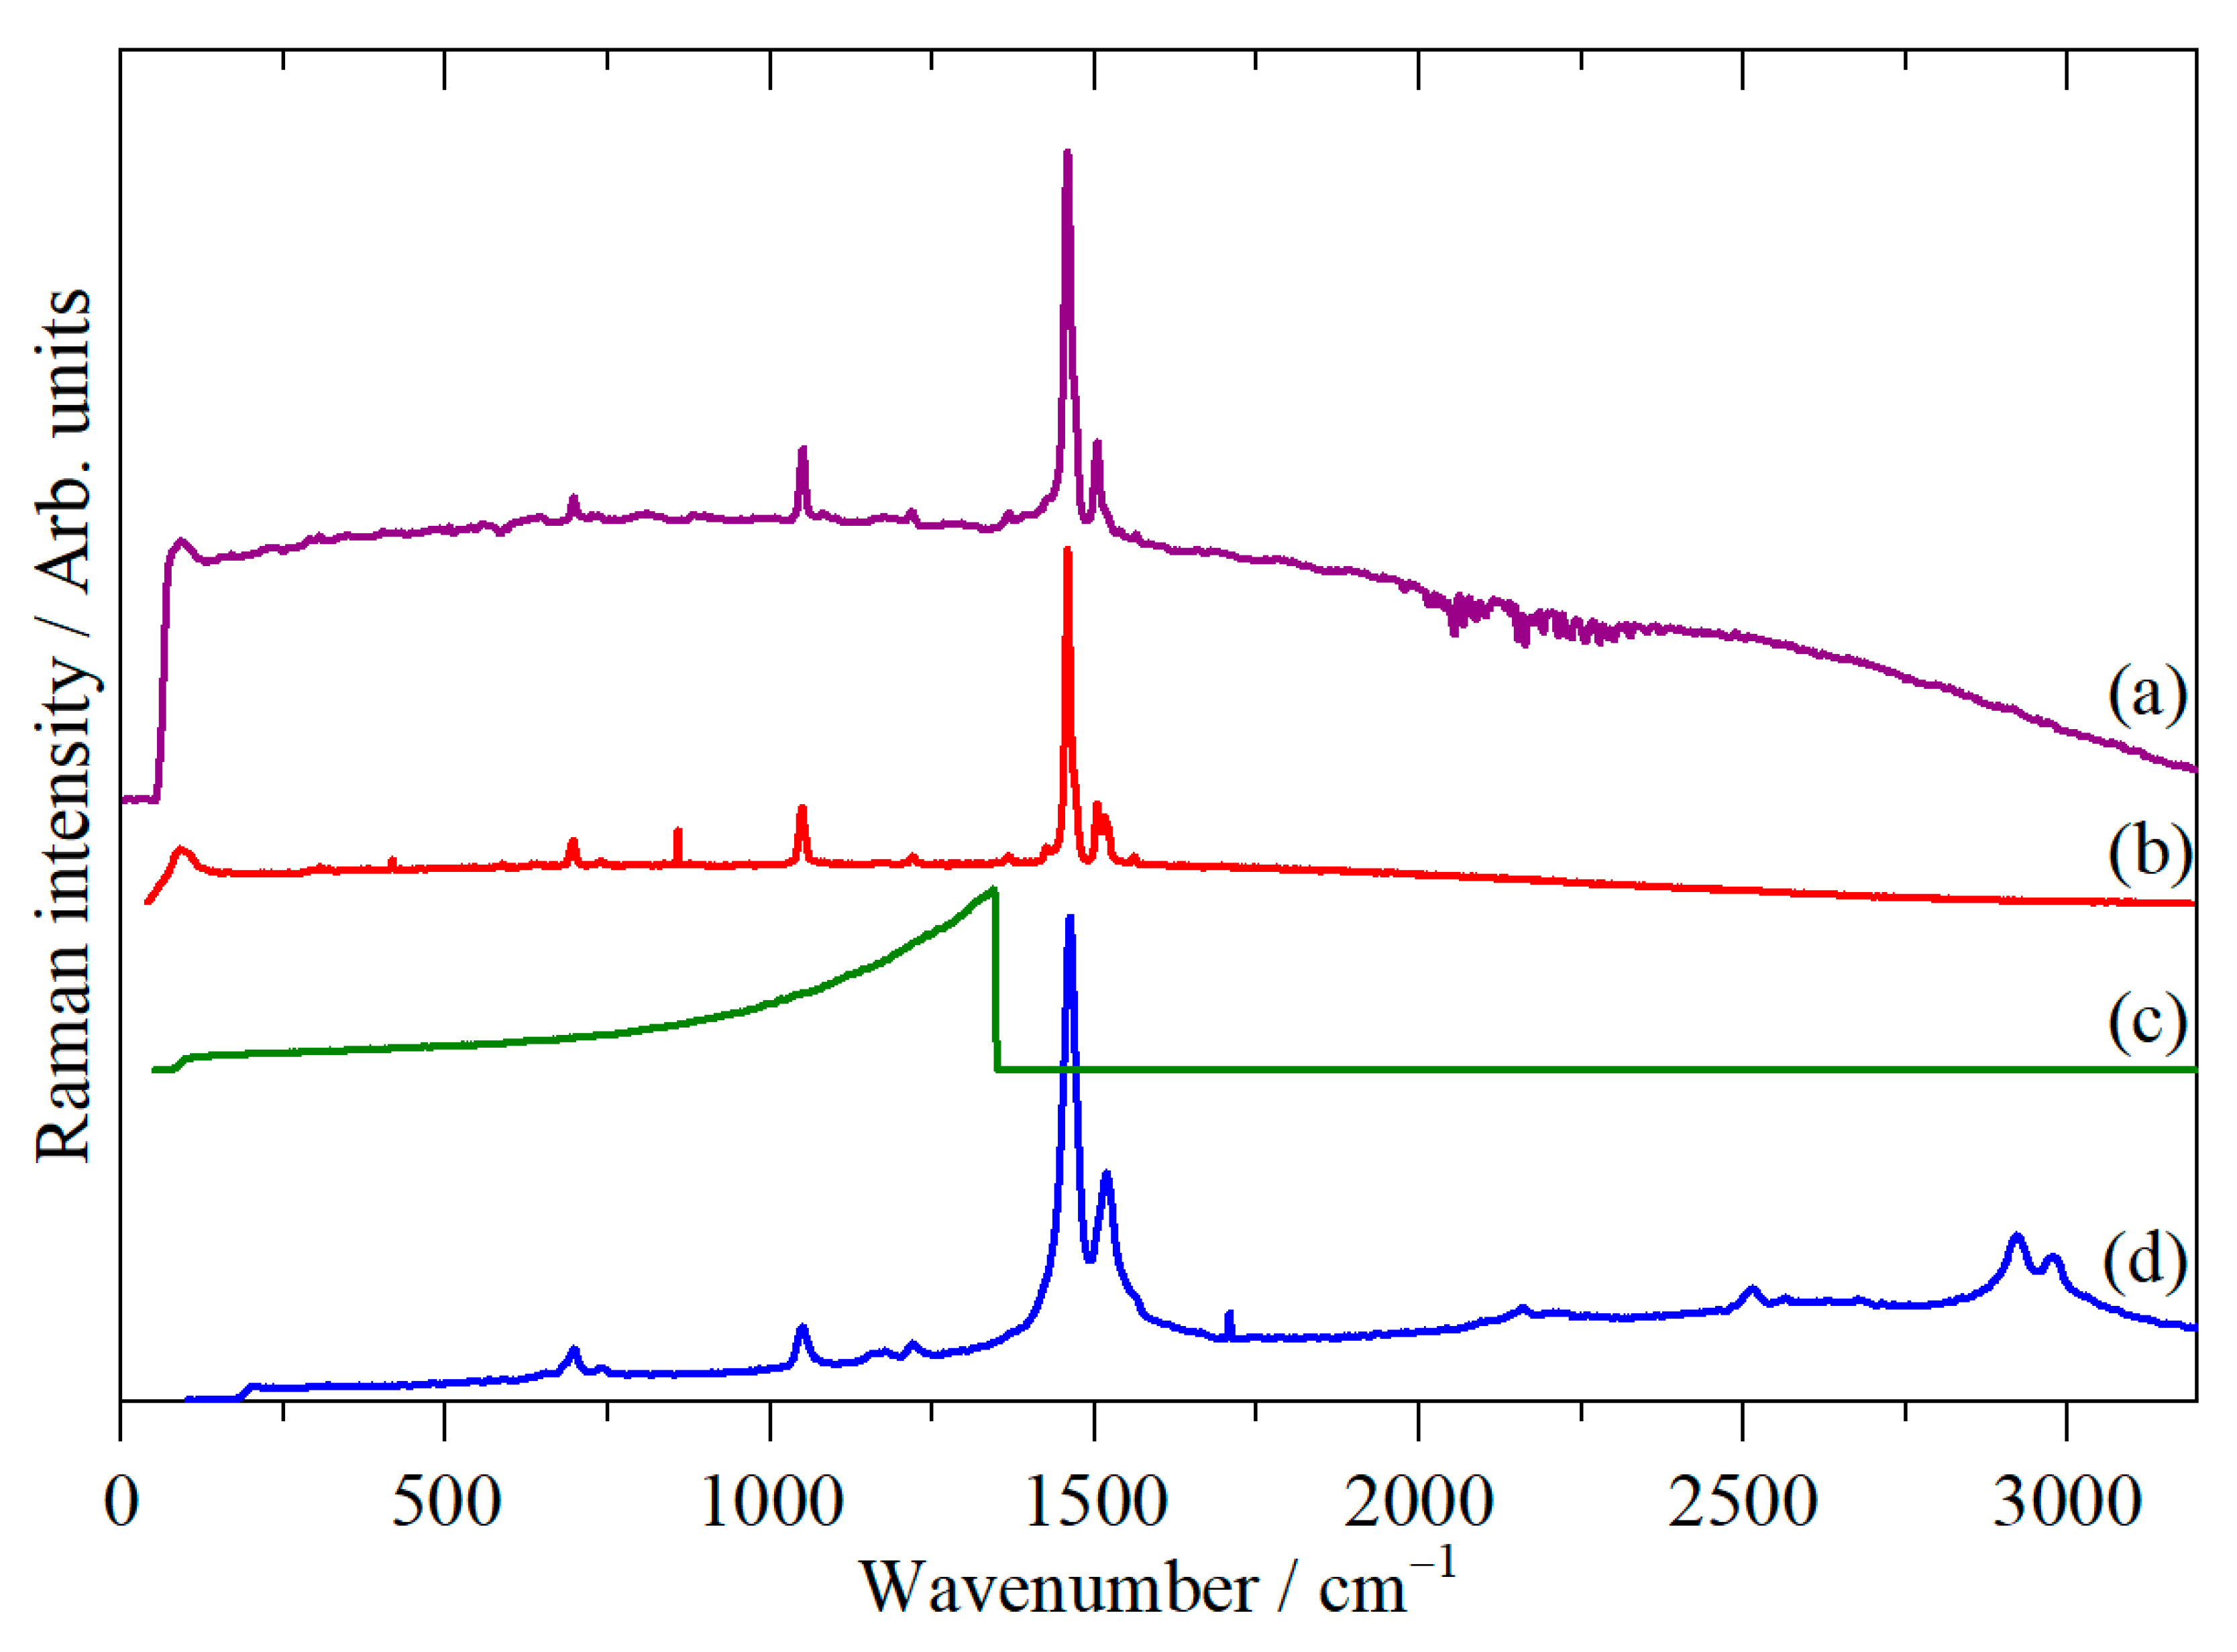
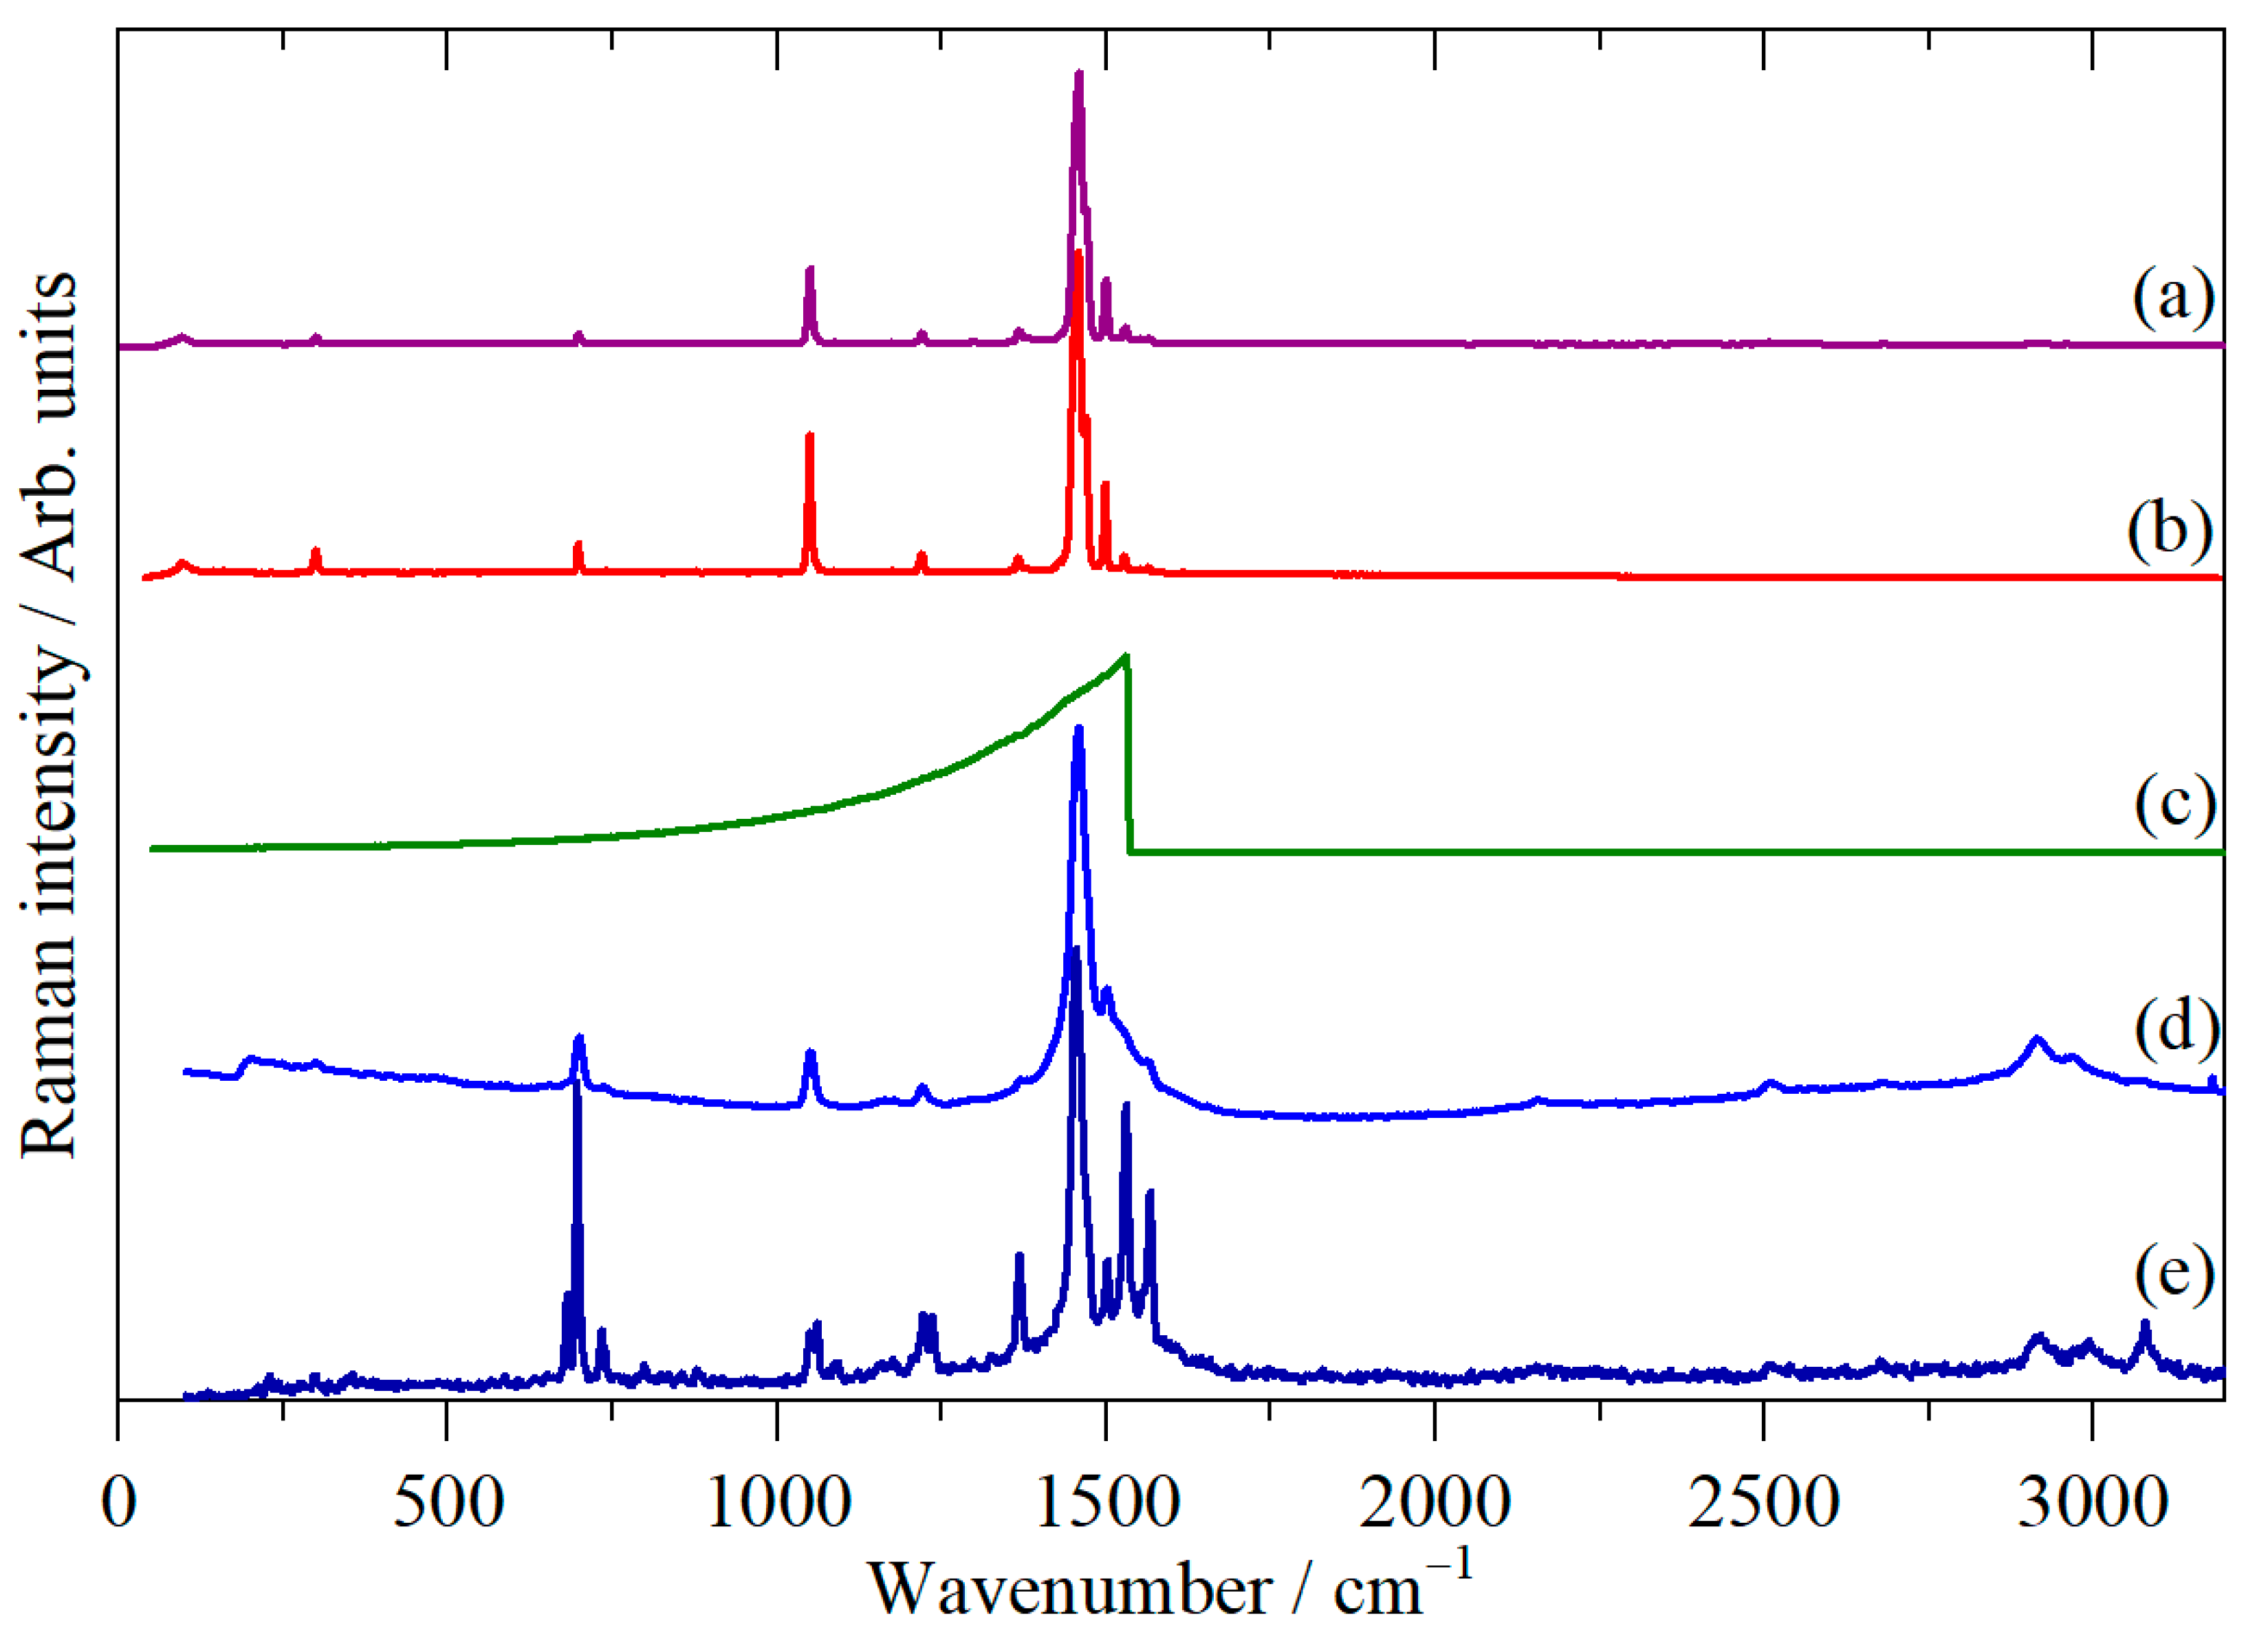
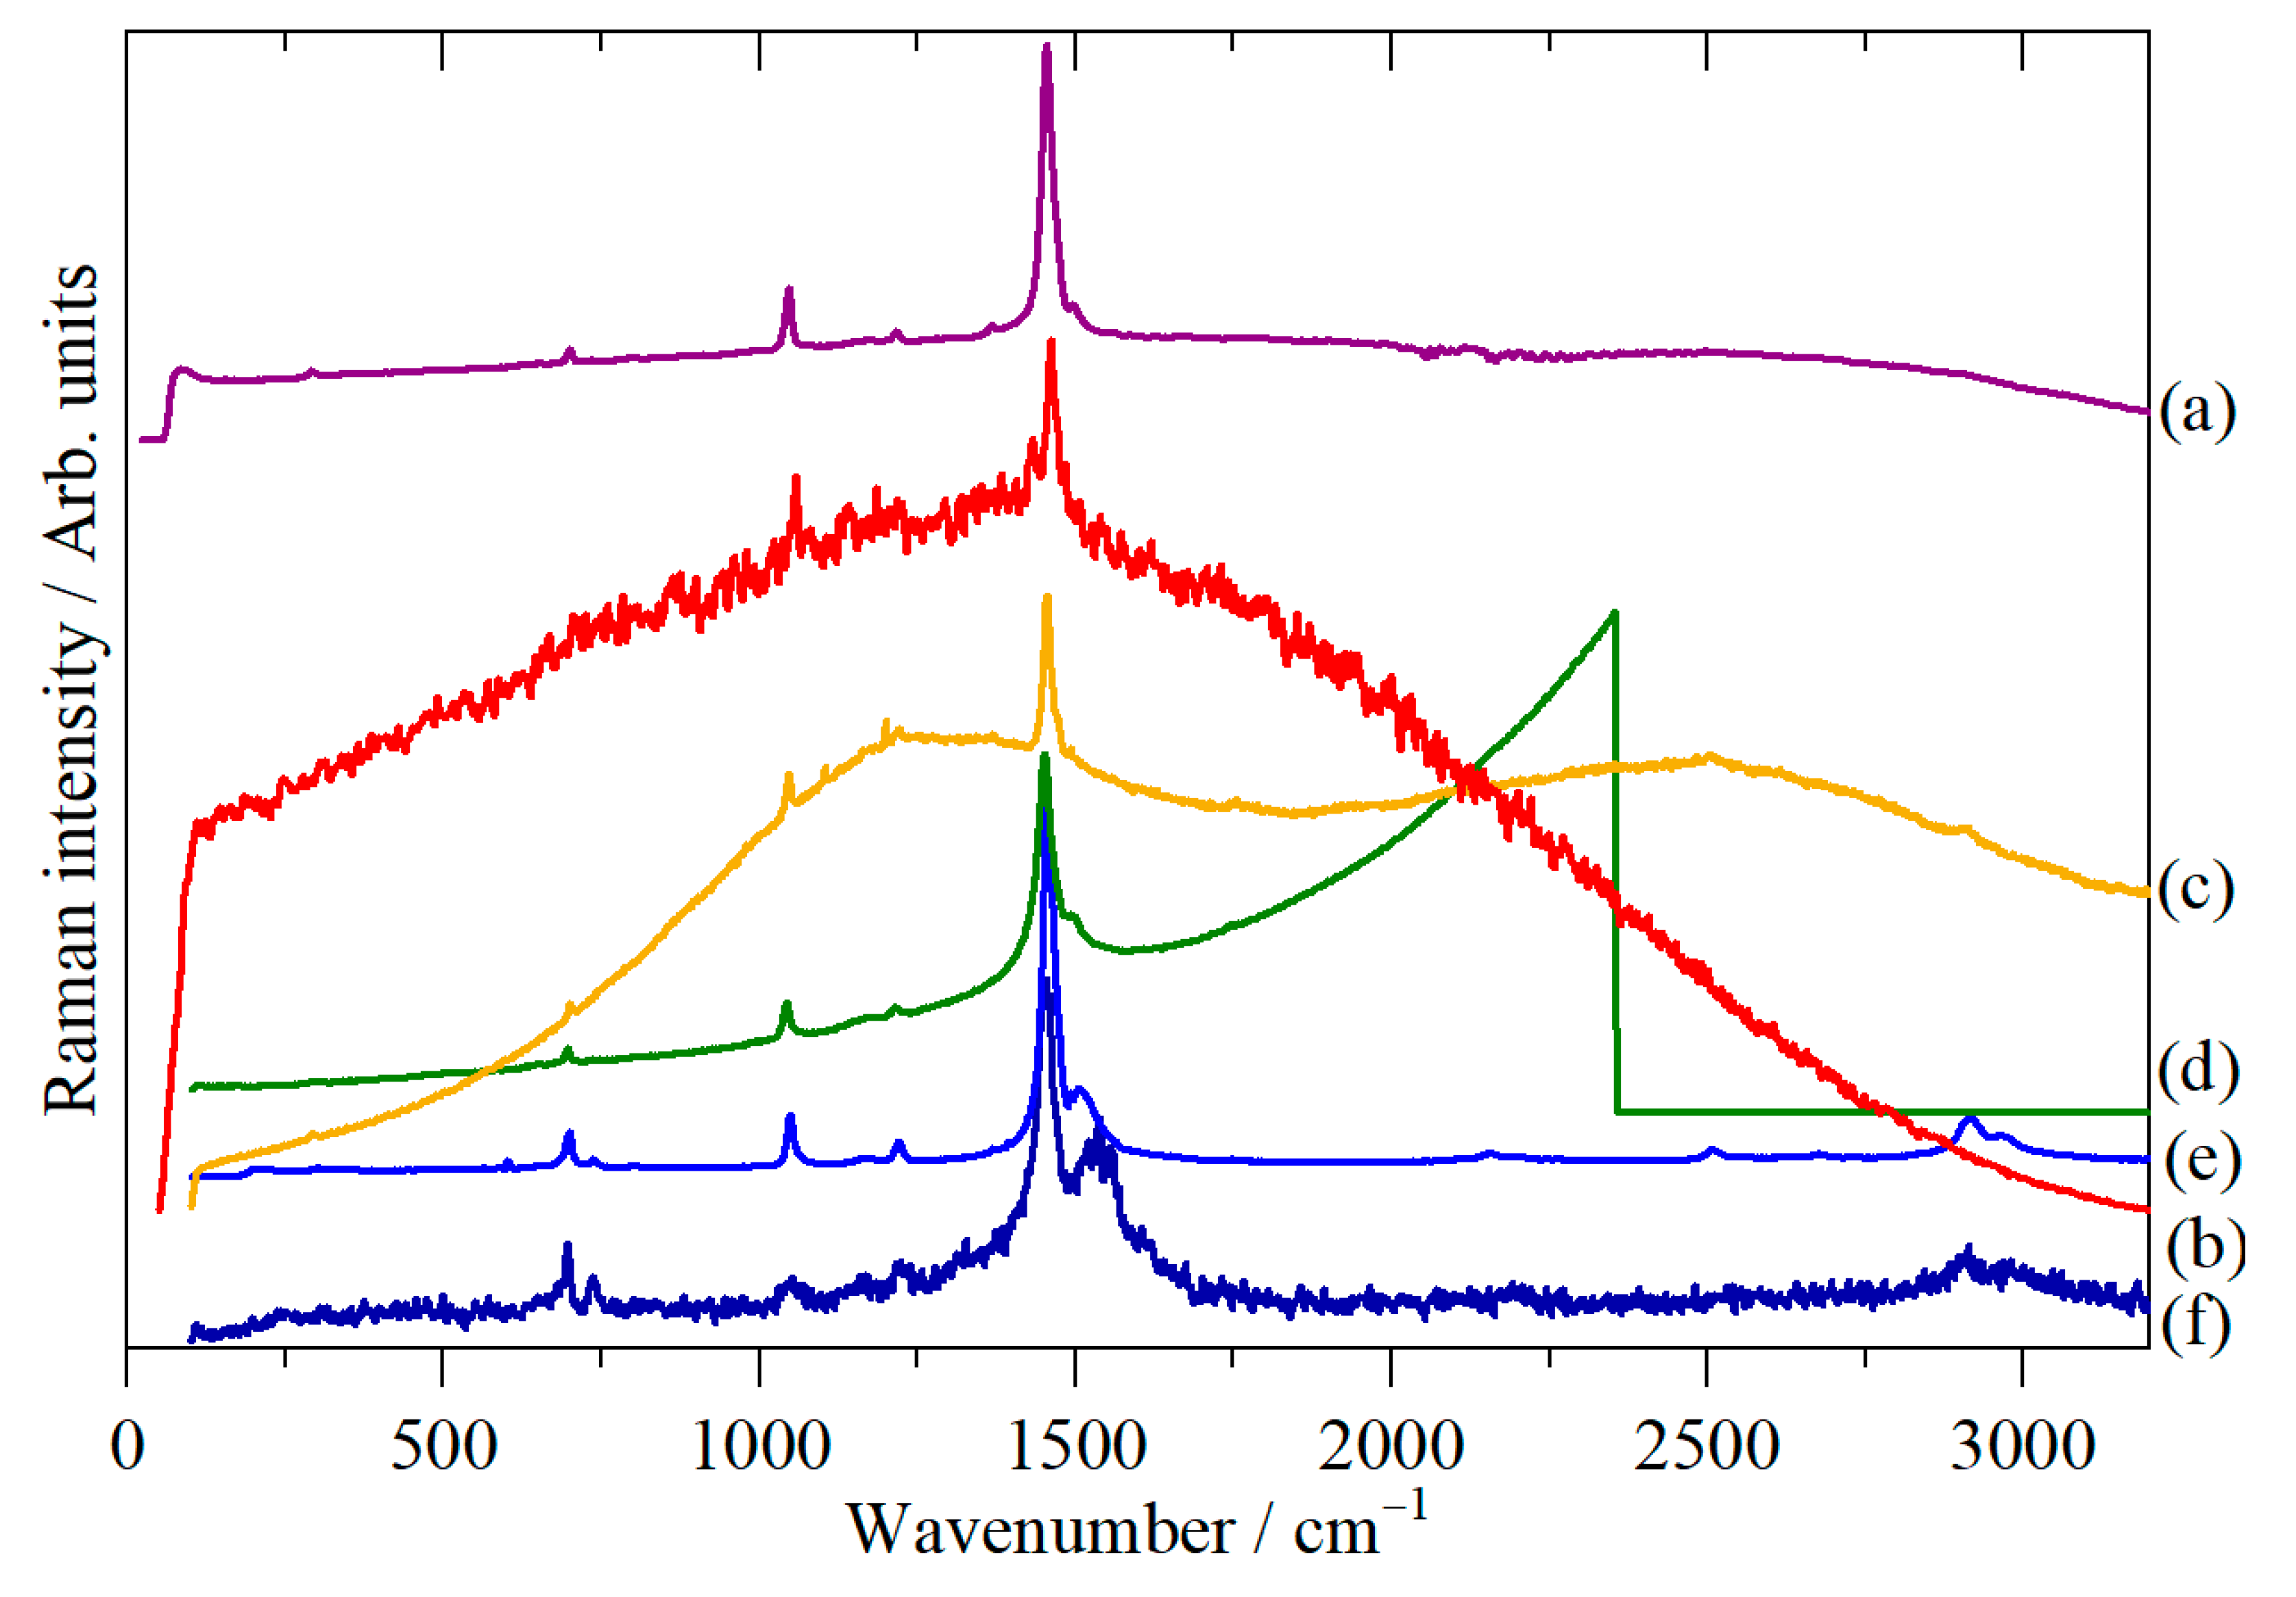
2,2′-Bithiophene, 2,2′:5′,2′′-terthiophene, 2,2′:5′:2′′:5′′,2′′′-quarterthiophene (quarterthiophene) and 2,2′:5′:2′′:5′′,2′′′:5′′′,2′′′′:5′′′′,2′′′′′-sexithiophene (α-sexithiophene, sexithiophene) were purchased from Aldrich (Gillingham, UK) (, 2,2′:5′:2′′:5′′,2′′′:5′′′,2′′′′:5′′′′,2′′′′′:5′′′′′,2′′′′′′:5′′′′′′,2′′′′′′′-octithiophene (α-octithiophene, octithiophene) was purchased from Tokyo Chemical Industry (Tokyo, Japan) (TCI) and polythiophene was purchased from Rieke Metals (Lincoln, NB, USA). The characterisation of the polythiophene has been reported previously [36]; in summary, it shows a relatively low degree of polymerisation, but the resulting material is highly conjugated and is essentially defect-free. The insolubility of polythiophene in all common solvents means that it is not possible to characterise the molecular weight distribution. All of the materials are solids at room temperature; where available, the purity was stated to be >96%, implying that the oligothiophenes are monodisperse. All of the oligothiophenes and polythiophene were used as received.
Raman spectra were recorded with a range of excitation wavelengths from the UV to the near-IR. Spectra with 325, 405, 532 and 633 nm were recorded with a Renishaw (Wotton-under-Edge, UK) inVia spectrometer at room temperature. A Bruker (Billerica, MA, USA) FT-Raman spectrometer (64 scans at 4 cm−1 resolution with 10–200 mW laser power, 8 times zerofilling) was used to measure spectra with 1064 nm excitation in a quartz cuvette at room temperature.
Solid-state UV-vis spectra (220–850 nm) were recorded in diffuse reflectance at room temperature with a Shimadzu (Kyoto, Japan) UV-2600i UV-vis spectrometer.
For all the spectra presented (both Raman and UV-vis), they are shown as recorded, i.e., there has been no smoothing, baseline correction, fluorescence removal (for the Raman spectra) or any other form of data enhancement applied.
The signal-to-noise (SNR) ratio in the Raman spectrum is defined as the ratio of the height of the peak at ~1440 cm−1 (the strongest band in the spectrum) to the standard deviation of the spectrum in the 1600–1750 cm−1 region (where there are no bands). Similarly, the signal-to-background (S:B) was the ratio of the height of the ~1440 cm−1 peak and the background at ~1440 cm−1.

3. Results

Figure 2 shows the UV-vis spectra of the oligothiophenes and polythiophene. These are in good agreement with the spectra of quarter- and octithiophene thin films [41]. The stick diagram at the base of the figure shows the laser lines used in this study. It can be seen that the 785 and 1064 nm lines fall outside of the absorption envelope while the others are within it. Generally, it would be expected that 785 and 1064 nm excitation would result in conventional Raman spectra, while resonance Raman spectra might be possible with the other lines.
Figure 3, Figure 4, Figure 5, Figure 6, Figure 7 and Figure 8 show the Raman spectra of the oligothiophenes and polythiophene obtained with a range of excitation wavelengths. There are several general features to note. All of the materials give good-quality spectra with 1064 nm excitation, although there is weak background fluorescence for bithiophene, quarterthiophene, sexithiophene and polythiophene. With 785 nm excitation, bithiophene, terthiophene and polythiophene are fluorescent, terthiophene so much so that no bands are observable. For the lines inside the absorption envelope, 532 nm only provides spectra only up to ~2000 cm−1 or so in most cases. The abrupt cut-off in the spectrum (the “cliff edge” at 2990 cm−1 in Figure 3b, at 1347 cm−1 in Figure 6b, 1553 cm−1 in Figure 7b and 2353 cm−1 in Figure 8b) is caused by detector saturation as a result of the fluorescence. The UV lines of 405 and 324 nm generally provide good-quality spectra, albeit with significant fluorescence for bithiophene and quarterthiophene.
These observations can be placed on a semi-quantitative basis by considering the signal-to-noise (SNR) and signal-to-background (S:B) ratios in the spectra. Table 1 lists the results of the analysis. The results are only semi-quantitative because the SNR and S:B depend on the type of instrument (dispersive or Fourier transform), the wavelength (the Raman signal is proportional to ν4, where ν is the excitation wavelength), the laser power, the measurement time and the degree of fluorescence. However, for each wavelength, the laser power and measurement time were similar, so data within a column are comparable. Comparison across the columns provides an indication of which wavelengths are more or less successful for each material. The SNR provides an assessment of the spectral quality: the larger the value, the better the quality. The S:B gives an indication of the severity of the fluorescence: the smaller the value, the worse the fluorescence.
Table 1 confirms the conclusions drawn by visual inspection of Figure 3, Figure 4, Figure 5, Figure 6, Figure 7 and Figure 8. 1064 nm consistently gives the highest SNR, although no sample is completely free of fluorescence. Excitation at 405 nm also consistently provides good-quality spectra with the added advantage of relatively little fluorescence. In contrast, 532 nm excitation is generally poor for the longer oligothiophenes.

4. Discussion

What is perhaps the most surprising feature of Figure 3, Figure 4, Figure 5, Figure 6, Figure 7 and Figure 8 is that there is little difference between the relative intensities (i.e., the ratio of a band’s intensity as compared to the strongest band) of the spectra with the different excitation wavelengths. At first sight, this would suggest that contrary to expectation, excitation within the absorption envelope does not result in significant resonance enhancement.
However, this is not the case. Close inspection of the 2000–3200 cm−1 region of octithiophene (Figure 7d,e) and polythiophene (Figure 8d,e) with 325 and 405 nm excitation shows modes at 2162, 2510, 2910 and 2972 cm−1. The obvious assignment of the latter two modes would be to C–H stretch vibrations; however, the 1064 nm excitation spectra of bi-, ter- and quarterthiophene show that these occur above 3000 cm−1, exactly as expected for sp2 C–H stretch modes [42]. Rather, all of the modes can be assigned to combinations and overtones involving the ~1440 cm−1 C–C ring stretch: 2162 ≈ 698 + 1453, 2505 ≈ 1050 + 1453, 2910 ≈ 2 × 1453, 2972 ≈ 1453 + 1512. The absence of these modes in the 785 and 1064 nm excitation spectra (which lie outside the absorption envelope, Figure 2) is evidence for them being the result of resonant enhancement in the 325 and 405 nm excitation spectra. The presence of overtones and combinations with anomalously large intensities is a hallmark of resonance Raman spectroscopy.
The 325 nm excitation spectrum of octithiophene, Figure 7e, is strikingly different, both from the spectra of the same material excited with different wavelengths and also from all of the other spectra. There are noticeably more modes present than for any other material. The UV-vis spectrum, Figure 2, does not show any feature that is more pronounced at 325 nm for octithiophene than for the other materials, including polythiophene, so the reason for the different behaviour of octithiophene is not clear.
As noted previously [36], the spectra of the oligothiophenes with n ≥ 2 (i.e., sexithiophene and longer) rapidly converge towards that of polythiophene. This is completely in agreement with the structural studies [10,11,12,13,14,15,16,17,18] that show that the oligothiophenes adopt the same conformation as polythiophene.
A study of polythiophene prepared with a variety of conjugation lengths [23] suggested that the intensities of the modes at 740 and 791 cm−1 increased as the conjugation length increased. If this was the case, then it might be expected that the corresponding modes in the oligothiophenes would also increase in intensity as the number of thiophene rings increased. Inspection of Figure 3, Figure 4, Figure 5, Figure 6, Figure 7 and Figure 8 shows that this does not happen.
While several groups have used a range of excitation wavelengths [20,32,33], this study has used the widest range: 325–1064 nm (3.815–1.165 eV). For the oligothiophenes and polythiophene, 405 nm generally gives the best results in terms of little or no fluorescence (especially for the longer chains) and the overall quality of the spectra. On the other hand, 1064 nm excitation is consistently reliable. Particularly for the shorter chains, where fluorescence is a particular problem, it provides good-quality spectra.

Author Contributions

Conceptualization, S.F.P.; data acquisition, S.F.P., J.E.T., T.S. and K.P.J.W.; writing—original draft preparation, S.F.P. and J.E.T.; writing—review and editing, S.F.P., J.E.T., T.S. and K.P.J.W.; funding acquisition, S.F.P. All authors have read and agreed to the published version of the manuscript.

Funding

This research was funded by the Science and Technology Facilities Council (STFC) via beam time proposal RB1720055 [43].

Data Availability Statement

The dataset (multi-wavelength Raman spectra of the oligothiophenes and polythiophene) supporting this article is available from the Science and Technology Facilities data repository (eData) at http://dx.doi.org/10.5286/edata/ https://edata.stfc.ac.uk/handle/edata/933 (accessed on 19 April 2023).

Acknowledgments

The authors thank the STFC Rutherford Appleton Laboratory for access to neutron beam facilities. The Research Complex at Harwell is thanked for access to and support of their facilities and equipment, including the FT-Raman spectrometer and the UV-vis spectrometer.

Conflicts of Interest

The authors declare no conflict of interest.

References

  1. The Nobel Prize in Chemistry 2000. NobelPrize.org. Nobel Prize Outreach AB 2022. Mon. Available online: https://www.nobelprize.org/prizes/chemistry/2000/summary/ (accessed on 28 November 2022).
  2. Loo, Y.-L.; McCulloch, I. Progress and challenges in commercialization of organic electronics. MRS Bull. 2008, 33, 553–562. [Google Scholar] [CrossRef] [Green Version]
  3. Mazzio, K.A.; Luscombe, C.K. The future of organic photovoltaics. Chem. Soc. Rev. 2015, 44, 78–90. [Google Scholar] [CrossRef]
  4. Bracciale, M.P.; Kim, C.; Marrocchi, A. Organic electronics: An overview of key materials, processes, and devices. In Sustainable Strategies in Organic Electronics; Marrocchi, A., Ed.; Woodhead Publishing: San Francisco, CA, USA, 2022; pp. 3–71. [Google Scholar]
  5. Wang, C.; Dong, H.; Jiang, L.; Hu, W. Organic semiconductor crystals. Chem. Soc. Rev. 2018, 47, 422–500. [Google Scholar] [CrossRef] [PubMed]
  6. Yeha, N.; Yeh, P. Organic solar cells: Their developments and potentials. Renew. Sust. Energy Rev. 2013, 21, 421–431. [Google Scholar] [CrossRef]
  7. Tong, Y.; Xiao, Z.; Du, X.; Zuo, C.; Li, Y.; Lv, M.; Yuan, Y.; Yi, C.; Hao, F.; Hua, Y.; et al. Progress of the key materials for organic solar cells. Sci. China Chem. 2020, 63, 758–765. [Google Scholar] [CrossRef]
  8. Zhang, L.; Colella, N.S.; Cherniawski, B.P.; Mannsfeld, S.C.B.; Briseno, A.L. Oligothiophene semiconductors: Synthesis, characterization, and applications for organic devices. ACS Appl. Mater. Interfaces 2014, 6, 5327–5343. [Google Scholar] [CrossRef] [PubMed]
  9. Kaloni, T.P.; Giesbrecht, P.K.; Schreckenbach, G.; Freund, M.S. Polythiophene: From fundamental perspectives to applications. Chem. Mater. 2017, 29, 10248–10283. [Google Scholar] [CrossRef]
  10. Chaloner, P.A.; Gunatunga, S.R.; Hitchcock, P.B. Redetermination of 2,2′-bithiophene. Acta Cryst. 1994, C50, 1941–1942. [Google Scholar] [CrossRef]
  11. Pelletier, M.; Brisse, F. Bithiophene at 133 K. Acta Cryst. 1994, C50, 1942–1945. [Google Scholar] [CrossRef]
  12. van Bolhuis, F.; Wynberg, H.; Havinga, E.E.; Meijer, E.W.; Staring, E.G.J. The X-ray structure and MNDO calculations of α-terthienyl: A model for polythiophenes. Synth. Metals 1989, 30, 381–389. [Google Scholar] [CrossRef] [Green Version]
  13. Azumi, R.; Goto, M.; Honda, K.; Matsumoto, M. Conformation and packing of odd-numbered α-oligothiophenes. Bull. Chem. Soc. Jpn. 2003, 76, 1561–1567. [Google Scholar] [CrossRef]
  14. Siegrist, T.; Kloc, C.; Laudise, R.A.; Katz, H.E.; Haddon, R.C. Crystal growth, structure, and electronic band structure of α-4T polymorphs. Adv. Mater. 1998, 10, 379–382. [Google Scholar] [CrossRef]
  15. Horowitz, G.; Bachet, B.; Yassar, A.; Lang, P.; Demanze, F.; Fave, J.-L.; Garnier, F. Growth and characterization of sexithiophene single crystals. Chem. Mater. 1995, 7, 1337–1341. [Google Scholar] [CrossRef]
  16. Fichou, D.; Bachet, B.; Demanze, F.; Billy, I.; Horowitz, G.; Garnier, F. Growth and structural characterization of the quasi-2D single crystal of α-octithiophene. Adv. Mater. 1996, 8, 500–504. [Google Scholar] [CrossRef]
  17. Mo, Z.; Lee, K.-B.; Moon, Y.B.; Kobayashi, M.; Heeger, A.J.; Wudl, F. X-ray scattering from polythiophene: Crystallinity and crystallographic structure. Macromolecules 1985, 18, 1972–1977. [Google Scholar] [CrossRef]
  18. Brückner, S.; Porzio, W. The structure of neutral polythiophene. An application of the Rietveld method. Makromol. Chem. 1988, 189, 961–967. [Google Scholar] [CrossRef]
  19. Mishra, A.; Ma, C.-Q.; Bäuerle, P. Functional oligothiophenes: Molecular design for multidimensional nanoarchitectures and their application. Chem. Rev. 2009, 109, 1141–1276. [Google Scholar] [CrossRef]
  20. Agosti, E.; Rivola, M.; Hernandez, V.; Del Zoppo, M.; Zerbi, G. Electronic and dynamical effects from the unusual features of the Raman spectra of oligo and polythiophenes. Synth. Metals 1999, 100, 101–112. [Google Scholar] [CrossRef]
  21. Esposti, A.D.; Moze, O.; Taliani, C.; Tomkinson, J.; Zamboni, R.; Zerbetto, F. The intramolecular vibrations of prototypical polythiophenes. J. Chem. Phys. 1996, 104, 9704–9718. [Google Scholar] [CrossRef]
  22. van Eijck, L.; Johnson, M.R.; Kearley, G.J. Intermolecular interactions in bithiophene as a model for polythiophene. J. Phys. Chem. A 2003, 107, 8980–8984. [Google Scholar] [CrossRef]
  23. Hermet, P.; Bantignies, J.-L.; Rahmani, A.; Sauvajol, J.-L.; Johnson, M.R. Density-of-states of crystalline 2,2′-bithiophene: Ab initio analysis and comparison with inelastic neutron scattering response. J. Phys. Condens. Matter 2004, 16, 7385–7396. [Google Scholar] [CrossRef]
  24. Hermet, P.; Izzard, N.; Rahmani, A.; Ghosez, P. Raman scattering in crystalline oligothiophenes: A comparison between density functional theory and bond polarizability model. J. Phys. Chem. B 2006, 110, 24869–24875. [Google Scholar] [CrossRef] [PubMed]
  25. Milani, A.; Brambilla, L.; Del Zoppo, M.; Zerbi, G. Raman dispersion and intermolecular interactions in unsubstituted thiophene oligomers. J. Phys. Chem. B 2007, 111, 1271–1276. [Google Scholar] [CrossRef] [PubMed]
  26. Louarn, G.; Buisson, J.P.; Lefran, S.; Fichou, D. Vibrational studies of a series of α-oligothiophenes as model systems of polythiophene. J. Phys. Chem. 1995, 99, 11399–11404. [Google Scholar] [CrossRef]
  27. Hermet, P.; Bantignies, J.-L.; Rahmani, A.; Sauvajol, J.-L.; Johnson, M.R. Polymorphism of crystalline α-quarterthiophene and α-sexithiophene: Ab initio analysis and comparison with inelastic neutron scattering response. J. Phys. Chem. A 2005, 109, 4202–4207. [Google Scholar] [CrossRef]
  28. Ranzieri, P.; Girlando, A.; Tavazzi, S.; Campione, M.; Raimondo, L.; Bilotti, I.; Brillante, A.; Della Valle, R.G.; Venuti, E. Polymorphism and phonon dynamics of α-quarterthiophene. Chem. Phys. Chem. 2009, 10, 657–663. [Google Scholar] [CrossRef]
  29. Degli Esposti, A.; Fanti, M.; Muccini, M.; Taliani, C.; Ruani, G. The polarized infrared and Raman spectra of α-T6 single crystal: An experimental and theoretical study. J. Chem. Phys. 2000, 112, 5957–5967. [Google Scholar] [CrossRef]
  30. Furukawa, Y.; Akimoto, M.; Harada, I. Vibrational key bands and electrical conductivity of polythiophene. Synth. Metals 1987, 18, 151–156. [Google Scholar] [CrossRef]
  31. Sauvajol, J.L.; Poussigue, G.; Benoit, C. Sample dependence of Raman spectrum on polythiophene films. Synth. Metals 1991, 41, 1237–1242. [Google Scholar] [CrossRef]
  32. Vardeny, Z.; Ehrenfreund, E.; Brafman, O. Photoinduced absorption and resonant Raman scattering of polythiophene. Synth. Metals 1987, 18, 183–188. [Google Scholar] [CrossRef]
  33. Bazzaoui, E.A.; Marsault, J.P.; Aeiyach, S.; Lacaze, P.C. Resonance Raman study of polythiophene films in the doped and undoped states. Relations between spectral data and physicochemical properties. Synth. Metals 1994, 66, 217–224. [Google Scholar] [CrossRef]
  34. Nejati, S.; Lau, K.K.S. Chemical vapor deposition synthesis of tunable unsubstituted polythiophene. Langmuir 2011, 27, 15223–15229. [Google Scholar] [CrossRef] [PubMed]
  35. Parker, S.F.; Parker, J.L.; Jura, M. Structure and vibrational spectra of 2,5-diiodothiophene: A model for polythiophene. J. Phys. Chem. C 2017, 121, 12636–12642. [Google Scholar] [CrossRef] [Green Version]
  36. Parker, S.F.; Trevelyan, J.E.; Cavaye, H. Vibrational spectra of neutral and doped oligothiophenes and polythiophene. RSC Adv. 2023, 13, 5419–5427. [Google Scholar] [CrossRef] [PubMed]
  37. Zhao, S.; Chen, H.; Lic, J.; Zhang, J. Synthesis of polythiophene/graphite composites and their enhanced electrochemical performance for aluminum ion batteries. New. J. Chem. 2019, 43, 15014–15022. [Google Scholar] [CrossRef]
  38. Husain, A.; Ahmad, S.; Shariq, M.U.; Khan, M.M.A. Ultra-sensitive, highly selective and completely reversible ammonia sensor based on polythiophene/SWCNT nanocomposite. Materialia 2020, 10, 100704. [Google Scholar] [CrossRef]
  39. Mosca, S.; Milani, A.; Castiglioni, C.; Hernández Jolín, V.; Meseguer, C.; López Navarrete, J.T.; Zhao, C.; Sugiyasu, K.; Carmen, M.; Delgado, R. Raman fingerprints of π-electron delocalization in polythiophene-based insulated molecular wires. Macromolecules 2022, 55, 3458–3468. [Google Scholar] [CrossRef]
  40. El Guerraf, A.; Ben Jadi, S.; Bouabdallaoui, M.; Aouzal, Z.; Bazzaoui, M.; Aubard, J.; Lévi, G.; Bazzaoui, E.A. Investigation of the geometry and anchoring mode of conducting polythiophene films electrosynthesized on aluminium working electrodes. Mater. Today Proc. 2020, 22, 73–77. [Google Scholar] [CrossRef]
  41. Fichou, D.; Horowitz, G.; Xu, B.; Garnier, F. Low temperature optical absorption of polycrystalline thin films of α-quaterthiophene, α-sexithiophene and α-octithiophene, three model oligomers of polythiophene. Synth. Metals 1992, 48, 167–179. [Google Scholar] [CrossRef]
  42. Lin-Vien, D.; Colthup, N.B.; Fateley, W.G.; Grasselli, J. The Handbook of Infrared and Raman Characteristic Frequencies of Organic Molecules; Academic Press: Boston, MA, USA, 1991; p. 17. [Google Scholar]
  43. Parker, S.F. INS Studies of Conducting Polymers: Oligothiophenes and Polythiophene; STFC ISIS Facility: Swindon, UK, 2017. [Google Scholar] [CrossRef]
Figure 1. Structures of oligothiophenes and polythiophene. (a) Terthiophene, (b) n = 0 bithiophene, n = 1 quarterthiophene, n = 2 sexithiophene, n = 3 octithiophene and n = ∞ polythiophene.
Physchem 03 00014 g001
Figure 2. Room temperature diffuse reflectance UV-vis spectra of some oligothiophenes and polythiophene. The vertical solid bars at the bottom of the figure show the laser wavelengths used in this work.
Physchem 03 00014 g002
Figure 3. Room temperature multi-wavelength Raman spectra of bithiophene: (a) 1064 nm, (b) 785 nm, (c) 532 nm, (d) 405 nm and (e) 325 nm excitation.
Physchem 03 00014 g003
Figure 4. Room temperature multi-wavelength Raman spectra of terthiophene: (a) 1064 nm, (b) 785 nm and (c) 532 nm excitation.
Physchem 03 00014 g004
Figure 5. Room temperature Raman spectra of quarterthiophene: (a) 1064 nm, (b) 785 nm, (b’) expanded view of 1350–1550 cm−1 region of (b,c) 405 nm excitation.
Physchem 03 00014 g005
Figure 6. Room temperature multi-wavelength Raman spectra of sexithiophene: (a) 1064 nm, (b) 785 nm, (c) 532 nm and (d) 405 nm excitation.
Physchem 03 00014 g006
Figure 7. Room temperature multi-wavelength Raman spectra of octithiophene: (a) 1064 nm, (b) 785 nm, (c) 532 nm, (d) 405 nm and (e) 325 nm excitation.
Physchem 03 00014 g007
Figure 8. Room temperature multi-wavelength Raman spectra of polythiophene: (a) 1064 nm, (b) 785 nm, (c) 633 nm. (d) 53Im, (e) 405 nm and (f) 325 nm excitation.
Physchem 03 00014 g008
Table 1. Signal-to-noise and signal-to-background ratio for the thiophenes as a function of excitation wavelength.
Thiophene325 nm405 nm532 nm632 nm785 nm1064 nm
SNR 1S:B 2SNRS:BSNRS:BSNRS:BSNRS:BSNRS:B
Bithiophene41.32161.741405.37 441.622533.93
Terthiophene 30.11 0 3F 464918.56
Quarterthiophene 1262.21 20.031322.17
Sexithiophene 523.24FF 2887.031101.33
Octithiophene714.14431.870F 73446.621159113.15
Polythiophene111.621246.16251.13280.34110.224142.38
1 SNR = signal-to-noise ratio of the peak at ~1440 cm−1; 2 S:B = signal-to-background ratio of the peak at ~1440 cm−1; 3 0 indicates that while fluorescence is present, it has not saturated the detector; however, no spectral features are visible; 4 F indicates that the fluorescence is so strong that it has saturated the detector.
Disclaimer/Publisher’s Note: The statements, opinions and data contained in all publications are solely those of the individual author(s) and contributor(s) and not of MDPI and/or the editor(s). MDPI and/or the editor(s) disclaim responsibility for any injury to people or property resulting from any ideas, methods, instructions or products referred to in the content.

