Article

Role of the Number of Adsorption Sites and Adsorption Dynamics of Diffusing Particles in a Confined Liquid with Langmuir Kinetics

by
Renato F. de Souza
1,
Roberta R. Ribeiro de Almeida
2,
Eric K. Omori
2,
Rodolfo T. de Souza
2,
Ervin K. Lenzi
3,*,
Luiz R. Evangelista
1,2 and
Rafael S. Zola
2
1
Department of Physics, Universidade Estadual de Maringá Avenida Colombo 5790, Maringá 87020-900, PR, Brazil
2
Department of Physics, Universidade Tecnológica Federal do Paraná, Rua Marcílio Dias 635, Apucarana 86812-460, PR, Brazil
3
Department of Physics, Universidade Estadual de Ponta Grossa, Ponta Grossa 87030-900, PR, Brazil
*
Author to whom correspondence should be addressed.
Physchem 2023, 3(1), 1-12; https://doi.org/10.3390/physchem3010001
Submission received: 31 August 2022 / Revised: 21 November 2022 / Accepted: 15 December 2022 / Published: 20 December 2022

Abstract

:
In this work, we investigate the effect of the number of available adsorption sites for diffusing particles in a liquid confined between walls where the adsorption (desorption) phenomena occur. We formulate and numerically solve a model for particles governed by Fickian’s law of diffusion, where the dynamics at the surfaces obey the Langmuir kinetic equation. The ratio between the available number of adsorption sites and the number of total particles are used as a control parameter. The investigation is carried out in terms of characteristic times of the system for different initial configurations, as well as the cases of identical or non-identical surfaces. We calculate the bulk and surface densities dynamics, as well as the variance of the system, and demonstrate that the number of sites affects the bulk, surface distributions, and diffusive regimes.

1. Introduction

The kinetics of diffusing particles in confined space with adsorption (desorption) by solid substrates represent an important class of problems that is readily applied from basic sciences to industrial separation processes [1,2,3,4,5,6,7]. One basic approach to model adsorption–desorption phenomena is to use the simple, yet very powerful, Langmuir adsorption [8], often referred to as Langmuir kinetics [9,10]. At the same time, the diffusion process is described by Fick’s law [11]. Indeed, in any practical application where any transport takes place, adsorption–desorption is likely to occur, even in very simple geometries [12,13]. However, from an analytical point of view, it is not easy to solve the coupled equations representing diffusion and Langmuir’s kinetic altogether. In many cases, due to the nature of adsorbents, first- and second-order kinetic equations are employed to analyze experimental data [14,15,16,17]. Such equations account, for example, for diffusion within the adsorbing wall [18]. In other cases, a linearization process is performed to the Langmuir kinetic equation, in which the number of available sites for adsorption is much larger than the number of particles in the system [3,13,19,20]. Such an approach is convenient for studying the relation between diffusing particles in bulk samples adsorbed by confining walls.
Several systems of interest have been studied within the scope of the linearized Langmuir kinetic equation coupled to the diffusion equation. For example, it was used to study general aspects of bulk and surface dynamics [3], characterize diffusion in different geometries [12,13], to probe time-dependent diffusion coefficients [20], to insert memory effects and distinguish adsorption kind [21,22], to study adsorption and diffusion in systems with non-identical surfaces [23] and in systems with augmented surfaces [24], analyze adsorption in systems with space-dependent diffusion coefficient [25], and to study adsorption effects in electrolyte cells in the context of impedance spectroscopy [3,26]. However, in the above cases, the importance of the number of particles to the number of adsorbing sites ratio is neglected.
This article aims to provide a simple yet general model to study the diffusion of neutral particles in an isotropic liquid confined by adsorbing (desorbing) walls that obey Langmuir’s kinetic. In this sense, a broad spectrum of phenomena arises by combining diffusion and a limited number of adsorbing sites, including how the bulk and surface dynamics take place and the effect of Langmuir’s kinetic on diffusive regimes on the bulk. Furthermore, we demonstrate how memory effects can be included within Langmuir’s kinetic equation to account for more general scenarios related to the number of particles, number of adsorbing sites, and the dependence of the previous state of the particle on the next one.

2. Model

Since we want to study diffusing particles diluted in a liquid in contact with adsorbing (desorbing) walls, we assume a sample in the shape of a slab where the only relevant direction is the z−axis. Such geometry is similar to experimental situations such as those found in liquid crystal displays, for example, where the adsorption and desorption of particles is known to play critical roles in the organization of the material [3]. The cell has thickness L, and the substrates are located at z = L / 2 (left side) and z = + L / 2 (right side), as shown in Figure 1. Particles in bulk obey the diffusion equation, here assumed to be diluted so the Fickian approach can be used, that is
ρ t = z D ρ z ,
where D is the diffusion coefficient, here assumed to be constant in space, and ρ ( z , t ) is the time- and space-dependent bulk density of particles. At the walls limiting the sample, we assume that for t = 0 , all the particles are in the bulk (all adsorption sites are vacant), and that particles may be adsorbed–desorbed according to the well-known Langmuir’s kinetic equation:
d σ i d t = κ a i ρ ( 1 σ i σ 0 i ) κ d i σ i .
In Equation (2), the subscript i = ± L / 2 represents the set of parameters characterizing either the surface on the left side or the surface on the right side of the sample. Moreover, σ i ( t ) is the density of adsorbed particles and κ a i is a parameter representing the rate of adsorption, while κ d i represents the rate (or time) of desorption. Furthermore, σ 0 i is the number of adsorption sites available at surface i. The Langmuir kinetics assumes that the adsorption rate ( d σ i / d t ) is proportional to the difference between adsorption and desorption rates and that both rates are the same at equilibrium. Figure 1 shows the system studied here, including the occupied and free sites at the walls.
Notice that if we consider an infinity number of sites available for adsorption ( σ 0 i ), we recover the linearized version previously used in different works [21]. Moreover, if the total density of particles is ρ 0 , and are initially in the bulk, i.e., ρ ( z , t = 0 ) = ρ 0 , we can introduce the normalized quantities ρ R = ρ / ρ 0 and σ R i = σ i / σ 0 i , and, at equilibrium, arrive at the Langmuir isotherm:
σ R i = α i ρ R 1 + α i ρ R ,
where α i = κ a i ρ 0 / ( κ d i σ 0 i ) is a parameter governing the steady-state equation for each substrate. The set of Equations (1) and (2) are solved with the aid of the current density at the walls, that is,
D ρ z z = ± L / 2 = d σ i d t ,
which implies that the number of particles must be conserved, that is
2 σ i + L / 2 L / 2 ρ d z = ρ 0 L .
To account for memory effects, we modify Equation (2). We introduce a kernel dependence as follows:
d σ i d t = κ a i ρ ( 1 σ i σ 0 i ) κ d i 0 t K ( τ ) σ i ( τ ) d τ ,
where K ( τ ) is a kernel introduced to represent distinct scenarios related to the adsorption-desorption phenomena. An equation such as Equation (6) has been widely used to describe memory effects and non-Debye relaxations [21,22,27,28]. It has been used to describe chemisorption, physisorption, or a combination of both depending on the choice of K ( τ ) [21,22]. Although we introduced the kernel in the desorption term of Equation (2), it is important to stress that a memory effect represents that the previous state of the particle is important for the next state, so the kernel modifies the whole dynamics of the surface. Unfortunately, the process of solving Equations (2), (5) and (6) is difficult and does not have an analytical solution, so we employ a numerical method to solve it (see, for example, refs. [29,30]). We first introduce reduced quantities in such a way that Equation (1) becomes
ρ R t * = 2 ρ R Z 2 ,
where ρ R = ρ / ρ 0 , Z = 2 z / L , t * = 4 t / τ D , and τ D = L 2 / D is the diffusion time. Regarding Equation (2), we first notice that the parameter 1 / κ d i has the dimension of time; thus, we write it as τ i (now i = ± 1 , which we call either l or r, meaning left or right side, respectively) from now on. Second, we have to choose the form of the kernel K ( t ) to proceed with the solution procedure. As proposed in [21], the form K ( t ) = 1 / ( τ a i ) e t / τ a i , which is a non-localized function of time, is an excellent choice to represent memory effects, such as may occur during multiple collisions of particles with the surfaces, in which energy is lost after each collision, and therefore the previous state of the particle is important in determining the next state. This memory time, represented by τ a i , reproduces the adsorption–desorption phenomena often found in physisorption or mixed processes [21]. If τ a i 0 , we recover the original kinetic equation, Equation (2), which is better suited to describe chemisorption processes. Numerically, it is more convenient to work with differential equations than with integral equations. We therefore take the time derivative on both sides of Equation (6) and apply the kernel K ( t ) = 1 / ( τ a i ) e t / τ a i to arrive at:
d 2 σ R i d t * 2 ( 1 σ R i ) τ D β i 2 τ κ i ρ R t * + ρ R τ D 2 β i 8 τ κ i τ a i + d σ R i d t * ρ R τ D β i 2 τ κ i + τ D τ a i + τ D 2 σ R i 16 τ a i τ i = 0 ,
where τ κ i = L / 2 κ a i is the adsorption time and β i = ρ 0 L / σ 0 i is a parameter that relates the number of particles available in bulk to be adsorbed to the number of sites available at the surfaces. Thus, if β i < 1 , the specific surface has more sites than particles to be adsorbed, whereas if β i > 1 , there are not enough sites at the surface for all the particles in bulk. The conservation of the number of particles, Equation (5), now becomes
σ R l β l + σ R r β r + 1 2 1 1 ρ R d Z = 1 ,
which also implies:
2 β i d σ R i d t * = ± ρ R Z Z = 1 .
A summary of the main parameters and a brief description is given in Appendix A. Now, in order to solve the set of Equations (7)–(9) (or (10)), we employ a numerical method based on finite differences [31]. We use a mesh with n z points separated by a fixed distance δ z = L / ( n z 1 ) . All derivatives were taken using a central difference with a second-order approximation, using ghost points at the borders. Thus, including the two walls, it results in a system of ordinary equations in t * , with n z + 4 equations. The time integration was performed with the 8th-order Dormand–Prince method implemented by the GSL library [32]. To ensure that the simulations were performed without instabilities, we monitored the conservation of the number of particles during each small increment in time by checking if Equation (9) is still satisfied. Through all simulations, we used n z = 500 , and set the absolute error to be smaller than 10 9 , allowing a free time step size, and retrieved data at every Δ t * = 10 6 . Moreover, we assumed the initial surface density for both walls was zero ( σ R i ( t * = 0 ) = 0 ) . For the initial distribution in bulk, we used two different initial configurations: 1—particles are uniformly distributed across the cell ( ρ R ( Z , t * = 0 ) = 1 ), or 2—particles are initially concentrated in a plane set in the center of the sample, that is, the initial bulk distribution obeys a Dirac delta configuration. Finally, the characteristic times used in this work come from experimental data of similarly confined systems [3]. The adsorption parameter, κ a i , is usually in the order of 10 6 ms 1 [3,33]. At the same time, the desorption time was estimated to be nearly 0.01 s for liquid crystal samples and close to 1 s for other isotropic samples [3,33]. A typical slab sample such as the one studied here is around 10 μm thick, while the diffusion coefficient is in the order of D 10 11 m2s−1, so τ D 10 s. Last, the memory time was estimated from experimental results to be τ a 1 s [21]. It is important to notice that, as long as the system obeys Fick’s law and Langmuir’s kinetic, it in principle can be investigated within the scope of this model.

3. Results and Discussion

We start by analyzing how bulk and surface distributions change over time as the characteristic parameters of the system change. In particular, we want to understand how the parameter β , which gives the ratio between particles available to be adsorbed and the number of sites available for adsorption, affects the bulk distribution of particles. Indeed, previous attempts to model adsorption–desorption with diffusing particles in a limited system [21] have used a kinetic equation that considers the number of sites to be infinity, so we can check here the importance of having a limited number of sites on the dynamics of the system. Furthermore, in our model, we can treat both surfaces as being non-identical; that is, each surface has its dynamics, so the model becomes more closely related to experimental situations (where it is difficult to assure both surfaces are completely identical) and to other cases where adsorption is present and substrates are non-identical, such as in fuel cells (hybrid microfluidic fuel cells, for example) [34], hybrid aligned liquid crystal cells [35], wetting layers [36], liquid crystals doped with dyes [37], and polymer adsorption in confined regions [38].
We start by showing a simple example where the role played by the parameter β can be clearly understood. For this first case, we consider both surfaces to be identical (so σ R l = σ R r , β l = β r and so on) and that the initial bulk distribution is uniform, i.e., ρ R ( Z , t * = 0 ) = 1 . 
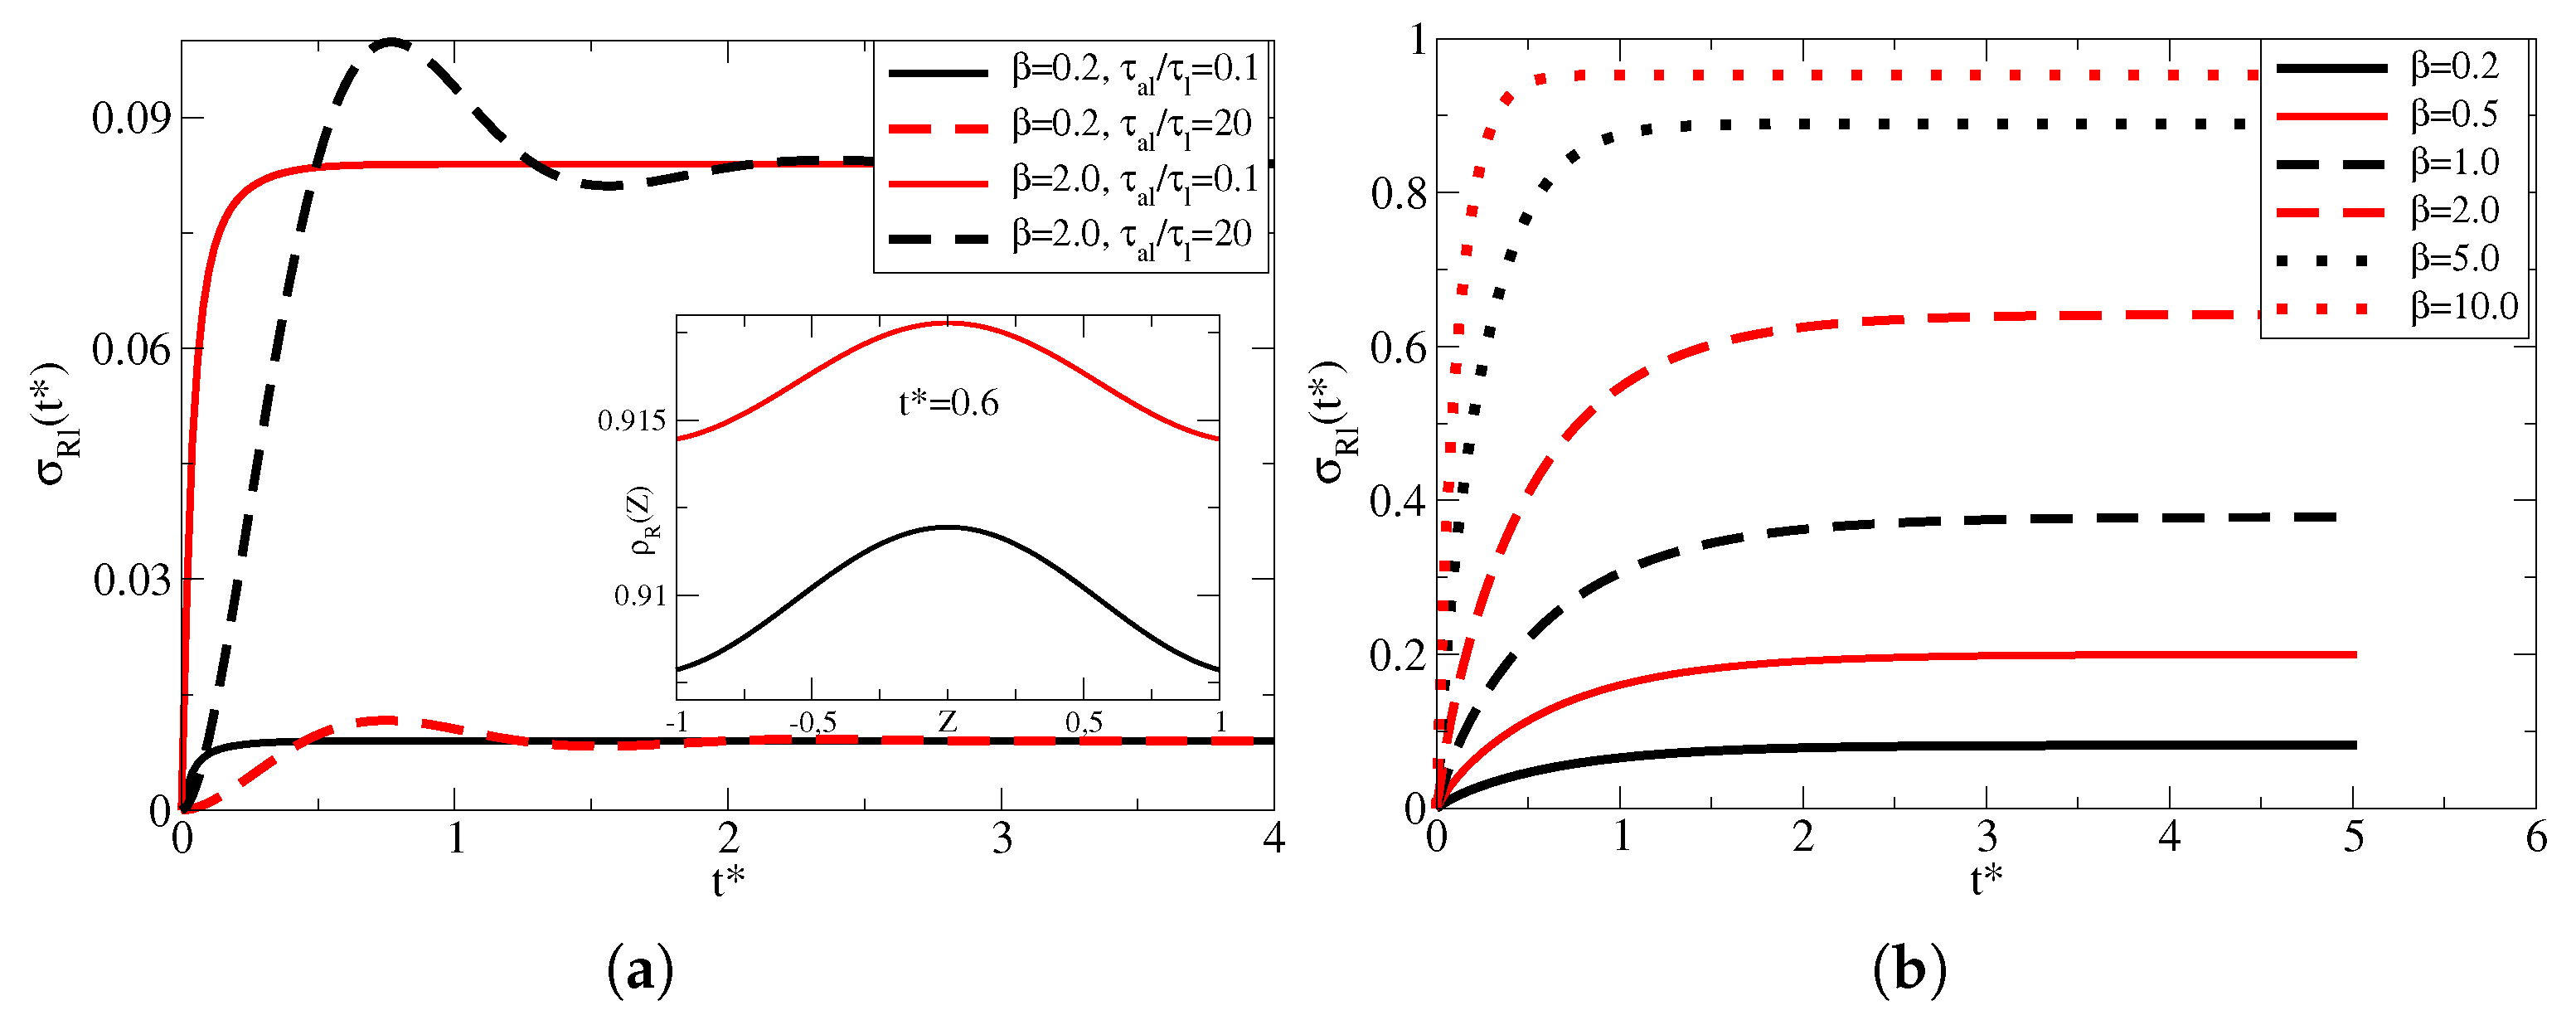
Figure 2a reproduces the surface density (in Z = 1 ) vs. t * for τ D / τ l = 100 , τ κ l / τ l = 10 and for two values of τ a l / τ l , that is, 0.1 or 20, meaning in the first case very short memory time and in the second case a long memory time, which results in the oscillations seen during the adsorption phenomena [21]. As discussed elsewhere [21], memory effects occur when the adsorption process depends on the previous state of the particle being adsorbed. For example, if a particle falls into an adsorbing well, it may be desorbed and eventually adsorbed again. Since the energy landscape changes after each process, the next phenomenon depends on the previous state, which in such a dynamic model it is represented by the parameter τ a [21,22]. We used two different values of β , 0.2 and 2, meaning in the first case there are five times more sites on the surfaces to adsorb than particles to be adsorbed, while in the second case, there are two times more particles in bulk to be adsorbed than available sites. Since τ κ i < τ i , the desorption rate is larger than adsorption, so the equilibrium density is fairly low. However, in the case of β > 1 , the surfaces reach a larger value, as expected (see Equation (3)). It is also interesting to note that the adsorption peak position ( t * ), related to memory effects, also changes depending on β , which is indicative that memory effects are also sensitive to the ratio between the number of particles to the available number of adsorbing sites. To the best of our knowledge, this is the first time memory effects are considered in Langmuir kinetics. The inset shows the bulk density for t * = 0.6 , indicating that for larger β there is a tendency of larger bulk density at all times. Figure 2b shows the left-side surface density for τ D / τ l = 100 , τ κ l / τ l = 1 and τ a l / τ l = 0.1 and several values of β . Since the adsorption and desorption rates are the same, the surface coverage is more extensive and determined by the parameter β . For example, if the number of particles is ten times larger than the number of sites, the surfaces are nearly filled to maximum once the equilibrium is achieved. Clearly, the surface density for β = 10.0 reaches saturation quicker when compared with β = 0.2 .
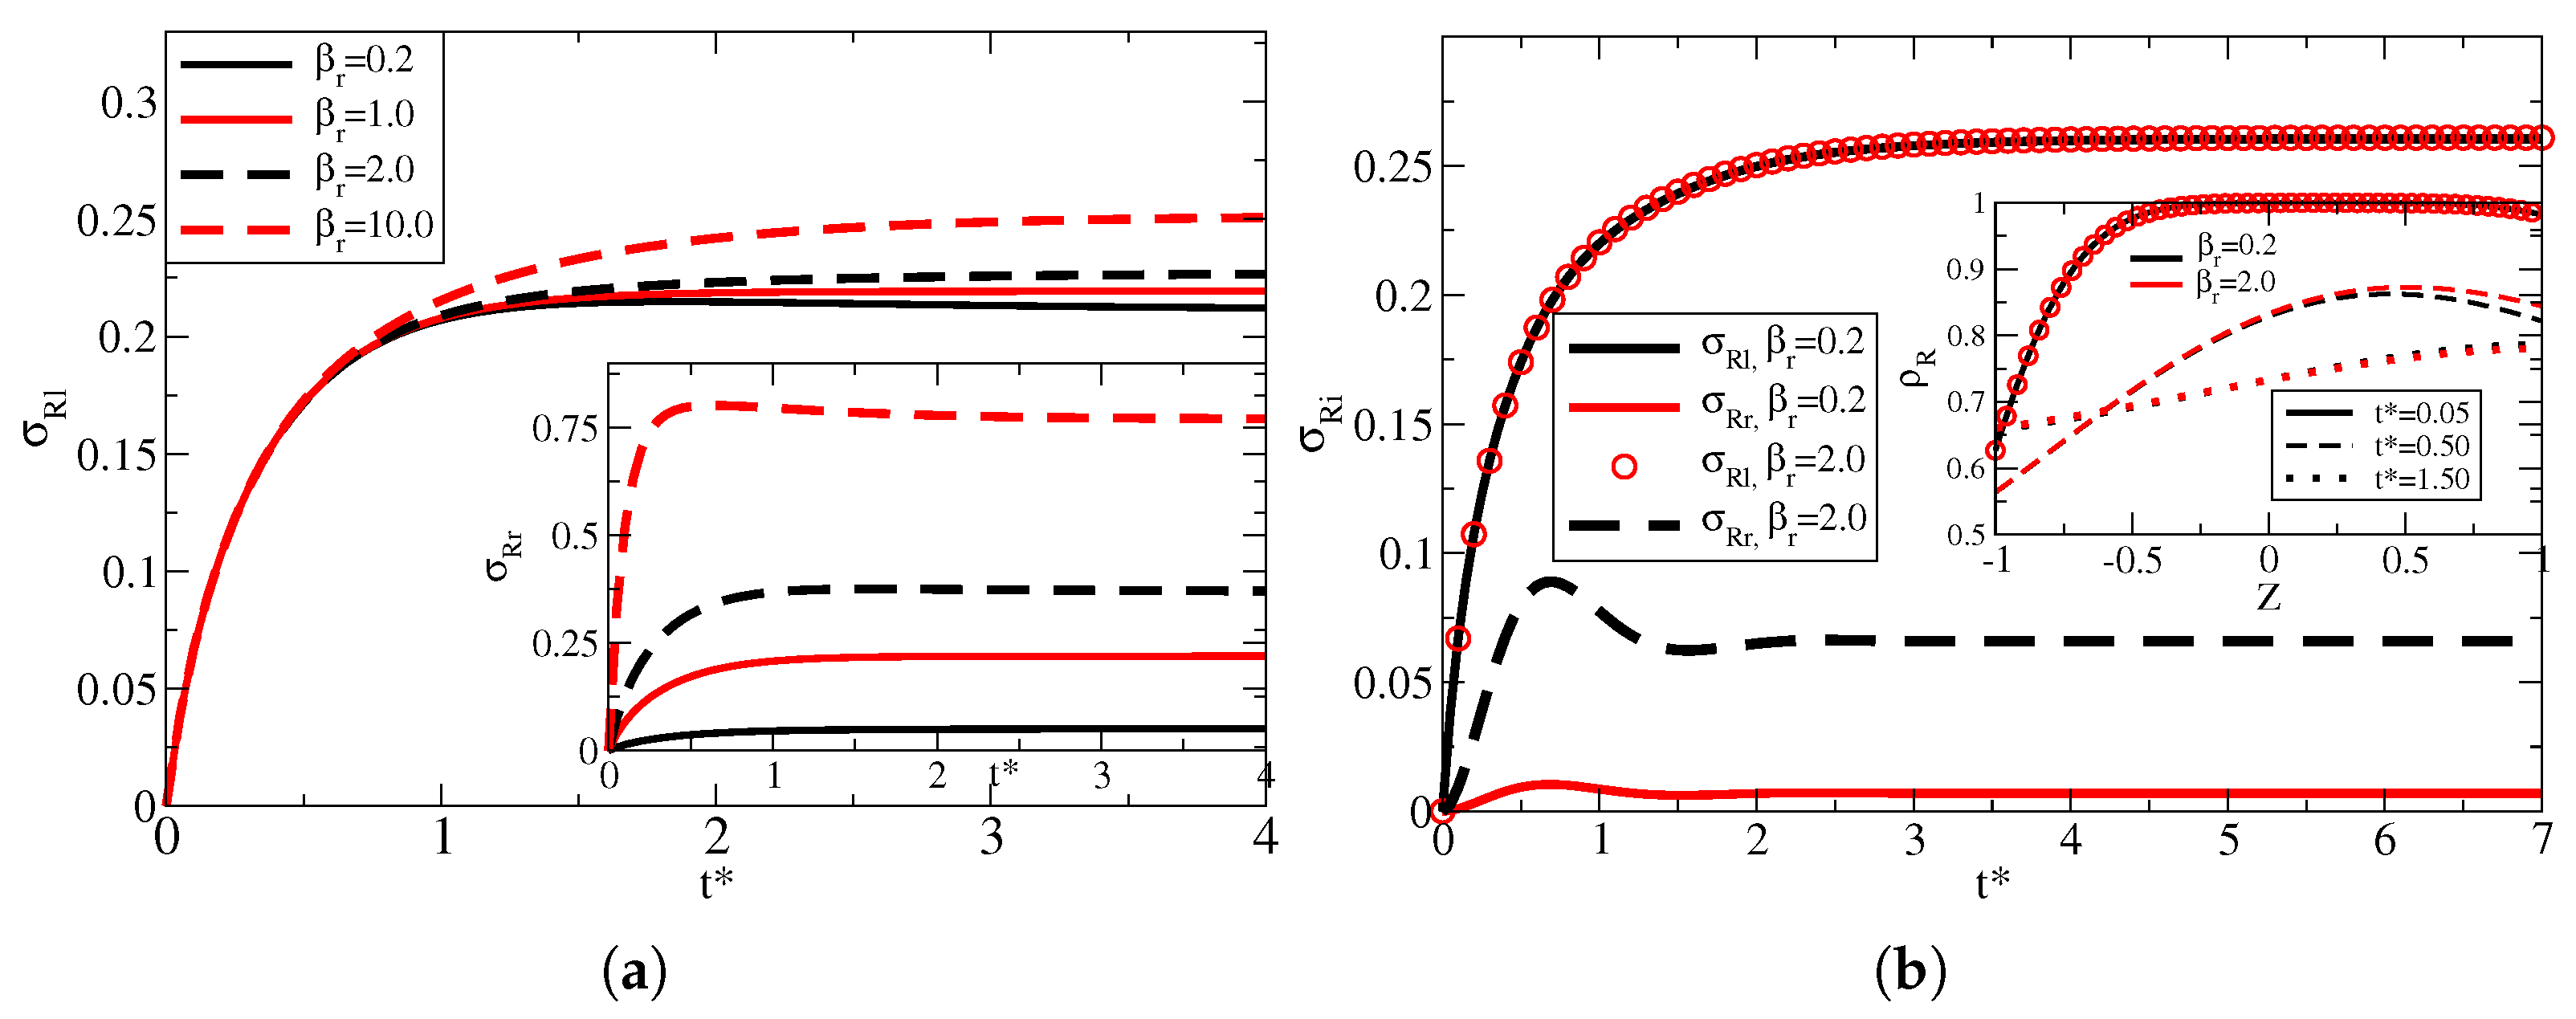
We now start investigating the cases in which the surfaces are not identical. This is particularly interesting because one can see how one surface affects the other and the bulk distribution. Moreover, it is helpful to understand the effect of β on such distributions if the substrates are seen individually. For our study, we fixed the left substrate ( Z = 1 ) with the following parameters: β l = 1.0 , τ κ l / τ l = 1 and τ a l / τ l = 0.01 . Furthermore, we kept the diffusion time the same for all the analyses, that is, τ D / τ l = 10.0 .
Figure 3a shows a case in which all the parameters are the same for both substrates, except the parameter β . We chose τ D / τ i = 10.0 , τ κ i / τ i = 1.0 , τ a i / τ i = 1.0 , β l = 1.0 , and varied β r . The substrate on the left side (parameters are always the same) is shown in the main figure, while the inset shows the substrate in Z = 1 . As β r gets larger, the coverage in Z = 1 grows, which is expected since larger β represents more particles to be adsorbed compared with the number of sites on that specific surface. The left-side surface also saturates at higher concentration values when the parameter β of the right-side surface increases. Since the right side has fewer sites for adsorption (as β increases), the left-side surface has more particles to adsorb, since β l = 1.0 . This trend can also be understood by Equation (9). If β r = 0.2 , σ R l = 1 5 σ R r bulk / 2 , whereas for β r = 10.0 , σ R l = 1 0.1 σ R r bulk / 2 , where “bulk” stands for the final concentration in the bulk. Since the number of particles in bulk is never larger than 1, σ R l saturates at higher values as β r increases. In Figure 3b, we keep the surface in Z = 1 with the same parameters as in Figure 3a but used the parameters τ κ r / τ r = 10 , τ a r / τ r = 20 and β r = 0.2 and β r = 2.0 . Notice that the adsorption time is ten times larger than the desorption time, so the overall coverage is low for the right surface. In this case, changing β r does not affect the left surface. Thus, for β r = 0.2 , the surface has five times more sites than particles available, and the resulting coverage is small. If β r = 2.0 , the right surface has room for only half of the particles, so the coverage is higher. Moreover, since the memory time is longer, the right surface displays oscillations in the adsorption–desorption process. The inset shows the bulk density for three different times, where the black curves represent β r = 0.2 and the red curves β r = 2.0 . In the initial moments, both cases are identical. As time passes, for t * = 0.5 , the bulk density near the right surface for β = 2.0 is slightly higher because the right surface has fewer sites to adsorb, so there is an excess of particles when compared with the case where β r = 0.2 . As time increases, the bulk densities for the two values of β become very similar, being only slightly higher for β r = 0.2 due to the limited capability of the right surface to adsorb the particles.
To demonstrate that a larger β represents a lower overall density of particles compared with lower β cases, in Figure 4, we show the density of adsorbed particles for both surfaces normalized by their respective β . For this figure, we used the same parameters for the left surface as in Figure 3. For the right surface, we used τ κ r / τ r = 0.01 and τ a r / τ r = 0.01 , so the right surface has a high adsorption rate and neglectable memory effects. As expected, for both β r = 0.2 and β r = 2.0 , the right surface reaches higher coverage values when compared with the left side, which is a consequence of the high adsorption rate. However, when β r = 2.0 , both surfaces reach the equilibrium (the left coverage is still slowly decreasing for t * = 3.5 ) much more quickly when compared with β r = 0.2 , which is due to the quick filling of the available sites when β r = 2.0 . On the other hand, for β r = 0.2 , the system is still evolving (filling the adsorption sites) when t * = 3.5 . Figure 4 clearly shows that the equilibrium point depends on the number of available sites rather than just adsorption and desorption rates. The inset of Figure 4 shows the bulk dynamics three different times for both values of β . Initially, when most particles are still in bulk, the distribution for both cases is the same. For t * = 1.0 , the distribution near the left side is the same, whereas, near the right surface, the bulk distribution is lower for β r = 0.2 when compared with β r = 2.0 . As the system continues evolving, the case for β r = 2.0 quickly reaches an equilibrium value, which is larger when compared with β r = 0.2 , where even for t * = 5.0 , the bulk distribution is still not at equilibrium (which is also seen from the surface curves).
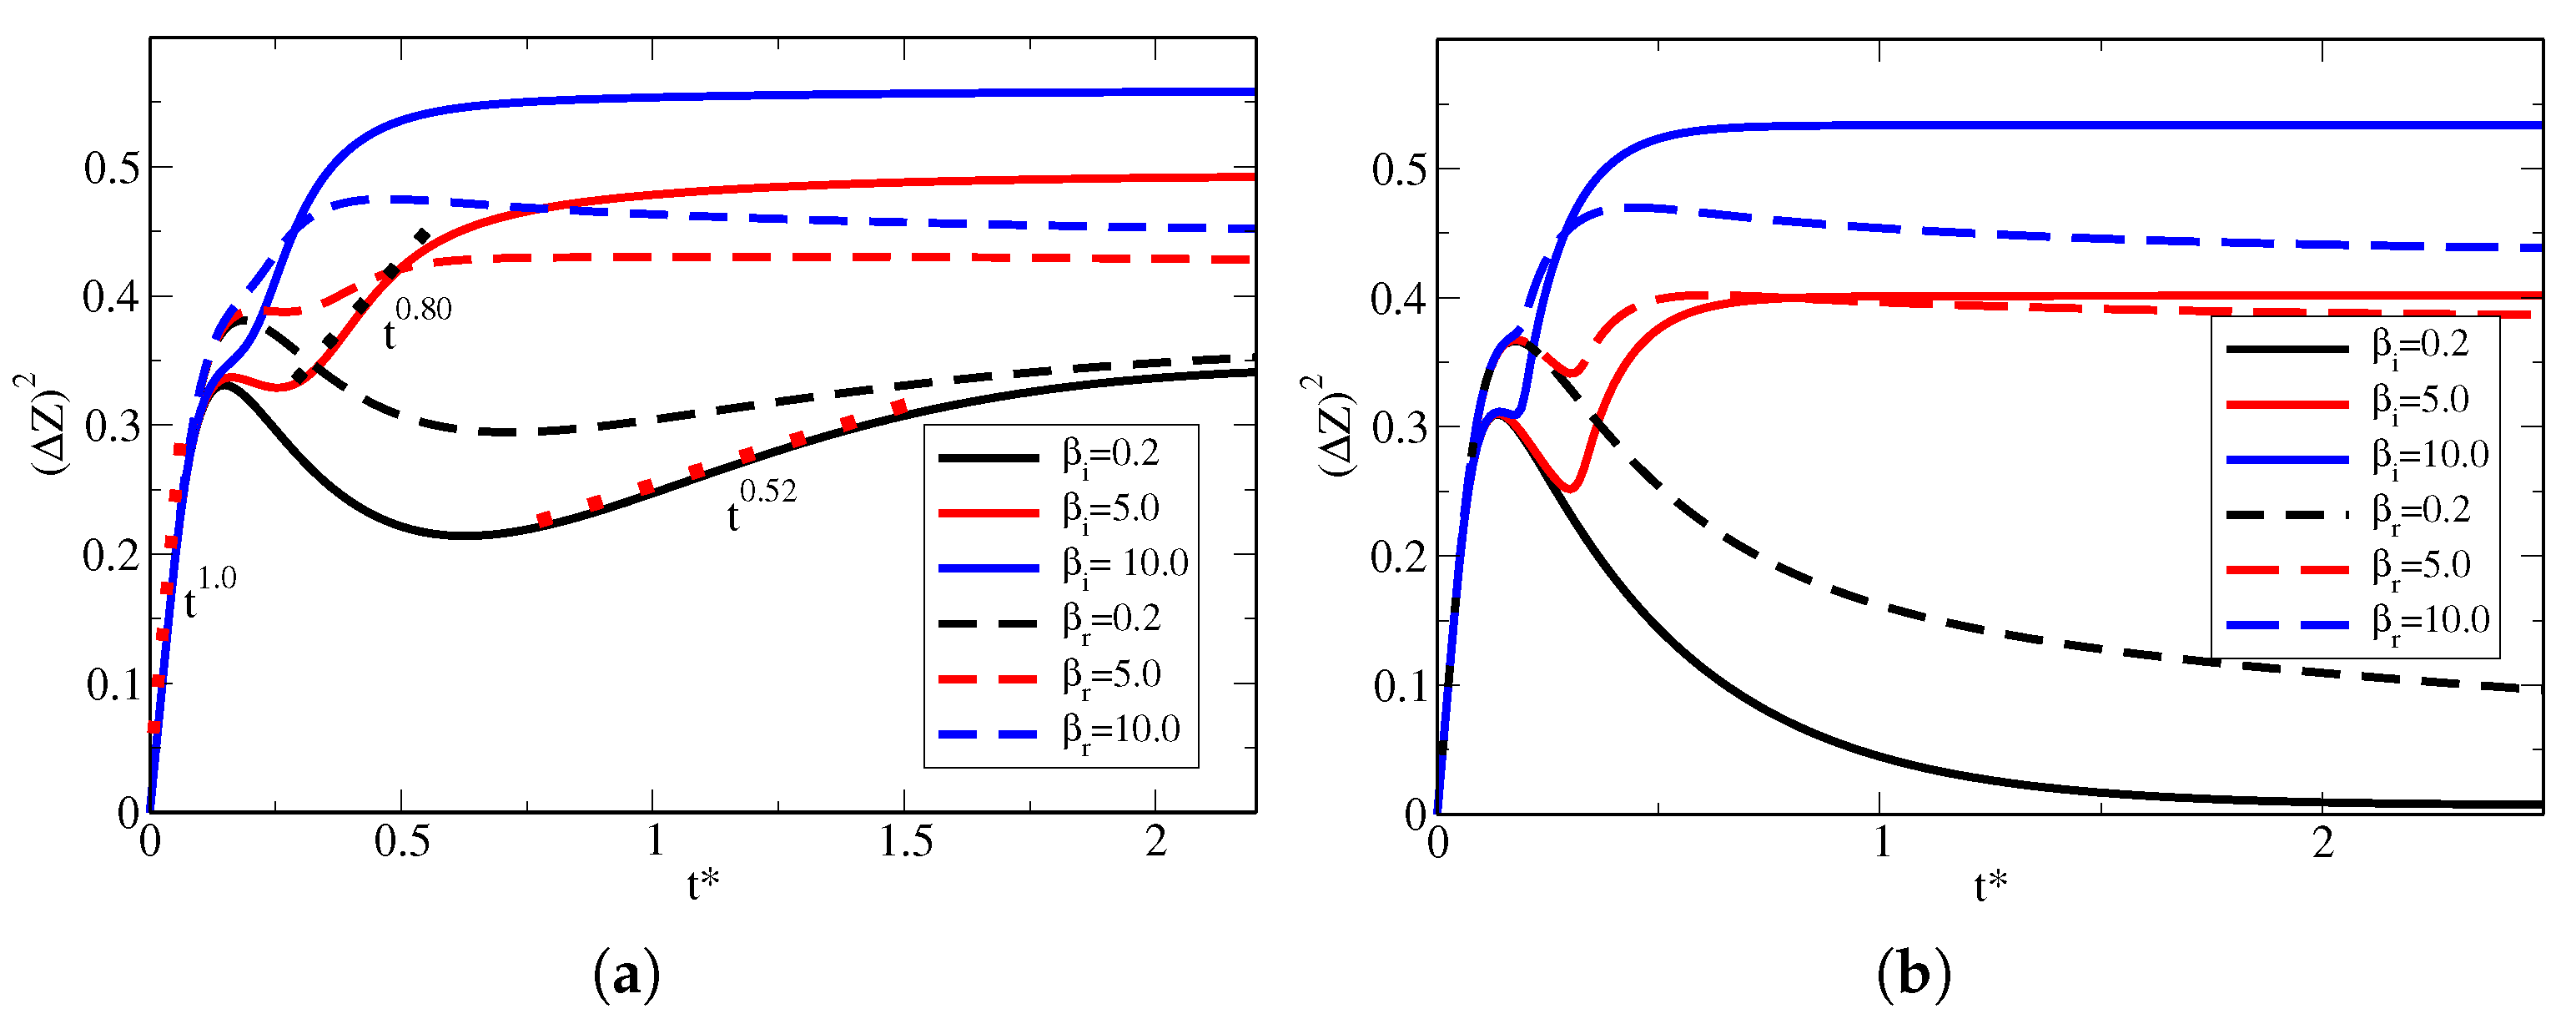
Now, we use the mean square displacement (MSD) to probe how the diffusive regimes affect the number of sites at the surfaces. This is an important parameter because it is related to the spreading of particles across the cell, which characterizes the time-dependent diffusion coefficient, D ( t ) . Thus, we are now interested in understanding how the number of sites, hence the parameter β , changes the way particles diffuse in bulk. Indeed, it is known that limiting surfaces may affect how particles diffuse in the bulk [24], which is of particular importance mainly for transport in living cells [39,40], but in general, the number of sites is neglected during the modeling. The MSD, which takes into account the conservation of particles (bulk distribution does not remain normalized at all times as particles leave the volume to be adsorbed at the walls), as in Equation (9), is given by ( Δ Z ) 2 = Z Z 2 = Z 2 2 σ Z 2 . In other words, the MSD is calculated as:
( Δ Z ) 2 = 1 1 Z 2 ρ ¯ ( Z , t * ) d Z 2 σ R i ( t * ) / β i 1 1 Z ρ ¯ ( Z , t * ) d Z 2 .
In Figure 5, shows the MSD vs. time for different values of the parameter β for the situations in which the surfaces are identical and the case where the surfaces are non-identical. For all cases, we used τ D / τ l = 100 . For the case of identical surfaces, depicted by the solid lines, we used τ k / τ = 1 and τ a / τ = 20 . Notice that when the MSD increases with time, the bulk distribution is spreading up, while MSD decreasing with time means that the distribution is shrinking; that is, particles are returning to the bulk. We first notice that for all the curves, the initial behavior of the MSD is equal, which corresponds to the initial spreading of particles from the center of the cell toward the surfaces. This initial diffusing process is not affected by the surfaces and corresponds to the usual diffusion that occurs for boundless samples. The black solid line represents β i = 0.2 , while the solid red line shows β i = 5.0 , and the solid blue curve depicts the case β i = 10.0 . For β i = 0.2 , after the initial free diffusion, the MSD decreases until t * 0.6 . This is a consequence of the desorption process that takes place together with the adsorption process ( τ κ = τ ), which is favored by the small number of particles remaining in bulk. After this minimum occurs for the MSD, the adsorption process continues, favored by the larger number of sites compared with particles in bulk, until an equilibrium is reached. For β i = 5.0 , this minimum happens much faster and is much less pronounced. At the same time, for β i = 10.0 , it does not appear at all, which is a consequence of a large number of particles compared with the available sites, resulting in a much weaker desorption process of the high particle concentration in bulk at all times. The dashed lines in Figure 5a represent the same values of the parameter β but for non-identical walls. Here, the right surface is the same as used to produce the solid curves, only β r is changed, but the left surface is fixed at β l = 1.0 , τ κ l / τ l = 1 and τ a l / τ l = 0.01 . Interestingly, the bulk dynamic is also affected by the non-identical surface, not only by changing how the spreading and shrinking of the distribution occurs but also by changing the overall amount of particles to reach equilibrium in bulk, a direct consequence of the ratio between the number of particles and number of sites.
Figure 5b shows the cases in which τ κ / τ = 0.01 , when the surfaces are identical, and for the right surface ( Z = 1 ) in the case of non-identical surfaces. The left surface for non-identical surfaces remains the same as Figure 5a. Here, since the rate of adsorption is much larger than the rate of desorption, it is expected that the surface quickly adsorbs most of the particles, leaving the bulk with a low concentration. This is true for β = 0.2 , where the MSD is nearly zero for t * 2 , meaning that the distribution continuously decreases where most of the particles are trapped at the surfaces. However, as the number of particles increases when compared with the number of available sites, this is no longer true, which significantly affects how diffusion takes place in the bulk, indicating that indeed the parameter β is essential, rather than just looking at the rates of adsorption and desorption as usually performed. This is true for both identical and non-identical cases.
Figure 5b shows the cases in which τ κ / τ = 0.01 , when the surfaces are identical, and for the right surface ( Z = 1 ) in the case of non-identical surfaces. The left surface for non-identical surfaces remains the same as Figure 5a. Here, since the rate of adsorption is much larger than the rate of desorption, it is expected that the surface quickly adsorbs most of the particles, leaving the bulk with a low concentration. This is true for β = 0.2 , where the MSD is nearly zero for t * 2 , meaning that the distribution continuously decreases, where most of the particles are trapped at the surfaces. However, as the number of particles increases when compared with the number of available sites, this is no longer true, which significantly affects how diffusion takes place in the bulk, indicating that indeed the parameter β is essential, rather than just looking at the rates of adsorption and desorption as usually performed. This is true for both identical and non-identical cases. Notice how the dynamics of the MSD closely resemble the data observed for the diffusive characteristics observed in some systems that are essentially anomalous and with limited amount of adsorption sites to diffusing particles, such as in living cells [41] and in the diffusion of gold-labeled dioleoylPE in the plasma membrane of fetal rat skin keratinocyte cells [39].
Finally, noticing how the diffusive regimes change with the parameter β is interesting. Accordingly, ( Δ Z ) 2 t * a , where the power a is related to how particles diffuse, that is, if a < 1 , the diffusive regime is said to be subdiffusive, if a = 1 , it is called usual, whereas for a > 1 , the diffusive regime is called superdiffusive. Usually, confined systems are subjected to adsorption–desorption phenomena. However, the ratio β is not considered when studying the diffusive regime. We observe that in the initial moments before particles reach the surfaces, the diffusion is usual, that is, a = 1 . Nonetheless, after interacting with the surfaces, the diffusion becomes essentially subdiffusive and is heavily affected by the parameter β . In Figure 5a, we show, as dotted lines, a few examples of exponents a for certain time intervals in which the distribution spreads after a quick desorption process. For example, for β = 0.2 , a = 0.52 , while for β = 5.0 , a = 0.80 , indicating that β changes the diffusion regime. As it is well-known, molecular crowding is one source of anomalous diffusion, especially in biological fluids [42], which, within this model, may be altered by changing the parameter β . This fact shall be further explored in future studies.
In conclusion, we modeled a system composed of an isotropic liquid limited by adsorbing surfaces where particles diffuse and may be adsorbed/desorbed following the complete Langmuir’s kinetic equation. In the modeling process, we incorporated, in addition to the natural parameters arising from the Langmuir kinetic equation such as the ratios of adsorption, desorption, and number of available sites, memory effects that may occur depending on the inherent nature of adsorbing walls, such as occurring during chemisorption, physisorption, or a mixed process. We scaled all the variables in terms of characteristic times of the system and kept as main parameter the ratio between the available sites to the amount of particles in the bulk. It turns out that not only the dynamics but the diffusive regimes are heavily affected by such ratio, which is often neglected during adsorption dynamics. We hope our results may be helpful in describing separation processes and other systems, such as in living mater, where the limited amount of adsorption sites plays a crucial role.

Author Contributions

Conceptualization, E.K.O., E.K.L., L.R.E. and R.S.Z.; methodology, R.F.d.S., R.R.R.d.A., R.T.d.S. and R.S.Z.; validation, R.F.d.S., R.R.R.d.A., E.K.O., R.T.d.S., E.K.L., L.R.E. and R.S.Z.; formal analysis, R.F.d.S., E.K.L., L.R.E. and R.S.Z.; investigation, R.F.d.S., R.R.R.d.A., E.K.O., R.T.d.S., E.K.L., L.R.E. and R.S.Z.; writing—original draft preparation, R.F.d.S., E.K.O. and R.S.Z.; writing—review and editing, R.F.d.S., R.R.R.d.A., E.K.O., R.T.d.S., E.K.L., L.R.E. and R.S.Z. All authors have read and agreed to the published version of the manuscript.

Funding

This work was partially supported by the National Institutes of Science and Technology of Complex Fluids—INCT-CF (R.S.Z.) and Complex Systems—INCT-SC (E.K.L.). E.K.L. thanks CNPq process number (302983/2018-0). R.S.Z. thanks CNPq process number (304634/2020-4). R. F. de Souza thanks Financiadora de Estudos e Projetos (FINEP)—process number 0113032700.

Institutional Review Board Statement

Not applicable.

Informed Consent Statement

Not applicable.

Data Availability Statement

Not applicable.

Acknowledgments

Research developed with the support of LAMAP—UTFPR.

Conflicts of Interest

The authors declare no conflict of interest.

Appendix A. Table of Symbols

Here we present a table summarizing the main quantities used in this article (Table A1).
Table A1. Table of Symbols.
SymbolDefinition
ρ ( z , t ) Bulk density of diffusing particles. It is a function of space ( z ) and time ( t )
σ (t)Density of adsorbed particles. It is a function of time (t)
DDiffusion coefficient
LCell thickness
ρ 0 Total density of particles
κ a Rate of adsorption
κ d Rate of desorption
ρ R = ρ / ρ 0 Reduced bulk density
σ 0 Number of available sites
σ R = σ / σ 0 Reduced surface density
τ D = d 2 / D Diffusion time
τ κ = d / 2 κ a Adsorption time
τ = 1 / κ d Desorption time
τ a Memory time
t * = 4 t / τ D Dimensionless time
( Δ Z ) 2 Mean Square Displacement
β = ρ 0 L / σ 0 Ratio of particles in the bulk to the number of available sites
Subscript iMay be l (left) or r (right). Indicates the substrate considered.

References

  1. Li, J.R.; Kuppler, R.J.; Zhou, H.C. Selective gas adsorption and separation in metal–organic frameworks. Chem. Soc. Rev. 2009, 38, 1477–1504. [Google Scholar] [CrossRef] [PubMed]
  2. Adamson, A.; Gast, A. Physical Chemistry of Surfaces; Wiley: Hoboken, NJ, USA, 1997. [Google Scholar]
  3. Barbero, G.; Evangelista, L.R. Adsorption Phenomena and Anchoring Energy in Nematic Liquid Crystals; CRC Press: Boca Raton, FL, USA, 2005. [Google Scholar]
  4. Perlmutter, S.H.; Doroski, D.; Moddel, G. Degradation of liquid crystal device performance due to selective adsorption of ions. Appl. Phys. Lett. 1996, 69, 1182–1184. [Google Scholar] [CrossRef]
  5. Zhang, M.; Soto-Rodríguez, J.; Chen, I.C.; Akbulut, M. Adsorption and removal dynamics of polymeric micellar nanocarriers loaded with a therapeutic agent on silica surfaces. Soft Matter 2013, 9, 10155–10164. [Google Scholar] [CrossRef]
  6. Yaseen, M.; Salacinski, H.J.; Seifalian, A.M.; Lu, J.R. Dynamic protein adsorption at the polyurethane copolymer/water interface. Biomed. Mater. 2008, 3, 034123. [Google Scholar] [CrossRef] [PubMed]
  7. Patrick, N.; Youssef, B.; Burd, S.D.; Cairns, A.J.; Ryan, L.; Katherine, F.; Tony, P.; Shengqian, M.; Brian, S.; Lukasz, W.; et al. Porous materials with optimal adsorption thermodynamics and kinetics for CO2 separation. Nature 2013, 495, 80. [Google Scholar] [CrossRef]
  8. Langmuir, I. The Adsorption of Gases on Plane Surfaces of Glass, Mica and Platinum. J. Am. Chem. Soc. 1918, 40, 1361–1403. [Google Scholar] [CrossRef] [Green Version]
  9. Kuan, W.H.; Lo, S.L.; Chang, C.M.; Wang, M.K. A geometric approach to determine adsorption and desorption kinetic constants. Chemosphere 2000, 41, 1741–1747. [Google Scholar] [CrossRef] [PubMed]
  10. Swenson, H.; Stadie, N.P. Langmuir’s Theory of Adsorption: A Centennial Review. Langmuir 2019, 35, 5409–5426. [Google Scholar] [CrossRef] [Green Version]
  11. Arfken, G.; Weber, H.; Harris, F. Mathematical Methods for Physicists: A Comprehensive Guide; Elsevier Science: Amsterdam, The Netherlands, 2013. [Google Scholar]
  12. Bénichou, O.; Grebenkov, D.; Levitz, P.; Loverdo, C.; Voituriez, R. Optimal Reaction Time for Surface-Mediated Diffusion. Phys. Rev. Lett. 2010, 105, 150606. [Google Scholar] [CrossRef]
  13. Levesque, M.; Bénichou, O.; Voituriez, R.; Rotenberg, B. Taylor dispersion with adsorption and desorption. Phys. Rev. E 2012, 86, 036316. [Google Scholar] [CrossRef]
  14. Simonin, J.P. On the comparison of pseudo-first order and pseudo-second order rate laws in the modeling of adsorption kinetics. Chem. Eng. J. 2016, 300, 254–263. [Google Scholar] [CrossRef] [Green Version]
  15. Azizian, S. Kinetic models of sorption: A theoretical analysis. J. Colloid Interface Sci. 2004, 276, 47–52. [Google Scholar] [CrossRef] [PubMed]
  16. Ho, Y.; McKay, G. Pseudo-second order model for sorption processes. Process Biochem. 1999, 34, 451–465. [Google Scholar] [CrossRef]
  17. Liu, Y.; Shen, L. From Langmuir Kinetics to First- and Second-Order Rate Equations for Adsorption. Langmuir 2008, 24, 11625–11630. [Google Scholar] [CrossRef]
  18. Salvestrini, S. A modification of the Langmuir rate equation for diffusion-controlled adsorption kinetics. React. Kinet. Mech. Catal. 2019, 128, 571–586. [Google Scholar] [CrossRef]
  19. Barbero, G.; Evangelista, L.R. Adsorption phenomenon of neutral particles and a kinetic equation at the interface. Phys. Rev. E 2004, 70, 031605. [Google Scholar] [CrossRef] [Green Version]
  20. Levesque, M.; Bénichou, O.; Rotenberg, B. Molecular diffusion between walls with adsorption and desorption. J. Chem. Phys. 2013, 138, 034107. [Google Scholar] [CrossRef] [Green Version]
  21. Zola, R.S.; Lenzi, E.K.; Evangelista, L.R.; Barbero, G. Memory effect in the adsorption phenomena of neutral particles. Phys. Rev. E 2007, 75, 042601. [Google Scholar] [CrossRef]
  22. Zola, R.; Freire, F.; Lenzi, E.; Evangelista, L.; Barbero, G. Kinetic equation with memory effect for adsorption–desorption phenomena. Chem. Phys. Lett. 2007, 438, 144–147. [Google Scholar] [CrossRef]
  23. Guimarães, V.G.; Ribeiro, H.V.; Li, Q.; Evangelista, L.R.; Lenzi, E.K.; Zola, R.S. Unusual diffusing regimes caused by different adsorbing surfaces. Soft Matter 2015, 11, 1658–1666. [Google Scholar] [CrossRef]
  24. Recanello, M.; Lenzi, E.; Martins, A.; Li, Q.; Zola, R. Extended adsorbing surface reach and memory effects on the diffusive behavior of particles in confined systems. Int. J. Heat Mass Transf. 2020, 151, 119433. [Google Scholar] [CrossRef]
  25. Fernandes, M.; Lenzi, E.; Evangelista, L.; Li, Q.; Zola, R.; de Souza, R. Diffusion and adsorption-desorption phenomena in confined systems with periodically varying medium. Chem. Eng. Sci. 2021, 233, 116386. [Google Scholar] [CrossRef]
  26. Guimarães, V.G.; Lenzi, E.K.; Evangelista, L.R.; Zola, F.C.; de Souza, R.T.; Zola, R.S. Symmetry breaking in an electrolytic cell under AC field and non-identical adsorbing electrodes. J. Electroanal. Chem. 2017, 789, 44–49. [Google Scholar] [CrossRef]
  27. Hilfer, R. Applications of Fractional Calculus in Physics; World Scientific Publishing Company: Singapore, 2000. [Google Scholar]
  28. Glöckle, W.G.; Nonnenmacher, T.F. Fractional relaxation and the time-temperature superposition principle. Rheol. Acta 1994, 33, 337–343. [Google Scholar] [CrossRef]
  29. Li, X.; Shaw, R.; Evans, G.M.; Stevenson, P. A simple numerical solution to the Ward–Tordai equation for the adsorption of non-ionic surfactants. Comput. Chem. Eng. 2010, 34, 146–153. [Google Scholar] [CrossRef]
  30. Liggieri, L.; Ravera, F.; Passerone, A. A diffusion-based approach to mixed adsorption kinetics. Colloids Surf. A Physicochem. Eng. Asp. 1996, 114, 351–359. [Google Scholar] [CrossRef]
  31. Mazumder, S. Numerical Methods for Partial Differential Equations: Finite Difference and Finite Volume Methods; Elsevier Science: Amsterdam, The Netherlands, 2016. [Google Scholar]
  32. Galassi, M.; Gough, B. GNU Scientific Library: Reference Manual; GNU Manual; Network Theory: London, UK, 2009. [Google Scholar]
  33. Maximus, B.; Ley, E.D.; Meyere, A.D.; Pauwels, H. Ion transport in SSFLCD’s. Ferroelectrics 1991, 121, 103–112. [Google Scholar] [CrossRef]
  34. López-González, B.; Dector, A.; Cuevas-Muñiz, F.; Arjona, N.; Cruz-Madrid, C.; Arana-Cuenca, A.; Guerra-Balcázar, M.; Arriaga, L.; Ledesma-García, J. Hybrid microfluidic fuel cell based on Laccase/C and AuAg/C electrodes. Biosens. Bioelectron. 2014, 62, 221–226. [Google Scholar] [CrossRef]
  35. Sparavigna, A.; Lavrentovich, O.D.; Strigazzi, A. Periodic stripe domains and hybrid-alignment regime in nematic liquid crystals: Threshold analysis. Phys. Rev. E 1994, 49, 1344–1352. [Google Scholar] [CrossRef] [Green Version]
  36. Zola, R.S.; Evangelista, L.R.; Yang, Y.C.; Yang, D.K. Surface Induced Phase Separation and Pattern Formation at the Isotropic Interface in Chiral Nematic Liquid Crystals. Phys. Rev. Lett. 2013, 110, 057801. [Google Scholar] [CrossRef]
  37. Kuksenok, O.V.; Shiyanovskii, S.V. Surface Control of Dye Adsorption in Liquid Crystals. Mol. Cryst. Liq. Cryst. Sci. Technol. Sect. A Mol. Cryst. Liq. Cryst. 2001, 359, 107–118. [Google Scholar] [CrossRef]
  38. Linse, P. Effect of solvent quality on the polymer adsorption from bulk solution onto planar surfaces. Soft Matter 2012, 8, 5140–5150. [Google Scholar] [CrossRef]
  39. Kotono, M.; Takahiro, F.; Yasuhiro, U.; Kenichi, S.; Ryota, I.; Hidetoshi, Y.; Mihoko, S.; Hideji, M.; Ken, R.; Akihiro, K. Ultrafine Membrane Compartments for Molecular Diffusion as Revealed by Single Molecule Techniques. Biophys. J. 2004, 86, 4075–4093. [Google Scholar] [CrossRef] [Green Version]
  40. Chipot, C.; Comer, J. Subdiffusion in Membrane Permeation of Small Molecules. Sci. Rep. 2016, 6, 35913. [Google Scholar] [CrossRef] [PubMed] [Green Version]
  41. Spiechowicz, J.; Łuczka, J. Subdiffusion via dynamical localization induced by thermal equilibrium fluctuations. Sci. Rep. 2017, 7, 16451. [Google Scholar] [CrossRef] [Green Version]
  42. Höfling, F.; Franosch, T. Anomalous transport in the crowded world of biological cells. Rep. Prog. Phys. 2013, 76, 046602. [Google Scholar] [CrossRef]
Figure 1. System studied in this work. It consists of a liquid with diluted neutral particles (diffusing particles) that diffuse in the z direction and may be adsorbed (desorbed) following Langmuir’s equation. Notice that the left surface is located at z = L / 2 , while the right surface is at Z = L / 2 . Gray spheres represent occupied sites on the surfaces, while green spheres represent free adsorption sites.
Physchem 03 00001 g001
Figure 2. Role played by the parameter β = ρ 0 d / σ 0 on the surface dynamics. (a) shows the left surface ( Z = 1 ) vs. t * for τ D / τ l = 100 , τ κ l / τ l = 10 and for two values of τ a l / τ l , that is, 0.1 or 20 and β = 0.2 and β = 2 . The inset shows the bulk density ρ R vs. Z when t * = 0.6 for β = 2 (in red) and β = 0.2 (black). (b) shows the left surface ( Z = 1 ) vs. t * for τ D / τ l = 100 , τ κ l / τ l = 1 , and τ a l / τ l =0.1 for several values of the parameter β .
Physchem 03 00001 g002
Figure 3. Effect of β on non-identical surfaces. For both figures, the left surface uses β l = 1.0 , τ κ l / τ l = 1 and τ a l / τ l = 0.01 , and the diffusion time is τ a l / τ l = 0.01 . In (a), all the characteristic times of the surface at Z = 1 are the same as the surface at Z = 1 , except the parameter β r . The main figure shows the time evolution of σ R l , while the inset shows σ R r . In (b), the left surface uses the same parameters as in (a), but the right surfaces uses τ κ r / τ r = 10 , τ a r / τ r = 20 for β r = 0.2 and β r = 2.0 . Both surface dynamics are plotted against t * in the main figure, while the inset shows the bulk distribution for three different values of t * and both values of β r .
Physchem 03 00001 g003
Figure 4. σ R i / β i for two different values of β r . The left surface uses the same parameters as used in Figure 3, while the surface at Z = 1 uses τ κ r / τ r = 0.01 and τ a r / τ r = 0.01 . From this figure, it becomes clear that increasing the β of a single surface changes the behavior of the opposite surface and that larger values of β mean higher coverage but a smaller overall number of adsorbed particles. The inset shows the bulk distribution for three different values of t * and for β r = 0.2 and β r = 2.0 .
Physchem 03 00001 g004
Figure 5. Mean square displacement (MSD) vs. t * for several values of β . The solid curves represent the case in which both surfaces are equal, while the dashed curves represent the MSD for the Z = 1 surface in the case of non-equal surfaces. (a) shows the case in which τ κ i / τ i = 1 , while (b) shows the case in which τ κ i / τ i = 0.01 (identical surfaces and right surface for the non-identical case). The dotted lines in (a) show examples of the exponent ( t a ) of the MSD, indicating the subdiffusive behavior of the system.
Physchem 03 00001 g005
Disclaimer/Publisher’s Note: The statements, opinions and data contained in all publications are solely those of the individual author(s) and contributor(s) and not of MDPI and/or the editor(s). MDPI and/or the editor(s) disclaim responsibility for any injury to people or property resulting from any ideas, methods, instructions or products referred to in the content.

