
Effect of Air Annealing on the Structural, Textural, Magnetic, Thermal and Luminescence Properties of Cerium Fluoride Nanoparticles

 , , and
Abstract
1. Introduction
2. Results and Discussion
3. Conclusions
4. Experimental Section
4.1. Materials
4.2. Characterization
Author Contributions
Funding
Institutional Review Board Statement
Informed Consent Statement
Conflicts of Interest
References
- Ackland, K.; Coey, J.M.D. Room temperature magnetism in CeO2—A review. Phys. Rep. 2018, 746, 1–39. [Google Scholar] [CrossRef]
- Soni, S.; Kumar, S.; Vats, V.S.; Khakhal, H.R.; Dalela, B.; Dolia, S.N.; Kumar, S.; Alvi, P.A.; Dalela, S. Oxygen vacancies and defects induced room temperature ferromagnetic properties of pure and Fe-doped CeO2 nanomaterials investigated using X-ray photoelectron spectroscopy. J. Electron Spectrosc. Relat. Phenom. 2022, 254, 147140. [Google Scholar] [CrossRef]
- El-Achari, T.; Goumrhar, F.; Drissi, L.B.; Laamara, R.A. Structural, electronic and magnetic properties of Mn doped CeO2: An ab-initio study. Phys. B Condens. Matter 2021, 601, 412443. [Google Scholar] [CrossRef]
- Chernyshev, A.P. Oxygen vacancy concentration in nanoobjects of CeO2−δ: Effects of characteristic size, morphology, and temperature. Mater. Sci. Eng. B 2021, 274, 115481. [Google Scholar] [CrossRef]
- Saifi, M.A.; Seal, S.; Godugu, C. Nanoceria, the versatile nanoparticles: Promising biomedical applications. J. Control. Release 2021, 338, 164–189. [Google Scholar] [CrossRef]
- Nyoka, M.; Choonara, Y.E.; Kumar, P.; Kondiah, P.P.D.; Pillay, V. Synthesis of Cerium Oxide Nanoparticles Using Various Methods: Implications for Biomedical Applications. Nanomaterials 2020, 10, 242. [Google Scholar] [CrossRef]
- Ivanov, V.K.; Shcherbakov, A.B.; Baranchikov, A.E.; Kozik, V.V. Nanocrystalline Cerium Dioxide: Properties, Preparation, Application; Tomsk University Press: Tomsk, Russia, 2013. [Google Scholar]
- Shcherbakov, A.B.; Zholobak, N.M.; Ivanov, V.K. Biological, biomedical and pharmaceutical applications of cerium oxide. In Cerium Oxide (CeO2): Synthesis, Properties and Applications; Metal Oxides Series; Elsevier: Amsterdam, The Netherlands, 2020. [Google Scholar] [CrossRef]
- Shcherbakov, A.B.; Zholobak, N.M.; Baranchikov, A.E.; Ryabova, A.V.; Ivanov, V.K. Cerium fluoride nanoparticles protect cells against oxidative stress. Mater. Sci. Eng. C 2015, 50, 151–159. [Google Scholar] [CrossRef] [PubMed]
- Morozov, O.A.; Pavlov, V.V.; Rakhmatullin, R.M.; Semashko, V.V.; Korableva, S.L. Enhanced Room-Temperature Ferromagnetism in Composite CeO2/CeF3 Nanoparticles. Phys. Status Solidi RRL 2018, 12, 1800318. [Google Scholar] [CrossRef]
- Ilves, V.G.; Sokovnin, S.Y. Production and Studies of Properties of Nanopowderson the Basis of CeO2. Nanotechnol. Russ. 2012, 7, 213–226. [Google Scholar] [CrossRef]
- Ilves, V.G.; Sokovnin, S.Y.; Uimin, M.A. Properties of cerium (III) fluoride nanopowder obtained by pulsed electron beam evaporation. J. Fluor. Chem. 2022, 253, 109921. [Google Scholar] [CrossRef]
- Lu, J.; Xue, Q.; Ouyang, J. Thermal properties and tribological chracterictics of CeF3 compact. Wear 1997, 211, 15–21. Available online: https://www.halide-crylink.com/wp-content/uploads/2020/06/12-Thermal-properties-and-tribological-characteristics-of-CeF-3-compact.pdf (accessed on 24 November 2022). [CrossRef]
- Wang, J.; Ansari, A.A.; Malik, A.; Syed, R.; Ola, M.S.; Kumar, A.; AlGhamdi, K.M.; Khan, S. Highly Water-Soluble Luminescent Silica-Coated Cerium Fluoride Nanoparticles Synthesis, Characterizations, and In Vitro Evaluation of Possible Cytotoxicity. ACS Omega 2020, 5, 19174. [Google Scholar] [CrossRef] [PubMed]
- Chaput, F.; Lerouge, F.; Bulin, A.L.; Amans, D.; Odziomek, M.; Faure, A.C.; Monteil, M.; Dozov, I.; Parola, S.; Bouquet, F.; et al. Liquid-Crystalline Suspensions of Photosensitive Paramagnetic CeF3 Nanodiscs. Langmuir 2019, 35, 16256. [Google Scholar] [CrossRef]
- Dong, H.; Du, S.R.; Zheng, X.Y.; Lyu, G.M.; Sun, L.D.; Li, L.D.; Zhang, P.Z.; Zhang, C.; Yan, C.H. Lanthanide Nanoparticles: From Design toward Bioimaging and Therapy. Chem. Rev. 2015, 115, 10725. [Google Scholar] [CrossRef]
- Bartha, C.; Secu, C.; Matei, E.; Negrila, C.; Leca, A.; Secu, M. Towards a Correlation between Structural, Magnetic and Luminescence Properties of CeF3:Tb3+ Nanocrystals. Materials 2020, 13, 2980. [Google Scholar] [CrossRef]
- Shen, X.; Li, T.; Chen, Z.; Geng, Y.; Xie, X.; Li, S.; Yang, H.; Wu, C.; Liu, Y. Luminescent/magnetic PLGA-based hybrid nanocomposites: A smart nanocarrier system for targeted codelivery and dual-modality imaging in cancer theranostics. Int. J. Nanomed. 2017, 12, 4299–4322. [Google Scholar] [CrossRef]
- Sokovnin, S.Y.; Balezin, M.E. Production of Nanopowders Using Nanosecond Electron Beam. Ferroelectrics 2012, 436, 108–111. [Google Scholar] [CrossRef]
- Ilves, V.G.; Sokovnin, S.Y.; Zuev, M.G.; Uimin, M.A.; Rähn, M.; Kozlova, J.; Sammelselg, V. Effect of annealing on structural, textural, thermal, magnetic, and luminescence properties of calcium fluoride nanoparticles. Phys. Solid State 2019, 61, 2200–2217. [Google Scholar] [CrossRef]
- Mishra, S.; Jeanneau, E.; Bulin, A.L.; Ledoux, G.; Jouguet, B.; Amans, D.; Belsky, A.; Daniele, S.; Dujardin, C. A molecular precursor approach to monodisperse scintillating CeF3 nanocrystals. Dalton Trans. 2013, 42, 12633. [Google Scholar] [CrossRef]
- Snigireva, O.A.; Solomonov, V.I. Role of the Ce2+ ions in cerium fluoride luminescence. Phys. Solid State 2005, 47, 1443–1445. [Google Scholar] [CrossRef]
- Zhu, L.; Li, Q.; Liu, X.; Li, J.; Zhang, Y.; Meng, J.; Cao, X. Morphological Control and Luminescent Properties of CeF3 Nanocrystals. J. Phys. Chem. C 2007, 111, 5898. [Google Scholar] [CrossRef]
- Chylii, M.; Loghina, L.; Kaderavkova, A.; Slang, S.; Rodriguez-Pereira, J.; Frumarova, B.; Vlcek, M. Morphology and optical properties of CeF3 and CeF3:Tb nanocrystals: The dominant role of the reaction thermal mode. Mater. Chem. Phys. 2021, 260, 124161. [Google Scholar] [CrossRef]
- Vivero-Escoto, J.L.; Slowing, I.I.; Trewyn, B.G.; Lin, V.S.-Y. Mesoporous silica nanoparticles for intracellular controlled drug delivery. Small 2010, 6, 1952–1967. [Google Scholar] [CrossRef] [PubMed]


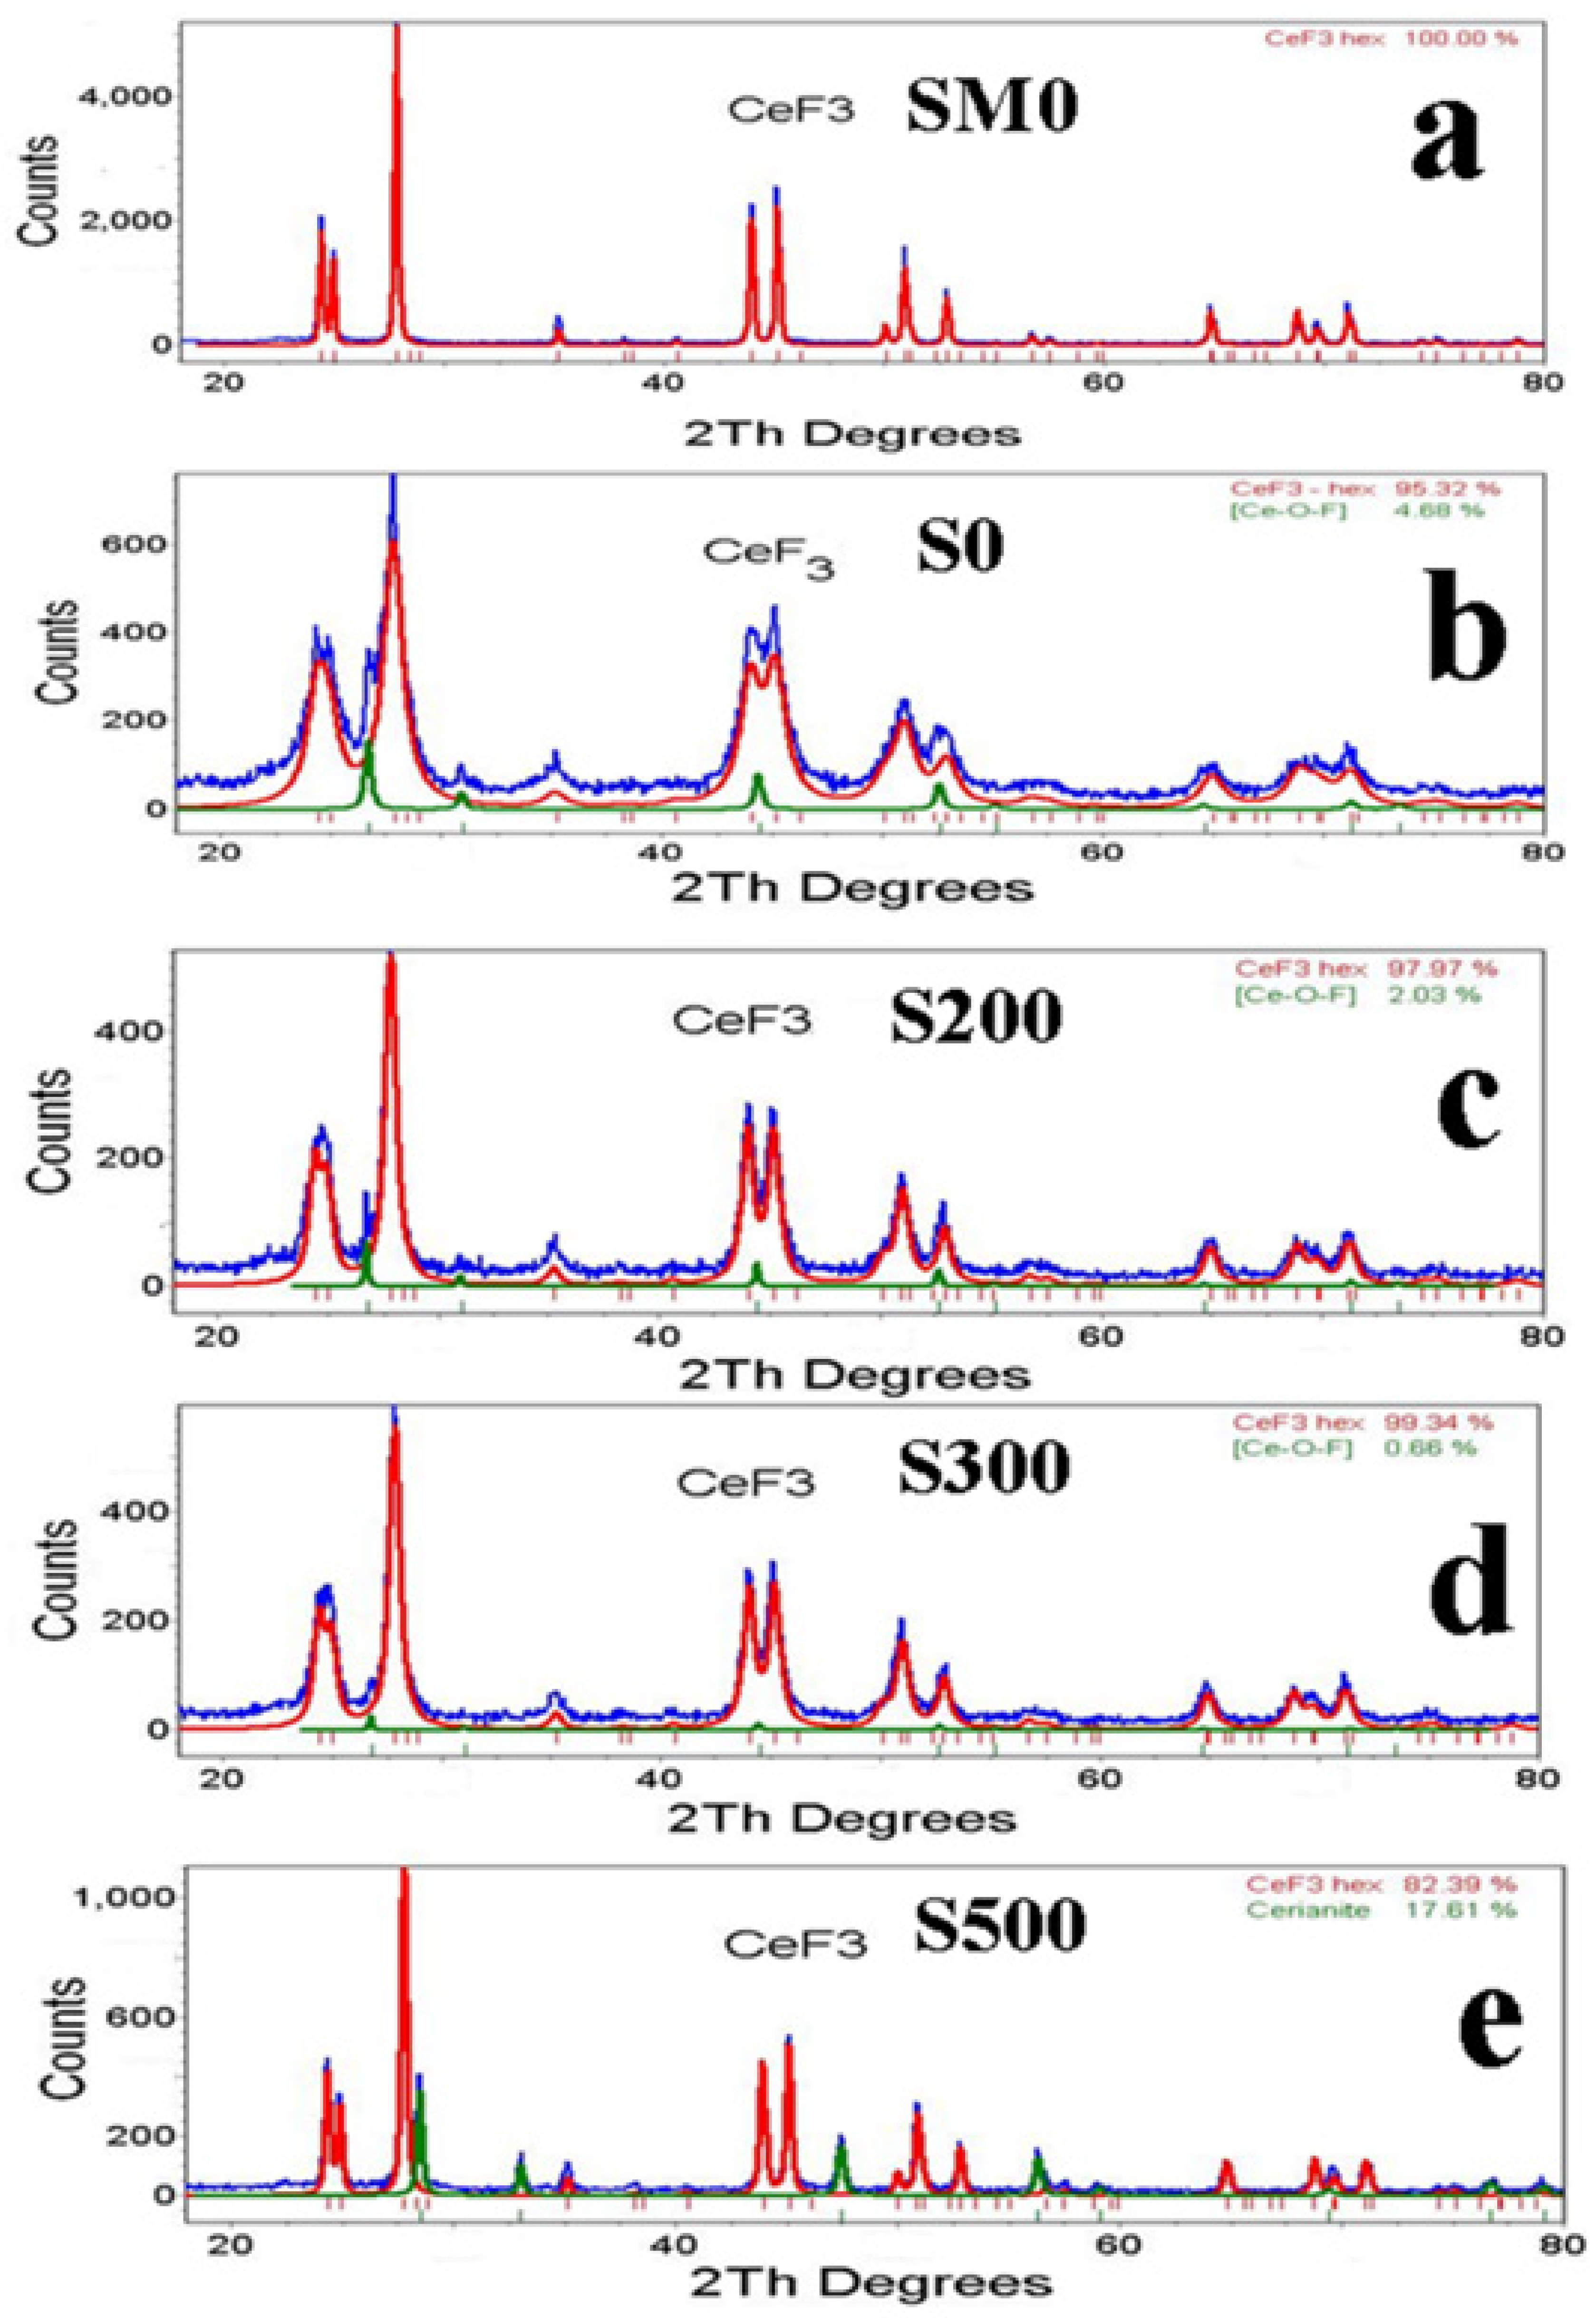
| Sample | CeF3 hex | |||
|---|---|---|---|---|
| Concentration, % * | CSR, nm | Period, Å | ρ, g/cm3 | |
| S200 | ≈98 | 15(2) | a = 7.121(3) c = 7.278(3) | 6144(2) |
| S300 | >99 | 16(2) | a = 7.124(3) c = 7.282(3) | 6136(2) |
| CeF3 | CeO2 | ||||||
|---|---|---|---|---|---|---|---|
| Concentr., % | CSR, nm | Period, Å | ρ, g/cm3 | Concentr.,% | CSR, nm | Period, Å | ρ, g/cm3 |
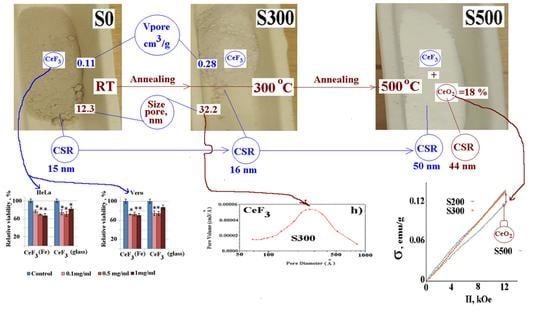
| ≈82 | 50(2) | a = 7.129(3) c = 7.285(3) | 6124(3) | ≈18 | 44(2) | a = 5.411(2) | 7.215(3) |
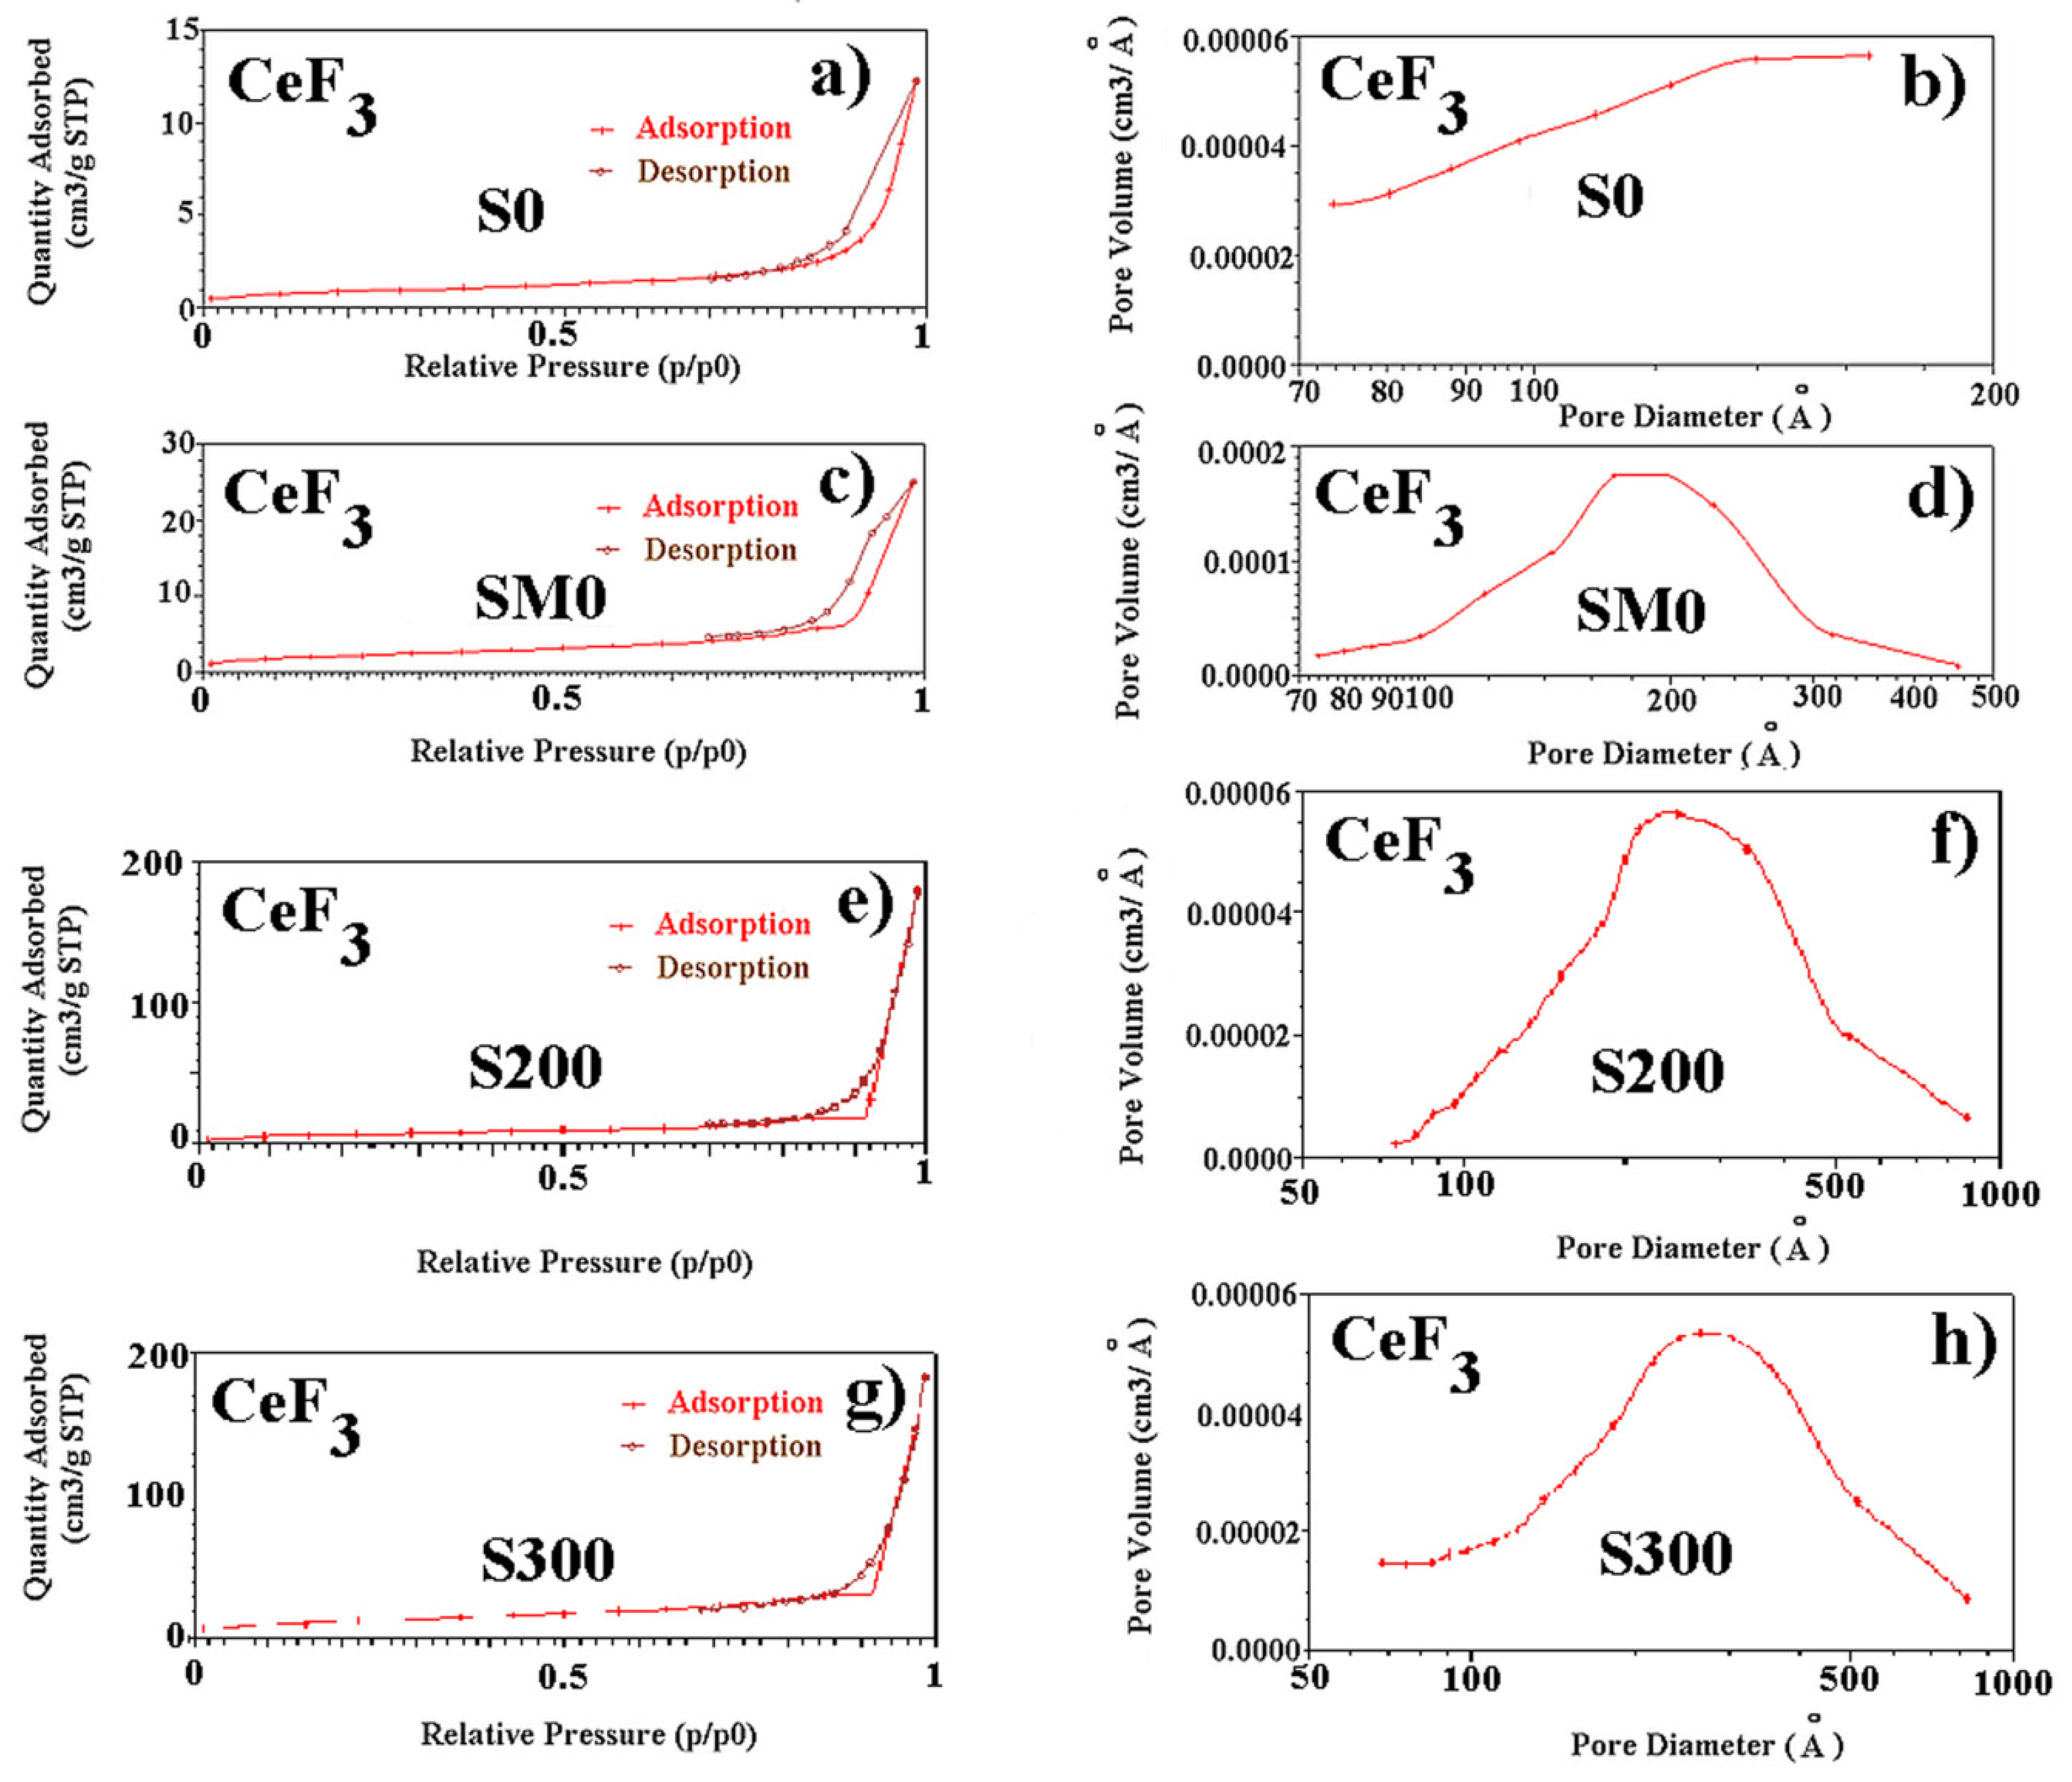
| Samples | SSA (m2/g) | Pore Size (nm) | Pore Volume (cm3/g) |
|---|---|---|---|
| SM0 | 7.2 | 21.5 | 0.04 |
| S0 | 62.0 | 12.3 | 0.11 |
| S200 | 25.1 | 33.7 | 0.28 |
| S300 | 44.5 | 32.3 | 0.28 |
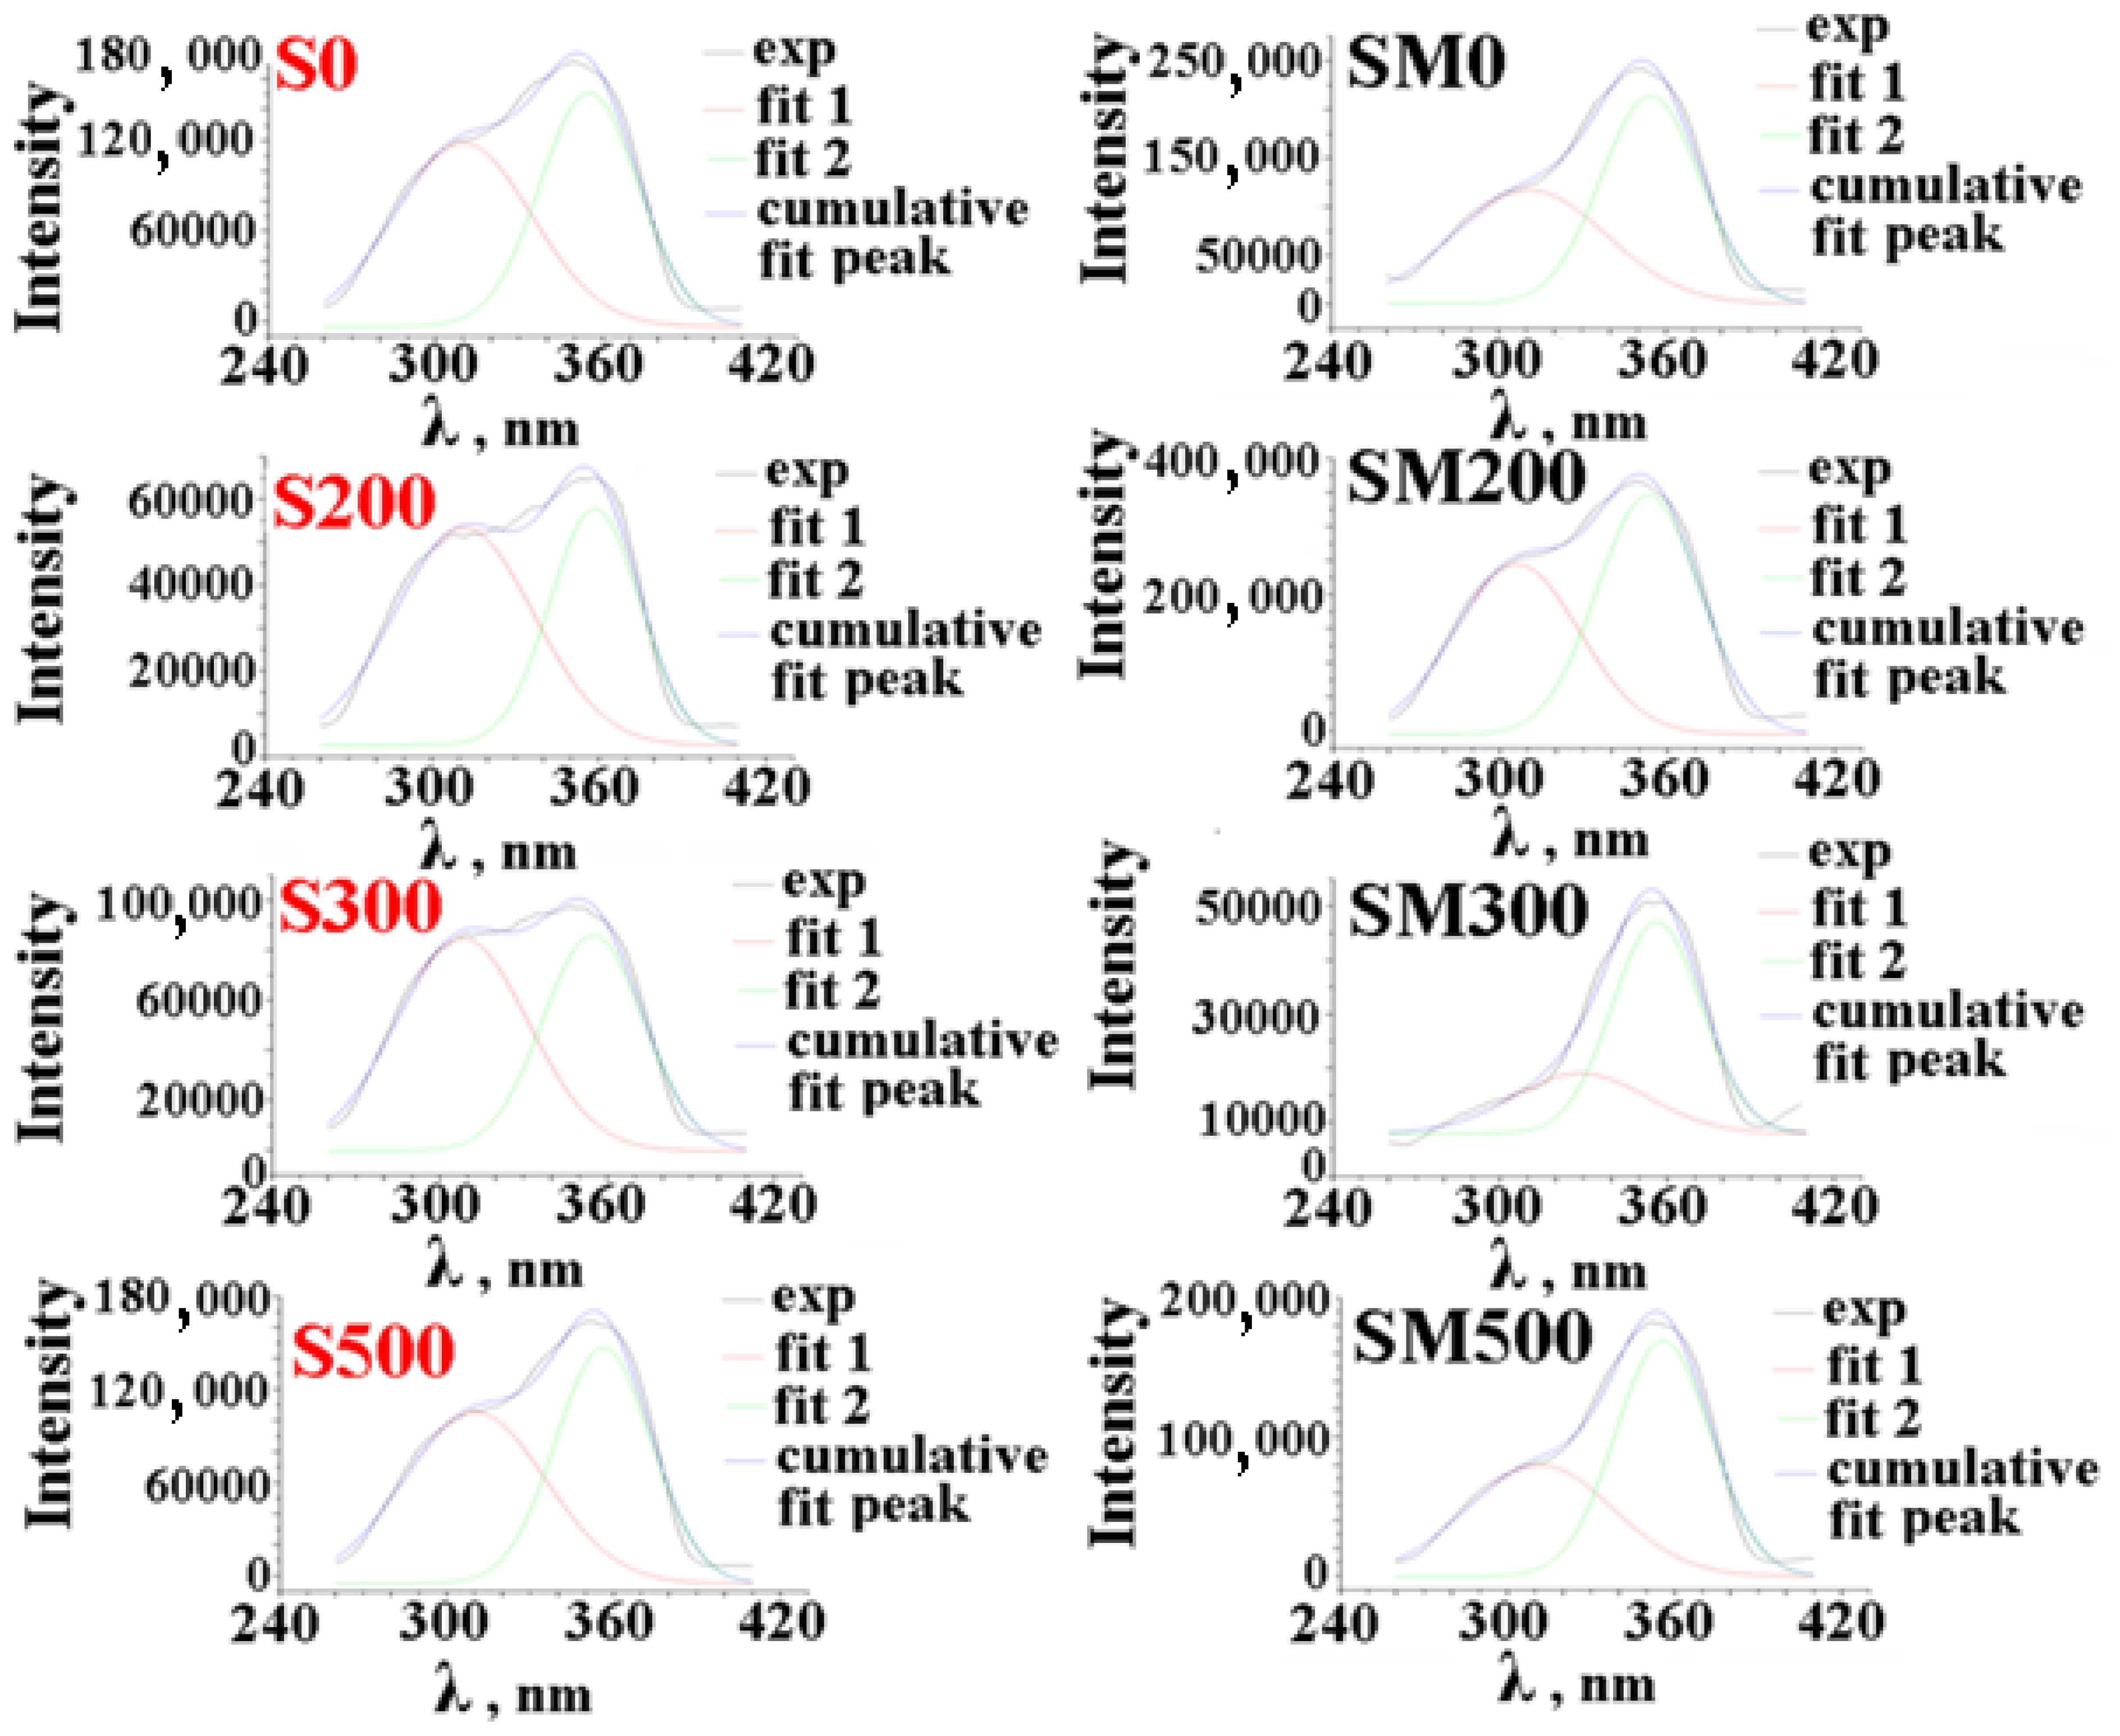
| Sample | X1 nm | X2 nm | A1/A2 | Sample | X1 nm | X2 nm | A1/A2 |
|---|---|---|---|---|---|---|---|
| S0 | 309.7 | 355.1 | 1.1 | SM0 | 311.1 | 354.5 | 0.84 |
| S200 | 311.4 | 358.5 | 1.43 | SM200 | 306.0 | 353.1 | 0.86 |
| S300 | 307.9 | 354.9 | 1.29 | SM300 | 328.2 | 356.2 | 0.43 |
| S500 | 310.0 | 356.3 | 1.08 | SM500 | 311.5 | 355.7 | 0.73 |
Publisher’s Note: MDPI stays neutral with regard to jurisdictional claims in published maps and institutional affiliations. |
© 2022 by the authors. Licensee MDPI, Basel, Switzerland. This article is an open access article distributed under the terms and conditions of the Creative Commons Attribution (CC BY) license (https://creativecommons.org/licenses/by/4.0/).
Share and Cite
Ilves, V.; Murzakaev, A.; Sokovnin, S.; Sultanova, T.; Svetlova, O.; Uimin, M.A.; Ulitko, M.; Zuev, M. Effect of Air Annealing on the Structural, Textural, Magnetic, Thermal and Luminescence Properties of Cerium Fluoride Nanoparticles. Physchem 2022, 2, 357-368. https://doi.org/10.3390/physchem2040026
Ilves V, Murzakaev A, Sokovnin S, Sultanova T, Svetlova O, Uimin MA, Ulitko M, Zuev M. Effect of Air Annealing on the Structural, Textural, Magnetic, Thermal and Luminescence Properties of Cerium Fluoride Nanoparticles. Physchem. 2022; 2(4):357-368. https://doi.org/10.3390/physchem2040026
Chicago/Turabian StyleIlves, Vladislav, Aidar Murzakaev, Sergey Sokovnin, Tat’yana Sultanova, Olga Svetlova, Mikhail A. Uimin, Maria Ulitko, and Mikhail Zuev. 2022. "Effect of Air Annealing on the Structural, Textural, Magnetic, Thermal and Luminescence Properties of Cerium Fluoride Nanoparticles" Physchem 2, no. 4: 357-368. https://doi.org/10.3390/physchem2040026
APA StyleIlves, V., Murzakaev, A., Sokovnin, S., Sultanova, T., Svetlova, O., Uimin, M. A., Ulitko, M., & Zuev, M. (2022). Effect of Air Annealing on the Structural, Textural, Magnetic, Thermal and Luminescence Properties of Cerium Fluoride Nanoparticles. Physchem, 2(4), 357-368. https://doi.org/10.3390/physchem2040026