1. Introduction
Successful reduction of CO
2 gas into hydrocarbons “reverse fuel” will contribute to solve two overlapping global problems related to the global warming caused by the excess of CO
2 in the atmosphere, and the high demand of hydrocarbons to be utilized in the expanding urbanization [
1,
2]. However, attaining an efficient route to do this reduction process is still in demand, since many parameters are not well under control. Knowing these parameters will happen by understanding key intermediates for such reduction process, especially under operational conditions such as the presence of external bias [
3,
4,
5,
6,
7].
One of these important intermediates during the CO
2 reduction process is the CO (carbon monoxide). CO is an important surface intermediate for many catalytic reactions including methanol oxidation, and CO
2 reduction process [
8]. Depending on the nature of the catalyst and the working conditions with respect to electrolyte, pH, temperature, and other diverse ions, several reactions of CO
2 reduction can take place. Each of the following reactions has required redox energy (versus SHE at pH = 7) (Some literature uses NHE instead; however, the relation between them is
), and certain amount of moles for electrons and protons are needed. The lowest kinetic parameter needed to reduce CO
2 is by using two moles of electrons as the following equation [
3,
9,
10].
Mixing the resultant CO and H
2 gases on metal surfaces under different conditions can produce varieties of hydrocarbons such as CH
3CH
2OH, CH
3OH, and CH
4 [
11].
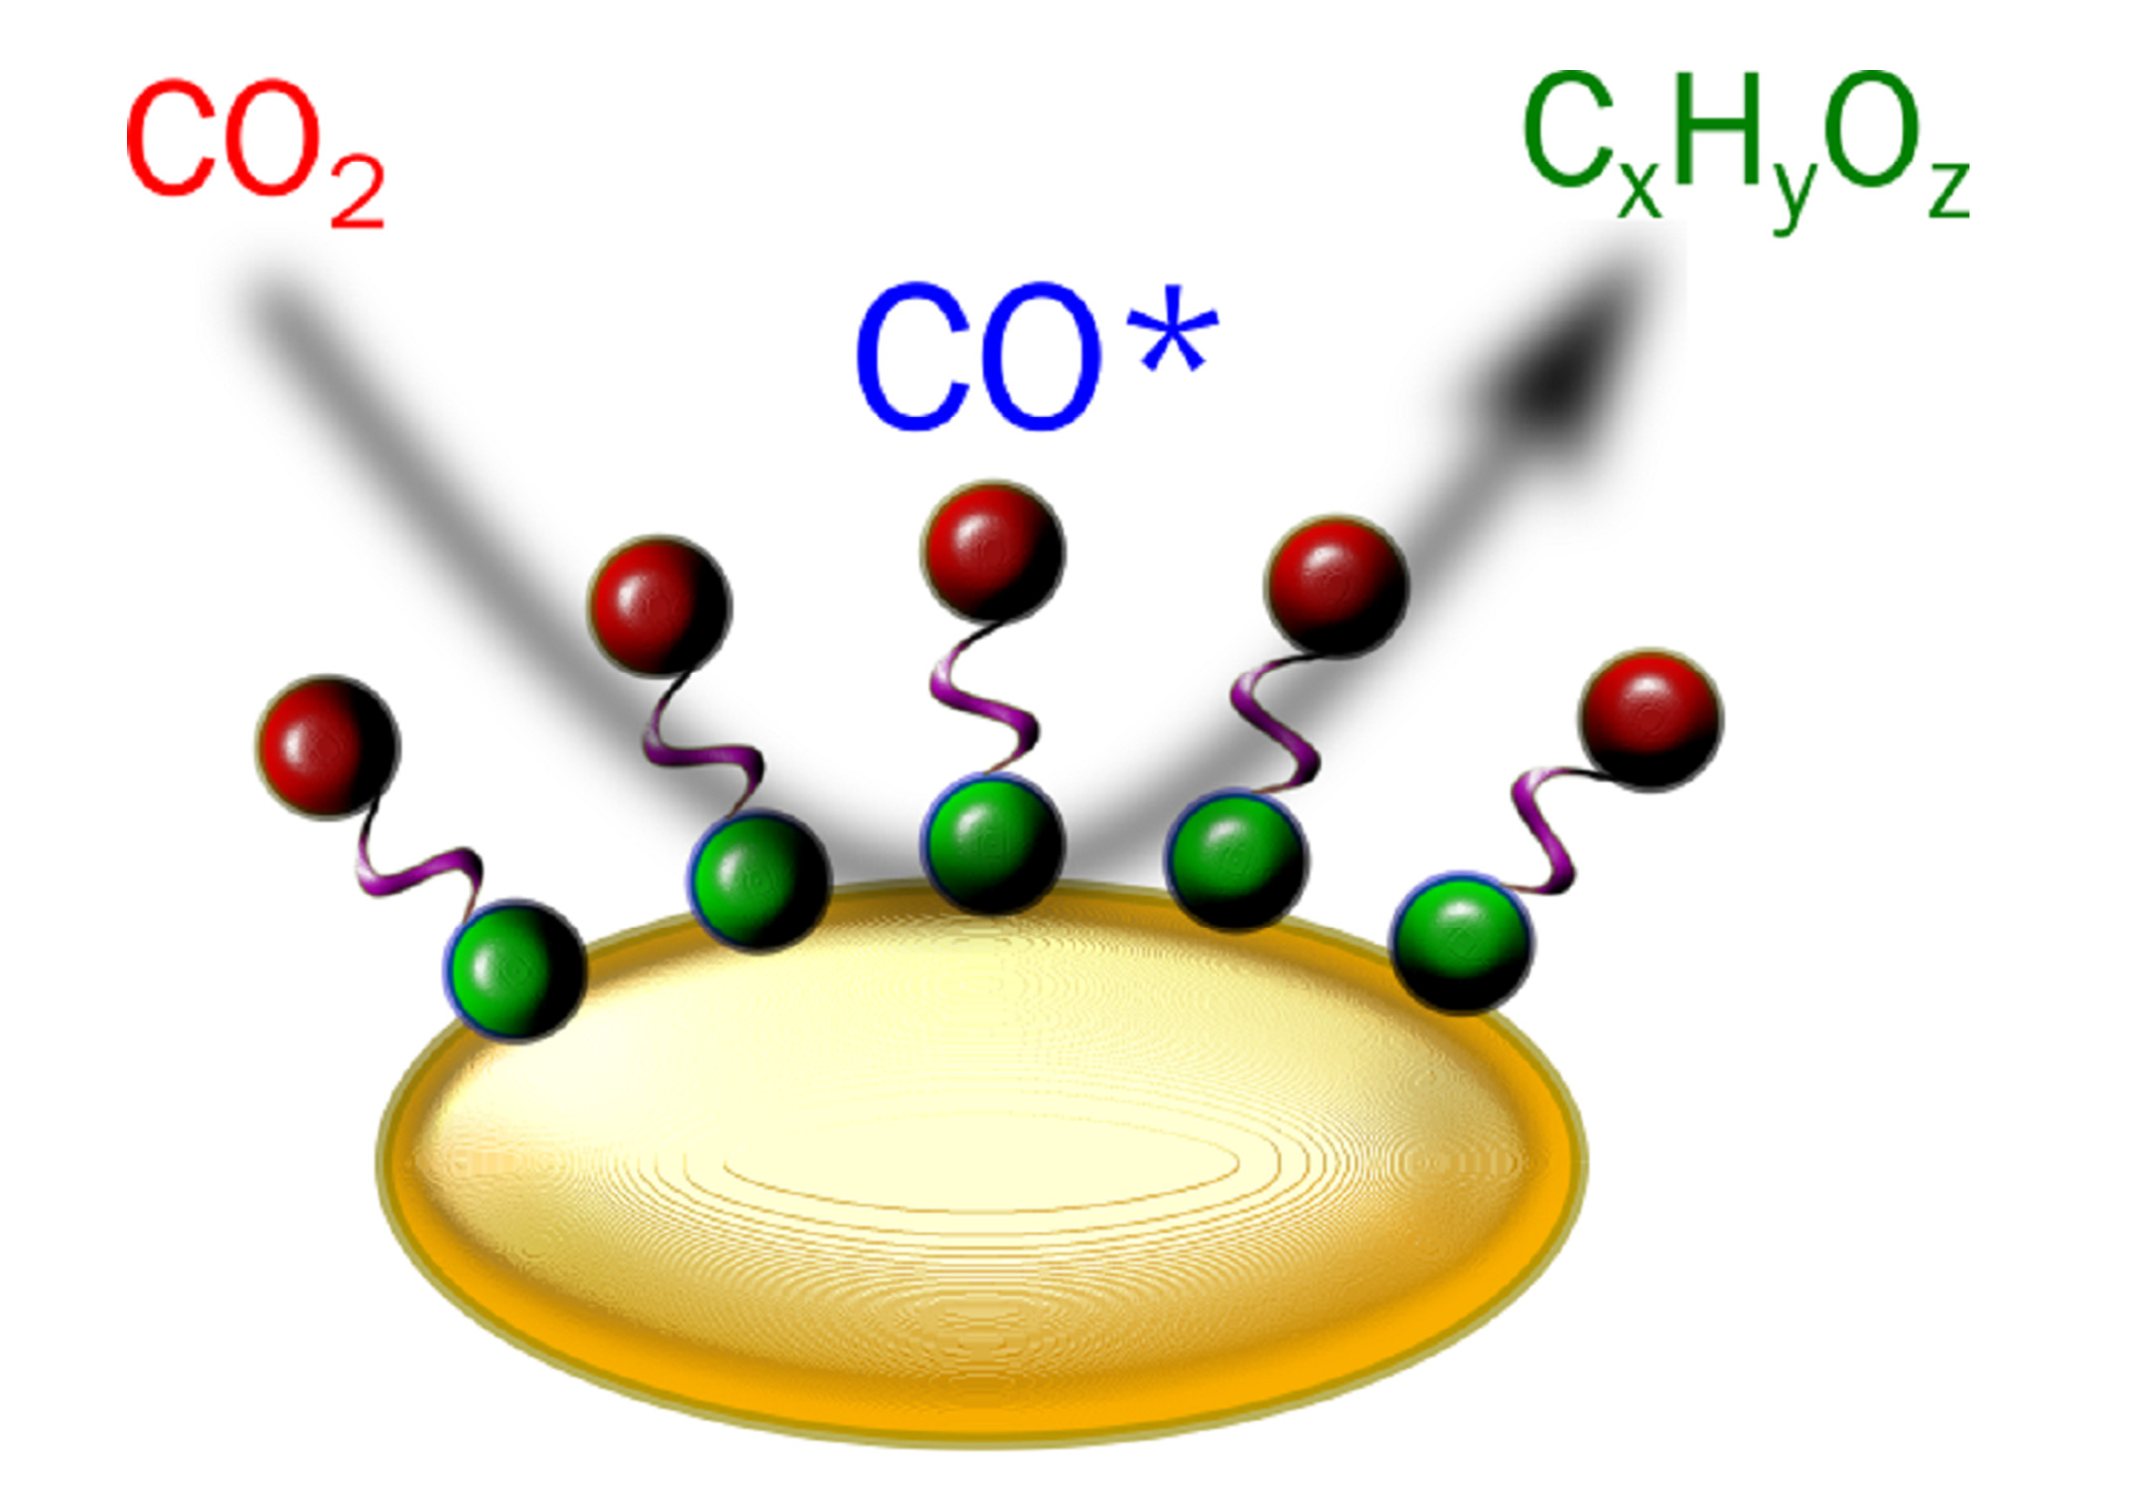
In addition, CO is one of the most transient species (COOH*, CO*, CHO*, and CH
2O*) that show strong vibrational bands in the infrared (IR) region, allowing for better detection and analysis, see
Figure 1 [
6,
12]. Moreover, due to the adsorption of CO
2 and its transient species like CO on material surfaces, the concentration of such molecules is extremely low, and special spectroscopic techniques are needed to access such low concentrations with high accuracy. IR surface sensitive techniques can, however, be more sensitive than other techniques such as gas chromatography [
2].
Various spectroscopic techniques at different spectral range can generally be utilized to investigate the dynamics of reactants, CO herein, at surfaces and interfaces such X-ray spectroscopic techniques [
13,
14]. However, utilizing the IR is more applicable for many groups due to its relative simplicity and accessibility in comparison to other methods based on X-rays. Moreover, IR energy is considered as a non-destructive source of energy that doesn’t generally cause any sample degradation or sample ionization; however, sample heating is expected. The IR source has to be utilized in a specific manner to be surface sensitive such as in ATR-SEIRAS (Attenuated total reflectance−surface enhanced infrared absorption spectroscopy), and (Vibrational sum frequency generation) VSFG.
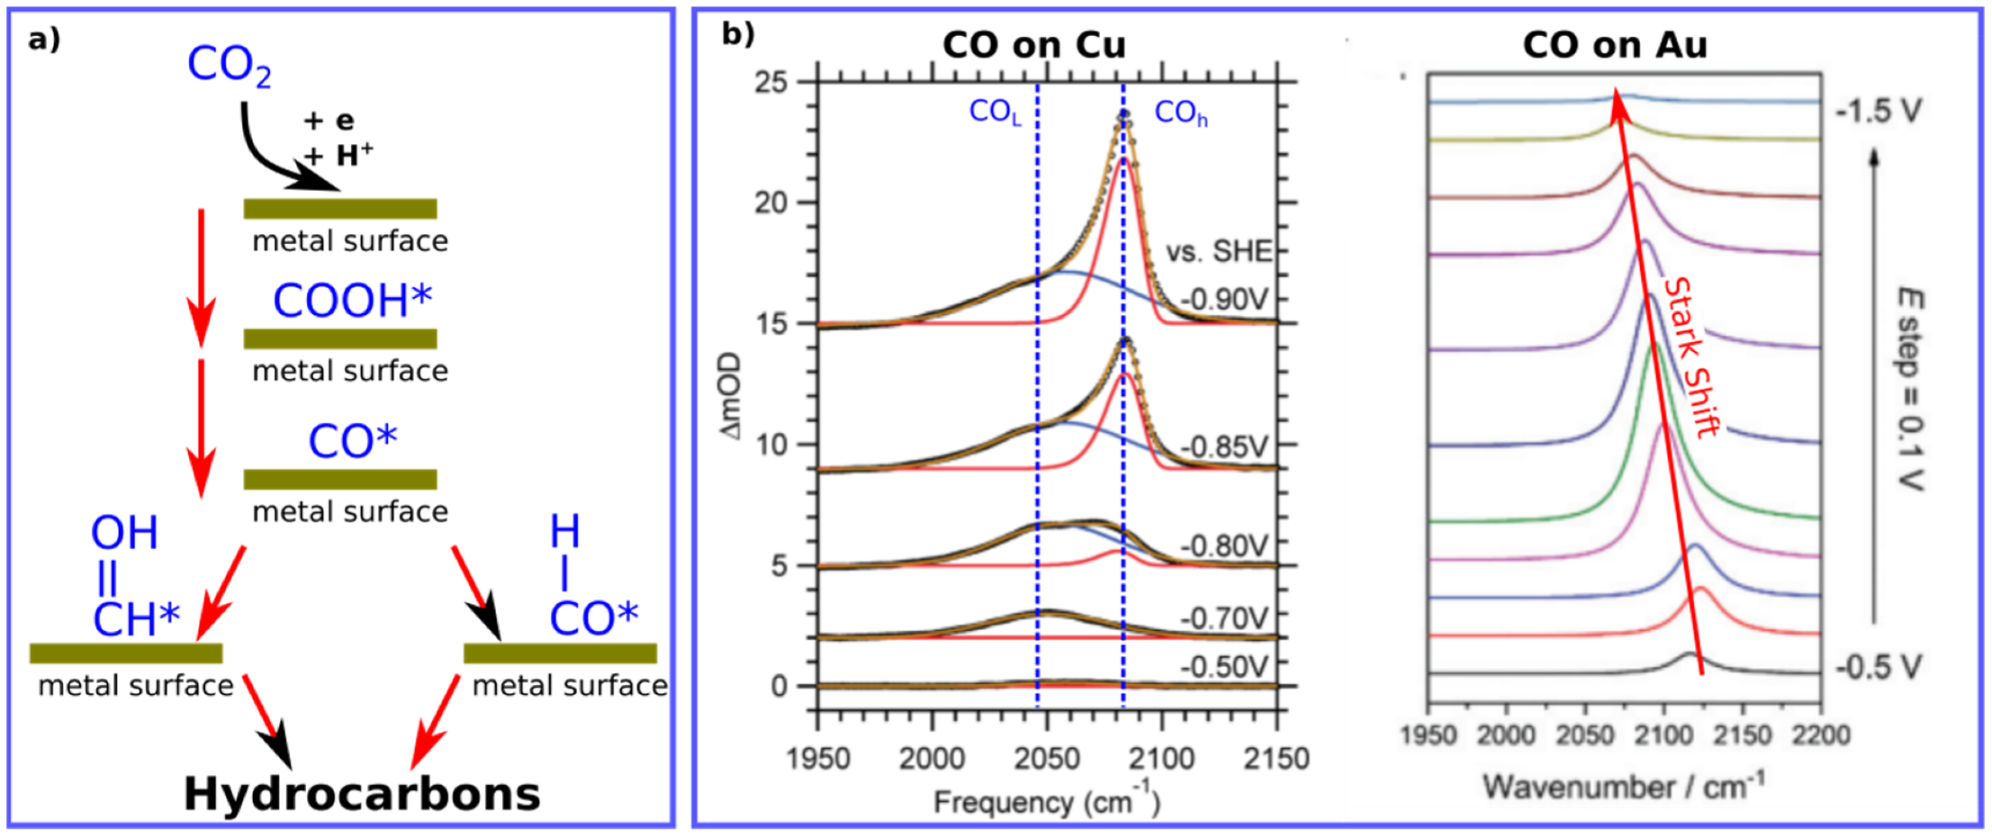
Figure 1 shows typical IR signatures for CO molecules adsorbed on metal surfaces during electrochemical processes by both techniques. The position of CO can vary depending on the utilized metal, applied voltage and the IR technique as well. For instance, CO on Cu measured by ATR-SEIRAS shows two vibrational bands, while change of on CO vibrational position on Au is shown using VSFG, see
Figure 1.
Herein, general overview of the IR spectroscopy along with main IR sensitive techniques utilized (SEIRAS and VSFG) for detecting CO on metal surfaces along with literature values will be discussed, aiming for better understanding of the implications for utilizing such methods for following reaction dynamics of CO2 reduction on metal surfaces.
2. Infrared Spectroscopy of Adsorbed CO on Surfaces
IR spectroscopy relies on detecting the vibrational energies of molecules and free charges [
16,
17,
18]. The energy range for IR extends from 4000–400 cm
−1 (2500–25,000 nm) and corresponds for an energy change of (1.9–9.5 kcal mol
−1). When incident IR energy matches the quantized energy for a specific mode, IR absorption occurs. Each molecule can have various modes of vibrations including symmetrical, asymmetrical, bending and stretching modes. Each mode has specific amount of energy to occur, and many modes can happen at very close energies, which might not facilitate reading the IR spectra [
19]. Moreover, due to the low range of IR energy, the studied materials must be characterized by several properties such as the molecular size. For instance, nanomaterials will appear as continuous films under the mid-IR region “2.5–25 μm” and no diffraction from atomic lattice will appear, only optical response happens due to the overall change of polarizations with the material [
20].
For any molecule showing IR features in the IR spectrum, the molecule must be polar. The polarity, due to unequal distribution of charges, allows for active vibrational modes, which can be described via Morse potential that has a square dependence on the distances between atoms (
). The energy level for the vibrational mode within the Morse potential can be expressed as follows:
where
is the vibrational quantum number defining the vibrational energy state. While the frequency of the vibration is defined as
where
μ is the reduced mass,
c is the velocity of light, and
k is the bond force constant. The transition moment (
R) between two vibrational energy levels (
) can be expressed as follows:
in which
D is the dipole moment and
x is the change of displacement from equilibrium (
r −
re). If
D = 0 as in nonpolar molecules, the transition is zero (thus no IR absorption). From Taylor series expansion, the variation of
D with distance can be expressed as follows:
The first term in the right-hand side is zero due to orthogonality present between various eigen-functions. So,
Meaning that continuous change of bond length is required for an overlap between eigenstates at different energy levels and the incident IR energy. This term can be also zero for symmetrical modes, thus IR absorption is forbidden by symmetry as well.
Upon IR absorption, the local temperature (
T) is changing due to molecular vibrations, and the number of molecules in a specific vibrational state (
N) is governed by Boltzmann distribution at that temperature as follows
In catalytic reactions, the number of reactants converted into products () will rely on the initial adsorption sites available on the metal surfaces (), as shown in Equation (2). Thus, the active sites for reactants adsorption are an important parameter for catalyst efficiency. In addition, the catalyst plays an important rule to affect the value of , which controls the product qualitatively and quantitatively. Moreover, the molecular dipole moment can be changed upon adsorption of molecules on surfaces, meaning that IR active molecules can turn to be inactive or vice versa upon adsorption on surfaces during catalytic reactions.
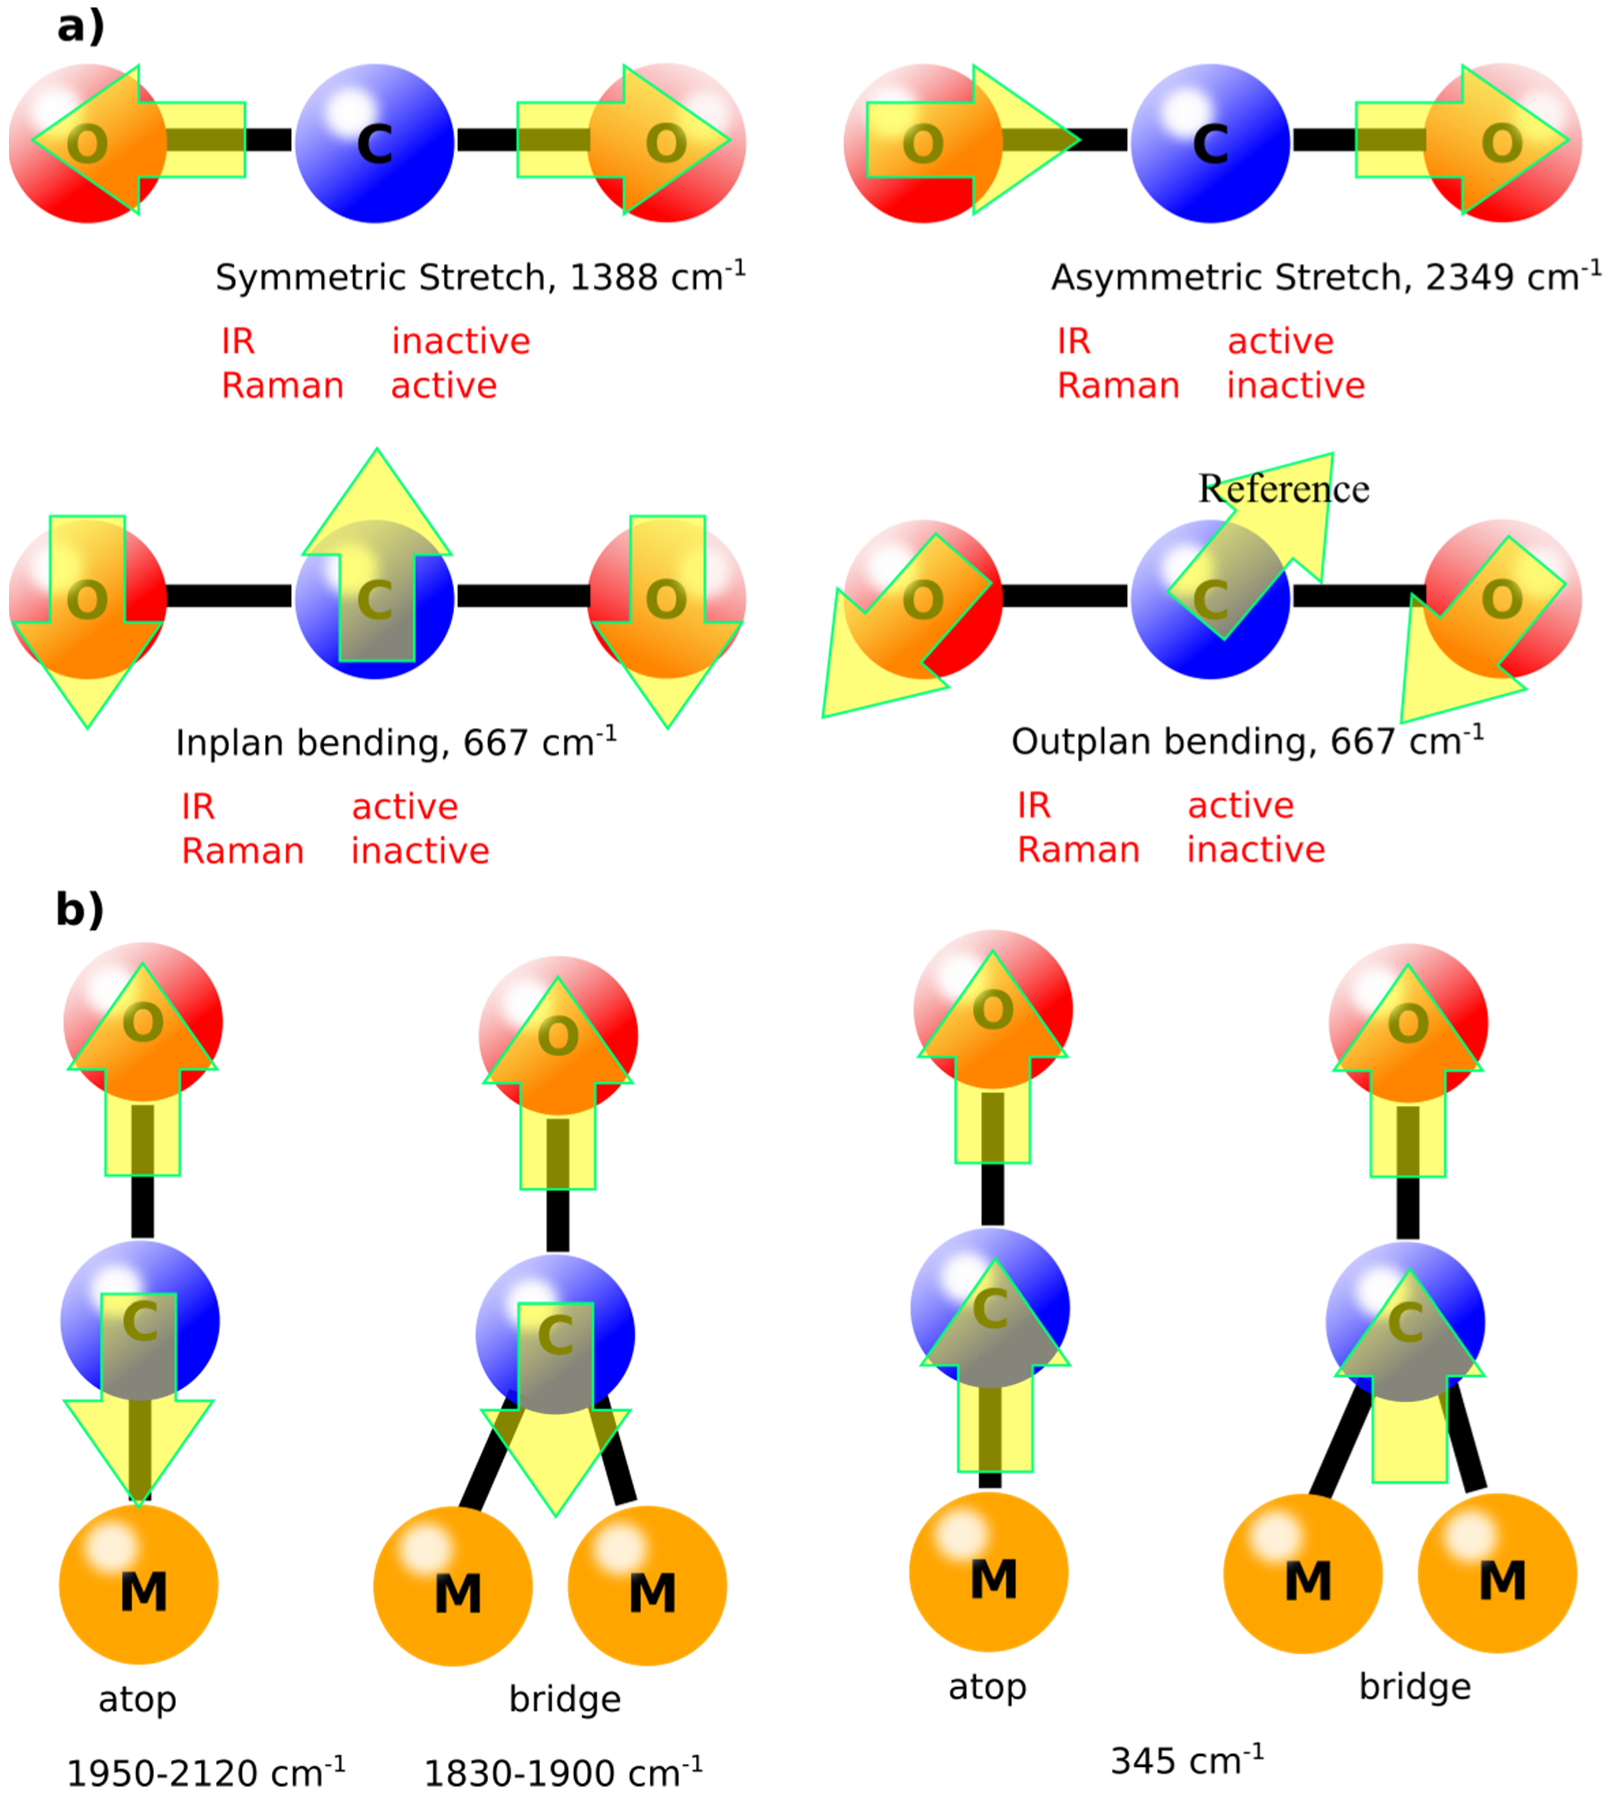
The vibrational modes of molecules are defined by the simple equations (3N-6 for nonlinear molecules and 3N-5 for linear molecules), in which N is the number of atoms in the molecule [
19]. For example, CO
2, in gas phase, has four vibration modes (symmetrical stretching, asymmetrical stretching, in plan bending, and out of plane bending), as shown in
Figure 2. Some of these modes are IR inactive due to the absence of dipole moment. Similar molecules like CO will have only one vibrational mode in the gas phase at ca. 2143 cm
−1. However, upon adsorption on surfaces such as metals, new vibrational modes can appear, known as “external modes” [
21]. Depending on the binding behavior of the molecule, the vibrational mode with its energy can be defined. For instance, adsorption of CO molecules on Cu (100) surface will have atop and bridge adsorption modes leading to lower vibrational energies compared to the gas phase as shown in
Figure 2b. These vibrational modes are important to be defined as the catalytic activity depends on such adsorption modes correlated with the vibrational energies [
22]. Normally, the higher the vibrational frequency, the higher the force constant according to Equation (1), which generally indicates to higher dissociation constants during reaction pathways [
23]. In other words, knowing the vibrational mode will define the catalytic pathway for a specific reaction on surfaces.
The vibrational modes can behave through pure harmonic oscillation (Morse approach,
Figure 3a, red curve), in which the dissociation is very high or through anharmonic oscillation, in which the dissociation “breaking bonds” can happen upon vibrations (
Figure 3a, blue curve).
For molecules with N > 2, mixture of modes can happen simultaneously, leading to hypersurfaces of multidimensional behavior that are not plausible to illustrate. However, one can simplify this problem by illustrating only one vibrational coordinate in 2D-space as shown for the example for CO
2 molecule, see
Figure 3. R1 and R2 can represent the internuclear distance between C atom and the O atoms. When both distances (R1 and R2) change at the same time, the resulted potential hypersurface can be plotted as shown in
Figure 3b. For symmetric stretching mode along the coordinate Q
1, the shape of potential energy curve is almost like anharmonic oscillator, meaning that this symmetric vibrational mode is a dissociative mode but with a high energy cost (
), see
Figure 3c. While on coordinate Q
2, the shape of potential energy is purely harmonic with a non-destructive pathway although the vibration mode is of asymmetric nature
see
Figure 3d.
However, for a crude test for such effects, the O atom has been replaced by a “M” atom and relative vibration strengths are tested relative to the internuclear changes of the C-O bond, see
Figure 3e,f. The diagonal correlation between the vibration of the two bonds (R1 and R2), shows that upon 5% of relative vibration of C-M bond still needs high energy to cross the barrier (10 as an arbiter unit). This barrier is reduced further on until 100% of relative vibration (similar to CO
2 molecule); however, in the meanwhile a new barrier shows up, increasing the overall reaction activation energy. The sweet spot in this crude example shows that 15% of relative vibration between the M-C relative to the O-C bond provides the lowest overall activation barrier; see
Figure 3e,f. This crude example is in-line with experimental observations shown for the activity of various metals towards the formation of hydrocarbons from CO
2, in which weakly vibrating species neither strongly vibrating species on metal surfaces are the optimal candidates. Reaching this sweet spot in real examples can be achieved by tuning the reduced mass of the vibrating species, as well as the bond strength between the reactants and the catalysts, in our particular case. Moreover, other parameters can tune such vibrations such as temperature, pH, and counter ions.
This example shows the importance of understandings the vibrational modes of adsorbed molecules on surfaces that can lead to formation or products (breaking/formation bonds) through surface sensitive IR techniques.
As catalysis happens on the first few molecular layers at interfaces, accessing such layers needs unique spectroscopic techniques. Each of these techniques has its cos and pros along with its fundamentals. In the following section, a brief intro about each surface spectroscopic technique in the IR region utilized mainly for CO detection will be discussed.
Generally, each material has its own properties towards the migration of electromagnetic wave (light) through it, and this defines its refractive index value (n) as follows:
in which
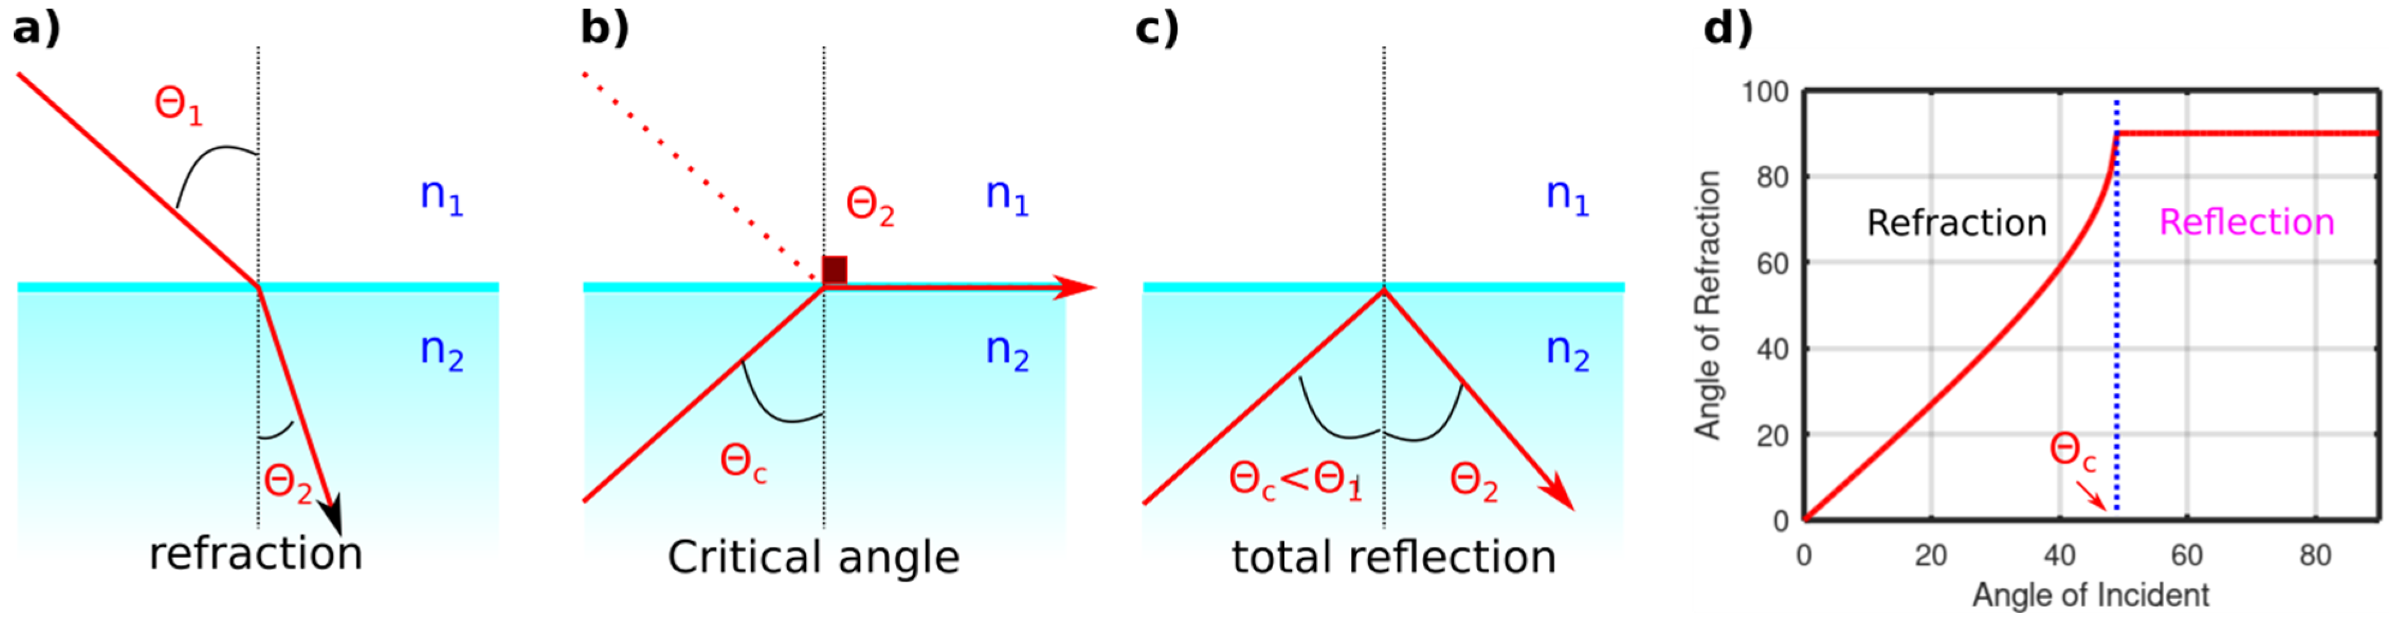
is the dielectric constant, c is the speed of light in vacuum, and v is the speed of light in the studied material. At interfaces, between various materials of different refractive indices, the light will have different speed, which will affect its propagation angles as described by Snell’s law:
For an incident beam with an angel of 50°, between air (n = 1) and water (n = 1.33) interface, the refracted angel, θ
2, is about 35°; see
Figure 4 The maximum refracted angel can be 90° and is called the critical angel. To obtain such condition from a light propagating from air to water is impossible to attain. However, if the light travels from water to air (high refractive index to a lower one,
Figure 4b), such a condition can be obtained, which, in that case, will be at 48.7°. Thus, any incident angle higher than the critical angle will lead to a total light reflection “internal reflection” instead of the light refraction. Since such refraction happens only at the interface, the total reflection mode allows for detection of vibrational modes on interfaces or surfaces.
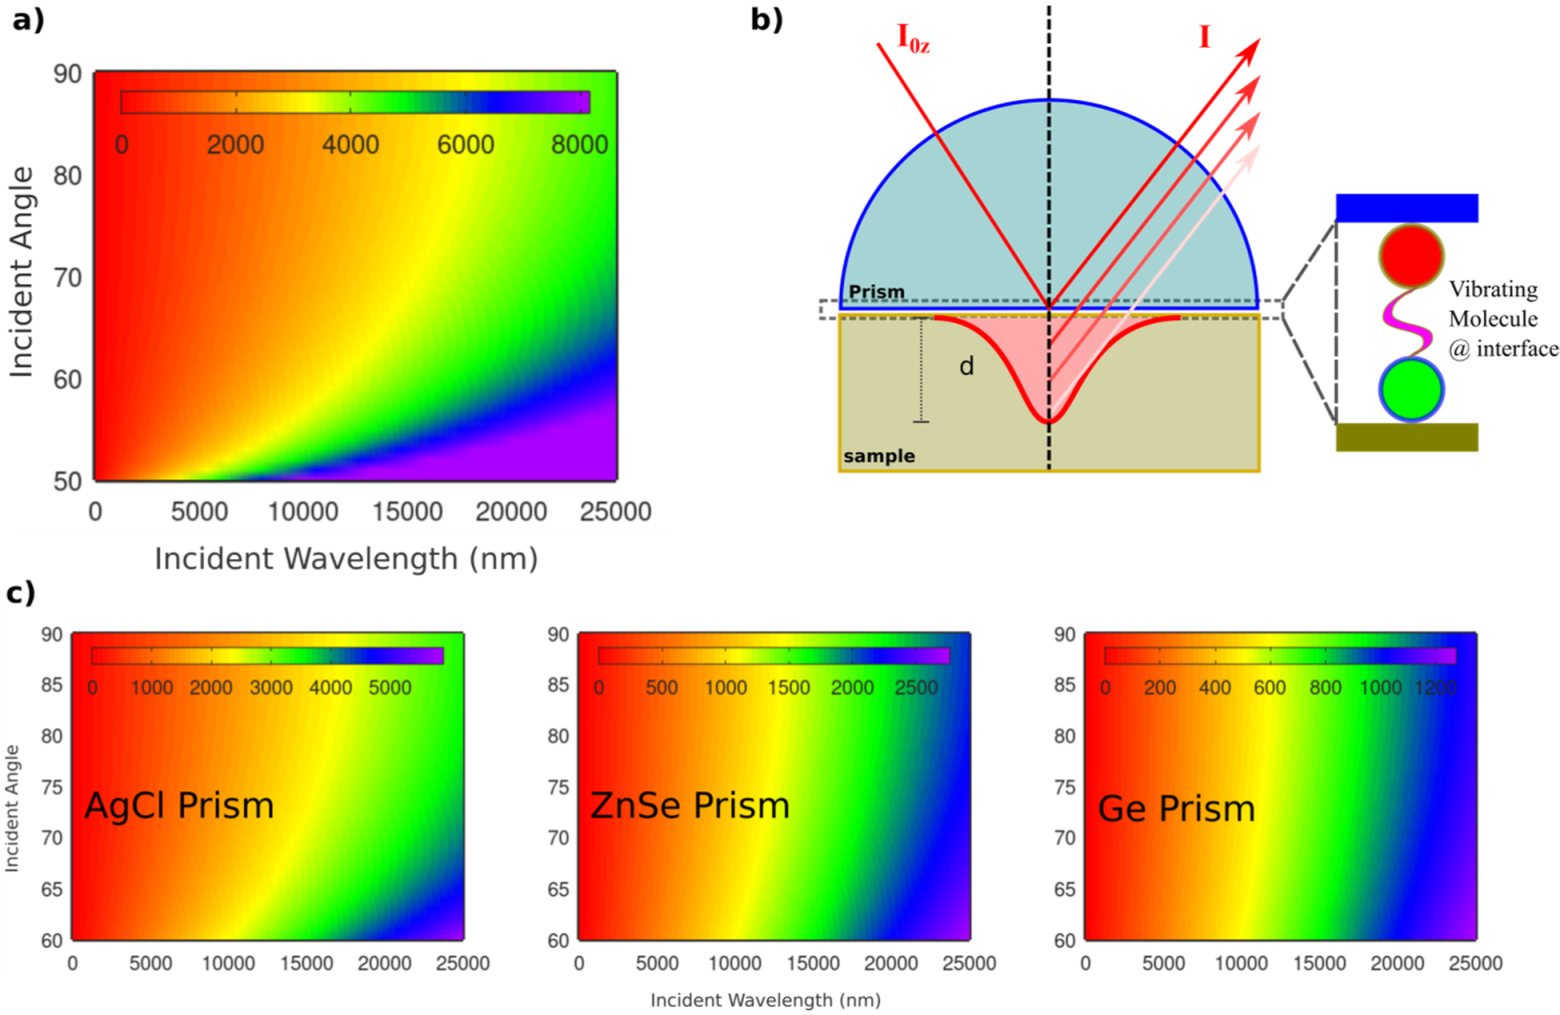
This total reflection mode can be attained by putting a highly refractive index non-absorbing material such as prism on top of a surface of interest. By doing that, the prism surface will act as an evanescent field by the electric field of the reflected beam at the interface. The intensity of the irradiated field (I
z) at the interface relies on the utilized wavelength,
(see
Figure 5a) and the surface properties (d, maximum light penetration depth and z is the material thickness) as following:
The evanescent field at the interface can be utilized to probe vibrational modes of sample contiguous to the utilized prism. This evanescent field will be damped by the oscillator strength present at the sample surface, depending on sample properties.
As can be seen in
Figure 5a for light propagates from water to air interface, the higher the utilized wavelength the higher the penetration depth at interface, allowing for detection of thicker sample layers and better signal to noise ratio. However, information from exceptional surface selectivity (1–2 nm) will not be possible at higher wavelengths in the IR region, as in the X-ray range. The conditions for surface selectivity can be improved by utilizing prisms of higher refractive indices, see
Figure 5b,c.
Figure 5c shows the utilization of various prims of different chemical compositions, in which their refractive indices (see
Table 1) vary the penetration depth of the incident IR. For instance, at 15,000 nm, the penetration depth at 70° incident angle is ca. 3000 nm, 1500 nm, and 700 nm for AgCl, ZnSe, and Ge prisms, respectively.
Moreover, such conditions can be greatly overcome by utilizing the physical property of refractive index that depends on two terms, one which attenuates the frequency (
) and the other to attenuate the absorption (
). The refractive index can also be expressed as a quantum term on a molecular level that has a specific direction at a specific frequency and contain complex terms (imaginary part due to absorption or attenuation of the incident electric field, k), as in the following equations:
Upon IR absorption between two vibrational energy levels, the KramersKronig integral can be utilized to calculate such effects
Thus, putting thin layers of metals (attenuate the IR absorption, k term), or non-metals (attenuate frequency, real term) at the interface, can tune the refractive index of the investigated material, minimizing the penetration depth and increasing the surface selectivity.
The common refractive index of utilized prisms is about 1.5. However, various materials can be used to cover the prism surface such as Si to reduce the critical angle and increase the surface sensitivity.
Table 1 shows some common materials with their standard values [
24]. As shown in
Figure 5, the higher the refractive index, the higher the sensitivity towards surface intermediates. Nevertheless, this depends on the geometry of the IR measurements, as shown later on in the next section, thus, compromise should be tested depending on the central spectral region, and the setup geometry.
3. Attenuated Total Reflectance—Surface Enhanced Infrared Absorption Spectroscopy
One of the most utilized surface-sensitive techniques in the IR region is attenuated total reflectance−surface enhanced infrared absorption spectroscopy, which can be abbreviated as ATR, ATR-SEIR, ATR-SEIRAS, or SEIRAS depending on the geometrical and the preparation details [
25,
26]. However, this technique is based on the significant enhancement of the molecule IR signal upon adsorption on metal surfaces. Ideally, the metal (substrate) surface should contain separated islands with particles sizes lower than the utilized IR wavelength. Thus, continuous films are not good for high SEIRAS signals [
27].
The enhancement of the IR signal of an adsorbed molecule (physical or chemical adsorption) versus the IR signal of a free-standing molecule can vary from 1 to 3 orders of magnitudes differences, relying on the preparation of the metal surface and its surface morphology. This huge enhancement is important considering the low absorptivity of many molecules in the IR region, minimizing the required detection limit for vibrating molecules.
The resulted SEIRAS can be measured via transmission or reflection methods. For the reflection methods two main procedures are commonly utilized, external reflection or ATR (attenuated total reflection). In the ATR mode knowing both the polarization and the incident angle of the IR beam is critical for the right estimation of the vibration molecule. However, ATR-SEIRAS (attenuated total reflectance surface enhanced infrared) is characterized by its surface sensitivity for the first monolayers of adsorbed molecules that ranges from 5–10 nm.
Nevertheless, some selection rules are present in ATR-SEIR such as the need for a metal surface that actively absorb in the visible to mid-IR region, and the presence of an active vibration mode for the adsorbed molecule that is perpendicular to the metal surface. [
28]. Thus the IR absorption intensity (A) (Normally, the absorbance is normalized by the
d term to cancel out the dependence on the IR wavelength) relies on the applied electric field (E), the relative angle between IR and adsorbed molecule (
), and the molecule dipole moment (
), as shown in the following equation:
The strong interaction between the incident IR field and the free electrons on metal surfaces will produce an LE (local electric field) stronger than incident field, in which the adsorbed molecules can feel that strongly, resulting of enhanced Raman scattering and IR absorption. The LE sharply decays far from the surface
, making this technique very surface-sensitive [
28].
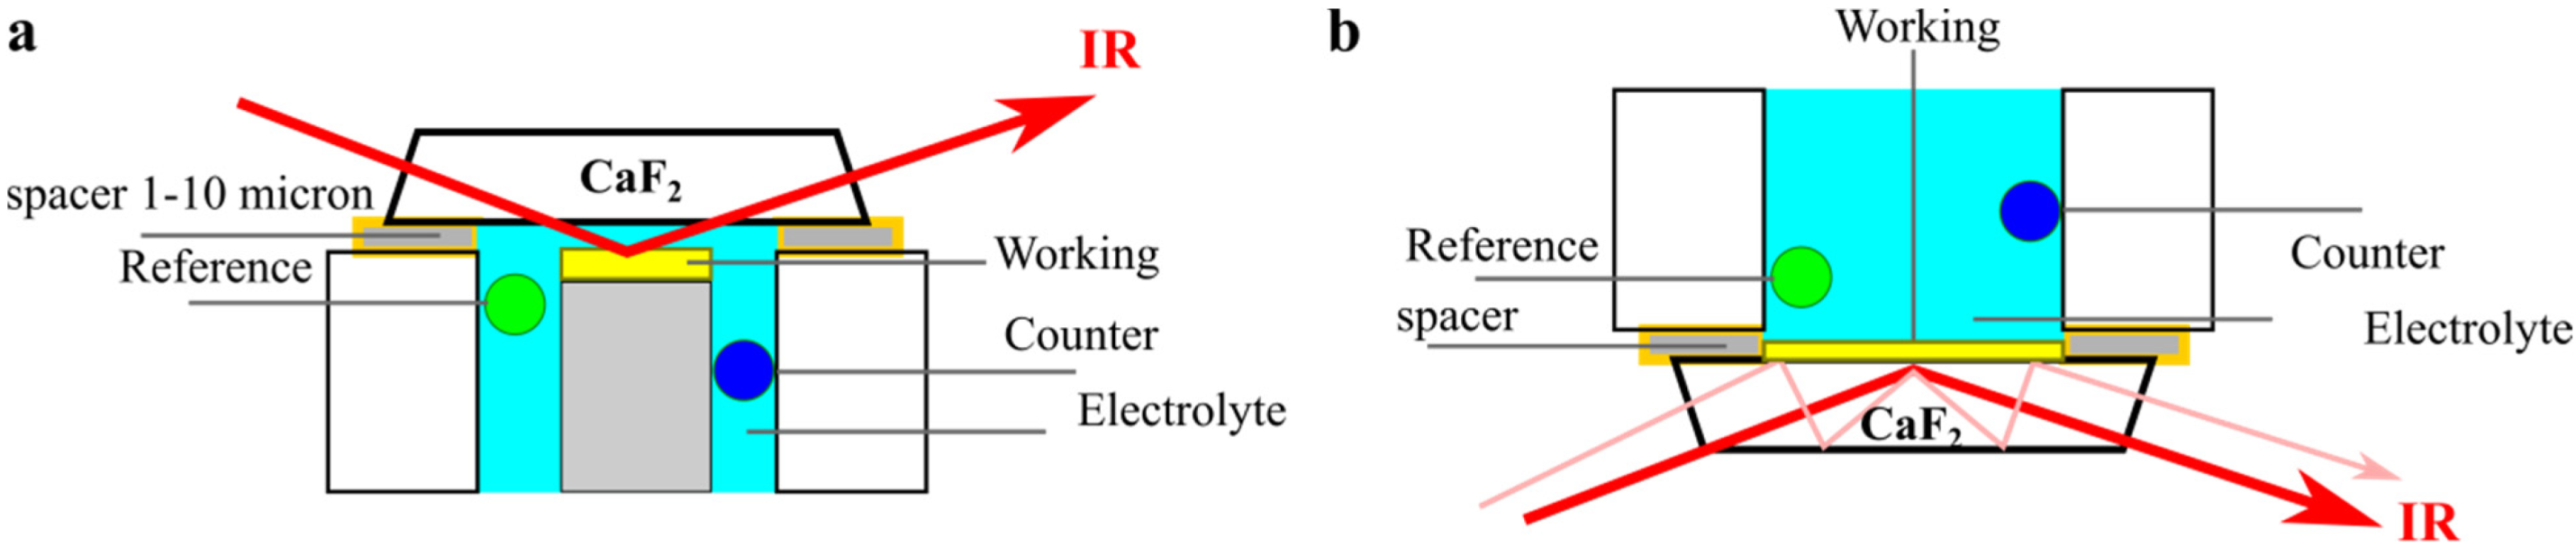
To follow the catalysis of CO
2 on metal surfaces and the formation of subsequent products such CO, the measurements must be done in electrochemical cells. In electrochemical cells, three electrodes are required along with an electrolyte. Thus, measuring the SEIR through the reflection mode has some limitations like the IR adsorption by the electrolyte, which makes the ATR-SEIR more favorable to access detailed surface information, see
Figure 6. However, in the ATR-SEIR mode, very thin films of working electrode should be mad, to detect the adsorbed molecules from the other side.
As can be seen, the geometrical position of the incident IR is the fundamental parameter to detect a signal from the species at surfaces, making this technique is easy to utilize.
4. Vibrational Sum Frequency Generation (VSFG)
VSFG is another important surface sensitive technique at various spectral regions including mainly the IR part. VSFG is characterized by few advantages, such as the high surface sensitivity reaching to sub-monolayer and the ability to measure on smooth surfaces as well as rough surfaces [
29,
30,
31]. Moreover, VSFG can provide detailed information about the symmetry of adsorbed species by changing the polarization of the interacting beams.
However, there are some drawbacks for utilizing VSFG, such as the utilization of several laser beams as shown later on, the complexity of the produced data to analyze like the contribution from bulk quadrupole or the presence of charged species at the surface of interest. Nevertheless the presence of metallic signal known as non-resonant signal (NR) is the biggest problem. The NR signal can be overcome by measuring background signal without adsorbed species.
Generally, the resonant signals can appear as dips or peaks in the measured VSFG data depending on the relative phases between the resonant and the non-resonant signal [
29]. Such VSFG data can provide information about molecules’ orientations and tilting angels on surfaces [
32].
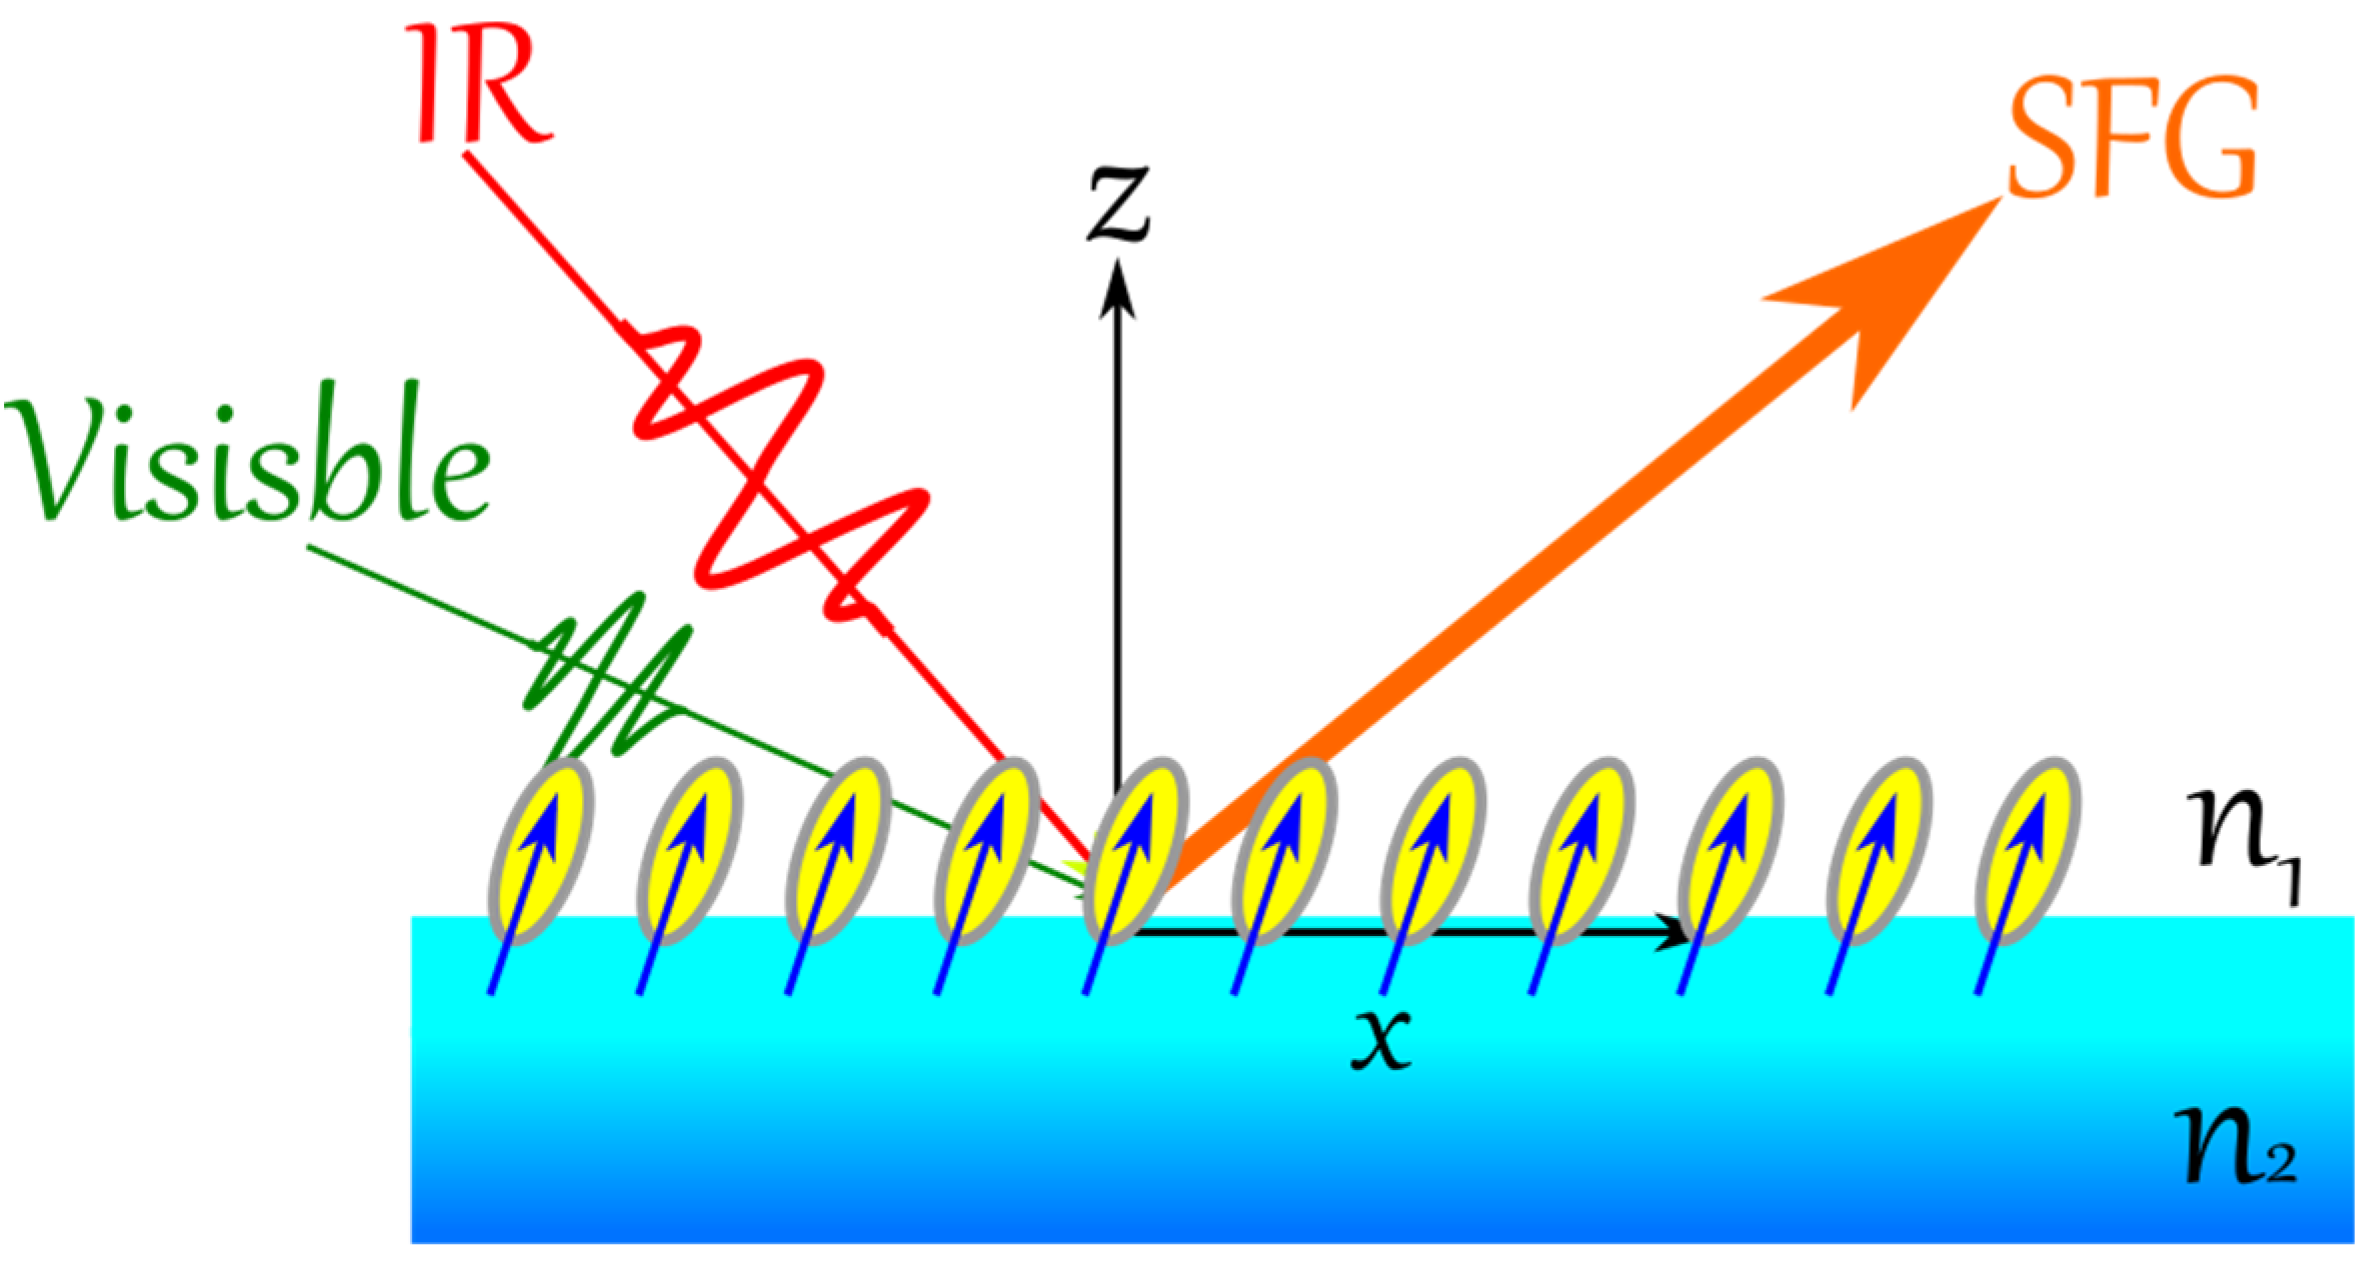
In VSFG, two spectral intense fields in the visible (ω
vis) and in the IR (ω
IR, matching an active vibrational mode of the adsorbate) are overlapped spatially and temporally at asymmetric environment (
Figure 7), resulting of a sum frequency light (SFG) according to the following equation:
The polarization of the SFG can be expressed as follows:
in which
is the second order nonlinear susceptibility and it is a macroscopic value of the microscopic values of β for number of molecules N per unit volume as shown below.
where M and A are the Raman and infrared transition moments, respectively, and
is the width of the vibration peak. As can be seen in SFG, both Raman and IR transition moments should be active, and the value of
increases when IR frequency matches a vibrational frequency “ON resonance”. Nevertheless, SFG can be detected as well even if
is zero but with a weak SFG signal “OFF resonance”. The off-resonance state is useful to determine the NR signal as mentioned previously.
The measured SFG intensity will then depend on the experimental conditions as well as
If
is frequency independent then
Therefore, by measuring the ratio of SFG intensities in the presence and absence of active vibrating species, one can have information about Raman and the IR transition moments for molecules on surfaces. Though, during the catalysis process the external applied field is needed and under such conditions, the applied electric field escalates the second order tensor to the third order tensor, which arises more complication about the data analysis and the nature of the observed resonant signal [
33]. The presence of third order susceptibility can be also useful to determine reactions happening on the surfaces (
), and the ones in the double layer region (
) [
34], as shown by the following equations
θ is the phase factor, r is the distance from electrode, and Φ is the applied potential.
If
“Only surface property contributes”
In which is an offset “baseline”, and the second term shows the linear dependence on the applied potential.
If
, “meaning that the double layer effect contributes significantly more than surface property”
shows quadratic dependence on potential (), and the second term shows a linear dependence, both of them shows an overall distorted sin wave dependence.
As can be seen, VSFG can provide unique information about the studied systems due the involvement of the non-linear processes that have lots of implications and connections to the studied surface. Moreover, modified VSFG setup can be utilized to do time-resolved measurements and to study the vibrational coupling between vibrational modes [
29,
35]. However, due to this complexity present such as the need for laser pulses of different color, various several groups apparently preferred not to use VSFG extensively for the study of CO
2 reduction process due to high associated cost and complicated analysis [
27]. Still, the outcomes from VSFG are full of valuable information.
5. IR Spectral Signatures for CO on Metal Surfaces
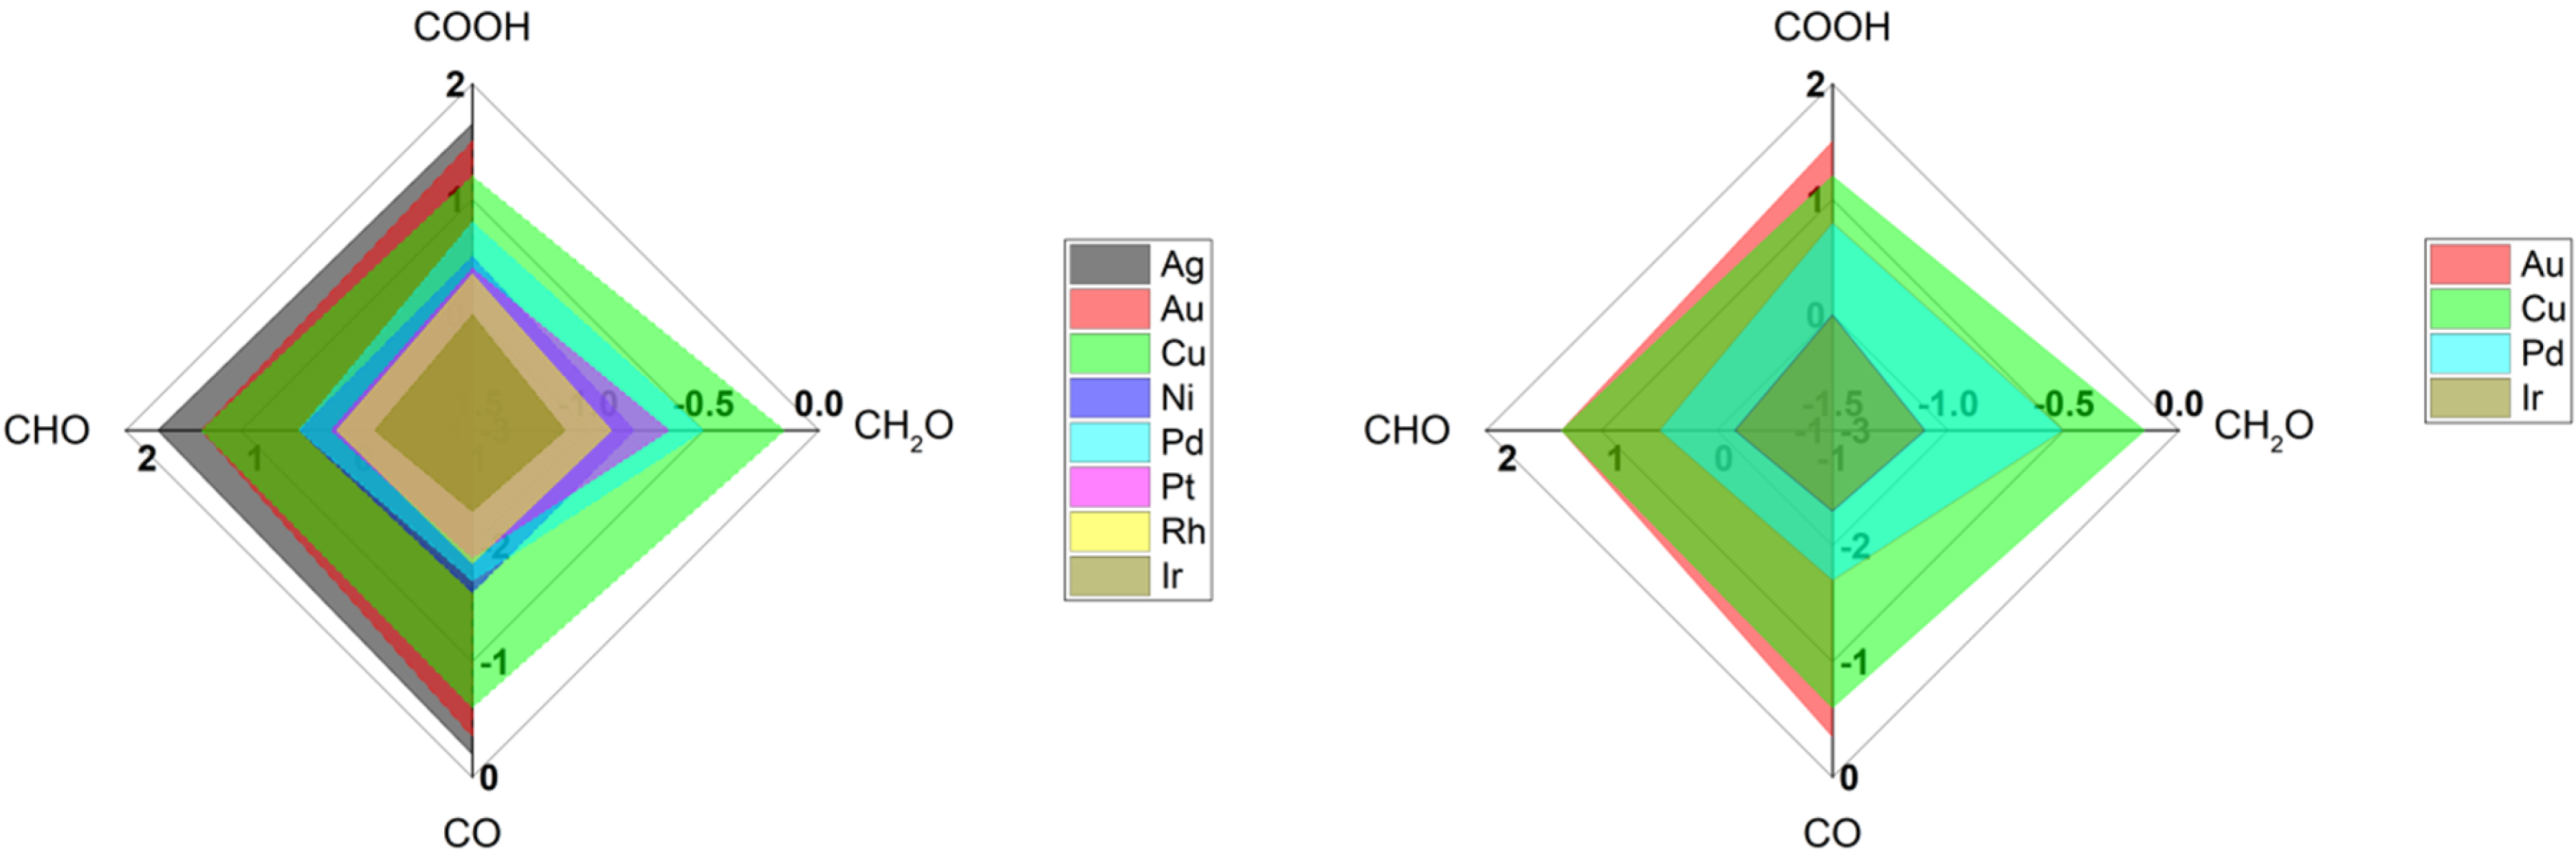
Table 2 shows a list of IR signatures for CO detected on various metal surfaces using common IR techniques (SEIRAS, VSFG). Clearly, copper and gold are one of the most studied metal surfaces compared to other metals [
12]. Generally Ag, Au, and Cu have moderate binding energies towards CO species (the sweet spot discussed in
Figure 3), allowing them to produce hydrocarbons more than other metals that strongly stick CO molecules such Ir [
36], see
Figure 8. Among various metals, copper is known by efficient conversion of CO
2 into hydrocarbons due to its intermediate binding energies towards various intermediate species (COOH, CO, CHO, and CH
2O) [
12,
36,
37]. On the other hand, copper is known by its weak stability towards corrosion and weak selectivity for specific products. However, gold is a robust metal that provide stable and steady surface property, making it attractive to study primary steps for the reduction of CO
2 molecules. Still, gold is not an efficient surface to produce hydrocarbons, due to the higher energy required to stick species such as CHO and CH
2O, see
Figure 8. Clearly from
Table 2, more studies using SEIRAS more than VSFG are found, reflecting the ease of utilizing SEIRAS technique over VSFG as mentioned before.
Interestingly, the average frequency positions of CO on Cu and Au surfaces are ca. 2075 cm
−1. and 2100 cm
−1, respectively (see
Table 2). The higher frequency difference for CO on Cu, compared to CO vibration in gas phase, reflects the higher the bond force present between CO and Cu surface in comparison to CO on Au surfaces, matching with the binding energies reported for CO on Cu and Au surfaces [
36], see
Figure 8. Such a small difference in vibrational frequencies can correlate with the binding energies for CO on Cu vs Au, highlighting the ability of CO on Cu to interact with water (or protons) to form hydrocarbons but not on Au surfaces [
6,
36].
Interestingly, most of the found peak-positions of CO on metal surfaces indicate towards the preference of atop position for CO molecules on metals, see
Figure 2. The bridge position of CO is a matter of debate and it has been attributed to some contaminations in recent studies [
38].
Apparently, there are no significant differences between extracted values for CO on metals using SEIRAS or VSFG. On one hand, this is an advantage for the SEIRAS technique as it is easier to operate and utilize. However, VSFG has lots of potential to extract more information like capturing short-lived intermediates, orientation and phase shifts during for the adsorbed CO molecules.
Table 2.
Summarized data for the detection of adsorbed CO on metal surfaces using infrared techniques under applied external fields.
Table 2.
Summarized data for the detection of adsorbed CO on metal surfaces using infrared techniques under applied external fields.
| Metal | IR Technique | Peak Position (cm−1) | Notes | References |
|---|
| Cu | VSFG | not available | assigned to fast CO conversion into products | [6] |
| Cu | SEIRAS | 2075–2065 | peak positions depend on applied voltage | [39] |
| Cu | SEIRAS | 2083–2052 | peak positions depend on applied voltage | [37] |
| Cu | SEIRAS | 2075–2025 | peak shifts with time after CO insertion at specific potential | [40] |
| Cu | SEIRAS | 2085 (2050) | high frequency CO and (low frequency CO) | [15] |
| Cu | SEIRAS | 2090–2060 | depends on copper surface properties | [41] |
| Cu | SEIRAS | 2100–2050
(1900–1800) | atop CO shifts with voltage
(bridge CO shifts with voltage) | [42] |
| Ag | SEIRAS | 1900 | in ionic liquid | [43] |
| Pt | VSFG | 2060–2090 | peak positions depend on applied voltage | [44] |
| Au | VSFG | 2100–2125 | peak positions depend on applied voltage | [7] |
| Au | VSFG | 2110–2075 | peak positions depend on applied voltage | [4] |
| Au | VSFG | 2130–2080 | peak positions depend on applied voltage | [6] |
| Au | SEIRAS | 2100 | atop CO don’t shift with applied potential | [22] |
| Au | SEIRAS | 2100–2075 | peak positions depend on applied voltage | [39] |
| Au | SEIRAS | not available
(2100–2075) | under CO2 atmosphere due to adsorption instability of CO on Au but only under (CO atmosphere) | [38] |
| Au | ATR-SEIRAS | 2100–2120 | peak positions depend on the applied voltage | [38] |


