Article

The Influence of Green Infrastructure on the Acoustic Environment: A Conceptual and Methodological Basis for Quiet Area Assessment in Urban Regions

Research Group Landscape Ecology and Landscape Planning, Department of Spatial Planning, TU Dortmund University, 44227 Dortmund, Germany
*
Author to whom correspondence should be addressed.
Conservation 2025, 5(2), 22; https://doi.org/10.3390/conservation5020022
Submission received: 2 February 2025 / Revised: 15 April 2025 / Accepted: 21 April 2025 / Published: 9 May 2025

Abstract

Urban regions represent complex acoustic environments with few respites from noise other than small or remote patches of green infrastructure (GI). Recent noise action planning in the German Ruhr region indicates that urban expansion is fueling encroachment upon GI and subsequently the loss of quiet areas. A systematic exploration of this loss in Germany is needed. An explorative systematic review on Scopus with snowballing supports the synthesis of a conceptual framework linking acoustically relevant ecosystem services with GI. Our review identifies natural quietness, abatement, connection to nature, positive soundscape perception, fidelity, and bird sound presence as sound-related ecosystem functions or services. Empirical case studies justify the need to better understand the link between GI, ecosystem services, and the acoustic environment. Guidance for quiet area assessments in the EU to address this research gap in noise action planning is an emerging topic and needs further study. To address the knowledge gap and provide quiet area assessment guidance, we present a stratified habitat-based acoustic study design for a multi-community area in the middle of the German Ruhr region. A multi-tier sample of 120 locations across eleven habitat and land use strata in the Ruhr is presented, pointing out the scarcity of protected biotopes and large biotope complexes in the study area. This work is a contribution towards a conceptual and methodological basis for quiet area assessment, especially in German and EU noise action planning.

1. Introduction

In the last decade, the field of soundscape ecology has emerged with an explosion of publications in natural and human environments. According to this paradigm, the soundscape is composed of patches of acoustic environments with homogeneous interactions that arise as sonotopes, interfacing at sonotones, and which exist in a spatially configured sonic context of a soundscape formed by physical interactions between sonotopes [1]. The soundscape is an analog to the landscape matrix as described by Forman and Godron [2], where control over dynamics is typically dominated by either human or natural systems, and is the primary background element driving and limiting the evolution of the landscape mosaic. Soundscape ecology is transdisciplinary, containing not only the elements of landscape ecology, but also the investigation of psychoacoustics or human perception [3], the bioacoustics approach focusing on the link between landscape configuration and biodiversity patterns [4], and the acoustic ecology perspective linking sound, nature, and human societal constructs [5]. Soundscape ecology can therefore be subdivided into two primary areas: the study of human-dominated acoustic environments, where human activities exert their influence on the “acoustic matrix”, and the remainder of natural areas, where the bioacoustic mosaic is not directly driven by human landscape modifications or disturbance.
The bioacoustic part of the acoustic environment is of interest as a proxy indicator of biotic activity. Methodologically, the bioacoustic approach identifies vocalizing species assemblages and acoustic communities for use as biodiversity assessments of focused taxonomic groups of indicator species, such as birds, frogs, bats, or insects [6]. When considering the number of acoustic communities interacting with each other, the community acoustic diversity [7] acts as a proxy for general species diversity or richness [8] in terrestrial habitats. However, in the urban and peri-urban environment, acoustic communities must compete not only against each other for acoustic niches in the sound space, but also against an ever-increasing extent of anthrophonic noise.
In the human-dominated acoustic environment, the discussion usually revolves around the control of noise due to the associated negative health outcomes of continual noise exposure on humans, including annoyance and stress [9], hypertension [10], myocardial infarction [11], stroke [12], atherosclerosis [13], depression [14], or the psychoacoustic perception of noise [15,16]. The EU Noise Directive [17] is a response to the burden of human noise exposure in light of growing urban regions. Germany has codified this directive within their spatial planning system as noise action plans [18] that aim to map the distribution of noise and affected human populations and protect quiet area resources threatened by urban expansion. The quiet area assessment is required as part of the noise action plan, for which best practices have been developed [19,20], but in practice there is no biophonic threshold value or reference value to rank quality of quiet areas.
Quiet area planning is also carried out upon the backdrop of land consumption in Germany that can be magnified at the municipal level [21]. This reality usually means that open spaces and natural areas in proximity to human populations are encroached upon, either physically or by noise emissions. A perfect illustration of the impact of this phenomenon is in Dortmund, Germany, where the extent of potential quiet areas reduced from 2500 ha to 2100 ha between 2014 and 2025 [22], and the city of Duisburg that allows quiet areas to exceed 55 dB(A). Additionally, the problem is not isolated to just the highly populated Ruhr region; it is found in the USA [23] and Australia [24]. Thus, there is compelling evidence that acoustic environments without anthrophonic intrusions are at risk.

1.1. Research Aims

In this study, we aim to summarize the existing concept frameworks for soundscape conservation and sound-related ecosystem services provided by green infrastructure and conservation areas, summarize how this information has been synthesized, conceptualized, or studied by other authors, and come away with what advances are needed in quiet area assessment to better address threats to remaining urban sound quality. To this aim, we conducted a scoping review [25] following a systematic search approach [26] with two broad Boolean keyword combinations of (1) “sound* OR acoustic AND landscape OR planning AND conservation OR preservation OR cultural AND green* OR vegetation AND NOT perception AND NOT visual”, and (2) ”soundscape conservation AND urban NOT marine”. The search was restricted to research papers and edited books in English, without any temporal constraint, on Scopus. The raw results (n = 309) were screened by title and keyword, excluding papers related to conservation or GI but not the acoustic environment (n = 136), the acoustic environment but not conservation or GI (n = 9), neither conservation nor GI nor the acoustic environment (n = 56), and policy papers not relevant to the effects of GI or conservation on the acoustic environment (n = 6).
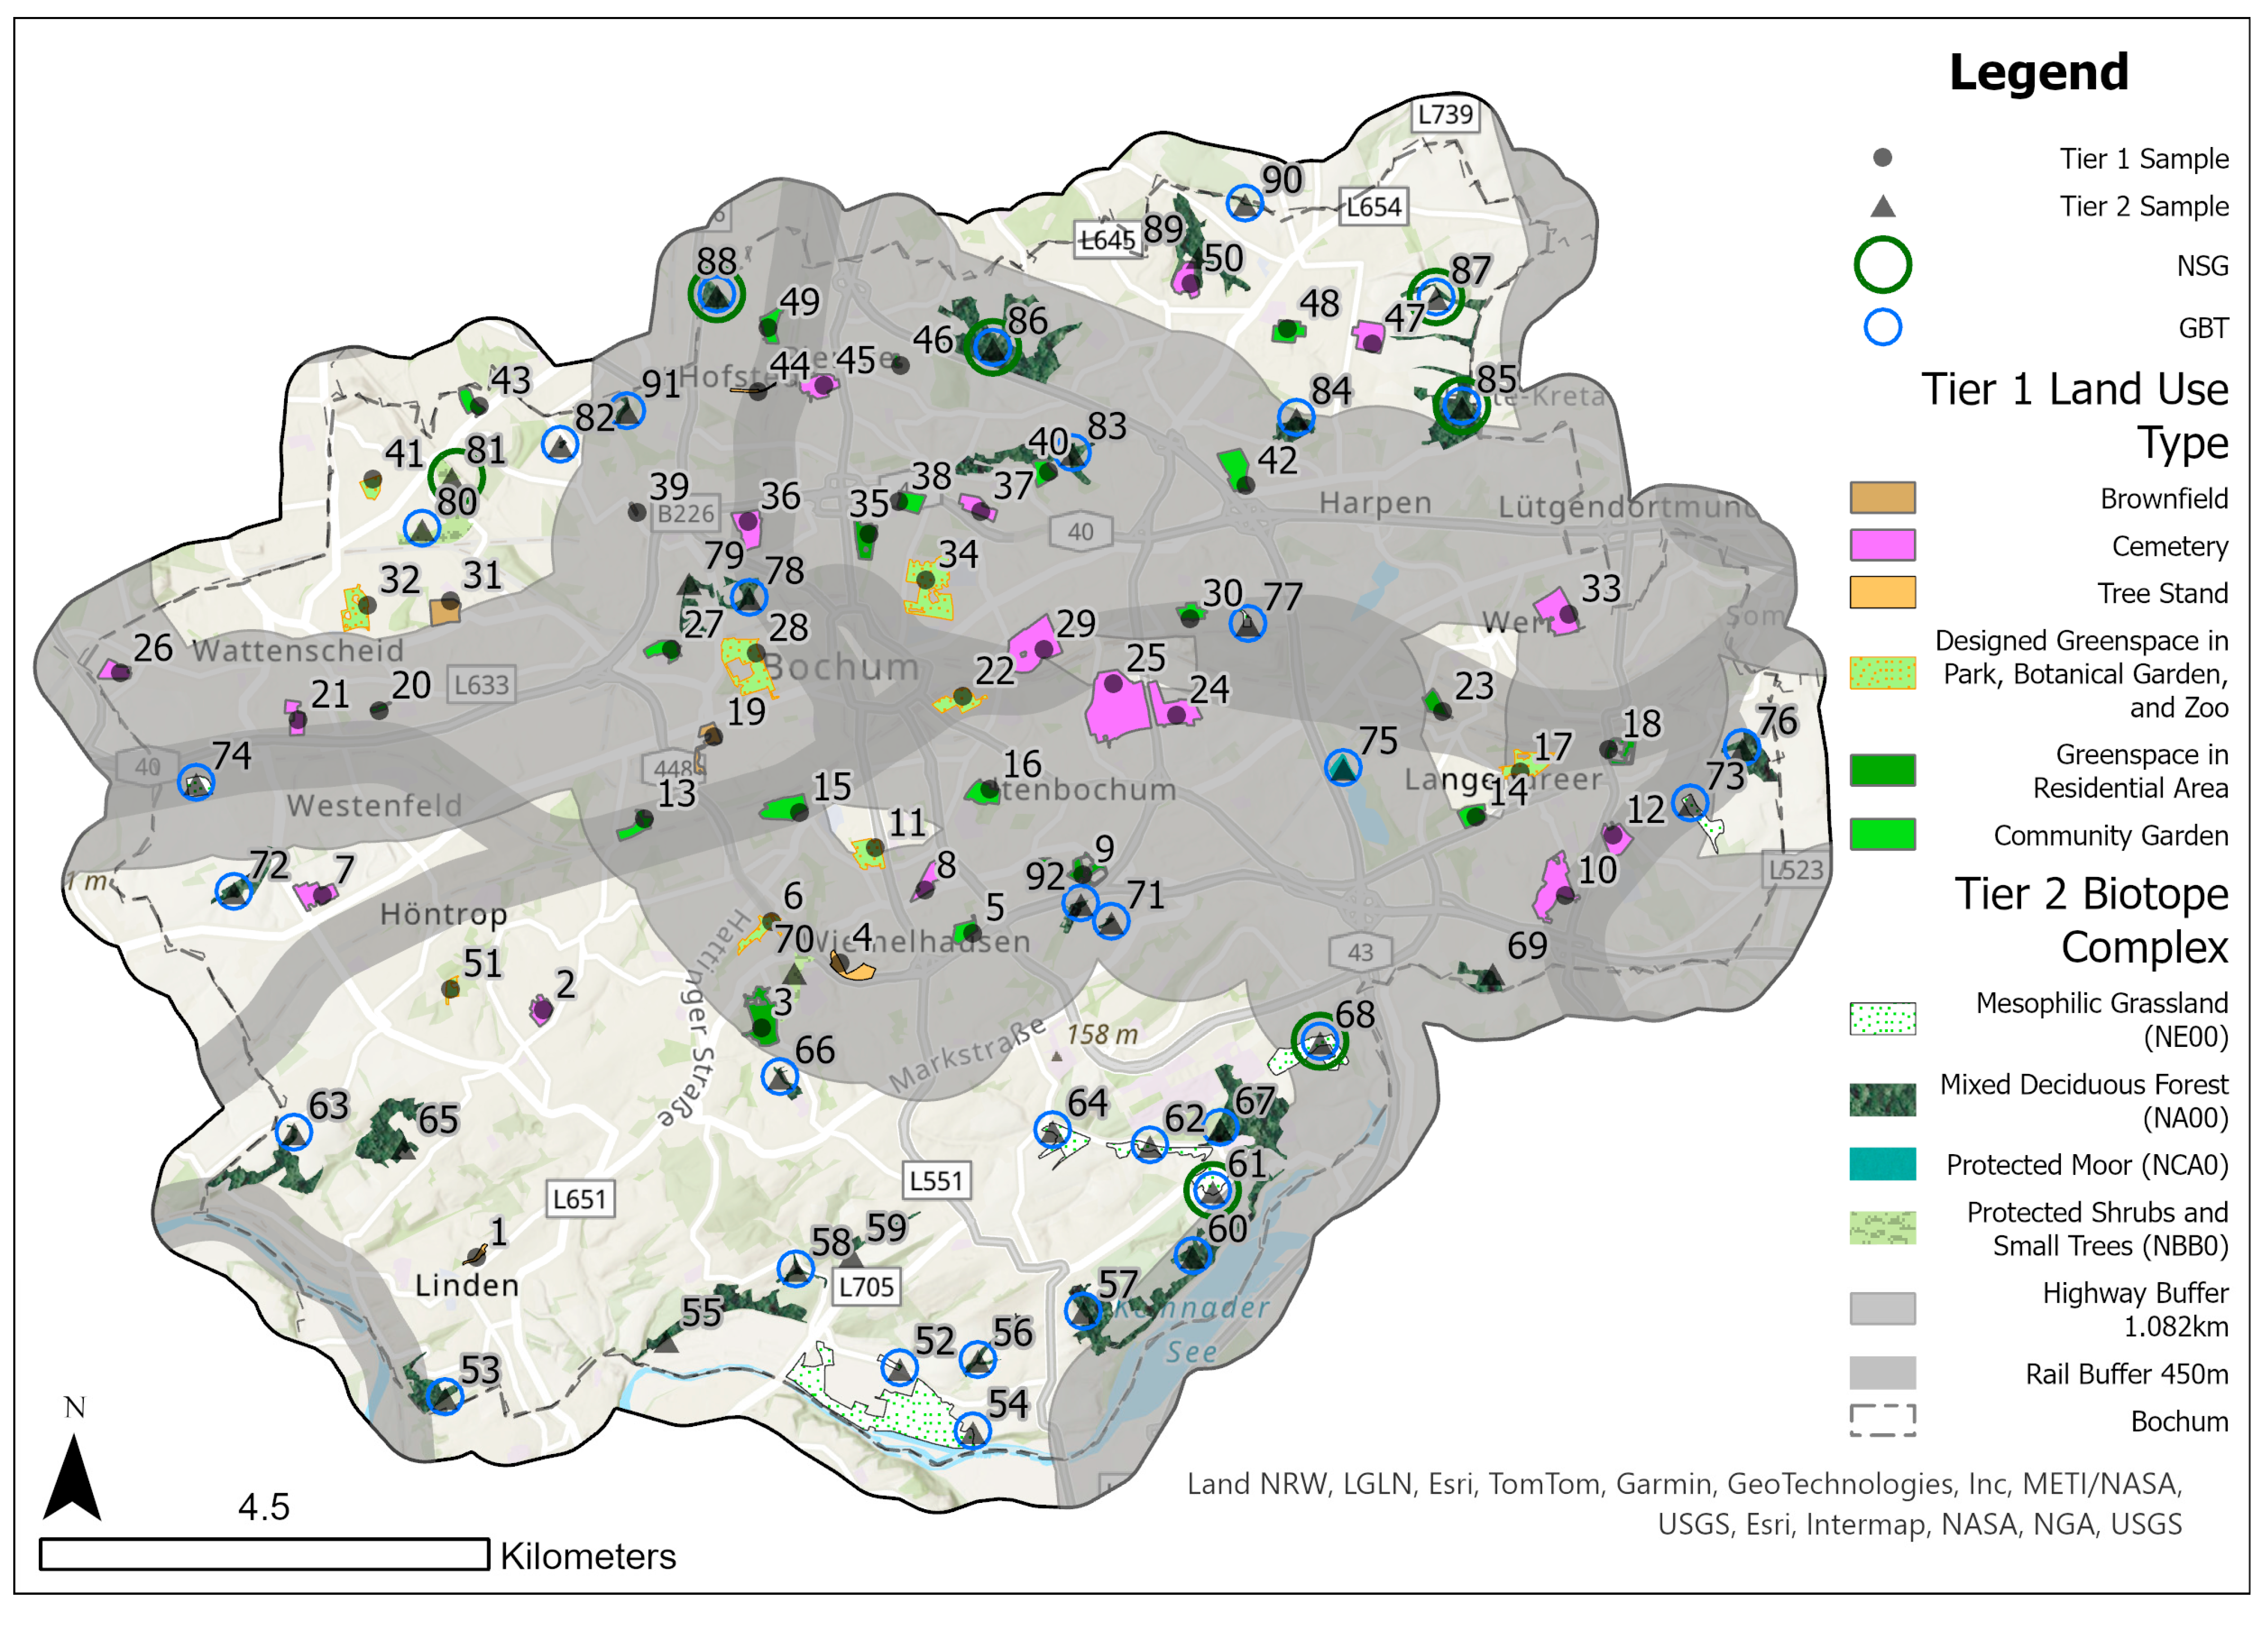
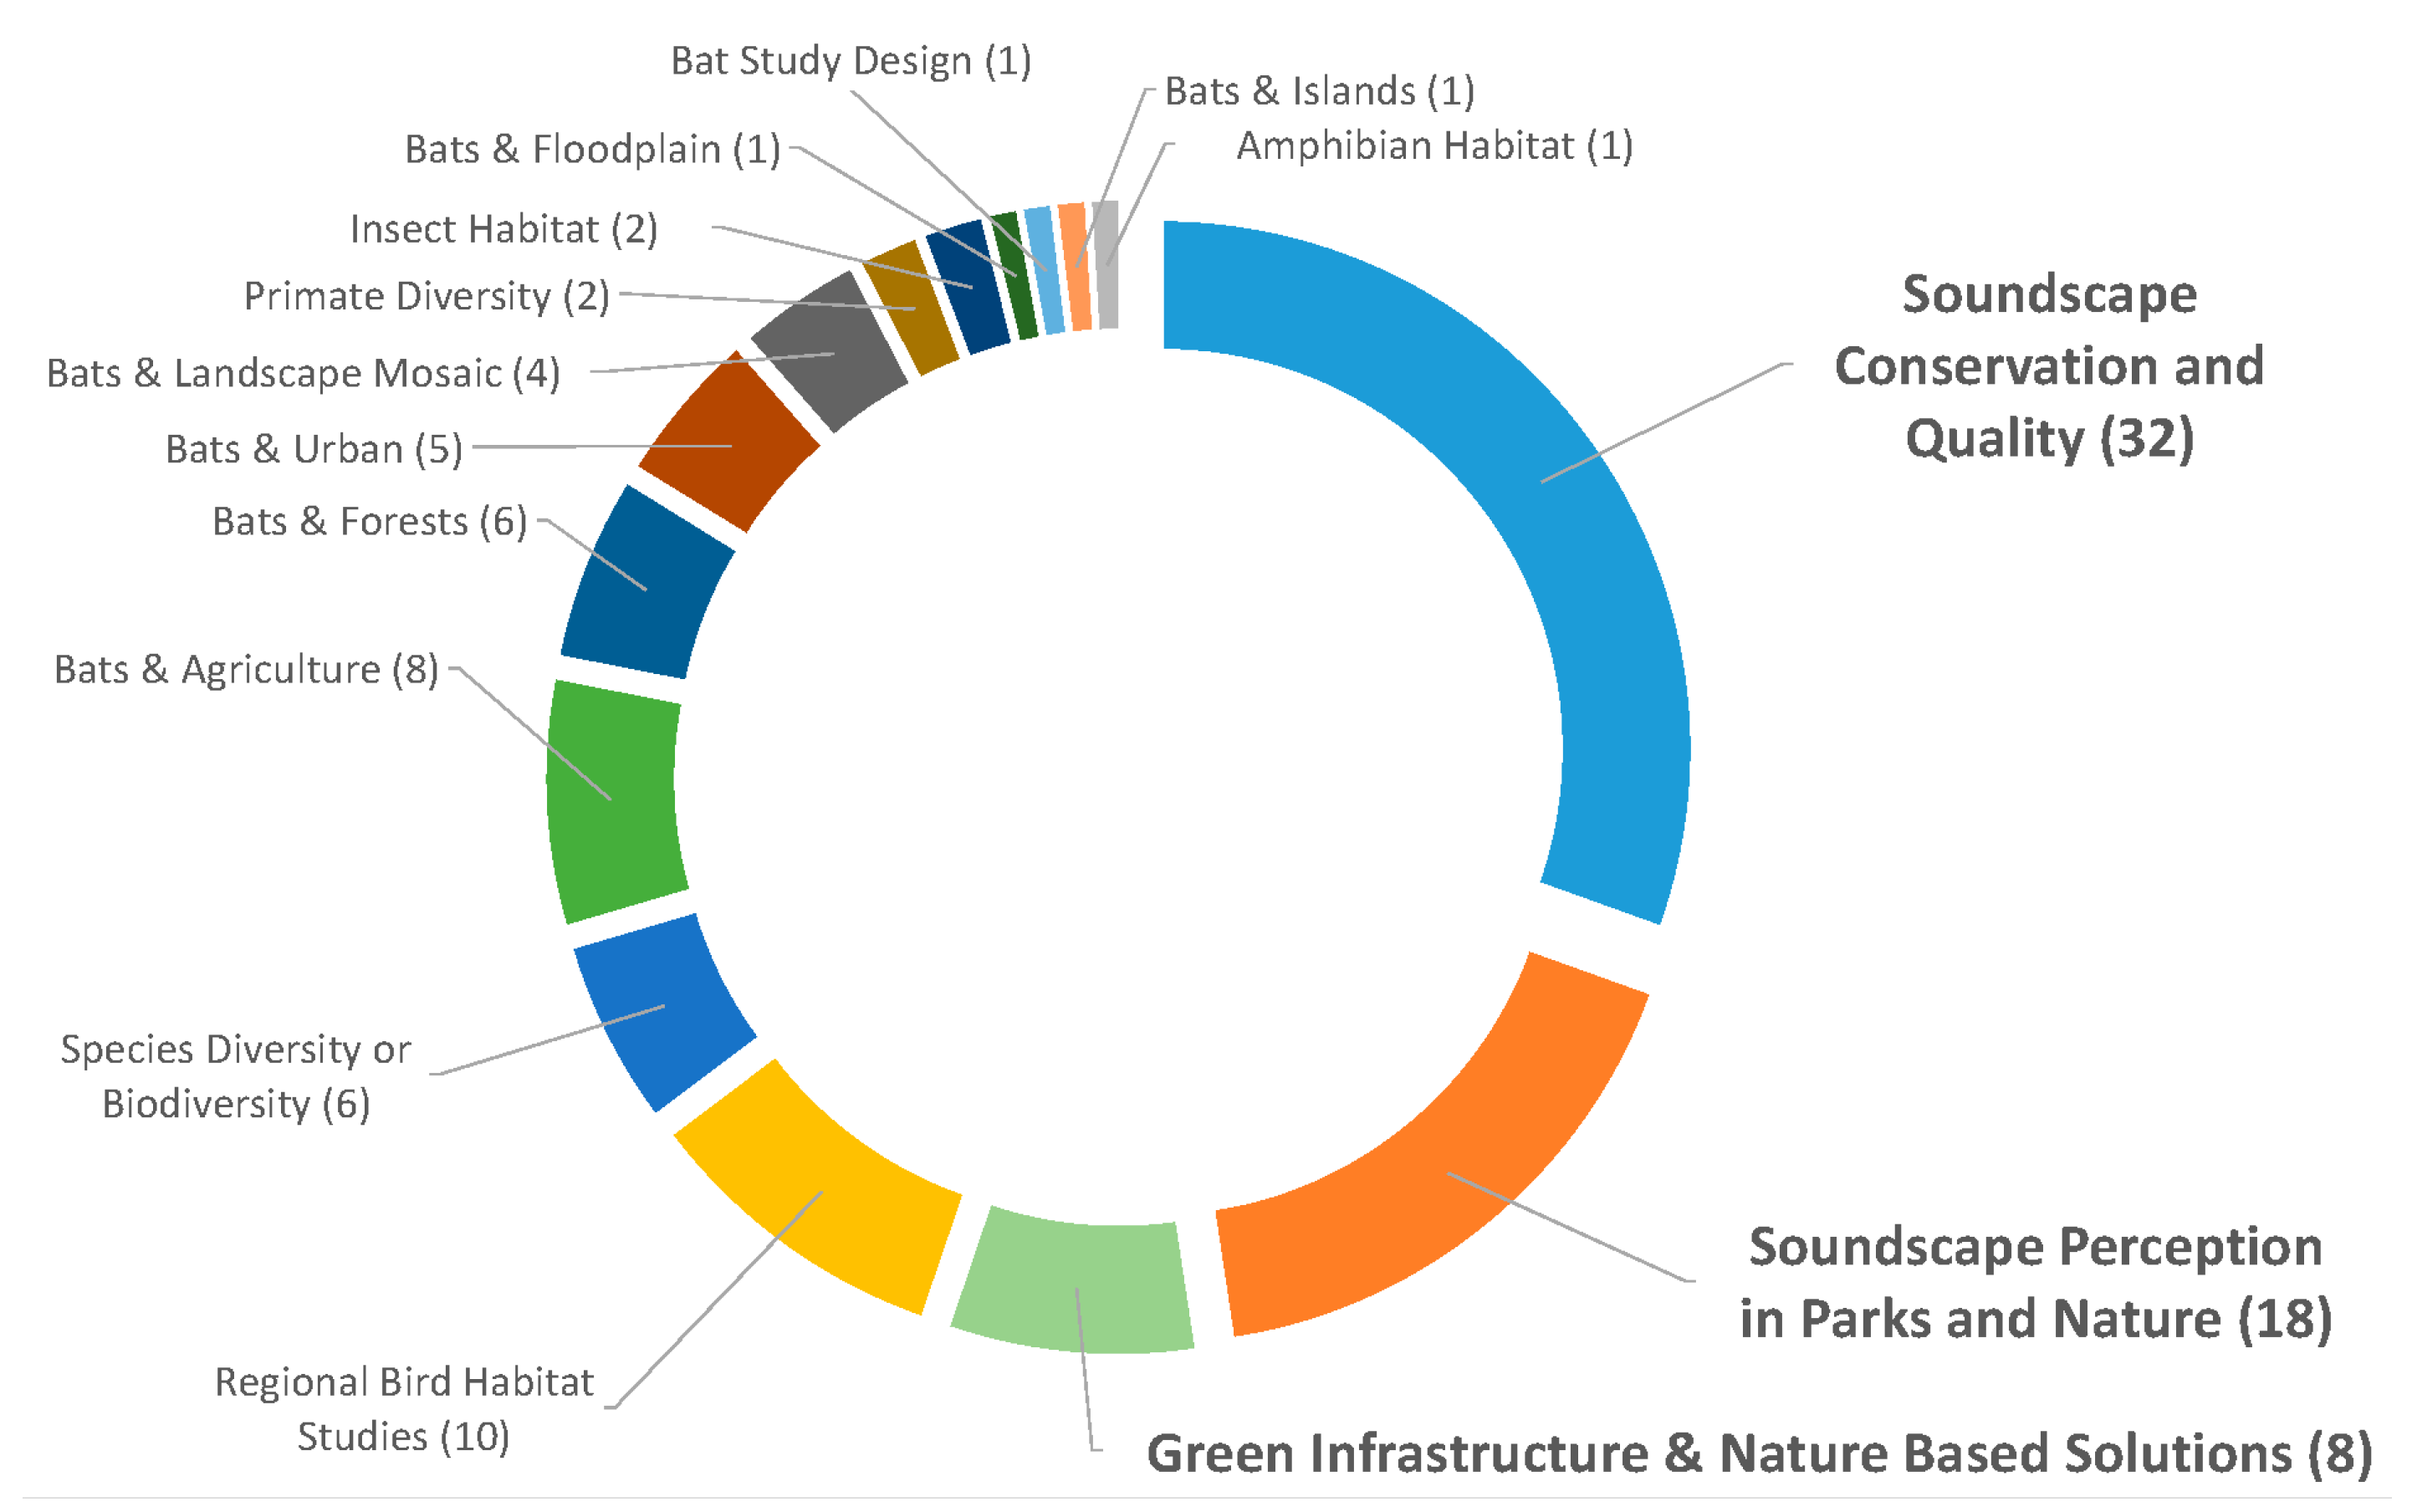
The remaining 104 relevant papers addressed aspects of the acoustic environment, soundscape, and conservation or GI. The 104 studies were further refined by title and keyword into the subcategories (Figure 1) of bats (n = 26), regional bird habitat studies (n = 10), primates (n = 2), insect and frog studies (n = 3), species diversity or biodiversity (n = 5), acoustic environment conservation and quality (n = 31), soundscape perception in parks and natural areas (n = 19), and green infrastructure and nature-based solutions (n = 8).
A summary of the literature review reflects soundscape ecology as described by Farina [1], containing elements of landscape ecology and the landscape mosaic and its relationship to non-human organisms; the investigation of psychoacoustics or human perception, especially related to urban and peri-urban park areas; the bioacoustics approach, focusing on the link between landscape configuration and biodiversity patterns or impacts on target species; and the acoustic ecology perspective, linking sound, nature, and human societal constructs such as conservation areas. To keep focused on the aims, we conducted full-text reviews on the 58 articles related to “soundscape conservation and quality”, “soundscape perception in parks and natural areas”, and “green infrastructure and nature-based solutions”. We applied snowballing to highly relevant articles, especially related to GI and ecosystem services.

1.2. A Concept Framework for Soundscape Conservation

One of the first frameworks for soundscape conservation [27] recommends targeting studies based on defined ecosystems, stratified by biotope or species of importance, with measurable management goals and the ability to assess an array of current areas specific to defined threats or objectives. The authors propose the soundscape categories of natural quiet, sensitive, threatened, unique, recreational, representative, cultural, and everyday soundscapes. Emphasis for soundscape conservation should be on high-fidelity, positively perceived soundscapes, which are especially important in human habitats where urbanization threatens a loss of audible connection to the natural world. Here, fidelity refers to the ability to hear what is happening in the immediate acoustic environment.
The US National Park Service (NPS) concludes that natural quiet areas range from 10 to 40 dB(A) for truly wild and natural protected areas. This category is particular for the USA, where huge tracts of truly remote land in the west exist without any human development. Guidance on European quiet areas required by the EU Noise Directive [17] for urban and peri-urban communities range from 50 to 55 dB(A), at least in the German Ruhr region [22,28]. Threatened soundscapes occur where high-fidelity conditions face encroachment from anthrophonic sounds, such as the urban fringe, the edge of large biotope patches, or into nighttime quiet hours. The edge effect of anthrophonic incursion was observed in two recent case studies in Massachusetts, USA and Naples, Italy [29,30]. Separate from edge effects, a number of studies have shown that habitat structure or stratification by biotope or conservation area [24,31,32,33] can influence acoustic environment outcomes. Bormpoudakies et al. [31] suggest that each habitat type has its own signature with accompanied adaptations. Here, representative soundscapes are a useful concept, serving as indicators for ecosystem or landscape health by measuring bird diversity, a relevant habitat quality measure to rank quiet area quality or thresholds. Our review did not find any studies that proposed “reference soundscapes”, which could be a gap worthy of further study in EU quiet area assessment. Everyday soundscapes connect us to natural diurnal rhythms such as vocalizing organisms. It is a relatable concept to assess GI and biotope networks designed to provide humans with relief from the bustle of the city or serve as biodiversity islands in the urban matrix. Practically speaking, these are the parks and open spaces near our homes used on a regular basis, and even though EEA guidance suggests such spaces can be as small as 1 ha [19], “urban oases” defined in Dortmund were limited to above 4 ha and isolated to formal urban parks. A network analysis of accessibility to quiet areas in the Dortmund NAP found numerous households not served by quiet areas of 4 ha or greater, illustrating the need for the designation of small “everyday quiet areas” in urban city quarters smaller than 2 ha to fill a spatial gap in quiet area service [22].

1.3. Green Infrastructure, the Acoustic Environment, and Sound-Related Ecosystem Services

Green infrastructure is “an interconnected network of green spaces that conserve natural ecosystem values and functions and provides associated benefits to human populations [34]”. Included in this interconnected network are waterways, wetlands, woodlands, wildlife habitats, wilderness areas, and other natural areas and open spaces such as greenways, parks, conservation lands, working farms, ranches, and forests. GI mirrors fundamental landscape ecology principles [2,35], where the structure of multi-scalar habitat patches serve as “hubs” to anchor wildlife population origins and destinations connected via corridors or “links” in a landscape mosaic that maintains natural ecological processes and functions [34]. We must then conclude that the two fundamental purposes of GI are the protection of fundamental ecosystem structure, process, functions, and non-human organisms on one hand and the provisioning of open spaces and ancillary benefits for human health and well-being on the other hand [36]. In GI networks, these two purposes often have a clear spatial division, with conservation areas generally located in places on the periphery or in absentia of human habitation, and urban open spaces by definition located within the urban-dominated matrix. This raises the question of how the acoustic environment in GI should be considered within and outside of the urban matrix. For this answer, a more detailed definition of the functions or services of GI is necessary.
The Millennium Ecosystems Assessment expands the notion of GI as the basis for purely ecological processes and functions to “ecosystem services” that create a linkage between ecosystems and human well-being, categorized as provisioning, regulating, cultural, and supporting services that underpin human well-being and poverty reduction [37]. The German landscape functions approach also includes both an ecological and human systems function to nature protection, including groundwater protection and recharge, water retention and soil moisture availability, the provision of recreation and urban open space, erosion protection and biotic yields, plant and animal habitat and biodiversity conservation, the protection of visual landscape quality, bioclimatological functions such as urban heat island reduction and evapotranspirative cooling, large-scale ambient noise attenuation, and the interconnection of all the above [38]. Finally, in Haines-Young and Potschin [39], an integrated concept framework for the ecosystem–human relationship as tiers in a service cascade emerges, where the presence of landscape structure or process preserves an innate landscape function necessary for the management or restoration of ecosystems and biodiversity. When the landscape function serves a purpose beneficial for humans, then it becomes a service that has a social or economic benefit for human well-being in the socio-cultural context. This approach is generally accepted in the scientific community [40]. To move from a conceptual model to an evaluation model, the cascade of functions can be organized into silos representing physical properties (biophysical structure or process), potential ecosystem offerings (functions), ecosystem services (service), socio-economical uses (benefits), and finally it is the user that assigns a value to the benefit. This organization conveniently depicts the cascade as a sliding scale from the physical–biotic ecological perspective on the left with the primary benefit attributed to non-human species, to the primarily socio-economic value that users assign to a service with a human benefit on the right [41].
Specific ecosystem services related to sound include the provision of natural quiet or wild soundscapes [27] that come from remote landscapes and serve the function of noise exclusion [33]. At the regional scale, greater spatial coverage of noise exclusion or GI areas lead to the function of anthropogenic noise abatement, contributing to county-scale quietness [33]. The provision of natural sounds can also be considered an ecosystem service of positive human perception [42], related to what can be called “connection to nature” [27,43]. This connection to nature may be facilitated by the presence of bird song, especially in protected areas, thereby enhancing positive soundscape perception [44] or well-being [45,46]. Based on the association of exclusion area and quietness [33], one could support the broad argument that the ambient quality of the acoustic environment is affected by the extent and composition of GI [31].
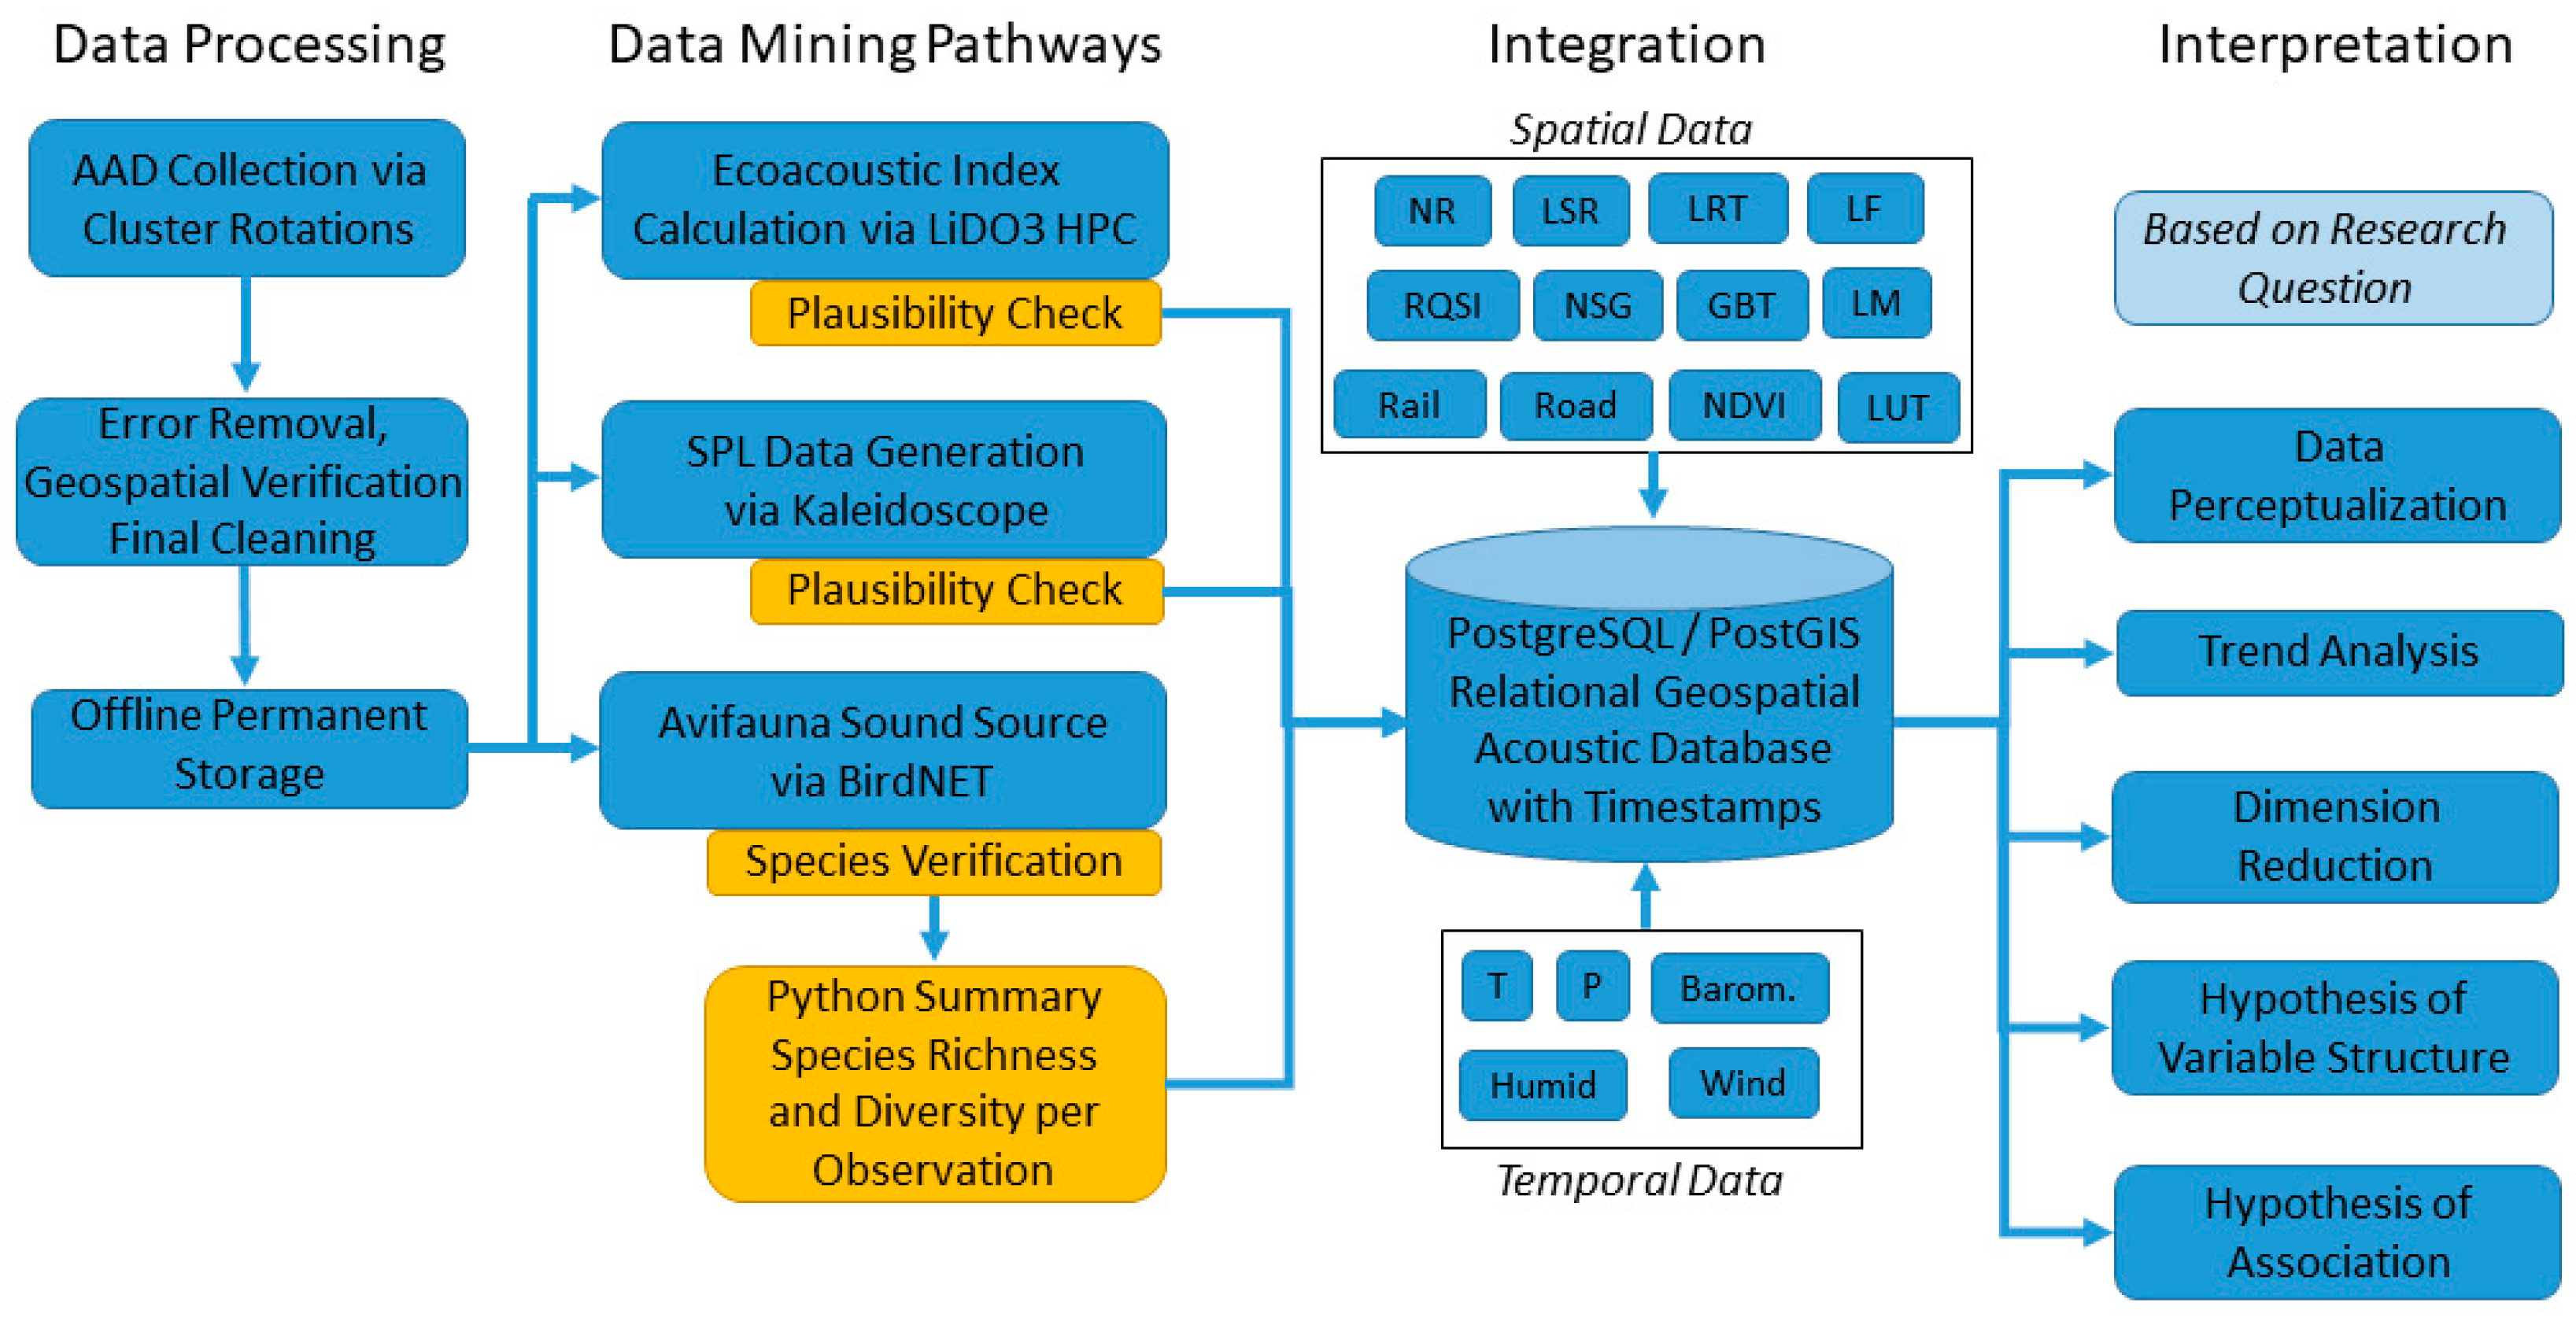
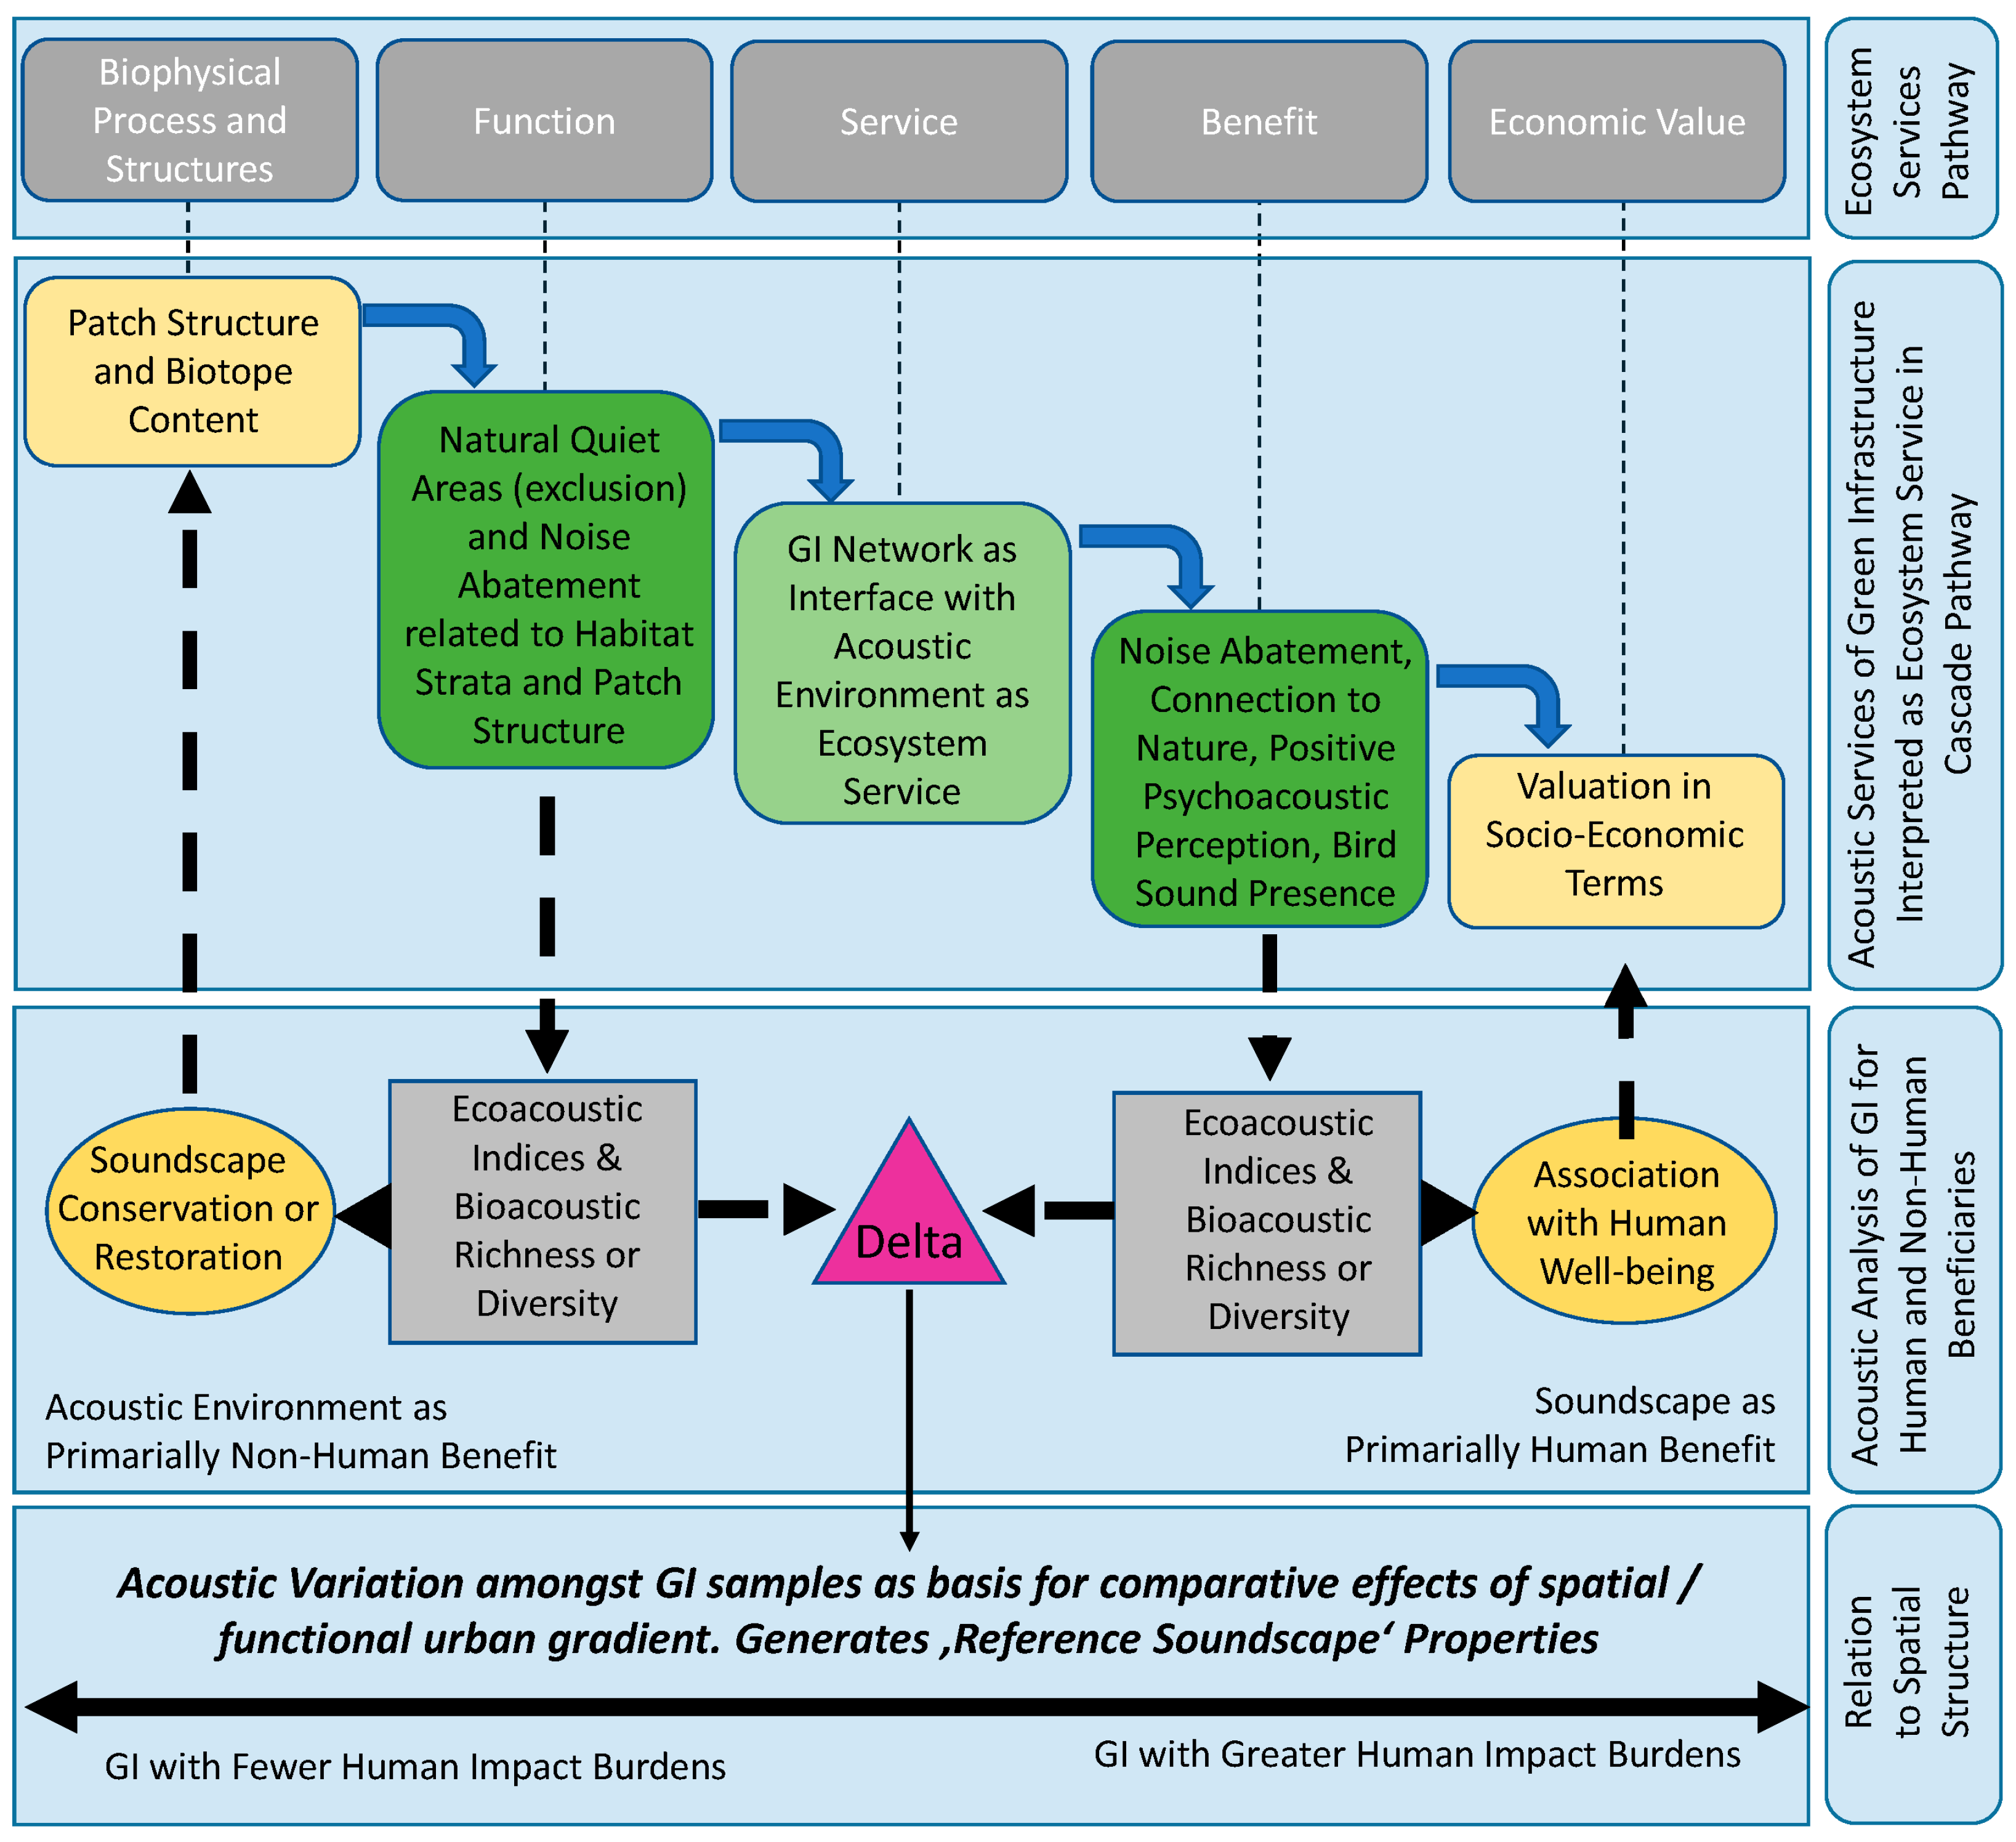
Figure 2 synthesizes ecosystem services in light of sound as a beneficial service for both human and non-human populations, linked via GI. The figure illustrates the ecosystem services pathway [47] and services cascade [39,48], with sound first integrated at the function step, referring to the provision of natural quiet or wild soundscapes or the abatement potential of GI extent. Spatially, these areas can be considered the nodes of resource provision in GI and are most likely related to habitat structure [29,31,49], serving as a relevant feedback for the assessment, planning, and management of open space and conservation areas. In the service step, the acoustic environment has a primarily human benefit interpreted as the soundscape [50] and is associated with the ecosystem services’ connection to nature, presence of bird sound, positive perception or well-being, and quietness. Here, the relevant soundscape typologies are everyday quiet areas associated with green and open space land uses, usually in the urban matrix, which are the focus of numerous studies found in our literature review [43,51,52,53,54,55,56,57]. The comparison of the soundscape between natural quiet areas and their urban counterparts is a pathway towards the generation of reference soundscapes where differences in acoustic community diversity, ecoacoustic indices, and SPL measures are relevant to establishing qualitative benchmarks. Finally, the position of GI amongst the urban matrix, ranging from GI with fewer to greater human impact burdens, is useful to explain acoustic outcomes.

1.4. Soundscape and GI Findings from Relevant Case Studies

Of the 19 case studies described in our literature review, only a few addressed the impact of GI on the acoustic environment. A county-scale analysis in the USA tested the effects of multi-level protected areas (PADUS-GAP), land ownership, and land development potential on average decibels. Conservation levels corresponded to wilderness or wild areas or national parks (GAP 1), conservation areas or scenic areas (GAP 2), state forests (GAP 3), and municipal recreation areas or urban parks (GAP 4) [33]. Their study found that only the highest level of protection status GAP 1 had a strongly significant positive effect on dB reduction (ß = 0.982, p < 0.05), and GAP 4 had a strongly significant negative effect on dB reduction (ß = −0.765, p < 0.05). These findings associate natural quiet areas with the functions of exclusion and abatement to GAP 1 and illustrate the limit to abatement in the GAP 4 results, where anthrophonic incursions from the urban matrix are simply greater than the GI abatement potential.
Another study in the US aimed to understand the association of anthropogenic pressure with the acoustic indices ACI and NDSI, split into constituent biophony and anthrophony frequency ranges [29]. These results conclude that the human edge was strongly negatively associated with ACI (r = −0.70, p < 0.05) and biophony range (r = −0.72, p < 0.05) and strongly positively associated with anthrophony range (r = 0.72, p < 0.05). ACI and biophony were strongly positively associated with habitat connectivity (r = 0.75, p < 0.05; r = 0.65, p < 0.05) and biophony with live vegetation cover as measured by NDVI (r = 0.72, p < 0.05), whereas anthrophony was moderately or strongly associated with habitat connectivity and NDVI. The results illustrate how proximity to noise sources reduces the overall noise abatement and exclusion services. Notable in this study is the use of a scale effect, summarizing spatial variables in concentric 500 m rings, to measure how the surrounding landscape matrix is exerting influence on a single area. In every case, a scale effect was observable when greater vegetation cover was present at 1.5 and 3 km radii, indicating the importance of exclusion and isolation as a basis for quietness.
A recent study in Australia sought to explain ACI outcomes based on spatial predictors that included vegetation description and patch size, anthropogenic disturbance, physical and hydrological measures, and aspect [24]. This study concludes that elevation and aspect, along with slope, ridge, distance to creek, and vegetation type, were all ACI predictors. In summary, these studies conclude that the distance from sound sources or scale effects define the overall anthrophonic or biophonic matrix that is then further differentiated based on habitat connectivity, proximity to anthropogenic edge, habitat types and their natural acoustic communities, and general landform factors that control sound distribution over the landscape.
The EEA has proposed a spatial model for EU-wide quiet area identification [20], the quietness suitability index (QSI). The QSI model is based on a binary fuzzy overlay of buffer zones away from noise sources (1) END major road, rail, and airport locations, (2) urban morphological zones (UMZs), (3) E-PRTR industrial locations, and (4) Corine land cover and land use, including urban, industrial, mined, or construction areas. However, this framework refers only to noise sources and does not include information on how the size and structure of biotope complexes interwoven with noise sources might affect noise abatement performance, or for which areas the connection to nature or psychoacoustic well-being performance might be greater or lesser. A recent German study aims to elaborate a framework for natural soundscape quality assessment [58], essentially going beyond the EEA QSI to consider cultural ecosystem services and human preferences and well-being, operationalized as vibrancy and calmness. The authors argue that such an approach is a useful incorporation of the positive effects of natural soundscapes in environmental impact assessment (EIA). However, the study bases calmness and vibrancy on spatial factors and does not validate their model with any sound recordings, SPL measures, or soundscape studies of vibrancy and calmness using the DIN ISO 12913 standard [50]. Nonetheless, the idea of including sound-related ecosystem services in the EIA instrument in Germany has merit and could be argued as an element of “landscape” according to the German Environment Impact Assessment Law (Gesetz über die Umweltverträglichkeitsprüfung) UVPG §2, which includes the element “landscape”. Although landscape up until now had referred to the visual landscape in the German EIA, it may be possible to interpret landscape to include the acoustic environment, or soundscape, as defined by Farina [1] and Pijanowski [59].
A recent systematic study on nature-based solutions (NBSs) and human well-being (HWB) in the UK that screened over 7000 studies found only 20 studies associated with the ecosystem services of soundscapes linked to urban green spaces [60]. The authors conclude that that the relationship between NBSs and HWB is not well understood and to date not thoroughly studied, supporting our conclusion that it is an area requiring further study. One place where such studies could be couched is within the German noise action planning, especially in heavily populated urban agglomerations where anthropogenic pressure is affecting quiet areas, as illustrated in Dortmund [22]. The EEA has provided guidance on quiet area identification and noted that criteria could include health protection/restoration and perceived acoustic quality and mentions the potential benefits of biodiversity; however, the only method currently elaborated by the EEA is the spatially based source indicator QSI. We argue that a quiet area assessment method aimed at qualifying the bioacoustic and noise abatement properties of GI and assessing where anthrophonic sound sources threaten high-quality quiet areas would be a valuable contribution to the current state of knowledge and necessary for the refinement of German noise action planning.

1.5. Habitat-Based Quiet Area Assessment for Urban Regions

If GI serves as a spatial reserve for critical ecosystem services such as biodiversity, water infiltration, plant community preservation, etc., then we could also expect that GI provides the preservation of naturally quiet acoustic environments, noise abatement of surrounding source pollution, and connection to natural rhythms such as morning and evening chorus, all of which may in turn contribute to human well-being. The use of GI as a framework upon which to analyze the urban–rural gradient will fill the gap in understanding how GI shapes the acoustic environment of urban regions and help to define reference soundscapes for urban soundscape quality. Following the habitat-stratified approaches illustrated by past studies [24,31,61], we argue that quiet area assessment must follow a habitat- and landscape-unit-based sample approach. We propose longitudinal sound measurements in GI types across diverse landscape units, including a range of sizes and types of natural biotopes relevant for noise action planning, recreation infrastructure, protected areas, and brownfields located within varying urban and conservation contexts. The multi-tier PADUS-based soundscape findings in the USA [33] are relevant to the German context, where nature conservation and biotope databases are stratified by levels of conservation or protection and where protected biotope areas are typically located within larger nature protection areas. Especially important is the potential for improved quiet area assessment frameworks to identify threatened, naturally quiet, and reference soundscapes [27], indicating that measures of sound pressure, sound source, frequency description, habitat quality, and spatial descriptors must be included. Based on the gap we describe above, improved quiet area assessment methods must address a few broad questions, including:
  • What is the relationship between green infrastructure and the acoustic environment in urban regions, and how do landscape ecological and green infrastructure factors contribute to sound-related ecosystem service outcomes?
  • To what degree, if any, can we characterize urban and exurban green infrastructure as providing relief from noise and the anthrophony-dominated urban acoustic environment?
  • How can this research facilitate integration of threatened, natural quiet, and reference soundscapes into EU or German noise action planning?

2. Materials and Methods

2.1. Case Study Bochum Within the Ruhr Region, Germany

To address the gaps in quiet area assessment in German noise action planning, we present the sample design strategy in our ongoing study centered on Bochum, in the German Ruhr region, Germany’s largest and most densely populated urban agglomeration (Figure 3). The Ruhr region offers a compelling study area with a high degree of physical, ecological, urban development, and socio-economic diversity. Several past studies have used this region as a living laboratory for cross-discipline research, including the Heinz-Nixdorf Recall (HNR) study [13,14], ZUKUR [62], and SALVE [63]. According to the EEA’s quiet soundscape indicator (QSI) shown in Figure 3, the Ruhr region is a contiguous area of noise pollution (QSI value 0) with suitable quiet areas over the recommended spatial threshold of 10 m2 located in a few sparsely inhabited areas in the north–northwest portions of the region and generally around the fringe [20]. According to the QSI, urban populations in the core of the region do not have access to any measure of respite from noise generated from a mix of urban agglomerations, rail and road networks, industrial areas, and continuous and discontinuous urban land uses. Although noise polluted according to the QSI, 61% of the Ruhr region is green and contains well-developed GI corridors [64], which according to the studies mentioned above must provide some level of sound-related ecosystem service. To understand this seemingly intractable contradiction, we focus our study on Bochum, in the heart of the region, and its three intersecting landscape units (“Naturräume” (NR)), comprising part or all of 10 cities and more than 2 M people, to understand the association between GI and the acoustic environment. High sample density is focused on Bochum to leverage the existing SALVE sound dataset [65], collected primarily for residential areas, as a counterpoint to sound data collected in GI areas.

2.2. Three-Tier Sample Design Strategy

Following a habitat stratification procedure [27] and multi-tier conservation area approach [33], we use a three-tier stratified sample design to drive data collection. Tiers including GI in urban core areas (tier 1), GI areas in Bochum on the urban periphery listed in the protected biotope database (tier 2), and protected biotopes and nature protection areas in NR intersecting but adjacent to Bochum (tier 3). Sample selection for tier 1 locations is based on a stratified land use sample as applied in SALVE [65]. However, given the aim to sample “reference soundscapes”, tiers 2 and 3 sample procedures follow a multi-step process to locate a single sample point amongst a large sample frame and with a relatively small sample pool. This approach ensured selection of the largest and most remote locations and kept selection in-line with EU quiet area selection guidance [19,20].

2.2.1. Sample Tier 1: Land-Use-Based GI Samples in Bochum

Tier 1 samples urban and peri-urban GI within the city of Bochum covering a broad range of urban GI and recreation typologies. From the total population of all land use parcels in Bochum, a sample pool of passive green and open space land uses including brownfield, cemeteries, designed park, botanical garden or zoo, green spaces in residential areas, and community gardens over 2 ha was generated. Sport and active recreation areas were not included, as GI based on findings from the neighboring city of Dortmund that the biophony index and diel patterns in active recreation areas are more similar to noise polluted areas than quiet areas [66]. The sample pool was sampled to a confidence interval of 90%, with an estimated error of 5% following [67], resulting in a required sample size of 50 (Equation (1)). Using the NOAA sample design tool add-on, the 50 samples were distributed following a land-use-stratified procedure in ArcGIS. In the first deployment (spring) one SM4 device was placed in a designed park rather than a pre-defined tier 1 target. We kept this addition, bringing the final tier 1 sample to n = 51 (Table 1). Once multi-part polygons were exploded to single part features to calculate patch size, we found that one brownfield, one community garden, one green space in a residential area, and both tree stand samples ended up being less than 2 ha. We left these small patches in our dataset to test the potential of everyday quiet areas under 4 ha (Figure 4).
n o = ( Z 2 p q ) / e 2
where:
  • no = the number of resulting samples;
  • Z = the confidence level;
  • e = margin of error;
  • p = the population within a given land use stratum;
  • q = a constant of 1 − p.
Table 1. Stratified tier 1 land use samples in Bochum.
Land Use StrataSample Size
Park, Botanical Garden, Zoo9
Green Space in Residential Area6
Cemetery16
Community Garden14
Brownfield3
Tree Stand 13
1 Due to access restrictions, two community gardens and one brownfield were sampled in the adjacent land use polygon (tree stand), within a few meters of the target land use polygon. For transparency, we place these in a separate category.

2.2.2. Sample Tier 2: Biotope Complex-Based Soundscape References in Bochum

The aim of tier 2 was to sample large GI areas of contiguous natural forest, grassland, and wetland communities within Bochum as a comparison with the designed urban GI in tier 1. To calculate sample size, we started with the sample pool of all areas in the LANUV biotope Cadastre (“Biotopkataster”) within Bochum greater than 4 ha (n = 92). following the city of Dortmund 4 ha breakpoint for urban quiet areas (“Stadtoase”) in their 2025 noise action plan [22]), then calculated the sample size based on a confidence level of 90% and margin of error of 10%. To maximize SM4 device deployment, we added one location to tier 2 to bring the total sample to n = 41. For selection of the 41 samples out of the sample pool, we used a combination of stratified purposeful and random sampling [68]. We prioritized patches in the sample pool that contained a LANUV protected biotope [69] or nature protection area (“Naturschutzgebiet” or NSG), or both, resulting in thirty-four patches that became the core tier 2 sample. The last seven samples were randomly selected from the remaining sample pool using the NOAA sample design add-on. Using the biotope database, we classified the resulting 41 samples by biotope complex, or “Lebensraumtyp” (LRT), defined below in the data and data analysis section (Table 2).
Although the tier 2 LRT strata appear simple in the above list, the reality is that each patch was usually an internally heterogeneous mix of biotopes from edge to interior. This presented a challenge when determining where exactly to place the SM4 device for acoustic sampling. To overcome this challenge, we located the SM4 recording device within or directly adjacent to a LANUV protected biotope, or “Gesetzlich geschützte Biotope” (GBT), within the sampled LRT. The benefit of this approach was two-fold: First, it narrowed down the exact SM4 device location to a small and precise polygon within the LRT, and second, the protected biotopes include a legal designation with detailed plant community description to associate with acoustic variables in subsequent steps (Table 3). Therefore, all tier 2 samples contain a double identifier of both LRT and GBT, for example, Holocene Springs (GBT §FK2) within Mixed Deciduous Forest (LRT NAO0). This approach results in a large variety of sample locations within the five LRT strata. For the seven LRTs without a GBT, we used the Create Random Points tool in ArcGIS Pro to determine the SM4 location within the LRT and consider only the LRT description (Figure 4).
Figure 4. Tier 1 and 2 sample locations, land uses, and biotope complexes (Author’s own work).
Conservation 05 00022 g004

2.2.3. Sample Tier 3: Biotope-Based Soundscape References

Tier 3 samples are natural biotopes outside the city of Bochum that are not within EEA estimated areas of highway and rail noise [20]. The aim of tier 3 is to identify “reference soundscapes” that serve as benchmarks for acoustic environmental quality. Spatially, these samples represent the largest, most remote, and most unique acoustic environments in the study area, where the assumption is that biophonic sounds dominate due to fewer human impact burdens than in tiers 1 and 2. The sample pool extends to all three NRs intersecting Bochum as depicted in Figure 3, excluding the city of Bochum, derived with a two-step process. In the first step, all LANUV biotope Cadastre areas larger than 1 km2 were extracted, and then areas intersecting the 1 km state and federal highway buffer were erased following recommendations for “quiet area” identification from the EEA [19,20], leaving 29 possible sample location. Because we had 28 SM4 devices available for this tier, we eliminated the smallest sample in the pool to arrive at n = 28 sampled LRTs. Within the target LRT, the Create Random Points tool was used to locate points first within a GBT contained by an LRT, then in LRTs with a NSG but without a GBT, then again randomly in the remaining LRTs (Table 4 and Table 5, Figure 5).

2.2.4. Automated Data Collection, Rotations

Data collection with Wildlife Acoustic Song Meter 4 (SM4) devices followed a rotating procedure of automated and programmable observations [66]. In each sample location, an SM4 device was placed on a tree with a rubber-coated steel cable lock for three weeks (a rotation). The SM4 was programmed to make a mono Windows Audio (WAV) file recording at 44.1 kHz and 16 bits for three minutes in duration every seven minutes, with every sixth recording staggered by an additional 30 s so that each device deployment location samples every minute of the day at least once. This technique ensured data saturation of at least 120 h of continuous recording at each sample location as recommended by [70]. At the end of each rotation, data were collected, and devices were re-deployed to sample a new area with fresh batteries and a cleaned and formatted SD card. All 120 locations were sampled this way for each season in 8 rotations of 15 devices (a cluster) per rotation. Routes between sample points in a cluster were optimized with ArcGIS Network Analysis and an Open Street network dataset (Figure 6). In total, this procedure produced around 1.3 million WAV observations across 480 single song meter deployments. The data collection period started on 21 March 2024 and ran through 21 March 2025. Due to technical problems with SD cards and batteries, we either did not collect a full 120 h of data or completely lost data at 7.7% of all sample locations, affecting spring (24), summer (17), fall (8), and winter (13). To make up for this shortfall, we are re-deploying SM4s at these locations throughout 2025, in parallel to data model development and exploratory analysis. Microphones were calibrated to 94 dB at 1000 Hz at the beginning of deployment and the value programmed into the SM4 so that subsequent dB(A) generation in Kaleidoscope automatically took the calibration value into account.

2.3. Data and Data Analysis

Our data analysis combines the multi-factorial approach described in SALVE [63] with the emerging soundscape analytics approach illustrated as a data processing, data mining, integration, and interpretation pipeline [71]. Our specific soundscape analytics approach includes collection of WAV data clusters as described above (processing), generation of ecoacoustic indices, sound source, and SPL measures from the WAV data (mining), integration of the mined acoustic data with five weather parameters and an array of landscape ecological data via sample location, and finally interpretation of the spatial-acoustic data while accounting for weather phenomena. We aim to organize the data using a PostgreSQL relational database to facilitate the large number of input tables and to generate the different data frames necessary for interpretation (Figure 7). The detailled development and application of the soundscape analysis pipeline is part of our ongoing research that will be summarized in a future publication.
The ongoing data interpretation phase is focued on hypothesis testing and a few specific analysis approaches aimed at answering our specific research questions, including:
  • Hypotheses of association with correlation, multiple linear regression, or geographically weighted regression to test influence of independent spatial and ecological factors on dependent acoustic outcomes (RQ1);
  • Factor analysis to narrow the focus of sound and spatial factors as described below, with hypothesis of variable structure and cluster analysis to identify locations where anthrophonic incursions are observed (RQ2);
  • Temporal analysis such as the diel pattern and the analysis of variance of acoustic outcomes over temporal and seasonal dimensions to identify similar performing GI types as well as outliers that may be considered reference, threatened, or degraded soundscapes (RQ3).

2.3.1. Spatial Data Measures

A rich array of landscape ecological data is available for our study area. As depicted in Figure 7, we aim to integrate a wide array of spatial data, including:
  • The physiographic unit, or “Naturraum” (NR) (Figure 4) defined as a natural unit understood to be a physiographically (i.e., geologically, geomorphologically, climatically, pedologically, hydrologically) delimited landscape unit with a holistic character;
  • The landscape unit, or “Landschaftsraum” (LSR), that takes into account the human shaping of the landscape in the past and present, including cultural and visual factors [72];
  • The biotope complex, or “Lebensraumtypen” (LRT) defined as a functional unit at the landscape scale composed of many different biotopes (https://bk.naturschutzinformationen.nrw.de/bk/de/glossar/lrt, accessed on 2 February 2025). This unit forms the basis of tier 2 and 3 habitat samples. A range of spatial criteria are generated from these polygons beyond just area, including perimeter length, placement of sample on edge or core of LRT, and classification within the LANUV biotope network (§§20 &21 BNatSchG);
  • A range of landscape functions (LFs) [38] to determine the effect of single or multiple overlaid LFs (Section 1.3) on acoustic outcomes.
  • Landscape metrics (LMs) to quantify landscape and biotope complex structure including patch shape complexity, aggregation, subdivision, isolation, or connectivity [73];
  • Protected biotopes (“Gesetzlich geschützte Biotope” (GBT)) defined as “certain parts of nature and landscape that are of particular importance as biotopes (https://www.bfn.de/gesetzlich-geschuetzte-biotope, accessed on 2 February 2025)”.
  • Natural protection areas, or “Naturschutzgebiete” (NSG), defined as legally binding areas designated under §23 of the German Federal Nature Conservation Act (BNatSchG), in which special protection of nature and landscape is required in their entirety or in individual parts. Alongside national parks, they are among the most strictly protected areas in Germany. This category of protected areas has existed since 1920;
  • Distances away from the centroid or centerline of all QSI model factors [20] as listed in Section 1.4, summarizing the human impact burden around GI locations.
  • Normalized difference vegetation index (NDVI), calculated from Landsat TM9 and pan-sharpened down to 15 m spatial resolution.

2.3.2. Acoustic Measures

Ecoacoustic indices (EIs) link soundscape ecology and bioacoustics [1,5,74,75] and are commonly used in terrestrial and aquatic habitats to define soundtopes and soundscapes of differing human and non-human acoustic compositions. EIs combine amplitude, frequency, and time using various formulas to describe attributes of the acoustic environment, such as heterogeneity, evenness, complexity, diversity, and comparative dissimilarity or similarity. Bradfer-Lawrence et al. [76] estimates that over 60 various acoustic indices have been proposed to date. Especially interesting for sonotope, soundtope, and acoustic community assessment in urban regions are the use of EIs to determine the distribution of “biophonies” and “anthrophonies” [59]. These refer to higher-frequency animal vocalizations and natural sounds generally in the 2–8 KHz range and lower-frequency anthropic and technological sounds in the 1–2 KHz range, respectively. Tuning EIs to the specific frequency ranges of animal or insect calls in a sampled area is a recommended best practice [6] that can be carried out with the machine learning program BirdNET [77] and accomodated in the indices NDSI and BIO [75].For this project, we applied a wide array of alpha ecoacoustic indices that were compiled into a single R script [65] following [75] and processed via the LiDO3, a high-performance computer at the TU Dortmund University, Germany. Wildlife Acoustics Kaleidoscope [78] was used to generate dB(A) values.
In the study area, birds are one of the most common vocalizing species, with pronounced morning, daytime, and evening vocalizing patterns based on land use type [66]. Emerging studies are applying BirdNET as an indicator for species richness and diversity [79,80] and to evaluate bioacoustic qualities in urban environments. We are currently using this tool to estimate the total number of bird vocalization occurrences in an observation, the diversity of species identified, and the richness of the different identified species.
Recent studies have linked the psychoacoustic outcomes [50] of calm, pleasant, chaotic, and annoying with natural sound sources and traffic with the EIs M, AR, NP, and AEI [81]. Haselhoff et al. [82] aimed to group a large array of acoustic indices with green space characteristics and found that the dimension of sound volume (LAeq), the persistence of volume (M), and acoustic dominance or “fidelity” (NP) are most closely associated with green space, and thereby associated with positive soundscape assessment. Fidelity is one of the acoustically related ecosystem services provided by natural quiet areas, thereby reinforcing the use of NP to assess this service in association with GI [27]. SPL measures are also linked to noise annoyance [83,84,85].
Finally, following our work on SALVE [65] we aim to integrate a range of weather data gathered the German Weather Service (DWD) station at Essen-Bredeney in the southwest corner of our study area near tier 3 location 101. These data were time-stamped every hour and include temperature (T), precipitation (P), barometric pressure (Barom), wind speed (Wind), and humidity (Humid). Since both weather data and acoustic data are time-stamped, the data can be linked by hour of day in the PostgreSQL database.

2.3.3. Data Protection

Field data collection was conducted in compliance with the German Data Protection Act and all other legal regulations relevant for data safety. In accordance with the recommendations of the Federal Office for Information Security (BSI), unauthorized access will be prevented with high levels of information security. Members of the study have signed a data privacy policy to act in accordance with data protection laws.

2.3.4. Quality Assurance

To ensure a clean and consistent dataset that represents our sample target, we followed a data collection and archiving protocol. Site anomalies such as adjacent construction sites were marked on field data sheets when hanging and retrieving devices. The field data collection team was trained to operate the SM4 device, fill out the field data sheet, sink GPS locations, and navigate to predifined sample locations prior to field work and during the first two deploy and first retrieve rotations. Given the data restrictions in Germany, we cannot listen to the data to verify its contents, plus there are too many observations for such an approach; rather, we followed a visual data archive procedure for every SD card from each rotation. Here, spectrograms of WAVs from the beginning, middle, and end of an SD card batch were reviewed for errors (i.e., no data) or anomolies. When an error or anomoly was noticed in the review phase, the extent of the error or anomoly was fully evaluated and documented on a cluster rotation summary sheet by time and date range in affected SD card batches. The most common irregularity noticed was a tick generated by the Song Meter as the battery level got low, which we were able to see in the spectrogram towards the end of affected SD card batches. As mentioned above, 7.7% of the 2024–2025 WAV dataset contained anomalies that inhibited a full 120 h of observations and these locations are currently being re-sampled through 2025.

3. Results

The resulting multi-tier sample is designed to test the effects of landscape formation, urbanization, and biogeographic factors on the acoustic properties of GI across a wide urban–rural land use gradient. Predictably, the largest number of samples lie in the “Westenhellweg”, where the city of Bochum is located, followed by the “Bergisch-Sauerländisches Unterland” south of Bochum where less human impact burdens exist, and then “Emscherland” to the north of Bochum that contains a large human population and a dense road network (Table 6). As with NR, the sampled LSRs are concentrated in the “Westenhellweg” and “Tal der Ruhr zwischen Mülheim und Witten”, where Bochum is located (Table 7).
The LRTs identified in tiers 2 and 3 are indicative of the Ruhr region, where large contiguous natural tracts are dominated by mixed hardwood deciduous forests. A smaller number of remaining mesophilic grasslands and only a few large-scale examples of large wetlands or protected moors were identified (Table 8). Of course, reducing the area thresholds for tiers 2 and 3 would have yielded a larger number of LRTs and possibly enabled a larger number of samples per LRT. However, the aim of tier 2 and 3 in this study was to find the larger and more remote LRTs that could serve as reference soundscapes against the assumed more anthrophonically dominated tier 1 samples. Thus, our explorative study aims to sample a wide range of GI to identify broad patterns or outliers to help inform future research pathways that may include more detailled or smaller scale studies.

4. Discussion

4.1. The Sample Design in Light of Past Studies

The seminal study on the acoustic gradient in urban regions [86] found that month and time of day, urbanization, and distance from heavy traffic volume were significant predictors of biophony, while agriculture and park were not significant predictors. A more recent study of the biophony and anthrophony gradient [87] found a gradient in percent biophony (PB); however, most GI sampling locations were focused on trees or herbaceous vegetation without links to specific plant community information. Further, data in [87] were temporally limited to five recordings in winter and early spring between 14:00 and 18:00, thus limiting the potential information related to seasonal and temporal effects that Joo et al. [86] found significant. Both studies employed bird species identification, and Joo et al. [86] found an inverse correlation between anthrophony and bird species richness, although they did not find significant differences in bird species diversity indices amongst their sampled land use types. Supporting Joo et al. [88], we recently found an observable anthrophony to biophony gradient in Dortmund (adjacent to Bochum) from the city center to the edge [66], with high biophonic distribution in forested lands that supports Dein and Rüdisser [87]. Although we found several studies of urban soundscapes and GI, most of them focus on a single or a few urban parks and have numerically smaller sample sizes not based on habitat strata and not covering all four seasons [44,51,52,53,54,55,56].
A handful of studies investigate acoustic index outcome within an urban region [89,90] and support findings from Joo et al. [86] and Dein and Rüdisser [87], but are not habitat-based approaches aimed at quiet area planning. Finally, we did identify a few relevant large scale studies with good sample sizes across urban regions aimed at linking GI to sound outcomes. In the USA, conservation area alone explained about 50% of quietness outcomes in a large county-wide study [33], and in Massachusetts, the acoustic indices ACI and NDSI were associated with habitat intactness when bird richness measures were not included and habitat strata formed the basis of the sample design [29]. Finally, a study in Brazil found that species richness was negatively correlated with urbanization in selected GI locations, but contradicting Sangermano et al. [29], not the acoustic indices NDSI, H, BIO, AEI, ADI, or ACI [57], indicating the importance of sound source identification such as BirdNET in habitat-based GI and sound studies. Although these studies shed light on the link between habitat strata, size and quality of patches, proximity to urbanization, and bird species richness, they fall short of a systematic habitat-based approach that is repeatable for European urban regions as a quiet area assessment template. Probably, one of the reasons for this gap is simply the resource-intensive nature of such large-scale studies, whether they are GI-related or related to noise or another factor, and the general lack of approaches in the literature to guide such investigations. Thus, we justify the sample design presented in this study as a contribution towards systematic, longitudinal, habitat-based, multi-sound dimensional quiet area assessments to bolster existing EU-based guidance [19,20].

4.2. Strengths and Limitations

The strength of this research lies in the combination of ecological, spatial, acoustic, technical, and field work aspects. Considering the problem with noise in all EU member countries and the links to spatial planning emerging in soundscape ecology, noise annoyance, and psychoacoustics research, a blueprint for large-scale acoustic investigation in heavily populated urban regions is needed. This research delivers such a blueprint. Of course, the current case study is limited in the total number of devices we have available, field personnel, and the presence of GI types in our case study area.
Due to hardware and time limitations, and the sheer number of possible small sample sites, we were not able to systematically sample every type and size of GI in the study area. To deal with this limitation, we restricted samples to only those greater than 4 ha following the smallest size limit for quiet areas in Dortmund [22] and use stratification to sample all tiers to 90% confidence. Thus, our sample does not represent every possible piece of GI in the study area; rather, it represents all viable urban and peri-urban habitat areas that could be included as quiet areas in noise action planning. Due to limitations regarding available SM4 devices and field personnel funding, we could not achieve a representative sample for all LSRs; thus, this stratum represents an explorative approach towards landscape-level acoustic reference soundscapes. Certainly, the limitations of this study will generate follow-up questions to address in future studies.

5. Conclusions

This paper presents a systematic stratified acoustic sampling approach for GI areas across a large urban region. Via a systematic literature review, we have summarized sound as an ecosystem service, including natural quiet areas (exclusion), noise abatement, connection to nature, positive psychoacoustic perception, and bird sound presence, placing them in relation to the function and benefits steps of the ecosystem services cascade. The biotope-based sampling strata takes an ecological viewpoint from which to assess the urban sound environment, that focuses the study aims on the influence of variant biotope complexes and vegetation structure on acoustic outcomes within and outside of an urban region. The stratified sampling results indicate that the presence of biotope complexes away from human noise sources are in fact scarce and not equally distributed amongst landscape units in the central Ruhr region, a finding with implications for the urgency of GI conservation in urban regions or social–environmental justice exploration. We find that the urban core has fewer if any protected biotope complexes; however, such areas can be found on the periphery of the urban core in specific and isolated locations. The implementation of relational databases for big acoustic data management is an emerging research area not only necessary for managing large acoustic datasets, but also interpretation and visualization of results.

Author Contributions

Conceptualization, B.T.L. and D.G.; methodology, B.T.L. and D.G.; software, B.T.L. and D.H.; validation, B.T.L. and D.H.; formal analysis, B.T.L.; investigation, B.T.L. and D.H.; resources, B.T.L., D.H. and D.G.; data curation, D.H.; writing—original draft preparation, B.T.L.; writing—review and editing, B.T.L., D.G. and D.H.; visualization, B.T.L.; supervision, B.T.L. and D.G.; project administration, B.T.L. and D.G.; funding acquisition, D.G. and B.T.L. All authors have read and agreed to the published version of the manuscript.

Funding

This research was funded by the GERMAN RESEARCH FOUNDATION (DEUTSCHE FORSCHUNGSGEMEINSCHAFT (DFG)), grant number GR 3658/1-1.

Institutional Review Board Statement

Not applicable.

Informed Consent Statement

Not applicable.

Data Availability Statement

Habitat stratified sample design results as shapefiles are available at: The Influence of Green Infrastructure on the Acoustic Environment: Habitat Stratified Sample Design [Data set]. Zenodo. https://doi.org/10.5281/zenodo.15284028 (accessed on 2 February 2025).

Conflicts of Interest

The authors declare no conflicts of interest.

Appendix A

References

  1. Farina, A. Soundscape Ecology: Principles, Patterns, Methods and Applications; Springer: Urbino, Italy, 2014. [Google Scholar]
  2. Forman, R.T.T.; Godron, M. Landscape Ecology; John Wiley & Sons, Ltd.: New York, NY, USA, 1986. [Google Scholar]
  3. ISO/TS 12913-1; TS I—Acoustics—Soundscape Part 1: Definition and Conceptual Framework. ISO: Geneva, Switzerland, 2014.
  4. Krause, B. Bioacoustics: Habitat Ambience & Ecological Balance. Whole Earth Rev. 1987, 12, 14–18. [Google Scholar]
  5. Farina, A.; Sueur, J. Ecoacoustics: The Ecological Investigation and Interpretation of Environmental Sound. Biosemiotics 2015, 8, 493–502. [Google Scholar]
  6. Gasc, A.; Pavoine, S.; Lellouch, L.; Grandcolas, P.; Sueur, J. Acoustic indices for biodiversity assessments: Analyses of bias based on simulated bird assemblages and recommendations for field surveys. Biol. Conserv. 2015, 191, 306–312. [Google Scholar] [CrossRef]
  7. Gasc, A.; Sueur, J.; Jiguet, F.; Devictor, V.; Grandcolas, P.; Burrow, C.; Depraetere, M.; Pavoine, S. Assessing biodiversity with sound: Do acoustic diversity indices reflect phylogenetic and functional diversities of bird communities? Ecol. Indic. 2013, 25, 279–287. [Google Scholar] [CrossRef]
  8. Kerr, J.; Sugar, A.; Packer, L. Indicator Taxa, Rapid Biodiversity Assessment, and Nestedness in an Endangered Ecosystem. Conserv. Biol. 2000, 14, 1726–1734. [Google Scholar] [CrossRef]
  9. WHO. Burden of Disease from Environmental Noise: Quantification of Healthy Life Years Lost in Europe. Available online: https://www.who.int/publications/i/item/burden-of-disease-from-environmental-noise-quantification-of-healthy-life-years-lost-in-europe (accessed on 3 November 2021).
  10. Fuks, K.; Moebus, S.; Hertel, S.; Viehmann, A.; Nonnemacher, M.; Dragano, N.; Mohlenkamp, S.; Jakobs, H.; Kessler, C.; Erbel, R.; et al. Long-term urban particulate air pollution, traffic noise, and arterial blood pressure. Environ. Health Perspect. 2011, 119, 1706–1711. [Google Scholar] [CrossRef]
  11. Selander, J.; Nilsson, M.E.; Bluhm, G.; Rosenlund, M.; Lindqvist, M.; Nise, G.; Pershagen, G. Long-term exposure to road traffic noise and myocardial infarction. Epidemiology 2009, 20, 272–279. [Google Scholar] [CrossRef]
  12. Sörenson, M.; Hvidberg, M.; Anderson, Z.J.; Nordsborg, R.B.; Lillelund, K.G.; Jakobsen, J.; Tjonneland, A.; Overvad, K.; Raaschou-Nielsen, O. Road traffic noise and stroke: A prospective cohort study. Eur. Heart J. 2011, 32, 737–744. [Google Scholar] [CrossRef]
  13. Kälsch, H.; Hennig, F.; Moebus, S.; Mohlenkamp, S.; Dragano, N.; Jakobs, H.; Memmesheimer, M.; Erbel, R.; Jockel, K.H.; Hoffmann, B. Are air pollution and traffic noise independently associated with atherosclerosis: The Heinz Nixdorf Recall Study. Eur. Heart J. 2014, 35, 853–860. [Google Scholar] [CrossRef]
  14. Orban, E.; McDonald, K.; Sutcliffe, R.; Hoffmann, B.; Fuks, K.; Dragano, N.; Viehmann, A.; Erbel, R.; Jöckel, K.H.; Pundt, N.; et al. Residential Road Traffic Noise and High Depressive Symptoms after Five Years of Follow-up: Results from the Heinz Nixdorf Recall Study. Environ. Health Perspect. 2016, 124, 578–585. [Google Scholar] [CrossRef]
  15. Genuit, K. The Need for Transdisciplinary Actions—Psychoacoustics, Sound Quality, Soundscape and Environmental Noise. In Noise Control for Quality of Life; Internoise: Innsbruck, Austria, 2013; pp. 1–10. [Google Scholar]
  16. Genuit, K.; Fiebig, A. Die Psychoakustik im Bereich der Lärmwirkungsforschung. Prakt. Arbeitsmedizin 2007, 9, 14–18. [Google Scholar]
  17. Directive 2002/49/EC of the European Parliament and of the Council of 25 June 2002 Relating to the Assessment and Management of Environmental Noise. Off. J. Eur. Communities L 2002, 189, 2002.
  18. BlmSchG § 47: Act on Protection against Harmful Effects on the Environment Caused by Air Pollution, Noise, Vibrations and Similar Processes (Federal Immission Control Act—BImSchG). BlmSchG § 47. Available online: https://www.gesetze-im-internet.de/bimschg/__47.html (accessed on 24 March 2024).
  19. EEA. Good Practice Guide on Quiet Areas; Technical Report 04; EEA: Luxembourg, 2014; Available online: https://www.eea.europa.eu/publications/good-practice-guide-on-quiet-areas (accessed on 3 November 2021).
  20. Nugent, C.; Blanes, N.; Fons, J.; Sáinz de la Maza, M. Quiet Areas in Europe—The Environment Unaffected by Noise Pollution. EEA Report No 14/2016, LU. 2016. Available online: https://data.europa.eu/doi/10.2800/7586 (accessed on 4 February 2024).
  21. Meyer, M.A.; Lehmann, I.; Seibert, O.; Früh-Müller, A. Spatial Indicators to Monitor Land Consumption for local Governance in Southern Germany. Environ. Manag. 2021, 68, 755–771. [Google Scholar] [CrossRef] [PubMed]
  22. Rath, U.; Frücht, A.; Vennefrohne, K. Lärmaktionsplan der Stadt Dortmund. Zusammenfassung. Stadt Dortmund Umweltamt. 2024. Available online: https://www.dortmund.de/themen/umwelt-nachhaltigkeit-und-klimaschutz/laerm-und-laermminderung/umgebungslaerm/laermaktionsplanung/ (accessed on 2 February 2025).
  23. Buxton, R.T.; McKenna, M.F.; Mennitt, D.; Fristrup, K.; Crooks, K.; Angeloni, L.; Wittemyer, G. Noise pollution is pervasive in U.S. protected areas. Science 2017, 356, 531–533. [Google Scholar] [CrossRef]
  24. Holgate, B.; Maggini, R.; Fuller, S. Mapping ecoacoustic hot spots and moments of biodiversity to inform conservation and urban planning. Ecol. Indic. 2021, 126, 107627. [Google Scholar] [CrossRef]
  25. Klopfer, F.; Westerholt, R.; Gruehn, D. Conceptual Frameworks for Assessing Climate Change Effects on Urban Areas: A Scoping Review. Sustainability 2021, 13, 10794. [Google Scholar] [CrossRef]
  26. Haddaway, N.R.; Macura, B.; Whaley, P.; Pullin, A.S. ROSES RepOrting standards for Systematic Evidence Syntheses: Pro forma, flow-diagram and descriptive summary of the plan and conduct of environmental systematic reviews and systematic maps. Environ. Evid. 2018, 7, 7. [Google Scholar] [CrossRef]
  27. Dumyahn, S.L.; Pijanowski, B.C. Soundscape conservation. Landsc. Ecol. 2011, 26, 1327–1344. [Google Scholar] [CrossRef]
  28. Mackenbach, R.; Schneemelcher, O. Lärmaktionsplan der Stadt Dortmund 2014: Zusammenfassung. Available online: https://www.nordstadtblogger.de/wp-content/uploads/2014/11/LAP-Dortmund-2014-Langfassung.pdf (accessed on 29 March 2024).
  29. Sangermano, F. Acoustic diversity of forested landscapes: Relationships to habitat structure and anthropogenic pressure. Landsc. Urban Plan. 2022, 226, 104508. [Google Scholar] [CrossRef]
  30. Masullo, M.; Castanò, F.; Toma, R.A.; Maffei, L. Historical cloisters and courtyards as quiet areas. Sustainability 2020, 12, 2887. [Google Scholar] [CrossRef]
  31. Bormpoudakis, D.; Sueur, J.; Pantis, J.D. Spatial heterogeneity of ambient sound at the habitat type level: Ecological implications and applications. Landsc. Ecol. 2013, 28, 495–506. [Google Scholar] [CrossRef]
  32. Retamosa Izaguirre, M.; Barrantes Madrigal, J. Soundscape structure in forests surrounded by protected and productive areas in central Costa Rica. Front. Remote Sens. 2023, 4, 1051555. [Google Scholar] [CrossRef]
  33. Rice, W.L.; Newman, P.; Miller, Z.D.; Taff, B.D. Protected areas and noise abatement: A spatial approach. Landsc. Urban Plan. 2020, 194, 103701. [Google Scholar] [CrossRef]
  34. Benedict, M.A.; McMahon, E.T. Green Infrastructure: Smart Conservation for the 21st Century. Renew. Resour. J. 2002, 20, 12–17. [Google Scholar]
  35. Dramstad, W.E.; Olson, J.D.; Forman, R.T.T. Landscape Ecology Principles in Landscape Architecture and Land-Use Planning; Island Press: Washington, DC, USA, 1996; ISBN 1559635142. [Google Scholar]
  36. Felappi, J.F.; Sommer, J.H.; Falkenberg, T.; Terlau, W.; Kötter, T. Green infrastructure through the lens of “One Health”: A systematic review and integrative framework uncovering synergies and trade-offs between mental health and wildlife support in cities. Sci. Total Environ. 2020, 748, 141589. [Google Scholar] [CrossRef]
  37. Assesment, Millenium Ecosystem. Ecosystems and Human Well-Being: Synthesis; Island Press: Washington, DC, USA, 2005; ISBN 1597260398. [Google Scholar]
  38. Gruehn, D. Landscape Planning as a Tool for the Sustainble Development of the Territory: German Methodology and Experience. In Environmental Security and Sustainable Land Use: With Special Reference to Central Asia; Vogtmann, H., Dobretsov, N., Eds.; Springer: Dordrecht, The Netherlands, 2006; pp. 297–307. [Google Scholar]
  39. Haines-Young, R.; Potschin, M. The links between biodiversity, ecosystem services and human well-being. In Ecosystem Ecology; Raffaelli, D.G., Frid, C.L.J., Eds.; Cambridge University Press: Cambridge, UK, 2010; pp. 110–139. ISBN 9780521513494. [Google Scholar]
  40. Heink, U.; Jax, K. Going Upstream—How the Purpose of a Conceptual Framework for Ecosystem Services Determines Its Structure. Ecol. Econ. 2019, 156, 264–271. [Google Scholar] [CrossRef]
  41. Grunewald, K.; Bastian, O. (Eds.) Ökosystemleistungen: Konzept, Methoden, Bewertungs- und Steuerungsansätze; Springer: Berlin/Heidelberg, Germany, 2023; ISBN 9783662659168. [Google Scholar]
  42. Wang, Y.; Bakker, F.; de Groot, R.; Wörtche, H. Effect of ecosystem services provided by urban green infrastructure on indoor environment: A literature review. Build. Environ. 2014, 77, 88–100. [Google Scholar] [CrossRef]
  43. Ballesteros-Olza, M.; Palencia-González, F.J.; Blanco-Gutiérrez, I. Using big data to analyze how and why users value urban blue spaces in Spain. Urban For. Urban Green. 2024, 95, 128308. [Google Scholar] [CrossRef]
  44. Ednie, A.; Gale, T. Soundscapes and protected area conservation: Are noises in nature making people complacent? Nat. Conserv. 2021, 44, 177–195. [Google Scholar] [CrossRef]
  45. Hedblom, M.; Heyman, E.; Antonsson, H.; Gunnarsson, B. Bird song diversity influences young people’s appreciation of urban landscapes. Urban For. Urban Green. 2014, 13, 469–474. [Google Scholar] [CrossRef]
  46. Hedblom, M.; Knez, I.; Gunnarsson, B. Bird diversity improves the well-being of city residents. In Ecology and Conservation of Birds in Urban Environments; Springer International Publishing: Cham, Switzerland, 2017; pp. 287–306. ISBN 978-331943314-1. [Google Scholar]
  47. Potschin, M.; Haines-Young, R. Defining and measuring ecosystem servcies. In Routledge Handbook of Ecosystem Services; Potschin, M., Haines-Young, R., Fish, R., Turner, R.K., Eds.; Earthscan from Routledge, Taylor and Francis Group: New York, NY, USA, 2016; pp. 25–44. [Google Scholar]
  48. Grunewald, K.; Bastian, O. Ökosystemleistungen; Springer: Berlin/Heidelberg, Germany, 2023; ISBN 978-3-662-65915-1. [Google Scholar]
  49. Yang, Y.; Chen, Y.; Ye, Z.; Song, Z.; Xiong, Y. Springtime spatio-temporal distribution of bird diversity in urban parks based on acoustic indices. Glob. Ecol. Conserv. 2024, 53, e02995. [Google Scholar] [CrossRef]
  50. ISO/TS 12913-2; TS II—Acoustics—Soundscape Part 2: Data Collection and Reporting Requirements. ISO: Geneva, Switzerland, 2018.
  51. Benocci, R.; Potenza, A.; Bisceglie, A.; Roman, H.E.; Zambon, G. Mapping of the Acoustic Environment at an Urban Park in the City Area of Milan, Italy, Using Very Low-Cost Sensors. Sensors 2022, 22, 3528. [Google Scholar] [CrossRef] [PubMed]
  52. Bian, Q.; Wang, C.; Sun, Z.; Yin, L.; Jiang, S.; Cheng, H.; Zhao, Y. Research on spatiotemporal variation characteristics of soundscapes in a newly established suburban forest park. Urban For. Urban Green. 2022, 78, 127766. [Google Scholar] [CrossRef]
  53. Huang, L.; Kang, J. The sound environment and soundscape preservation in historic city centres—The case study of Lhasa. Environ. Plan. B Plan. Des. 2015, 42, 652–674. [Google Scholar] [CrossRef]
  54. Maffei, L.; Toma, R.A.; Masullo, M. (Eds.) Objective and Subjective Assessment of Pockets of Quiet Inside Historical Urban Areas. In Proceedings of the INTER-NOISE 2018—47th International Congress and Exposition on Noise Control Engineering: Impact of Noise Control Engineering, Washington, DC, USA, 26–29 August 2018; Available online: https://www.ingentaconnect.com/content/ince/incecp/2021/00000263/00000003/art00011;jsessionid=27lkc68mnfrc.x-ic-live-03 (accessed on 2 February 2025).
  55. Masullo, M.; Ozcevik Bilen, A.; Toma, R.A.; Akin Güler, G.; Maffei, L. The restorativeness of outdoor historical sites in urban areas: Physical and perceptual correlations. Sustainability 2021, 13, 5603. [Google Scholar] [CrossRef]
  56. Pawłat-Zawrzykraj, A.; Oglęcki, P.; Podawca, K. Analysis of the noise pollution in the bielański forest natura 2000 area in light of existing avifauna (Warsaw, poland). Forests 2021, 12, 1316. [Google Scholar] [CrossRef]
  57. Santos, E.G.; Wiederhecker, H.C.; Pompermaier, V.T.; Schirmer, S.C.; Gainsbury, A.M.; Marini, M. Are acoustic indices useful for monitoring urban biodiversity? Urban Ecosyst. 2024, 27, 1975–1981. [Google Scholar] [CrossRef]
  58. Chen, Z.; Hermes, J.; von Haaren, C. Mapping and assessing natural soundscape quality: An indicator-based model for landscape planning. J. Environ. Manag. 2024, 354, 120422. [Google Scholar] [CrossRef]
  59. Pijanowski, B.C.; Villanueva-Rivera, L.J.; Dumyahn, S.L.; Farina, A.; Krause, B.L.; Napoletano, B.M.; Gage, S.H.; Pieretti, N. Soundscape Ecology: The Science of Sound in the Landscape. BioScience 2011, 61, 203–2016. [Google Scholar] [CrossRef]
  60. Dick, J.; Carruthers-Jones, J.; Carver, S.; Dobel, A.J.; Miller, J.D. How are nature-based solutions contributing to priority societal challenges surrounding human well-being in the United Kingdom: A systematic map. Environ. Evid. 2020, 9, 25. [Google Scholar] [CrossRef]
  61. Farina, A.; Mullet, T.C. Sonotope patterns within a mountain beech forest of Northern Italy: A methodological and empirical approach. Front. Ecol. Evol. 2024, 12, 1341760. [Google Scholar] [CrossRef]
  62. Ohlmeyer, K.; Schaefer, M.; Kirstein, M.; Gruehn, D.; Greiving, S. Introducing environmental-justice analysis into urban planning practices in the city of Bottrop, Germany. Town Plan. Rev. 2021, 93, 187–210. [Google Scholar] [CrossRef]
  63. Sutcliffe, R.; Lawrence, B.T.; Ahmed, S.; Gruehn, D.; Moebus, S. Acoustic quality and health in urban environments (SALVE)—A pilot study in the metropolitan Ruhr region, Germany. Cities Health 2020, 1–2, 89–95. [Google Scholar] [CrossRef]
  64. Auer, S.; Wenning, T. People. Nature. Space: Green infrastructure in the Ruhr metropolis. Germany. 2021. Available online: https://www.rvr.ruhr/fileadmin/user_upload/01_RVR_Home/02_Themen/Umwelt_Oekologie/Offensive_GI/Dokumente/2021_Factbook_GI_engl.pdf (accessed on 2 February 2025).
  65. Haselhoff, T.; Lawrence, B.; Hornberg, J.; Ahmed, S.; Sutcliffe, R.; Gruehn, D.; Moebus, S. The acoustic quality and health in urban environments (SALVE) project: Study design, rationale and methodology. Appl. Acoust. 2021, 188, 108538. [Google Scholar] [CrossRef]
  66. Lawrence, B.T.; Frücht, A.; Heying, D.; Schröer, K.; Gruehn, D. Acoustic Characterization of Potential Quiet Areas in Dortmund, Germany. Environments 2024, 11, 69. [Google Scholar] [CrossRef]
  67. Israel, G.D. Determining Sample Size; University of Florieda: Gainesville, FL, USA, 1992. [Google Scholar]
  68. Nyimbili, F.; Nyimbili, L. Types of Purposive Sampling Techniques with Their Examplesand Application in Qualitative Research Studies. Br. J. Multidiscip. Adv. Stud. Engl. Lang. Teach. Lit. Linguist. Commun. 2024, 5, 90–99. [Google Scholar] [CrossRef]
  69. LANUV. Biotopkataster NRW; LANUV (Landesamt für Natur, Umwelt und Verbraucherschutz Nordrhein-Westfalen): Düsseldorf, Germany, 2023. [Google Scholar]
  70. Bradfer-Lawrence, T.; Gardner, N.; Bunnefeld, L.; Bunnefeld, N.; Willis, S.G.; Dent, D.H. Guidelines for the use of acoustic indices in environmental research. Methods Ecol. Evol. 2019, 10, 1796–1807. [Google Scholar] [CrossRef]
  71. Pijanowski, B.C.; Fuenzalida, F.R.; Banerjee, S.; Minghim, R.; Lima, S.L.; Bowers-Sword, R.; Guzman, S.R.; Revuelta-Acosta, J.; Adeniji, A.E.; Grimes, S.E.; et al. Soundscape Analytics: A New Frontier of Knowledge Discovery in Soundscape Data. Curr. Landsc. Ecol. Rep. 2024, 9, 88–107. [Google Scholar] [CrossRef]
  72. Schmithüsen, J. Was ist eine Landschaft. Erkundliches Wissen 1964, 9, 1–24. [Google Scholar]
  73. McGarigal, K.; Marks, B.J. Spatial Pattern Analysis Program for Quantifying Landscape Structure; US Department of Agriculuture, Forest Service: Washington, DC, USA, 1995.
  74. Farina, A.; Gage, S.H. (Eds.) Ecoacoustics: The Ecological Role of Sounds, 1st ed.; John Wiley & Sons, Inc.: Hoboken, NJ, USA, 2017; ISBN 9781119230724. [Google Scholar]
  75. Sueur, J. Sound Analysis and Synthesis with R; Springer International Publishing: Cham, Switzerland, 2018; ISBN 978-3-319-77645-3. [Google Scholar]
  76. Bradfer-Lawrence, T.; Bunnefeld, N.; Gardner, N.; Willis, S.G.; Dent, D.H. Rapid assessment of avian species richness and abundance using acoustic indices. Ecol. Indic. 2020, 115, 106400. [Google Scholar] [CrossRef]
  77. Kahl, S.; Wood, C.M.; Eibl, M.; Klinck, H. BirdNET: A deep lerning solution for avian diversity monitoring. Ecol. Inform. 2021, 61, 101236. [Google Scholar] [CrossRef]
  78. Wildlife Acoustics. Kaleidoscope; Wildlife Acoustics: Maynard, MA, USA, 2021. [Google Scholar]
  79. Fairbairn, A.J.; Burmeister, J.-S.; Weisser, W.W.; Meyer, S.T. BirdNET is as Good as Experts for Acoustic Bird Monitoring in a European City. bioRxiv 2024. [Google Scholar] [CrossRef]
  80. Ware, L.; Mahon, C.L.; McLeod, L.; Jetté, J.-F. Artificial intelligence (BirdNET) supplements manual methods to maximize bird species richness from acoustic data sets generated from regional monitoring. Can. J. Zool. 2023, 101, 1031–1051. [Google Scholar] [CrossRef]
  81. Lawrence, B.T.; Hornberg, J.; Schröer, K.; Djeudeu, D.; Haselhoff, T.; Ahmed, S.; Moebus, S.; Gruehn, D. Linking ecoacoustic indices to psychoacoustic perception of the urban acoustic environment. Ecol. Indic. 2023, 155, 111023. [Google Scholar] [CrossRef]
  82. Haselhoff, T.; Schuck, M.; Lawrence, B.T.; Fiebig, A.; Moebus, S. Characterizing acoustic dimensions of health-related urban greenspace. Ecol. Indic. 2024, 166, 112547. [Google Scholar] [CrossRef]
  83. Dratva, J.; Zemp, E.; Felber, D.D.; Bridevaux, P.; Rochat, T.; Schindler, C.; Gerbase, M.W. Impact of road traffic noise annoyance on health-related quality of life: Results from a population-based study. Qual. Life Res. 2010, 19, 37–46. [Google Scholar] [CrossRef]
  84. Jensen, H.A.R.; Rasmussen, B.; Ekholm, O. Neighbour and traffic noise annoyance: A nationwide study of associated mental health and perceived stress. Eur. J. Public Health 2018, 28, 1050–1055. [Google Scholar] [CrossRef]
  85. Lawrence, B.T.; Frücht, A. Anhang 3 zum Lärmaktionsplan der Stadt Dortmund: Bericht über die Hörspaziergänge 2023; Stadt Dortmund: Dortmund, Germany, 2024; Available online: https://www.dortmund.de/themen/umwelt-nachhaltigkeit-und-klimaschutz/laerm-und-laermminderung/umgebungslaerm/laermaktionsplanung/ (accessed on 2 February 2025).
  86. Joo, W.H.; Gage, S.; Kasten, E.P. Analysis and interpretation of variability in soundscapes along an urban?: Rural gradient. Landsc. Urban Plan. 2011, 103, 259–276. [Google Scholar] [CrossRef]
  87. Dein, J.; Rüdisser, J. Landscape influence on biophony in an urban environment in the European Alps. Landsc. Ecol. 2020, 35, 1875–1889. [Google Scholar] [CrossRef]
  88. Krause, B.; Gage, S.H.; Joo, W. Measuring and interpreting the temporal variability in the soundscape at four places in Sequoia National Park. Landsc. Ecol. 2011, 26, 1247–1256. [Google Scholar] [CrossRef]
  89. Fairbrass, A.J.; Rennert, P.; Williams, C.; Titheridge, H.; Jones, K.E. Biases of acoustic indices measuring biodiversity in urban areas. Ecol. Indic. 2017, 83, 169–177. [Google Scholar] [CrossRef]
  90. Eldridge, A.; Guyot, P.; Moscoso, P.; Johnston, A.; Eyre-Walker, Y.; Peck, M. Sounding out ecoacoustic metrics: Avian species richness is predicted by acoustic indices in temperate but not tropical habitats. Ecol. Indic. 2018, 95, 939–952. [Google Scholar] [CrossRef]
Figure 1. Boolean keyword-based literature review summary.
Conservation 05 00022 g001
Figure 2. Sound as ecosystem service; author’s own work, adapted from [39,41].
Conservation 05 00022 g002
Figure 3. Landscape units in and adjacent to the city of Bochum, and the EEA Quietness Suitability Index (QSI). Author’s own work, following [20].
Conservation 05 00022 g003
Figure 5. Tier 3 sample locations, land uses, and biotope complexes (Author’s own work).
Conservation 05 00022 g005
Figure 6. Eight clusters, organized in a rotation procedure, repeated every season (author’s own work).
Conservation 05 00022 g006
Figure 7. Green infrastructure and the acoustic environment soundscape analytics pipeline, illustrating a few of the many possible interpretation approaches; Author’s own work, adapted from (Pijanowski et al., 2024, [71]).
Conservation 05 00022 g007
Table 2. Tier 2 Biotope Complex (“Lebensraumtyp” or LRT) descriptions.
LRT StrataSample Size
Mesophilic Grassland (NE00)9
Mixed Deciduous Forest: Beech, Birch, Oak, Ash, Alder, Maple (NAO0)27
Protected Moor (NCA0)2
Wetland Shrubs and Small Trees (NBB0)3
Table 3. Tier 2 Protected Biotope (GBT) descriptions with legal designations.
GBT StrataSample Size
Flowing Water (§FM0)6
Great Sedge Meadow (§CD0)2
Pond (§FF0) with Tall Reeds (§CF2)1
Springs (§FK0) and Wet Meadow (§EC1)1
Holocene Springs (§FK2)4
Rheocrene Springs (§FK3) with Tall Reeds (§CF2)1
Standing Small Waterbody (§FD0)2
Pond (§FF0)2
Standing Water in Mining Subsidence (§FR0)3
Tall Reeds (§CF2)2
Wet Grassland Fallow (§EA3)4
Wet Meadow (§EC1)7
No Protected Area, Description Refers to Biotope Complex Designation7
§ designates that the identifier is a legal conservation description.
Table 4. Tier 3 Biotope Complex descriptions.
LRT StrataSample Size
Mesophilic Grassland (NE00)3
Mixed Deciduous Forest: Beech, Birch, Oak, Ash, Alder, Maple (NAO0)22
Riparian Forest in Floodplain (NAX0)2
Wetland Shrubs and Small Trees (NBB0)1
Table 5. Tier 3 Protected Biotope (GBT) descriptions with legal designations.
GBT StrataSample Size
Flowing Water (§FM0, §FM1§FM4, §FM5)8
Meadow (§ED1)1
Spring (§FKO, §FK2, §FM4)3
Standing Water (§FD0, §FT5)2
Wet Meadow (§EC1, §EE1)2
No Protected Area, Description Refers to Biotope Complex Designation12
§ designates that the identifier is a legal conservation description.
Table 6. All samples stratified by physiographic unit (“Naturraum” (NR)).
NR StrataSample Number
NR-337-E1: Bergisch-Sauerländisches Unterland 228
NR-543: Emscherland 311
NR-545: Westenhellweg 481
See Appendix A for footnote links to NR and LSR strata descriptions.
Table 7. All Samples Stratified by Landscape Unit (“Landschaftsraum” (LSR)).
LSR StrataSample Number
LR-IIIa-084: Flugsanddecken südlich der Dorstener Talweitung 51
LR-IIIa-099: Boyplatten 61
LR-IIIa-100: Vestischer Höhenrücken 72
LR-IIIa-101: Flachwellenland zwischen Sinsen und Brechten 81
LR-IIIa-102: Nördliche Emscherrandplatten 93
LR-IIIa-103: Emschertalung 101
LR-IIIa-104: Lössbedecktes Hellwegtal 113
LR-IIIa-109: Westenhellweg 1263
LR-IIIa-110: Stockumer Höhe 136
LR-IIIa-111: Witten Dortmunder Lössgebiet 142
LR-VIa-001: Tal der Ruhr zwischen Mülheim und Witten 1524
LR-VIa-003: Niederbergische Höhenterrassen 161
LR-VIa-004: Bergisch-Märkisches Karbonschieferhügelland 173
LR-VIa-005: Ruhrtal mit unterer Lennetalung 186
LR-VIa-006: Ardey-Rücken mit Fröndenberger Horst 192
LR-VIa-007: Steilhänge des Süd-Ardey 201
See Appendix A for footnote links to NR and LSR strata descriptions.
Table 8. All samples stratified by Biotope Complex (“Lebensraumtyp” (LRT)).
LRT StrataSample Size
Mesophilic Grassland (NE00)12
Mixed Deciduous Forest: Beech, Birch, Oak, Ash, Alder, Maple (NAO0)49
Riparian Forest in Floodplain (NAX0)2
Wetland Shrubs and Small Trees (NBB0)4
Protected Moor (NCA0)2
Disclaimer/Publisher’s Note: The statements, opinions and data contained in all publications are solely those of the individual author(s) and contributor(s) and not of MDPI and/or the editor(s). MDPI and/or the editor(s) disclaim responsibility for any injury to people or property resulting from any ideas, methods, instructions or products referred to in the content.

