Article

A Comprehensive Study of the Macro-Scale Performance of Graphene Oxide Enhanced Low Carbon Concrete

1
Department of Infrastructure Engineering, The University of Melbourne, Parkville, VIC 3010, Australia
2
School of Engineering, Macquarie University, Sydney, NSW 2109, Australia
3
Heidelberg Materials Australia, Brisbane, QLD 4000, Australia
*
Author to whom correspondence should be addressed.
Constr. Mater. 2025, 5(3), 47; https://doi.org/10.3390/constrmater5030047
Submission received: 31 May 2025 / Revised: 24 June 2025 / Accepted: 4 July 2025 / Published: 18 July 2025

Abstract

This study presents a detailed and comprehensive investigation into the macro-scale performance, strength gain mechanisms, environment and economic performance of graphene oxide (GO)-enhanced low-emission concrete. A comprehensive experimental program evaluated fresh and hardened properties, including slump retention, bleeding, air content, compressive, flexural, and tensile strength, drying shrinkage, and elastic modulus. Scanning Electron Microscopy (SEM), energy-dispersive spectroscopy (EDS), Thermogravimetric analysis (TGA) and proton nuclear magnetic resonance (1H-NMR) was employed to examine microstructural evolution and early age water retention, confirming GO’s role in accelerating cement hydration and promoting C-S-H formation. Optimal performance was achieved at 0.05% GO (by binder weight), resulting in a 25% increase in 28-day compressive strength without compromising workability. This outcome is attributed to a tailored, non-invasive mixing strategy, wherein GO was pre-dispersed during synthesis and subsequently blended without the use of invasive mixing methods such as high shear mixing or ultrasonication. Fourier-transform infrared (FTIR) spectroscopy further validated the chemical compatibility of GO and PCE and confirmed the compatibility and efficiency of the admixture. Sustainability metrics, including embodied carbon and strength-normalized cost indices (USD/MPa), indicated that, although GO increased material cost, the overall cost-performance ratio remained competitive at breakeven GO prices. Enhanced efficiency also led to lower net embodied CO2 emissions. By integrating mechanical, microstructural, and environmental analyses, this study demonstrates GO’s multifunctional benefits and provides a robust basis for its industrial implementation in sustainable infrastructure.

1. Introduction

The cement and concrete industries are significant contributors to global greenhouse gas emissions, primarily through carbon dioxide (CO2) released during production processes [1]. Recent data indicates that these industries collectively account for approximately 8% of annual global CO2 emissions [2], positioning them among the world’s largest industrial emitters [3]. Global cement manufacturing produced approximately 1.56 billion metric tons of CO2 in 2023 [4] and 1.6 billion metric tonnes in 2022 [5]. The cement industry’s carbon footprint has grown substantially over time, more than doubling since the turn of the century [6]. The emissions profile of cement production is unique compared to many other industries as a significant portion comes from the chemical process itself (stoichiometric emissions) rather than just energy consumption [7]. In cement production, approximately 58% of CO2 emissions originate from calcination [8], whilst burning fossil fuels to heat kilns to temperatures exceeding 1400 °C [9] and downstream processes account for the rest. Calcination involves heating limestone (CaCO3) to produce lime (CaO), inevitably releasing CO2 as a by-product [10]. However, through sustainable initiatives, the cement industry has reduced its average global emissions intensity by more than 20% since 1990, reaching approximately 580kg of CO2 per tonne of cementitious materials in 2022 [5]. Although this metric demonstrates some improvement, overall cement production has significantly increased due to growing demand for concrete for large-scale infrastructure development and rapid urbanization.
The concrete industry’s environmental impact is predominately linked to its cement component [11]. While concrete itself is the second most extensively used material in the world after water, Cheng et al. argue that it is the cement production that contributes the most (~90%) to embodied CO2 in concrete [12]. If substantial interventions are not made, the current trajectory of concrete demand and annual CO2 emissions from the sector will escalate to ~3.8 billion tonnes by mid-century [13]. Soomro et al. [14] highlight that producing one tonne of Ordinary Portland Cement (OPC) generates approximately 0.65–0.92 tonnes of CO2. In parallel, Environmental Product Declarations (EPD) Australasia [15] report that the Global Warming Potential (GWP) of concrete products range from approximately 150 kg CO2-eq/m3 to 510 kg CO2-eq/m3, depending on several factors, including strength class, incorporation of recycled materials, recycling rate at end of life, and the proportion of supplementary cementitious materials (SCMs) used in the mix design. With global annual cement production exceeding 4.4 billion tonnes [16], the cumulative environmental impact remains substantial. While the industry has begun implementing efficiency improvements and exploring innovative solutions, the rate of emissions reduction remains insufficient to offset growing global demand [17]. To achieve global decarbonisation targets, the cement sector must rapidly transition toward low-carbon alternatives [18].
This challenge has spurred interest in the integration of functional nanomaterials, such as graphene oxide (GO), which has been reported to enhance concrete strength [19] by promoting hydration kinetics [20], refining pore structure [21], and improving interfacial bonding [22]. Several studies have reported substantial mechanical enhancements with GO addition. For instance, Verma et al. [23] observed 28–58% increases in compressive strength at 56 days when GO was dosed between 0.05 and 0.09% by weight of cementitious materials (bwoc). Dimov et al. [24] reported a 146% increase in early-age (7-day) strength using GO-enhanced paste systems, though this effect declined to 26% at 28 days, highlighting the importance of evaluating long-term gain. In terms of tensile performance, Shareef et al. [25] recorded a 17.4% improvement in 28-day splitting tensile strength at 1% GO bwoc.
Among various nanomaterials explored for cementitious enhancement, including carbon nanotubes (CNTs) [26,27], nano-silica [28,29], and nano-clays [30], GO’s hydrophilicity present a unique balance between performance enhancement, cost, and practical applicability. While CNTs offer exceptional tensile strength and stiffness, their high cost, poor dispersibility, and limited scalability pose challenges for widespread adoption [31,32]. Nano-silica has shown promise in refining pore structure, yet its effects on mechanical performance are often marginal at low dosages and it requires higher loadings to achieve substantial improvements [33]. Recent literature reviews have reported the incorporation of various graphene-family nanomaterials, such as reduced graphene oxide (rGO), graphene nanoplatelets (GNPs), and pristine graphene, into cementitious composites to enhance mechanical and durability properties [34,35,36]. GNPs have shown promise in improving flexural and tensile strength due to their high aspect ratio and crack-bridging capability [37], while rGO offers improved electrical conductivity and microstructural densification [38]. However, challenges such as poor dispersion, high cost, and limited scalability remain prevalent, particularly for pristine graphene and rGO [39]. Compared to these alternatives, GO is more hydrophilic and dispersible in aqueous systems, making it more compatible with conventional mixing processes and chemical admixtures [40]. GO combines a high aspect ratio, large surface area, and oxygen-containing functional groups, which promote both dispersion and hydration nucleation within the cement matrix. Additionally, GO can be synthesized from relatively low-cost precursors such as graphite, and its performance has been demonstrated at low dosages (≤0.1% bwoc), improving strength and durability. These advantages position GO as a promising multifunctional nanomaterial for concrete applications, particularly where workability retention, mechanical enhancement, and material efficiency are equally prioritized.
In addition to mechanical properties, GO has demonstrated promising contributions to concrete durability, which is critical for long-term performance in harsh service environments. Several studies have reported that GO incorporation can improve resistance to sulphate attack, chloride ion penetration, and freeze–thaw cycling, owing to its ability to densify the microstructure and refine pore connectivity. Zeng et al. [41] showed that GO-modified cementitious composites exhibited significantly reduced mass loss and strength degradation under freeze–thaw exposure, while other studies have observed reduced permeability and enhanced resistance to chemical ingress. These improvements are generally attributed to GO’s nano-filler effect, its interaction with hydration products, and the formation of refined interfacial transition zones. While durability was not a direct focus of the present study, these findings highlight the broader applicability of GO-enhanced systems and justify further exploration of their long-term functional performance.
While numerous studies have explored the influence of GO on the fresh and hardened properties of concrete, such as workability and mechanical strengths [42,43,44], several critical parameters essential for real-world application remain underexamined. In construction activities, workability must not only be achieved initially but also retained for a substantial period, allowing transportation from batching plants to applications in construction sites [45,46]. Thus, slump retention is a key performance requirement. Moreover, if the use of nanomaterials such as GO has adverse impacts on fresh properties, more chemical admixtures may be required to restore desired rheological performances [47,48]. This study addresses this gap by evaluating the influence of GO on slump retention behaviour, offering insights into its potential to minimize reliance on additional admixtures. Moreover, this study evaluates the air content of concrete mixes, providing deeper insights into the fresh properties of GO admixed concrete.
Another overlooked factor in the current literature is the bleeding behaviour of GO admixed concrete. Although GO is known to disperse effectively in aqueous solutions [40,49], its implications for bleeding, which is an issue that can impact surface quality, curing uniformity, and porosity, have not been adequately investigated. While there are many studies on GO-enhanced cement paste and mortar [50,51,52,53,54], to the authors’ knowledge, there are no studies on GO-admixed concrete that systematically assess key workability-related parameters important to industry practice, such as bleeding, air content, and slump retention. Given the recurring reports that GO reduces workability [55,56,57], it is imperative that these parameters are critically examined. This paper provides a systematic evaluation of fresh properties in GO-enhanced concrete relevant to current industry practice.
While compressive strength is frequently used as the primary metric to gauge mechanical performance, structural performance also depends significantly on other mechanical properties, such as tensile strength, flexural strength and elastic modulus [58]. These properties are critical for predicting crack resistance, stiffness, and serviceability [59]. Thus, this study extends the mechanical evaluation to include all three parameters, providing a more comprehensive assessment of performance. Furthermore, most existing studies promote GO as a promising additive for enhancing mechanical performance and reducing embodied emissions [60,61], yet few have evaluated the net environmental or economic outcomes [62,63]. The production of GO itself is energy-intensive and contributes to embodied CO2 emissions [64], which must be accounted for in sustainability assessments. Several prior studies have attempted to quantify the environmental footprint of graphene-based cementitious systems. For instance, Papanikolaou et al. [65] reported that the production of 1 kg of graphene nanoplatelets (GNPs) results in 0.17 kg CO2, which is significantly lower than the 0.86 kg CO2 per kg of OPC. Their sensitivity analysis revealed that a mere 5% OPC reduction via GNP substitution could lower the global warming impact of concrete by up to 20%. Similarly, Surehali et al. [66] conducted a cradle-to-gate life cycle analysis of cement mortars modified with Fractal Graphene (FG) and Reactive Graphene (RG), showing that mixtures with 0.04% FG or 0.02% RG achieved a 10–15% reduction in energy demand and GWP when normalized by compressive strength. While both studies demonstrate environmental advantages, they are limited to graphene allotropes other than GO and were conducted on cement mortar systems, not concrete. In contrast, GO-based studies, such as those of Munuera et al. [64] and Ginigaddara et al. [19], estimate GO’s embodied carbon at 10–30 kg CO2/kg, highlighting the need to assess its carbon footprint in performance-normalized terms, especially in concrete-scale applications. Additionally, the high cost of GO [67], which is frequently underexamined in prior work, raises questions about its economic feasibility for widespread use. Without cost–performance benchmarks or emission analyses, such claims of sustainability remain speculative [68]. A critical knowledge gap remains in determining whether the introduction of GO facilitates net reductions in embodied emissions once production impacts are considered, and whether these benefits are economically justified.
This paper presents the findings of a comprehensive investigation aimed at addressing existing knowledge gaps in the performance and applicability of GO enhanced concrete. To address this, the study adopts a tailored, non-invasive mixing methodology that avoids energy-intensive dispersion techniques during concrete production. A comprehensive experimental program is conducted, including the evaluation of fresh-state properties (slump retention, bleeding, air content) and mechanical performance (compressive, tensile, and flexural strength, shrinkage, and modulus). The study further integrates environmental and economic performance metrics through embodied carbon and cost analyses. Through this multi-faceted approach, the research aims to generate new empirical evidence on the compatibility, efficiency, and scalability of GO-enhanced concrete for sustainable infrastructure applications. In addition to macro scale performance, microstructural mechanisms that provide macro scale strength improvements are also explored using Scanning Electron Microscopy (SEM), energy-dispersive spectroscopy (EDS), Thermo-gravimetric analysis (TGA) and proton nuclear magnetic resonance (1H-NMR). Environmental and economic assessments are conducted through quantification of embodied CO2 emissions and material cost analyses. By correlating performance metrics with sustainability indicators, the study generates novel empirical insights into the role of GO in enabling the practical implementation of scalable and sustainable concrete technologies. These findings contribute to the advancement of scientific knowledge and offer guidance for industrial application strategies.

2. Experimental Program

The experimental program was designed to evaluate the influence of GO added to two dosages in a concrete mix with a target average compressive strength of 65 MPa. The GO dosages (0.03–0.05% bwoc) were limited to low concentrations to avoid adverse particle agglomeration and poor dispersibility in concrete. Previous studies have shown that, while higher GO dosages (0.1–0.2% bwoc) may initially enhance mechanical performance, they often lead to agglomeration, increased viscosity, and significant workability loss, which compromises the material’s practical viability [69]. The mix proportions and corresponding mix IDs used in this study are summarised in Table 1.

2.1. Materials

OPC was obtained from Cement Australia, and its chemical composition was evaluated through X-ray Fluorescence (XRF) Spectroscopy as per ASTM C114: Standard Test Methods for Chemical Analysis of Hydraulic Cement [70], and the properties are listed in Table 2. Crushed natural coarse aggregates of 20 mm maximum nominal size and natural river sand (fineness modulus of 3.26) were used as aggregates in the concrete mix. A commercial PCE product was adopted in this study, ensuring that it is chemically compatible with GO.
GO was added in the form of a 4 g/L aqueous dispersion, which was synthesized following the methodology established in the authors’ previous work, using identical materials [71]. Sri Lankan Vein Graphite based GO was used and a summary of GO properties and characterization results is presented in Table 3.

2.2. Methods

Concrete mixes were prepared in accordance with Australian Standard (AS) 1012.2:2014 using a pan-type mixer [74]. The mixing sequence was carefully controlled to ensure uniform dispersion of constituents. Initially, coarse and fine aggregates were dry blended for 30 s and, subsequently, the cementitious materials (OPC and Fly Ash) were added and mixed for an additional 2 min to achieve preliminary homogeneity of the dry materials.
Following the authors’ previously validated dispersion method [71], a 4 g/L aqueous GO solution was prepared by manually mixing GO with PCE and mixing water. Then the resultant liquid content was gradually added into the dry matrix, comprising aggregates and binders while mixing. The mixture was allowed to rest for 2 min under static conditions, facilitating early-stage particle interactions. The mixing was resumed for another 2-min cycle to complete the wet mixing phase. Notably, no advanced dispersion techniques such as ultrasonication or high-shear mixing were employed, thereby ensuring that the process remains directly transferrable to field applications without the need for specialized equipment. All concrete mixes were designed with a constant water-to-binder (w/b) ratio of 0.30. Moisture corrections were applied based on the aggregate moisture content and water absorption characteristics and further adjusted for the water contributed by the GO solution to maintain consistency across all batches.
It is important to note that, while ultrasonication was not applied during the concrete mixing phase, it was incorporated during the GO synthesis and aqueous dispersion preparation stages, as outlined in the authors’ previous work [50]. In this study, a 4 g/L aqueous GO solution was prepared using ultrasonication prior to mixing, ensuring sufficient exfoliation and dispersion of GO nanosheets in the liquid phase. We intentionally avoided ultrasonication after introducing GO into the PCE-containing mix, as emerging literature has shown that ultrasonic treatment can degrade the performance of polycarboxylate-based superplasticizers (SPs). Specifically, Poinot et al. [75] reported that sonication reduced the molecular weight of commercial water-retention admixtures. Similarly, Silvestro et al. [76] demonstrated, through dynamic light scattering and rheological testing, that sonication increased the heterogeneity of SP dispersions, reduced polymer chain lengths, and impaired initial dispersion performance in cement pastes—resulting in increased viscosity, yield stress, and hysteresis. To preserve the chemical integrity and effectiveness of PCE, we adopted a pre-dispersion strategy using ultrasonicated aqueous GO, followed by controlled incorporation into the dry mix. This approach provides a scalable, low-energy alternative to in situ ultrasonication while maintaining both workability and mechanical performance, and is therefore viewed as a methodological strength of this study.
Fresh-state properties were evaluated using the slump test in accordance with AS 1012.3.1:2014 [77] and slump retention measurements were recorded at 30-min intervals up to 90 min, following the same procedure. The air content was measured using the pressure method as specified in AS 1012.4.2:2014 [78], while bleeding performance was assessed following the guidelines of AS 1012.6:2014 [79]. Specimen preparation and curing also followed standard procedures. Compressive and indirect tensile test specimens were prepared in accordance with AS 1012.8.1:2014 [80], while flexural strength and drying shrinkage specimens were prepared following AS 1012.8.2:2014 [81] and AS 1012.8.4:2015 [82], respectively. All specimens for mechanical tests were demoulded after 24 h and cured in a water bath at 23 ± 2 °C until the testing age. For drying shrinkage, after initial wet curing of 7 days was complete, the specimens were placed in a standard drying environment of 23 °C and 50% relative humidity until testing. Compressive strength, splitting tensile strength, flexure strength (modulus of rupture), modulus of elasticity and drying shrinkage tests were conducted following AS 1012.9:2014 [83], AS 1012.10-2000 [84], AS 1012.11-2000 [85], AS 1012.17-1997 [86] and AS 1012.13:2015 [87], respectively. Compressive strength, indirect tensile strength and elastic modulus tests were conducted at 7 and 28 days. Flexure strength tests were conducted at 28 days of curing while drying shrinkage was monitored up to 56 days. Three replicate specimens were tested for each data point and the average values are reported.
The chemical identity and compatibility of GO and PCE functional groups were determined by Fourier Transform Infrared spectroscopy (FTIR) on a LUMOS FTIR, Bruker, under macro attenuated total reflection (ATR) mode within an infrared radiation range of 800–4000 cm−1 at a scan time of 32 scans. Moreover, Scanning Electron Microscopy (SEM) and energy-dispersive spectroscopy (EDS) were utilized to investigate the distribution of GO in the cement matrix and elemental composition analyses. For SEM and EDS imaging, a Hitachi FlexSEM 1000 II VP-SEM was employed at an accelerating voltage of 15 kV. Cement paste samples were placed onto silicon wafers and sputter-coated with a 5 nm gold layer to prevent charging and image artefacts.
TGA was conducted to examine the phase composition and hydration characteristics of the hardened cementitious matrix. Powdered samples were extracted from 28-day cured specimens and ground to pass through a 75 μm sieve. TGA was performed using a Netzsch TGA 309 Libra Select instrument under a nitrogen atmosphere with a flow rate of 20 mL/min. The temperature was ramped from 25 °C to 900 °C at a heating rate of 10 K/min. The contents of evaporable free water, calcium hydroxide (CH), calcium carbonate (CaCO3), and calcium silicate hydrate (CSH) were estimated based on the characteristic decomposition temperature ranges, as outlined in Equations (1)–(4), respectively [88,89].
Evaporable   free   water   % = Evaporable   free   water   mass   loss   from   25   °C   to   115   °C sample   mass   900   °C × 100 ,
CSH % = CSH   mass   loss   from   115   °C   to   450   °C sample   mass   at   900   °C × 100
CH % = Ca ( OH ) 2 mass   loss   from   450   °C to   600   °C sample   mass   at 900   °C × 100
CaCO 3 % = CaCO 3 mass   loss   from   600   °C to 800   °C sample   mass   at   900   °C × 100
A comprehensive and comparative analyses of environmental impacts and material costs were also undertaken. The environmental assessment was conducted using a cradle-to-gate approach, aligned with stages A1–A3 of EN 15978:2011 [90], which encompass raw material extraction, transportation, and manufacturing processes. Carbon emissions were quantified in terms of kilograms of CO2 equivalent (kgCO2-eq), providing a standardized metric for comparing the embodied CO2 emissions across mixes. Emission factors were primarily sourced from the most recent release of the EPiC Database [91], which compiles life cycle inventory data from the Australian Life Cycle Inventory Database Initiative (AusLCI) [92]. Material cost data were compiled from a combination of current retail quotations and relevant published cost indices to ensure contextual relevance within the Australian construction industry. A summary of the CO2 emissions and unit cost data for each raw material is presented in Table 4.
It is important to note that the environmental and cost analyses are contextualized within the Australian region and may differ in regions with alternate supply chain characteristics or pricing structures. As neither embodied CO2 emissions nor material costs alone offer a comprehensive assessment of sustainability and performance, two normalized performance indicators were employed: the Emission Index (EI), expressed in kgCO2-eq/MPa Equation (5), and the Cost Index (CI), expressed in USD/MPa Equation (6). These indices evaluate the economic and environmental efficiency of each concrete mix relative to its mechanical performance.
E I = Embodied   Carbon f c ,
C I = Cost f c
where ∑Cost denotes the total material cost per cubic meter of concrete (USD), ∑Embodied Carbon represents the total embodied emissions per cubic meter of concrete (kgCO2/m3), and fc is the average 28-day compressive strength (MPa) of the corresponding mix.

3. Results and Discussion

3.1. Slump and Slump Retention Tests

Initial slump value and the slump retention values over a period of 90 min are demonstrated in Figure 1. Each data point shown represents the average of three replicate measurements. The standard deviation in slump measurements across all mixes ranged between ±3 and 7 mm, indicating good repeatability and consistency in workability. The initial slump measurements confirmed that all mixes exhibited satisfactory workability within standard industrial requirements. The negligible variation (5%) in slump value indicates that the inclusion of GO as per the employed mixing method did not adversely impact the workability. This outcome sharply contrasts with the findings of numerous previous studies [24,100,101], which have consistently reported a considerable reduction in workability upon the incorporation of GO, even at low dosages [102]. As in many other cases, Abdalla et al. establish that the introduction of GO, due to its high surface area and strong hydrophilic nature, has led to increased water demand and mix stiffening, thereby compromising the fresh-state behaviour of concrete [103]. As highlighted by Secrieru et al., the loss of workability is frequently cited as a major barrier to the practical implementation of GO-enhanced concrete, particularly in ready-mix applications or cast-in-situ scenarios where pumpability and flowability are critical [104]. Several studies have attempted to mitigate this issue through increased and modified dosages of PCE or water [105]. While such strategies may partially recover workability, they introduce new challenges, such as stickiness under high PCE dosages and lower strength under modified w/c ratios [106].
Notably, the tailored dispersion strategy adopted in this study did not involve any energy-intensive mixing techniques, such as ultrasonication or high-shear mixing, for integrating the GO and PCE mixture (GO+PCE) into the cementitious matrix. This decision was guided by prior findings, which demonstrate that ultrasonication can degrade PCE molecules, reducing their molecular weight and damaging the polymeric side chains responsible for steric hindrance and dispersion effectiveness [75,76]. Such degradation can negatively impact the PCE’s ability to retain workability in cementitious systems. To verify that the chemical structure of PCE was not altered during the dispersion process used in this study, an FTIR analysis was performed.
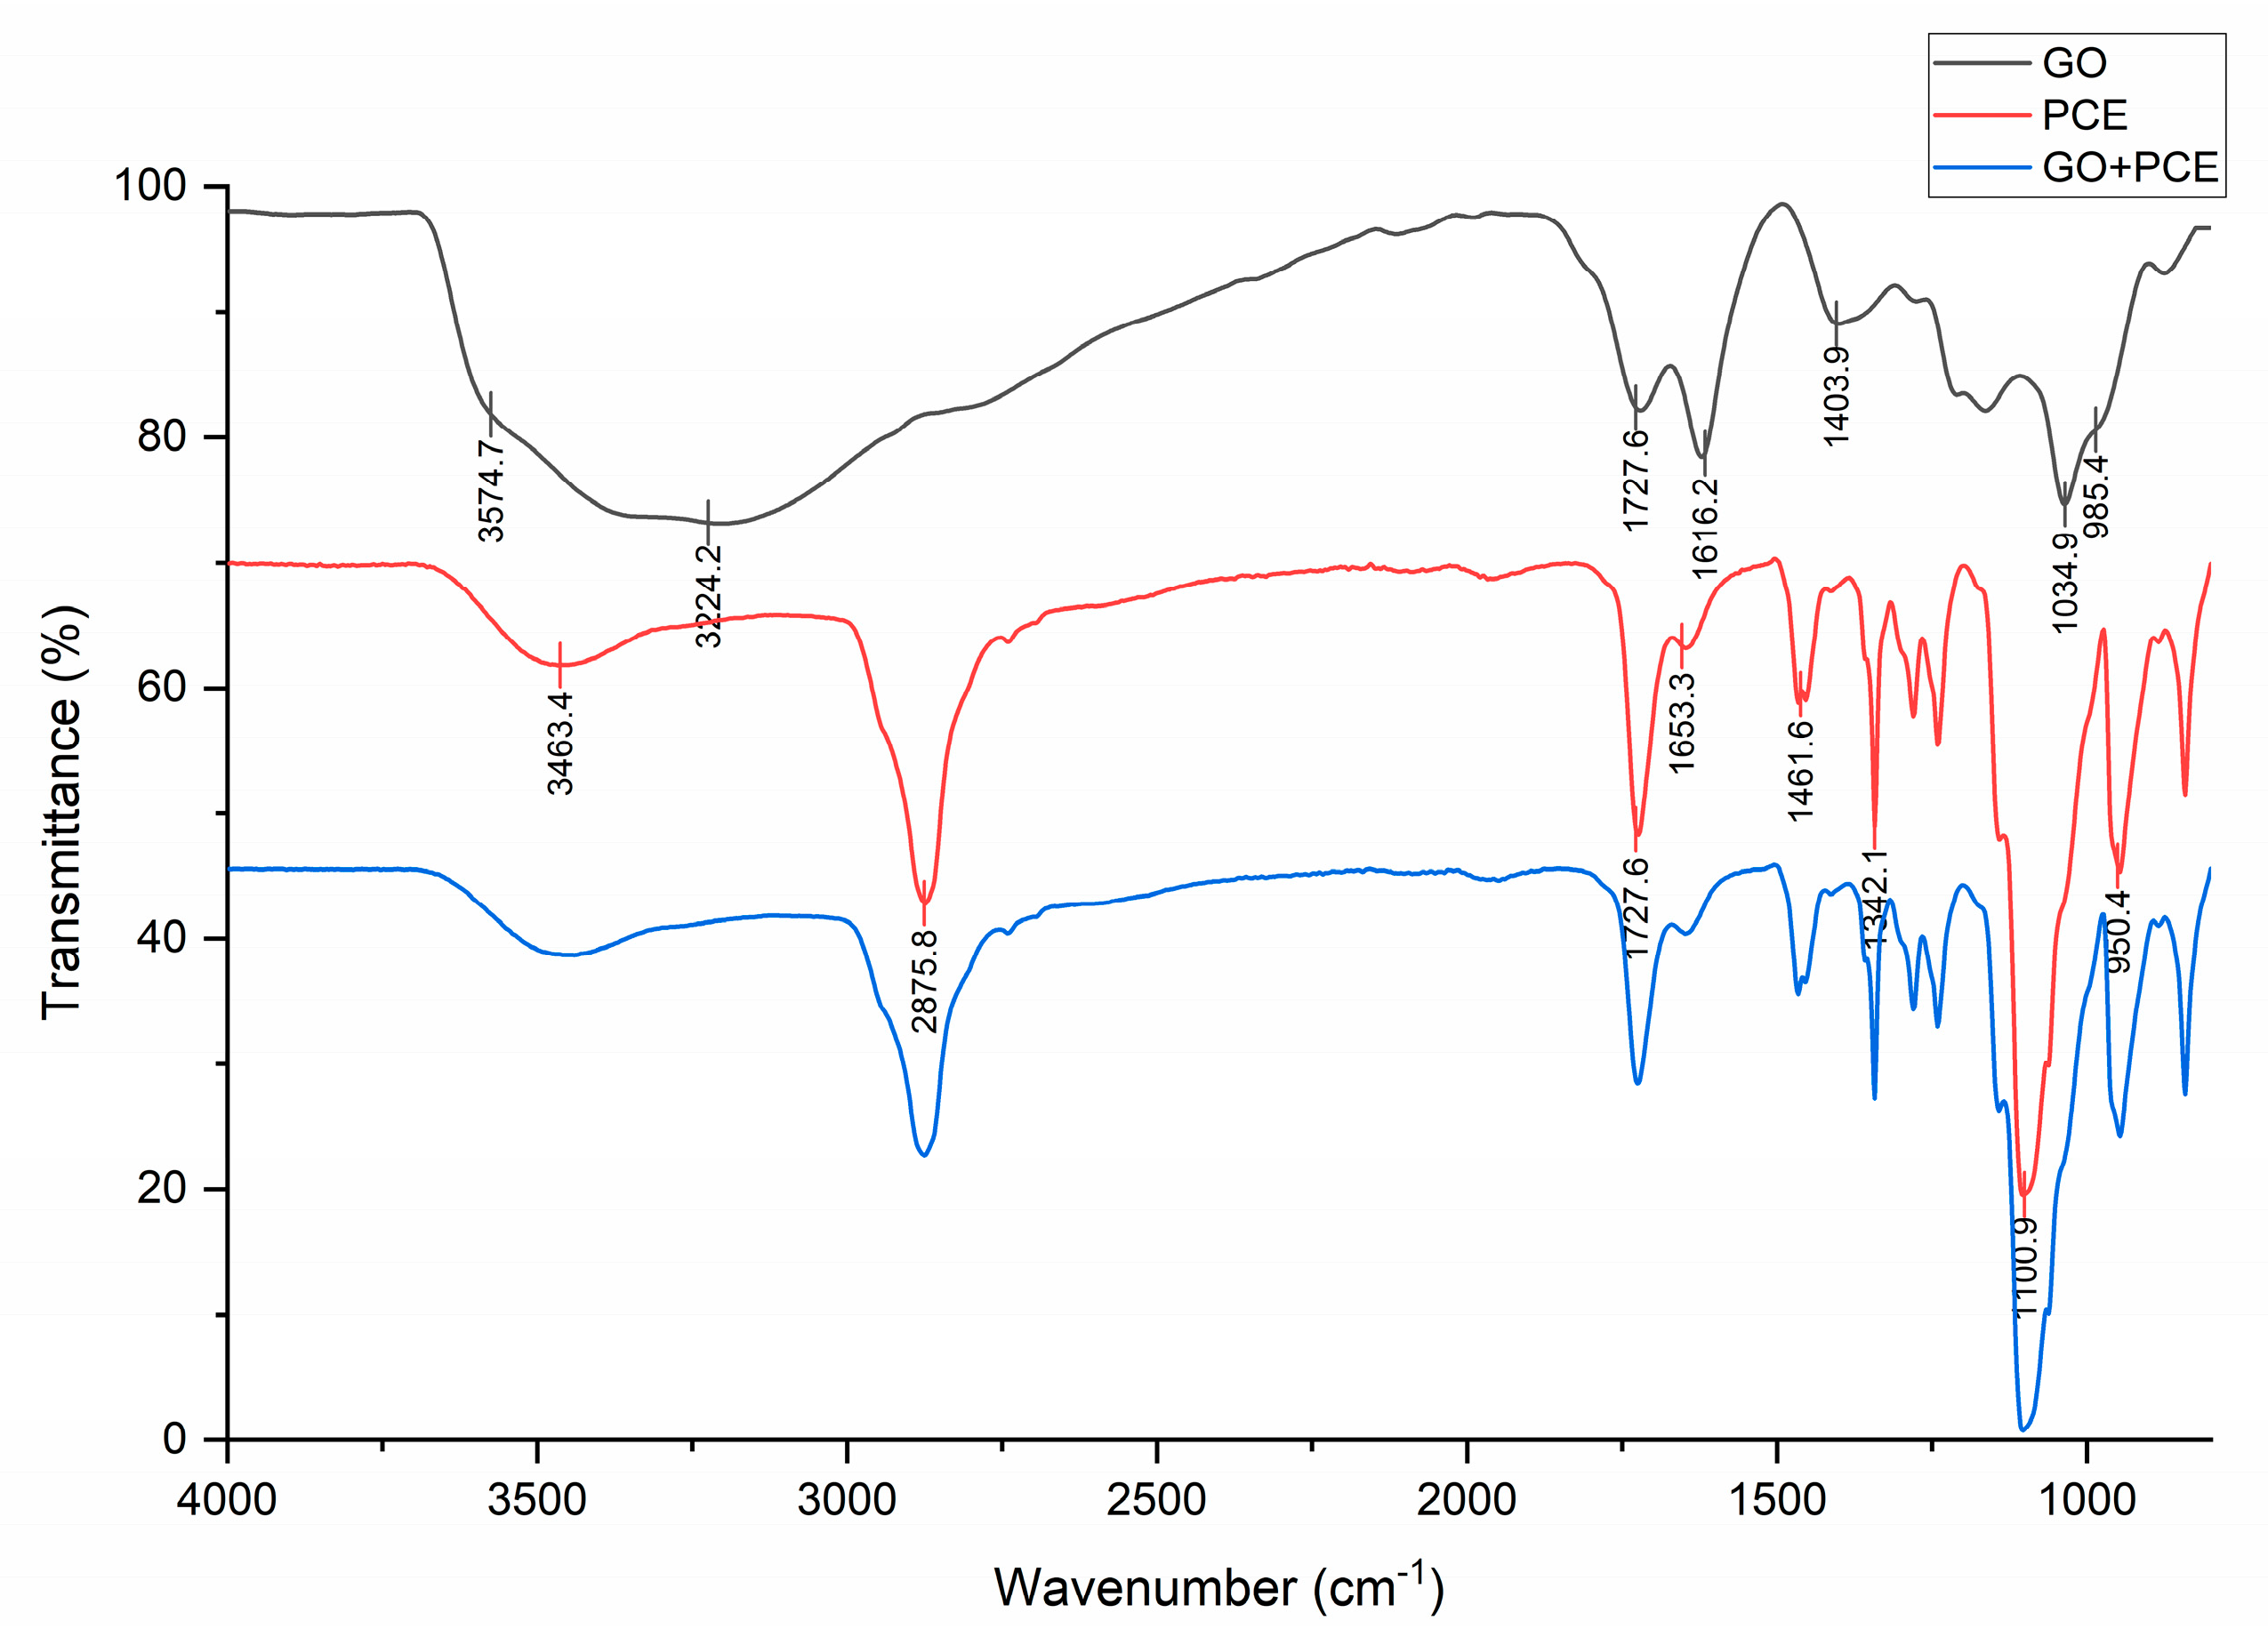
As illustrated in Figure 2, the FTIR spectra of GO, PCE, and the GO–PCE mixture provide clear evidence of chemical interaction, consistency and compatibility. GO exhibits characteristic peaks corresponding to oxygen-containing functional groups with broad –OH stretching (~3224–3575 cm−1), C=O stretching (~1727 cm−1), aromatic C=C (~1616 cm−1), and epoxy/alkoxy vibrations (~1043 and ~985 cm−1) [107]. PCE displays distinct peaks for –CH3 stretching (~2875 and 1342 cm−1), –C–O–C ether linkages of poly(ethylene oxide) (1100 cm−1), C=O stretching of esteric functionalities (1727 cm−1), broad –OH stretching (3463 cm−1), and quaternary ammonium cation functional group of [-CH2-N+ (CH3)3] (1461 and 950 cm−1) [108,109]. In the GO–PCE spectrum, notable spectral changes include the attenuation of GO’s –OH and aromatic C=C peaks, along with the emergence and intensification of peaks in the 2875–1100 cm−1 region, signifying the formation of ester, amide, and ether bonds. These shifts suggest covalent bonding between GO’s –COOH groups and PCE’s –COO moieties, confirming chemical compatibility [110]. Additionally, the presence of polyether side chains from PCE contributes to steric hindrance, while the negative charges on both GO and PCE enhance electrostatic repulsion, stabilizing the dispersion [111,112]. This multifaceted interaction mechanism highlights GO’s excellent compatibility with the PCE chemistry adopted in this study. Moreover, the FTIR spectra confirm that the primary functional groups associated with PCE remained intact, supporting the conclusion that the dispersion method preserved admixture integrity.
This tailored approach proved effective in maintaining comparable workability levels across all mixes. To the authors’ knowledge, few, if any, studies have achieved such consistency in workability performance across varying GO dosages without significantly increasing PCE or water content. This achievement features a critical advancement, as maintaining comparable workability with control mixes is a prerequisite for industrial use of any modified or enhanced concrete technology. Without comparable slump and fresh-state performance, even mixes demonstrating superior mechanical or durability properties remain unsuitable for industry integration [113]. The method demonstrated in this study successfully averts this issue.
Slump retention tests over a 90-min period revealed significant differences in workability loss between the control and GO-containing mixes (Figure 2). At 60 min, the control mix retained only 53% of its initial slump, whereas the 0.03% and 0.05% GO mixes retained 65% and 84%, respectively. These results indicate that GO inclusion delays the rate of slump loss, with more pronounced effects observed at higher dosages. Similarly, at 90-min duration, the control mix experienced a sharp reduction of 67.5%. In contrast, the mix containing 0.03% GO showed a slump reduction of 63% while the mix with 0.05% GO retained 53% of its initial slump even after 90 min duration. This mix (0.05-GO) demonstrated the most stable slump profile, with only a 47% reduction over 90 min. These retention trends suggest that, contingent on the synthesis, dosage, PCE compatibility and mixing method adopted in this study, GO contributes positively to maintaining workability over time.
The improved slump retention in GO-enhanced mixes is likely due to tailored, non-invasive mixing method and reduced agglomerations in concrete mix, as observed qualitatively during mixing and placement. This behaviour is particularly relevant for ready-mix and site-cast applications, where prolonged workability is essential to accommodate transportation and placement delays. The findings highlight that GO-modified systems, under appropriate dispersion techniques, can not only achieve comparable initial slump to conventional concrete but also significantly enhance retention, potentially reducing reliance on set retarders and mitigating issues related to early hardening in the field.

3.2. Air Content and Bleeding

The air content of the fresh concrete mixes was measured to assess the potential influence of GO on generating air voids. As shown in Figure 3, the results indicate a minor, gradual and consistent rise in entrapped air content with increasing GO dosage. At a dosage of 0.03%, GO increased air content by 4.5%, whereas a 0.05% addition resulted in a 13.6% escalation compared to the control mix. This trend is likely due to the high surface area and amphiphilic nature of GO nanosheets, which can promote microbubble formation during mixing.
Zeng et al. [41] and Mohammed et al. [114] report similar observations, highlighting that GO alone does not substantially alter air content when compared to dedicated air-entraining agents, and hence it can be established that GO does not cause adverse air entrapment in concrete. However, Lee et al. [115] observed a 10.7% reduction in air content in GO-enhanced cementitious composites, which may be attributed to the significantly reduced workability (a 31.7% slump reduction relative to the control) reported in their study. Notably, in the present study, the comparable air content observed between the control and GO-modified mixes is attributed to the achievement of similar workability profiles, particularly slump and slump retention. This reinforces one of the key advances addressed in this work, that poor workability in GO concrete may inadvertently lead to increased air entrapment, whereas the tailored, non-invasive dispersion approach employed in this study preserves not only workability but also the entrapment of air. As such, the GO-admixed concretes produced in this study exhibit fresh-state properties that are holistically consistent with those of conventional concrete, resolving a critical barrier to the broader application of GO in structural systems.
Despite these increases, all recorded values remained within acceptable limits for structural concrete applications, and no intentional air-entraining agents were used in this study. Importantly, the slight rise in air content did not compromise the fresh-state workability or hardened-state mechanical performance, as evidenced by slump and subsequent strength test results. These findings suggest that, at the dosages employed in this study, GO does not adversely affect air content to a degree that would require additional mix design modifications. Furthermore, the absence of abrupt or erratic variations in air content across the test range reinforces the reproducibility and stability of the adopted GO dispersion and mixing strategy, emphasizing its practical applicability for field implementation.
Moreover, bleeding tests were conducted to evaluate the stability of the fresh concrete mixes and assess whether the incorporation of GO influenced water segregation behaviour. As reported in Table 5, no visible bleeding was observed in any of the mixes, including the control (0-GO) over the entire observation period of 90 min. These results suggest that all mixes exhibited excellent fresh-state stability, with no upward migration of free water during the setting period.
The complete absence of bleeding across all time intervals is noteworthy, particularly for the GO-containing mixes, as it aligns with previous literature, which has highlighted that the high surface area and hydrophilic nature of GO can significantly alter water distribution and retention characteristics in cementitious systems [116]. These results are corroborated by Ginigaddara et al., demonstrating the high-water affinity of GO induced cementitious composites and lack of evaporable free water in fresh cementitious mixes containing GO [71]. The uniform bleeding performance across all mixes is likely attributed to several factors. First, the low water-to-binder ratio (0.30) inherently limits excess water in the mix, reducing the potential for water to rise to the surface. Second, the presence of GO, especially when well-dispersed using a tailored PCE system, enhances the formation of a cohesive microstructure at the early ages [117].
From a practical standpoint, absence of bleeding has significant implications for surface finish quality, durability performance, and dimensional stability (shrinkage) in real-world applications. While excessive bleeding can lead to weak surface layers, increased porosity, and localized shrinkage, for practical applications, a controlled, minor amount of bleeding is required to counteract surface water evaporation and mitigate the risk of plastic shrinkage cracking [118]. In mixes with very low bleed characteristics, such as the mixes in this study, attention must be given to surface curing strategies, including the use of evaporation retarders such as aliphatic alcohols [119]. Overall, these results confirm that the inclusion of GO, under controlled dispersion conditions, does not introduce bleeding-related risks and supports the material’s potential for improving early-stage concrete performance.

3.3. Compressive Strength

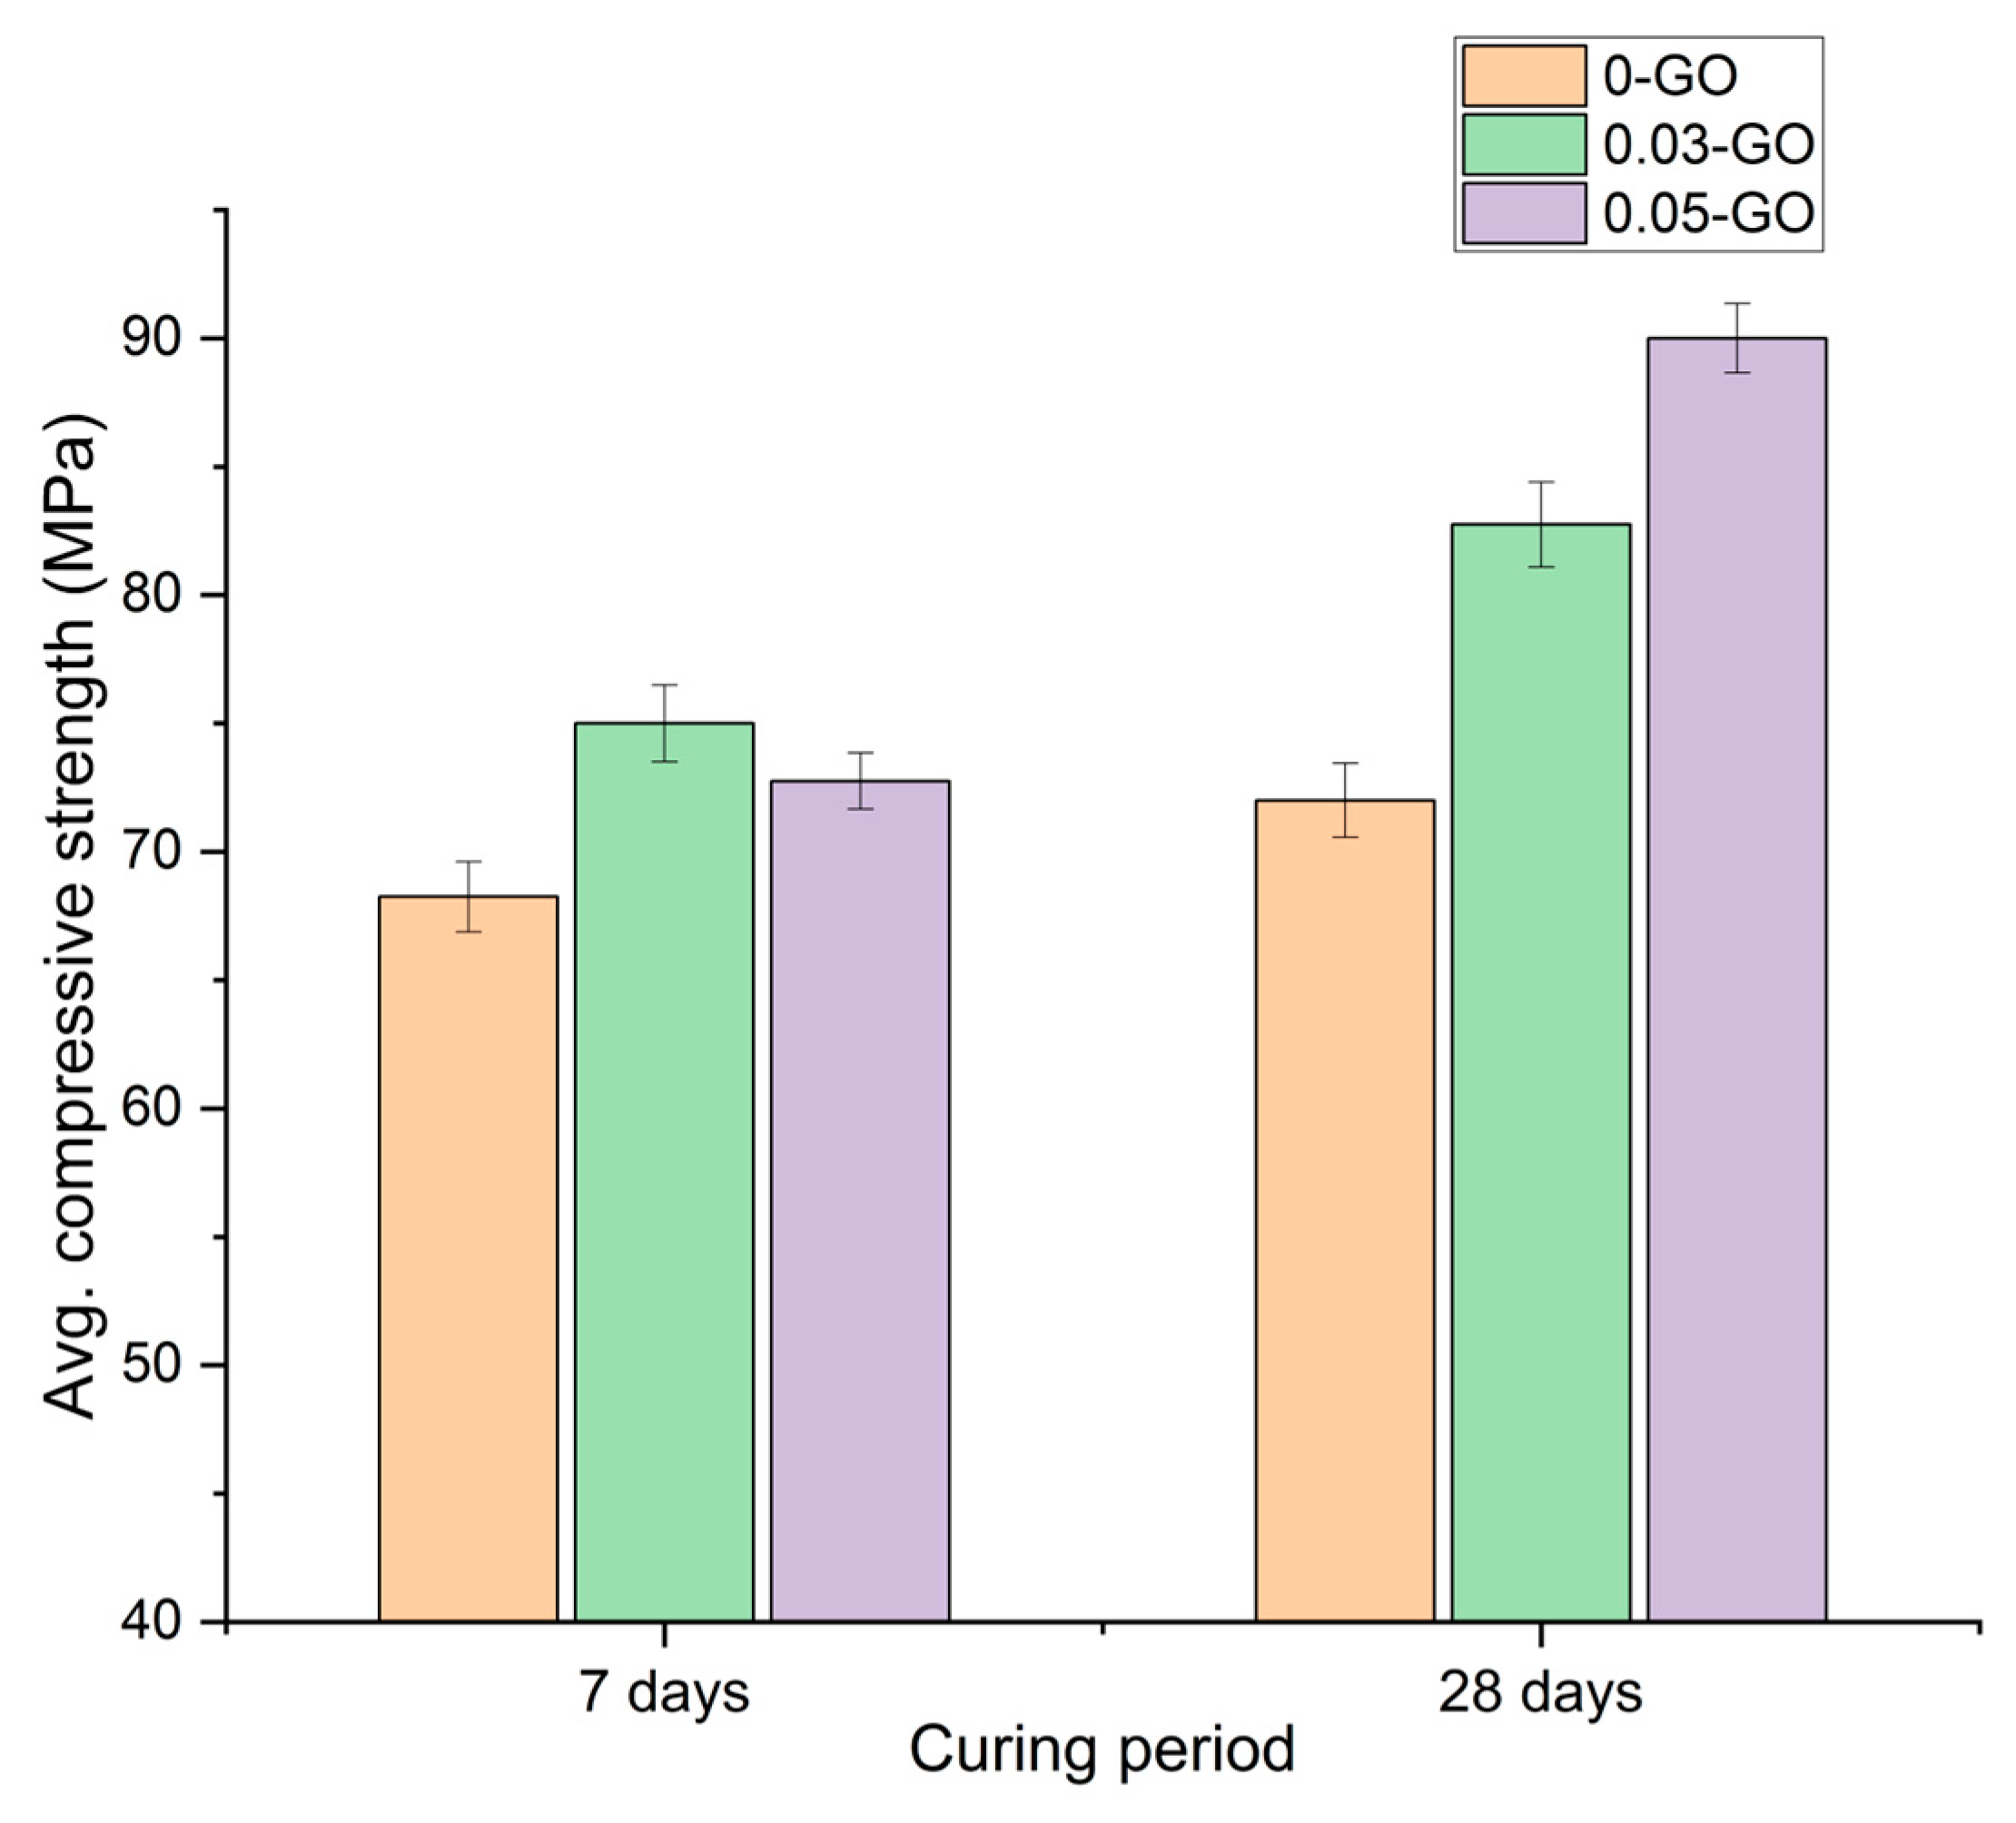
Compressive strength tests were conducted at 7 and 28 days to evaluate the influence of GO on early and later-age strength development of concrete. The results, presented in Figure 4, indicate a clear enhancement in compressive strength with the addition of GO.
At 7 days, with respect to the control mix (0-GO), 0.03-GO and 0.05-GO mixes achieved strength increases of 9.9% and 6.6%, respectively. By 28 days, the strength gains were more pronounced, where the 0.03-GO and 0.05-GO mixes achieved strength increases of 14.9% and 25.0%, respectively. These findings confirm that the inclusion of GO at both dosages improves compressive strength, with the effect becoming more substantial at later curing ages (28 days). Notably, the 0.05-GO mix demonstrated the highest 28-day strength, contributing positively to long-term strength development, notwithstanding a slightly reduced early-age strength gain compared to the 0.03-GO mix.
Previous studies investigating GO-admixed concrete have consistently reported enhancements in compressive strength [120], particularly at dosages exceeding 0.05% bwoc [22,50,121,122]. Verma et al. [23] reported that GO dosages below 0.05% bwoc yielded no statistically significant improvements in compressive strength. In their findings, once the GO concentration exceeded 0.05% bwoc, additional strength gains were observed. While previous studies have reported notable improvements in compressive strength, these gains are accompanied by substantial reductions in workability. Such reductions suggest inadvertent modification of the w/c ratio due to the high-water affinity and surface area of GO nanosheets. In these cases, the reported strength enhancements are, at least in part, associated with the reduced effective w/c ratios.
In contrast, the present study demonstrates that compressive strength can be enhanced while maintaining workability equivalent to the control mix. The same PCE dosage and water content were used across all mixes and these results provide clear evidence that the observed strength gains were not driven by reduced w/c ratio, but rather by GO’s intrinsic contribution to hydration kinetics and microstructural refinement.
To the best of the authors’ knowledge, no prior studies have reported strength improvements of this magnitude without compromising workability or modifying mix design parameters. This finding directly addresses a critical limitation in GO-concrete literature and affirms that performance gains are achievable through dosage-optimized and dispersion-compatible GO integration. From a technological standpoint, this offers a validated pathway for implementing GO in concrete without sacrificing operational feasibility or requiring admixture re-optimization.
The observed strength improvements of this study can be attributed to several potential mechanisms, such as accelerated hydration [20] and improved microstructure [123]. GO is known to possess a high density of oxygen-containing functional groups (e.g., hydroxyl, epoxy, and carboxyl), which can facilitate nucleation sites for hydration products such as CSH [124]. This accelerates early hydration reactions, leading to denser microstructures and increased early strength. The enhanced hydration is substantiated by the TGA analysis presented in Section 3.8 of this study. The two-dimensional nanostructure of GO allows them to occupy nano- and micro-scale voids within the cement paste, contributing to matrix densification [125] and pore refinement [126]. This filler effect helps reduce the overall porosity of the hardened composite, thereby enhancing strength [127].
As scientifically validated by the author’s previous work [71], GO nanosheets can act as nano-reinforcements within the matrix, helping to bridge microcracks and redistribute stress, particularly in the post-microcracking stage. This contributes to improved mechanical integrity, especially at later stages of curing. Interestingly, while both GO-containing mixes outperformed the control, the 0.03% dosage resulted in higher early-age (7-day) strength than the 0.05% mix. This may reflect a threshold beyond which further increases in GO content do not yield proportional early strength gains, possibly due to increased viscosity or reduced workability at higher dosages, which could affect packing density and early hydration kinetics [128]. The superior 28-day strength of the 0.05-GO mix, however, indicates that any minor early-age compromises are offset by continued microstructural refinement and hydration over time. However, while the 0.05-GO mix demonstrated superior strength, it is important to acknowledge that this represents the best-performing outcome under the controlled conditions of this study, rather than an average result. Achieving such performance consistently in real-world applications remains a challenge due to factors such as variability in GO quality, dispersion effectiveness, and compatibility with other mix constituents. Nevertheless, this finding is significant from an application perspective, as it demonstrates that GO not only supports early strength development but also contributes to sustained long-term performance.

3.4. Tensile Strength

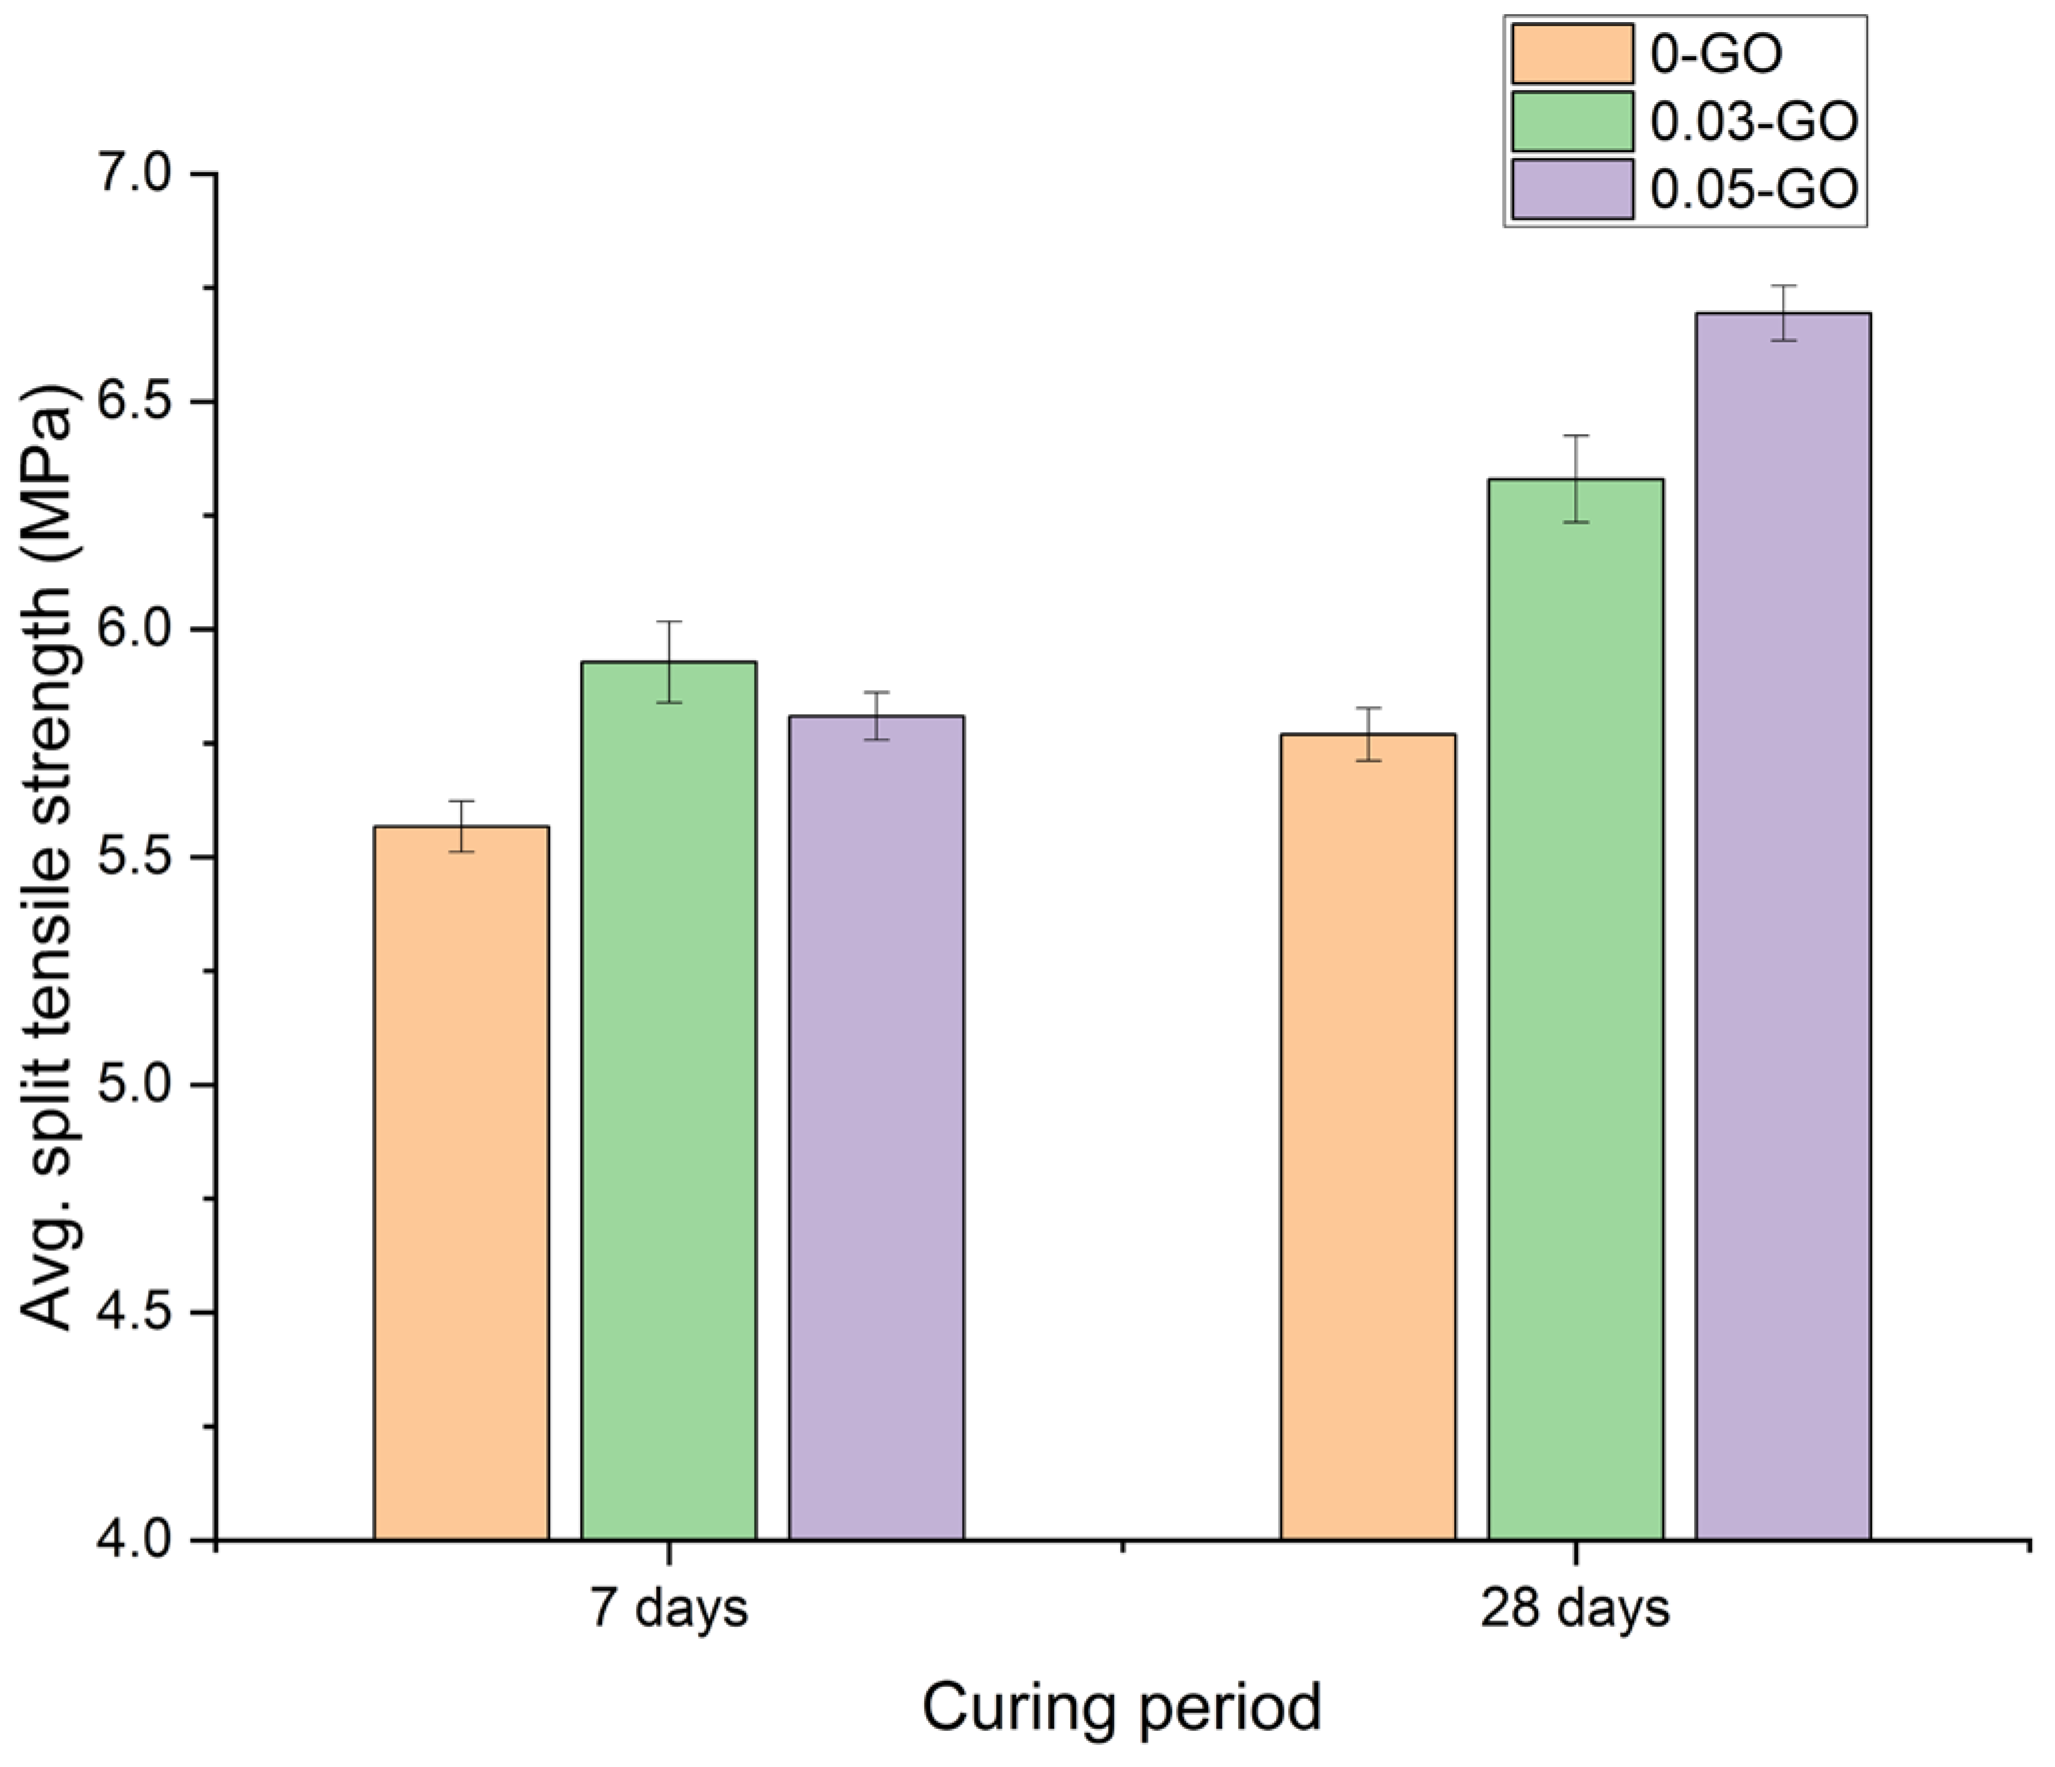
The tensile strength, commonly assessed through the splitting tensile test, was evaluated at 7 and 28 days. The test results, illustrated in Figure 5, reveal a consistent enhancement in tensile strength with increasing GO dosage, both at early and later curing ages.
Compared to the control mix (0-GO) at 7 days, the 0.03-GO and 0.05-GO mixes exhibited strength increases of 6.5% and 4.3%, respectively. By 28 days, the improvements became more significant, where 0.03-GO and 0.05-GO mixes achieved tensile strength improvements of 9.7% and 16.0%, respectively. These results clearly demonstrate that GO incorporation enhances the tensile load-bearing capacity of the concrete matrix, with the 0.05-GO mix showing the highest 28-day tensile strength, consistent with the trends observed in the compressive strength results. Comparable trends in tensile strength improvements have been observed in previous studies. For instance, Shareef et al. [25] reported a 17.4% increase in 28-day split tensile strength at a GO dosage of 1% bwoc, relative to the control mix. Similarly, Sharma et al. [129] documented a 15% enhancement in tensile strength under the same GO dosage. In contrast, the present study achieved comparable tensile strength gains using significantly lower GO concentrations, while simultaneously maintaining comparable fresh-state performance parameters to the reference mix. The positive influence of GO on tensile strength can be attributed to improved stress transfer at micro- and nano-scales [130]. The high surface energy of GO facilitates strong mechanical interlocking and chemical interaction with hydration products. This enhances the stress transfer efficiency across the matrix, especially under indirect tensile loading conditions, where internal pores and microcracks are more critical [131].
Importantly, these findings address the critical limitation of poor tensile capacity in conventional concrete systems [132]. Enhancing tensile strength without altering the mix design or increasing cement content offers a significant performance advantage, especially in structural elements prone to flexural or tensile loading conditions [133]. While this study focused on 7 and 28 days of strength development, the long-term mechanical performance of GO-enhanced cementitious composites, such as creep, fatigue resistance, and sustained load capacity, remains an important area for further study. Previous studies have shown that nanomaterials such as GO, when effectively dispersed, can enhance microstructural stability and reduce creep deformation due to densified interfacial zones and stress redistribution at the nanoscale [134]. Additionally, the crack-bridging and toughening effects of GO may contribute to improved fatigue resistance under cyclic loading conditions. While this hypothesis is supported by microstructural trends reported in the subsequent sections in this study, experimental validation under long-term loading scenarios is required to fully establish the viability of GO-concrete systems in sustained service environments.

3.5. Flexural Strength (Modulus of Rupture)

The flexural performance of the concrete mixes was evaluated through three-point bending tests, providing further insights into the role of GO in enhancing mechanical performance and fracture resistance of concrete. Flexural strength, being more sensitive to surface flaws and microcracks than compressive strength, serves as a critical indicator of crack resistance under bending loads [135].
The results (Figure 6) indicate that the incorporation of 0.03% GO did not result in any change in flexural strength at 28 days. This suggests that, at low dosages, the dispersion and functional contribution of GO may not be sufficient to substantially alter the fracture toughness of the material. Conversely, the 0.05-GO mix exhibited a 7% improvement in flexural strength compared to the control. This increase, while modest, signifies that, at higher dosages, GO begins to contribute to flexural performance, most likely through mechanisms such as crack-bridging [136] and enhanced bonding at the paste–aggregate interface [63]. These improvements align with prior observations in splitting tensile and compressive strength results, confirming a consistent trend of performance enhancement at this higher GO dosage. However, it is noted that the improvement in flexural strength does not scale linearly with GO dosage. This variability is likely influenced by dispersion uniformity and the diminishing marginal benefits of higher GO content beyond a certain threshold.
Notably, the flexural response appears to be more sensitive to GO dosage thresholds than the other mechanical parameters. This outcome highlights the importance of achieving an optimal dosage and dispersion condition for GO to exert meaningful effects on fracture-related properties. It also highlights the role of flexural strength as a more perceptive measure of GO’s microstructural influence, where marginal improvements reflect not just strength gain but also enhanced toughness and energy absorption capacity under bending stresses [137]. Overall, the results reinforce that, while lower GO dosages are insufficient to impact flexural behaviour, higher dosages, such as 0.05%, can deliver measurable improvements.

3.6. Modulus of Elasticity

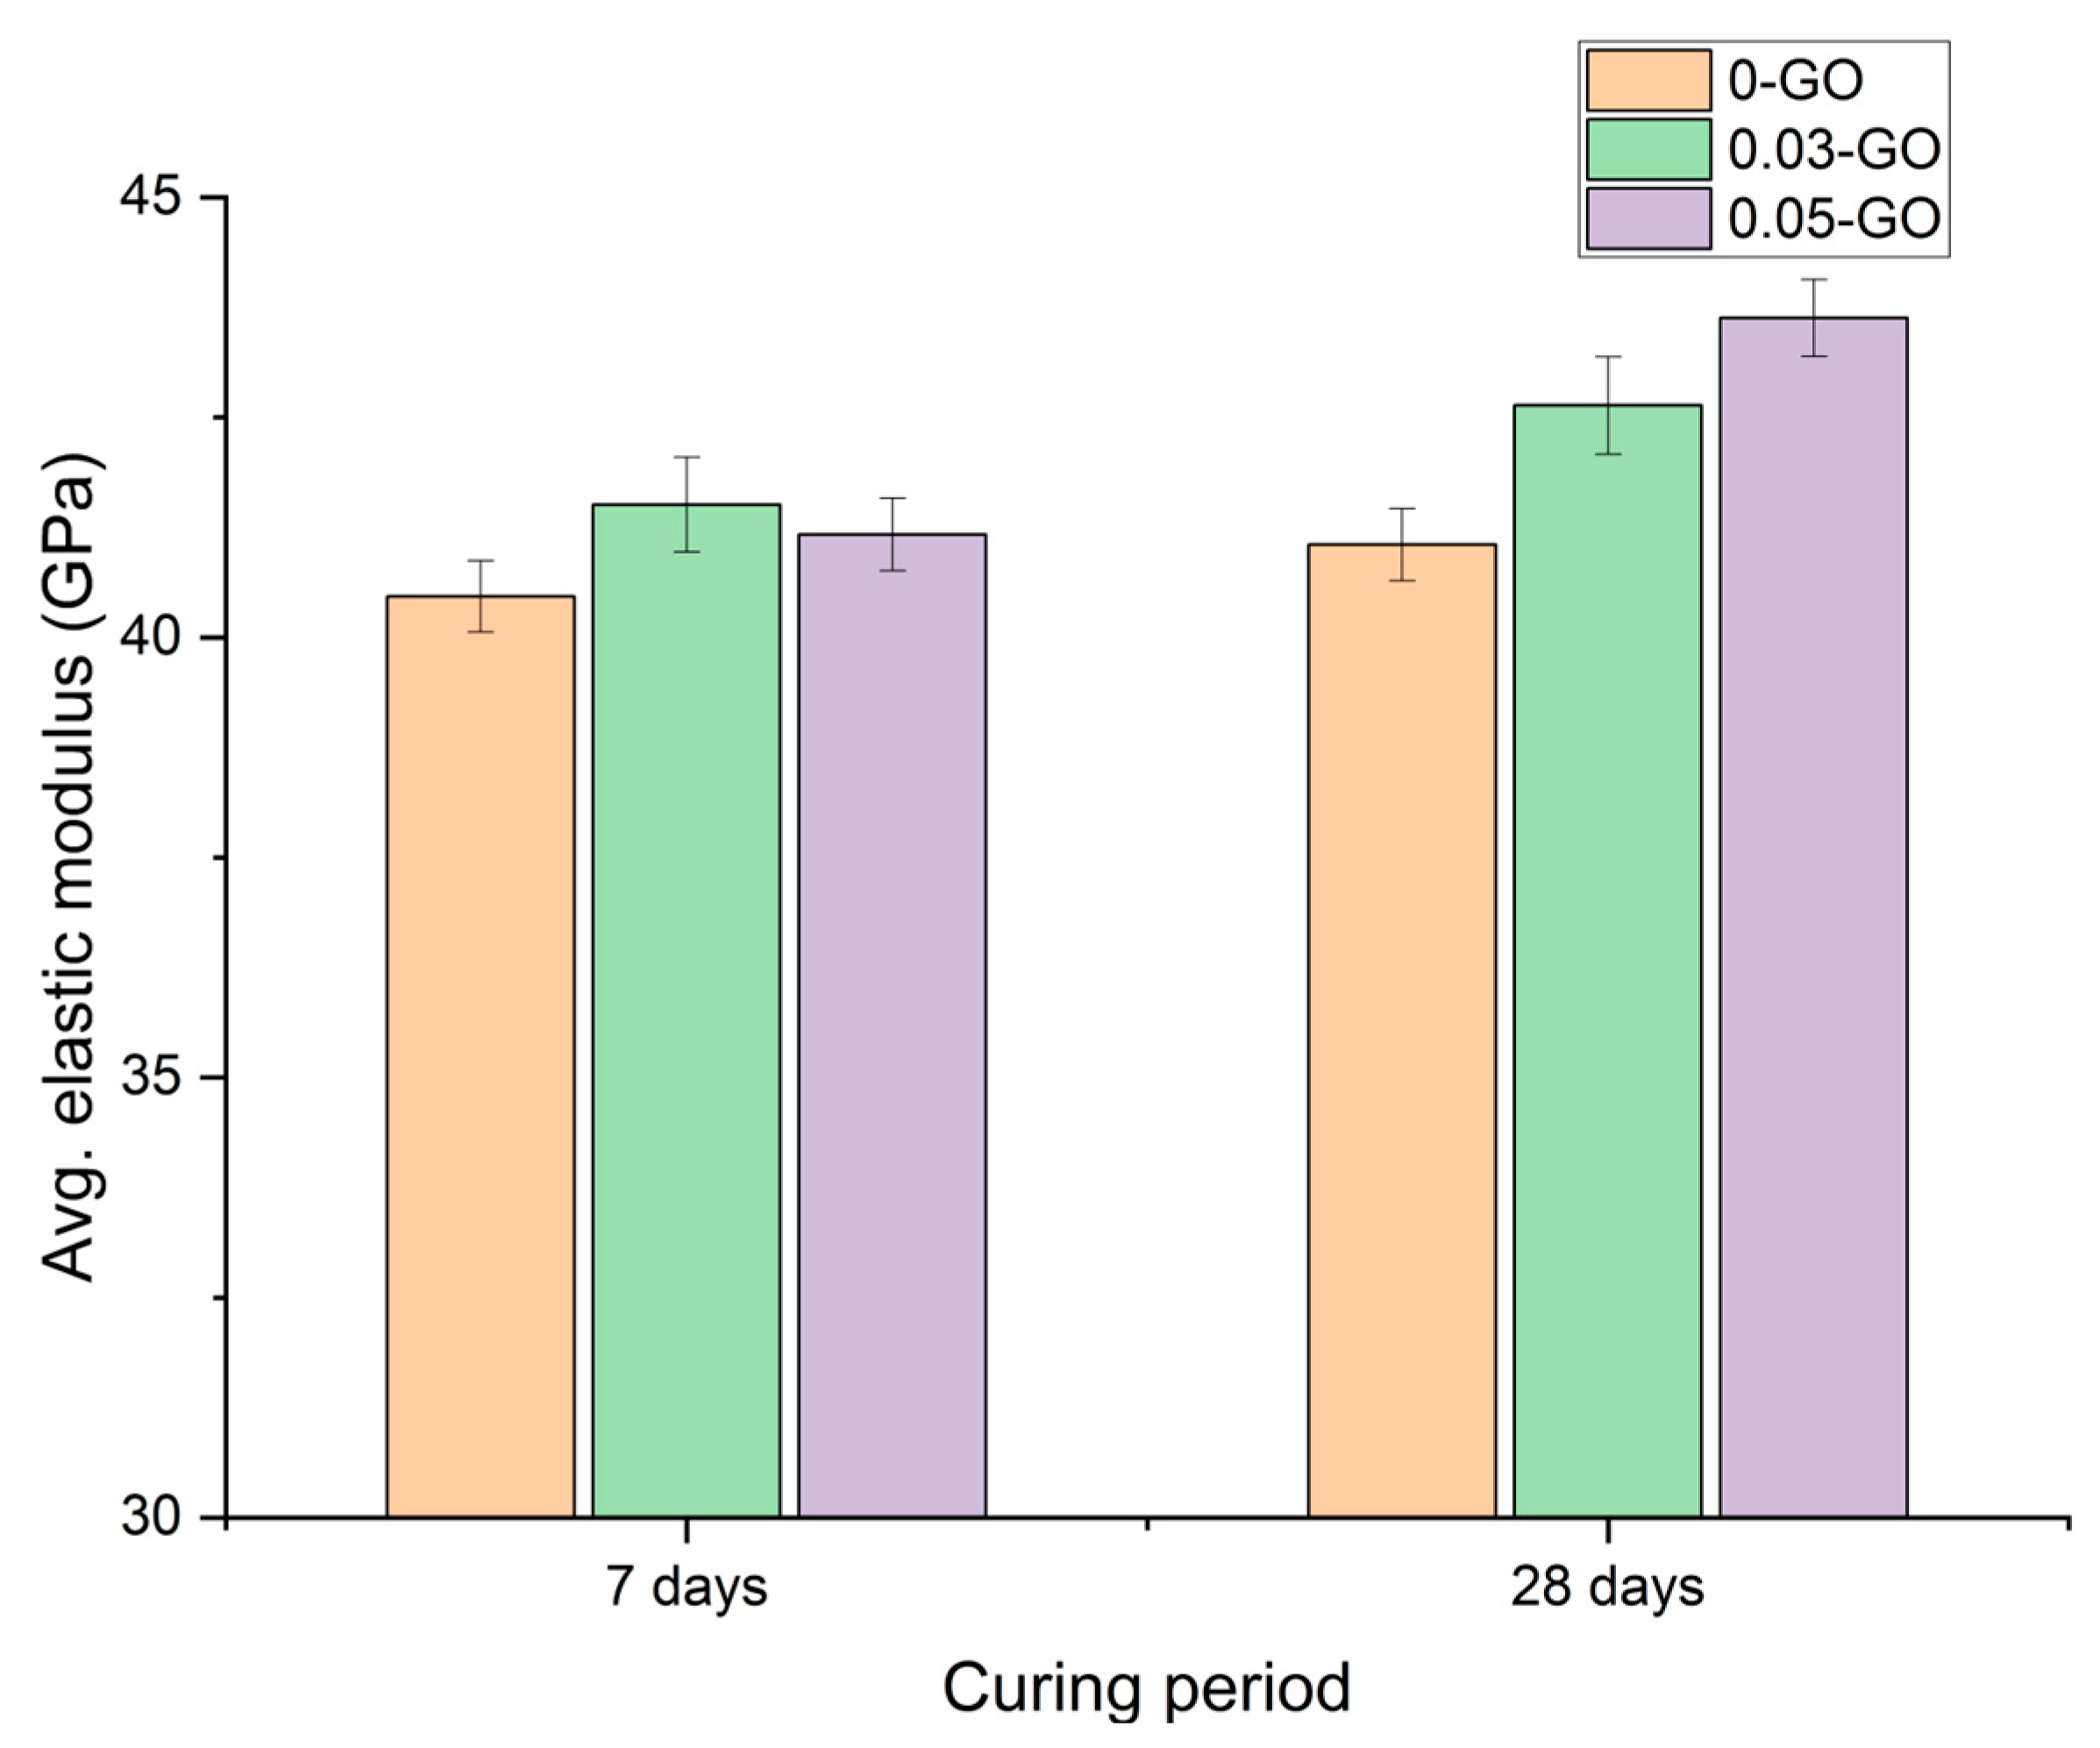
The elastic modulus of concrete is a key mechanical property that reflects its stiffness and deformation response under axial loading. As shown in Figure 7, at 7 days, the addition of 0.03% and 0.05% GO resulted in increases of 2.6% and 1.7%, respectively, in the elastic modulus relative to the control mix. By 28 days, these increases grew to 3.9% and 6.3%, respectively, suggesting a continued gain in stiffness as hydration progressed and the microstructure further developed.
These findings are consistent with earlier observations in compressive and tensile strength tests, wherein the 0.05-GO mix consistently demonstrated superior mechanical performance. From a structural design standpoint, a 6.3% increase in modulus of elasticity at 28 days is significant, as it directly translates to improved load-bearing performance and reduced long-term deflections in service [134]. The relationship between GO dosage and elastic modulus appears non-linear, which suggests that the mechanical response may be governed by microstructural densification and crack-bridging effects that do not increase proportionally with GO content.
Consistent with the present findings, Krystek et al. [138] reported a modest 9% increase in the elastic modulus of cementitious composites following the incorporation of 0.05% GO synthesized via electrochemical exfoliation. Similarly, Lin et al. [139] observed an 8.6% enhancement in elastic modulus, increasing from 12.63 GPa in the control sample to 13.71 GPa in the GO-incorporated mix. These results collectively support the notion that low dosages of GO can modestly enhance the elastic stiffness of cementitious composites, notwithstanding the less pronounced gains compared to improvements in compressive strength. Importantly, the elastic modulus results of this study suggest that GO does not simply enhance strength but also contributes to the stiffness and integrity of the hardened concrete, further validating its multifunctional properties. The correlation between increased stiffness and GO dosage also reinforces the view that the material’s nanofiller effect, combined with its hydration-promoting characteristics, can yield measurable performance gains when appropriately dosed and dispersed.

3.7. Drying Shrinkage

Drying shrinkage is a critical parameter in assessing the dimensional stability and long-term durability of concrete, particularly in restrained structural elements where shrinkage-induced cracking can severely impair serviceability and durability [140]. In this study, drying shrinkage was monitored over a 56-day period as shown in Figure 8, and the values represent the average of three specimens for each mix at each time point. The observed variability across replicates remained within ±12–18 μm, which is consistent with the adopted standard procedure [82]. The control mix (0-GO) exhibited a progressive increase in shrinkage strain, reaching 510 µm by 56 days. The GO-modified mixes demonstrated comparable shrinkage values, with the 0.03-GO and 0.05-GO mixes both stabilising at 500 µm at the end of the monitoring period. This corresponds to a negligible (~2%) reduction in long-term shrinkage relative to the control. However, given the high variability typically associated with drying shrinkage tests (often in the range of ±100 µm), such differences may fall within the margin of experimental uncertainty [141]. Moreover, shrinkage is not typically considered a critical performance parameter for most structural concrete applications, where the impact of shrinkage is more effectively managed through design detailing and appropriate jointing strategies [142].
At early ages (7 days), the GO-containing mixes showed slightly lower shrinkage values, both registering 270 µm compared to 280 µm in the control, which is a 3.6% reduction. By 14 days, however, all mixes recorded an identical value (350 µm), indicating a convergence in shrinkage behaviour during the early hydration stage. The similarities in shrinkage at 21 and 28 days across all mixes suggest that GO had limited influence during the intermediate phase of hydration. Nevertheless, the 2% lower final shrinkage observed in the GO mixes at 56 days may be attributed to the microstructural effects induced by GO, particularly its influence on matrix densification [143]. These findings align with those reported by Kumar et al. [144], who observed a reduction in drying shrinkage with increasing GO dosage, specifically from 0% to 0.065% bwoc, in concrete mixes incorporating OPC and fly ash. These findings collectively support the hypothesis that low dosages of GO can effectively mitigate drying shrinkage. Although the reductions in shrinkage are modest, the consistency of the trend across both GO dosages reinforces that the material did not result in any adverse increase in shrinkage, which is an important consideration given that nanomaterials, depending on their interactions with the cement matrix, can sometimes exacerbate shrinkage due to higher surface water demand [145].

3.8. Strength Gain Mechanisms

3.8.1. SEM/EDS Based Microstructural Assessment

To provide direct morphological and compositional evidence on the role of GO within the cementitious matrix, SEM and EDS analyses were conducted on 28-day cured specimens for both the control (0-GO) and GO-modified (0.05-GO) mixes and the results are depicted in Figure 9.
The SEM micrographs reveal distinct microstructural differences between 0-GO and 0.05-GO samples. The 0-GO sample (Figure 9a) exhibits typical hydration morphology, while the 0.05-GO sample (Figure 9b) displays the presence of numerous dark grey regions dispersed across the matrix. Elemental mapping of carbon in the 0.05-GO sample (Figure 9c) confirms that these dark grey regions correspond to high-carbon-density zones, attributed to the embedded GO nanosheets. This is further supported by the carbon map of the 0-GO sample (Figure 9d), which shows only background carbon levels consistent with minimal organic content. The distinct increase in carbon signal intensity and dispersion in the 0.05-GO sample strongly indicates the successful integration and uniform dispersion of GO within the hardened cement matrix. The presence of well-distributed carbon signals post-curing suggests that GO remained stably embedded in the matrix, with no visible signs of agglomerations [146,147].
In addition to the carbon mapping, the EDS elemental maps for calcium (Ca), aluminium (Al), and silicon (Si) show a more homogeneous and densely distributed profile in the 0.05-GO sample (Figure 9f,h,j, respectively) compared to 0-GO (Figure 9e, g, i, respectively). This suggests that GO may have facilitated a more uniform nucleation and growth of hydration products [148], contributing to the enhanced microstructure observed in subsequent sections of this study.

3.8.2. Evolution of Water Phases Through 1H-NMR

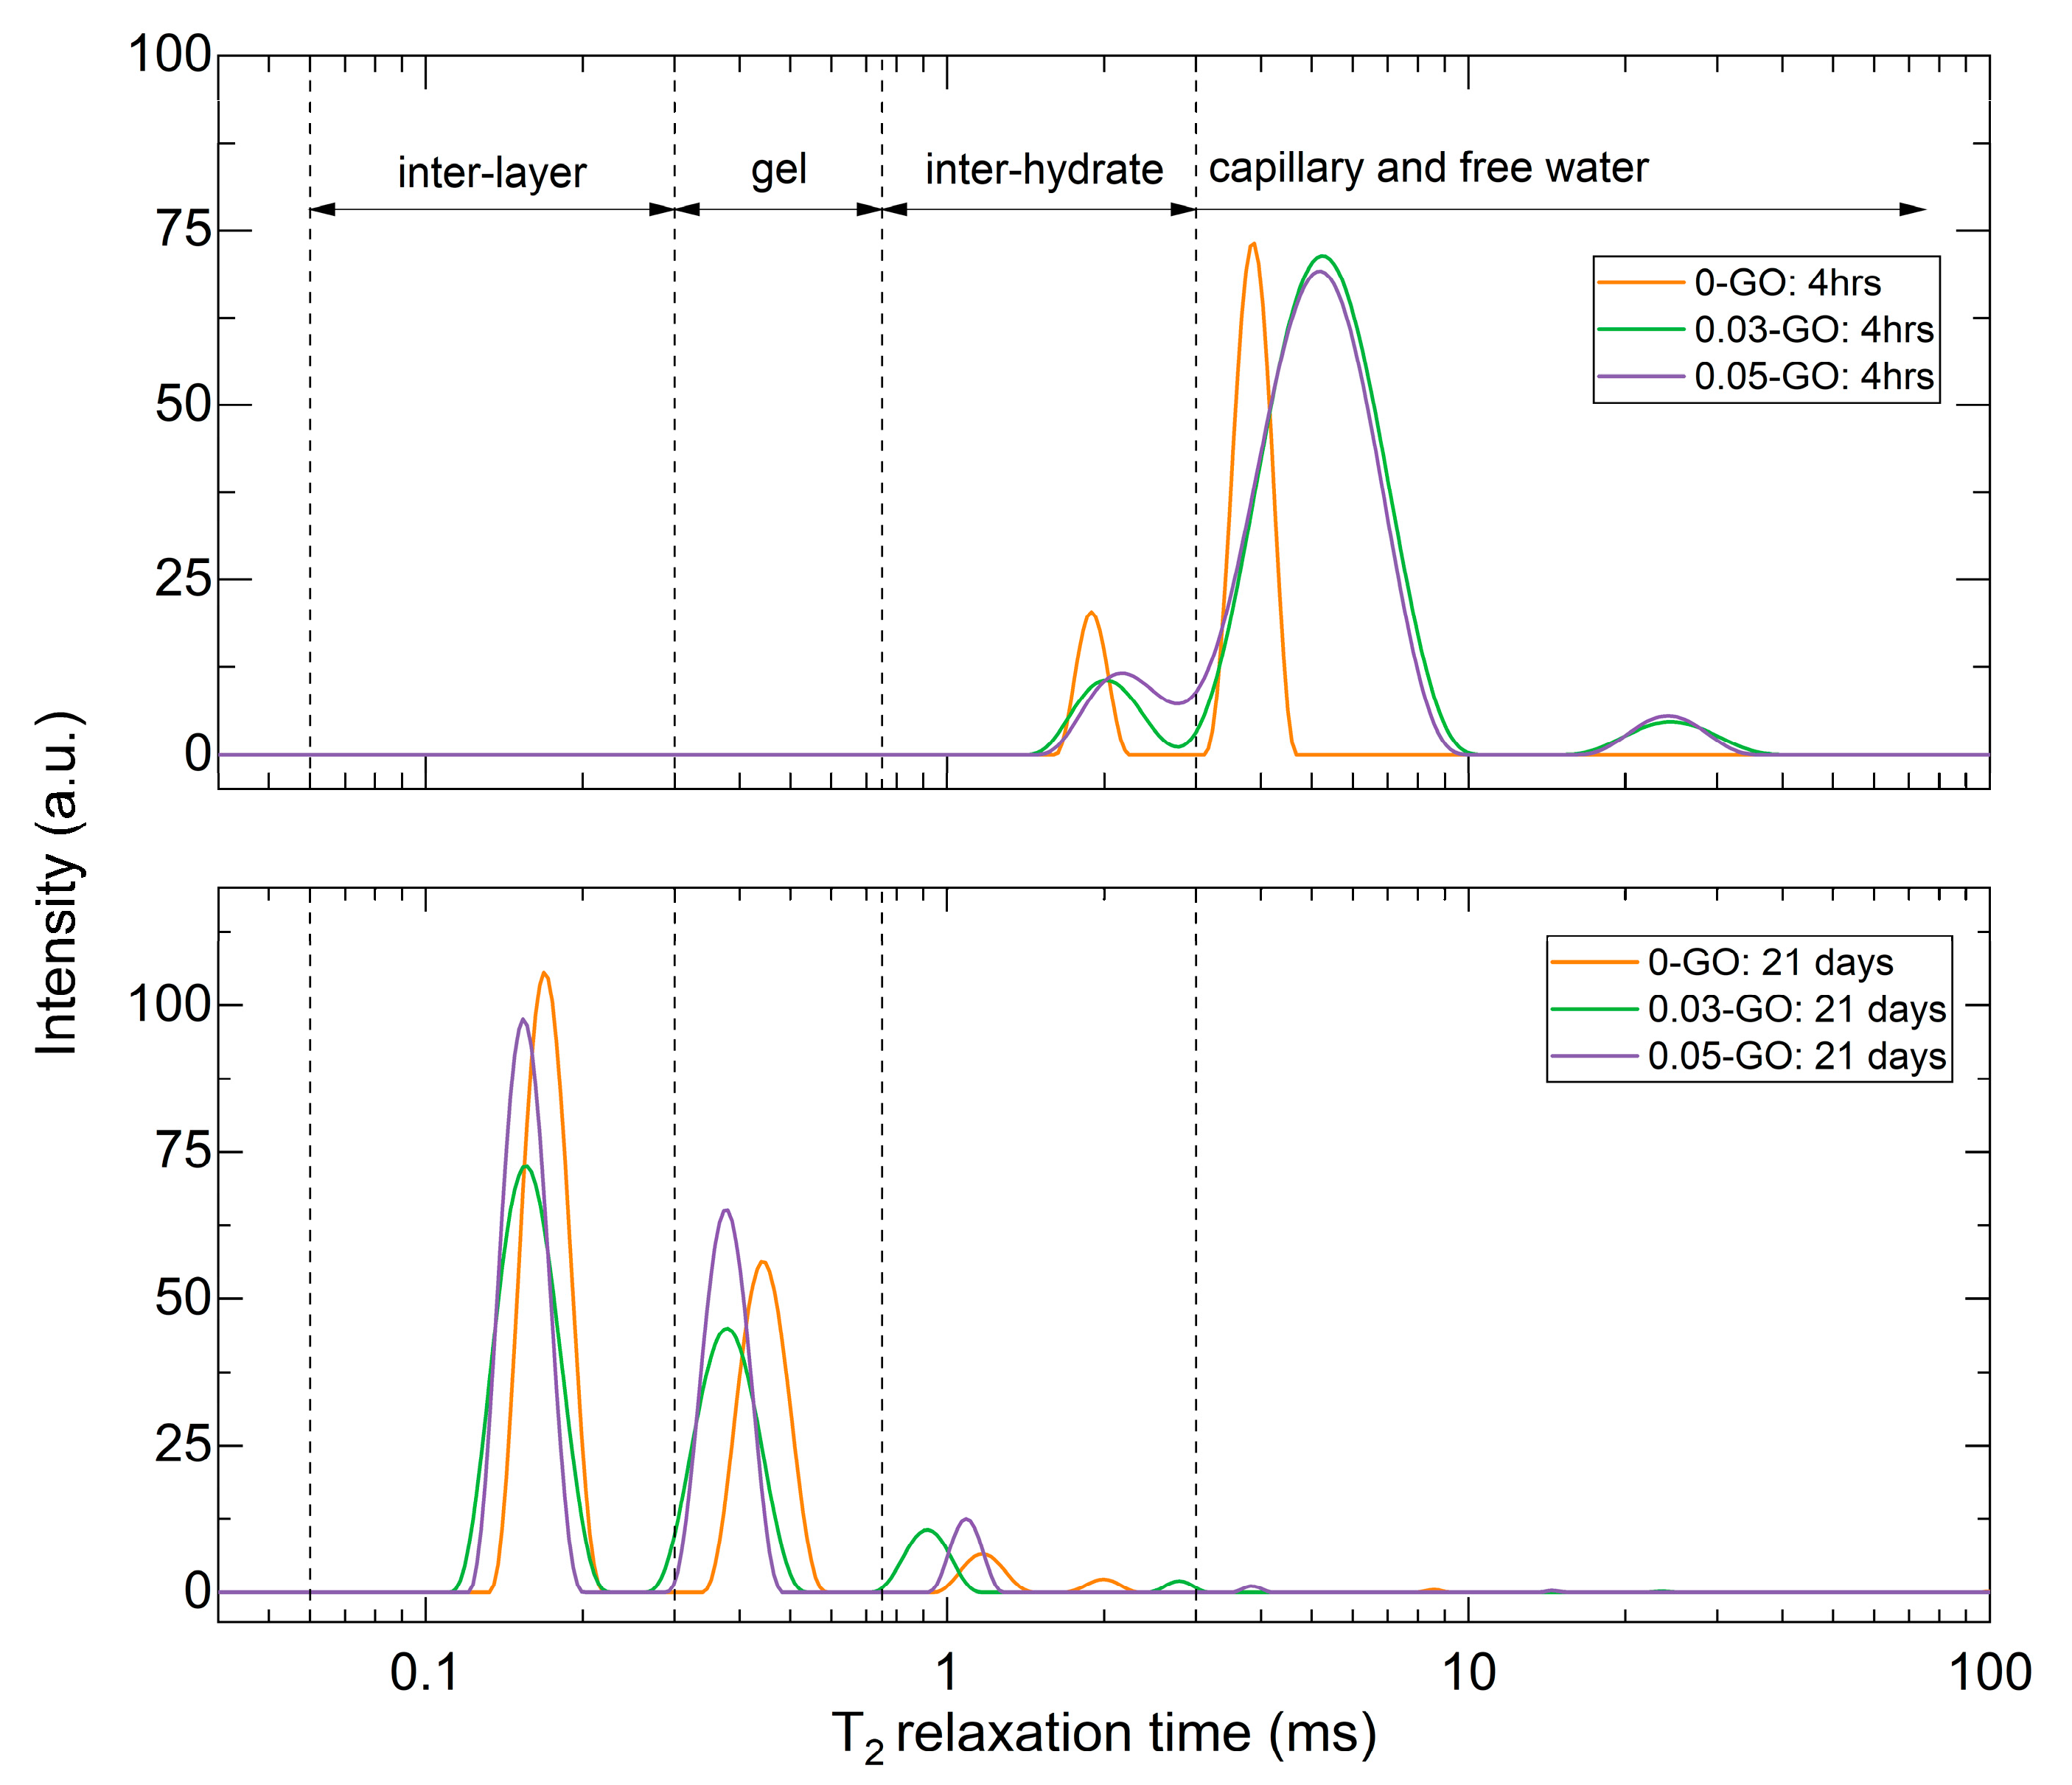
1H-NMR spectroscopy was used to study the evolution and distribution of water within the 0-GO, 0.03GO and 0.05GO samples at early (4 h) and mature (21 days) hydration stages. For this analysis, cement pastes were prepared using a w/b of 0.3, identical to the mix design used in the above experiments. The fresh pastes were directly cast into NMR tubes (8 mm diameter, 30 mm height), sealed, and cured at 25 ± 1 °C until testing. A Carr–Purcell–Meiboom–Gill (CPMG) pulse sequence with 512 scans was employed to capture the distribution of T2 relaxation times ranging from 0.04 ms to 100 ms. Notably, T2 values below 0.06 ms, associated with chemically bound water in solid hydrates, like Ca(OH)2 and ettringite, were excluded from the analysis [149]. These solid-phase hydrates were instead quantified using TGA, discussed in a subsequent section. The CPMG data were processed via Inverse Laplace Transform (ILT) algorithms [150], enabling separation of overlapping relaxation components and the identification of discrete water reservoirs within the cement pore structure. The four water reservoirs observed are as follows: (i) fast-relaxing components with T2 values of 0.06 ms–0.3 ms assigned to C-S-H interlayer water, (ii) 0.3 ms–0.75 ms attributed to gel pore water, (iii) inter-hydrate water molecules (0.75 ms–3 ms), and (iii) capillary and free water (>3 ms) [149]. Figure 10 presents the T2 relaxation time distributions at 4hrs and 21 days of curing, revealing distinct differences between early age and mature cementitious systems.
At 4 h of hydration, the T2 relaxation spectra reveal distinct peaks predominantly within the inter-hydrate water and free water regions. The 0-GO (control) sample shows two major peaks at 1.89 ms and 3.88 ms, corresponding to inter-hydrate and capillary water, respectively. Upon addition of GO, these peaks shift to longer T2 times, with 0.03-GO showing peaks at 1.20 ms and 5.22 ms, and 0.05GO at 2.15 ms and 4.85 ms. Furthermore, a third, broad peak emerges near 24 ms for both GO-containing samples, (absent in the control) indicating a significant fraction of unbound or loosely confined water [151]. These observations suggest that GO delays early hydration reactions and enhances water retention, likely due to its high surface area and functional groups that physically absorb water and hinder its availability for early C–S–H nucleation.
At 21 days, a marked transformation in water phase distribution is evident, reflecting the progression of hydration and microstructural densification. The 0-GO sample shows three distinct peaks at 0.17 ms, 0.44 ms, and 1.17 ms, corresponding to water confined within the C–S–H interlayers, gel pores, and inter-hydrate spaces, respectively. Upon the incorporation of GO, these peaks shift noticeably toward shorter relaxation times, indicating increased confinement and a reduction in pore size. Specifically, the first peak shifts from 0.17 ms in the control to 0.15 ms in both 0.03GO and 0.05GO samples, while the second peak shifts from 0.44 ms to 0.39 ms. Similarly, the third peak, initially at 1.17 ms for the control, shifts to 0.92 ms in the 0.03-GO and 1.08 ms in the 0.05-GO. These reductions in T2 values signify that the presence of GO promotes the formation of finer pore structures and enhances the development of bound water domains over time [152]. Overall, the progressive shift of relaxation peaks to shorter times confirms that GO fosters a denser and more mature hydration structure at later ages, enhancing the compactness of the cement matrix and improving its performance [123].
The evolution of the T2 peaks from broader, right-shifted peaks at 4 h to narrower, left-shifted distributions at 21 days confirms GO’s time-dependent impact on hydration and pore development. These findings suggest that at early, stages, GO acts as a water-retaining agent, temporarily slowing hydration by preserving free water within the matrix. However, as hydration progresses, GO can gradually release water to sustain internal hydration, facilitating the nucleation and growth of hydration products, leading to a denser microstructure.

3.8.3. Quantification of Hydration Products Through TGA

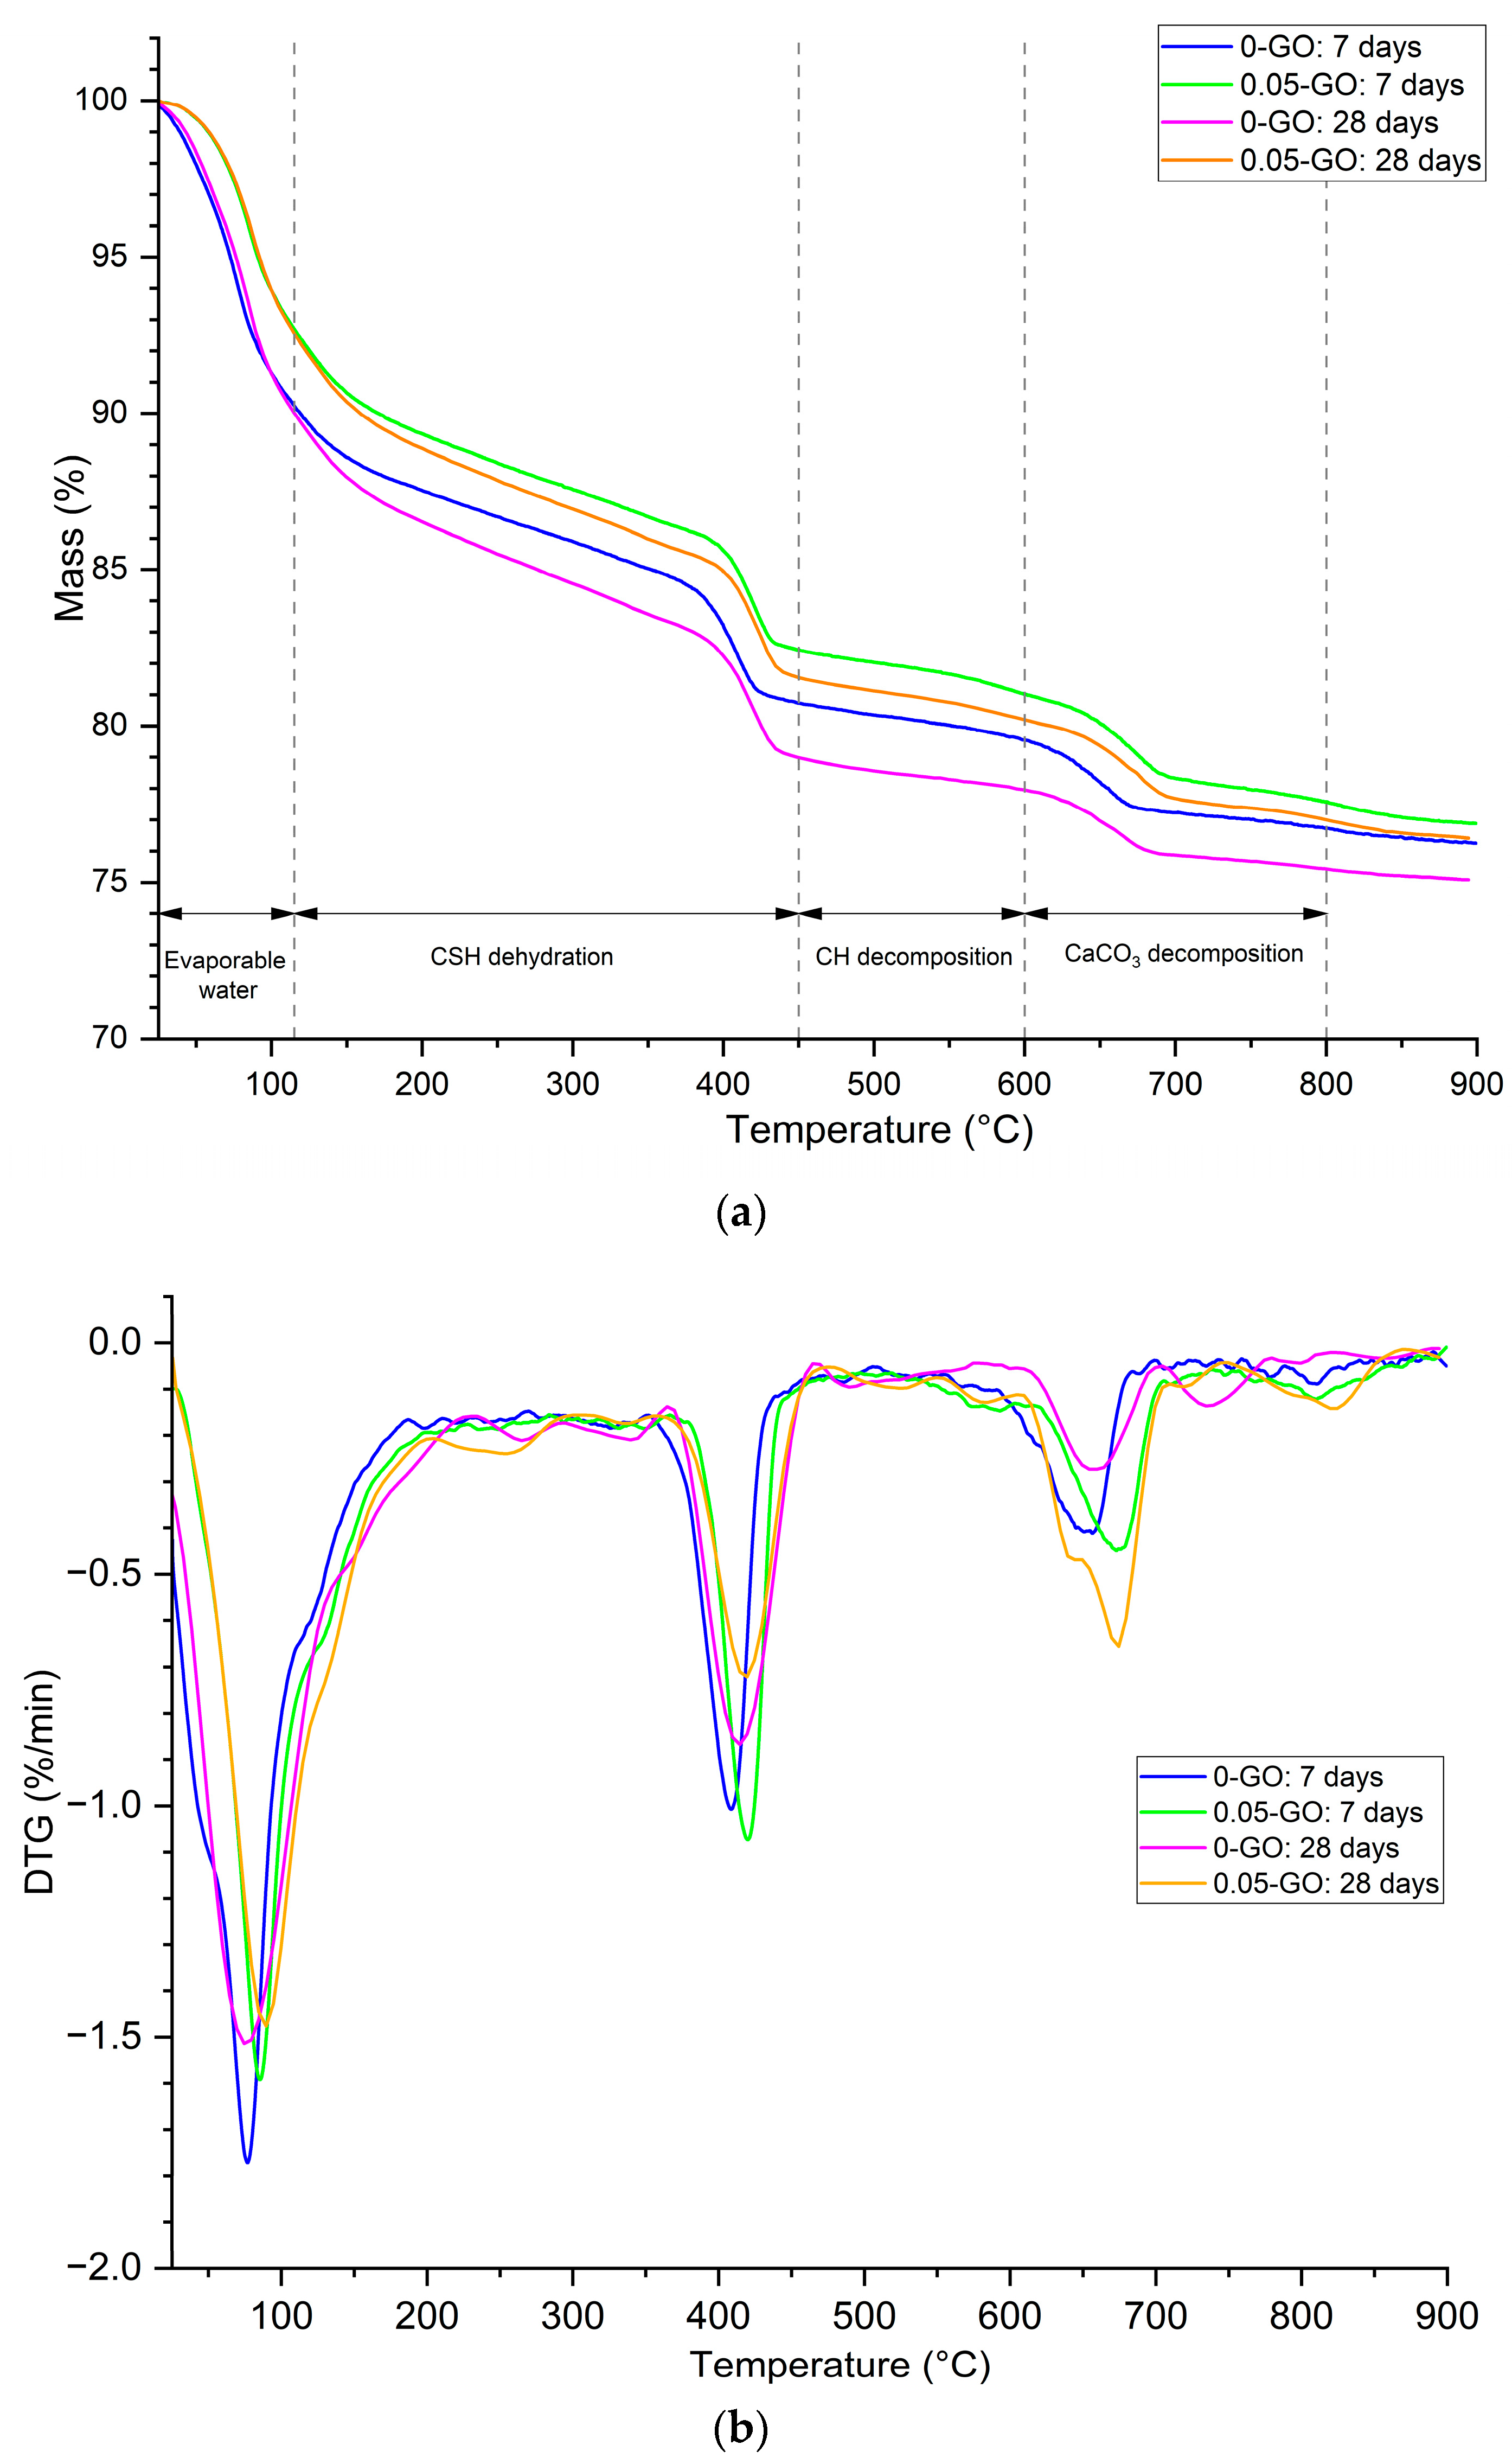
TGA was conducted to investigate the underlying mechanism contributing to enhanced performance observed in 0.05-GO mix over 0-GO mix. Two cement paste samples of the same mix design (0.3 w/b) were prepared and used for the TGA analysis. The TGA (Figure 11a) and Derivative Thermogravimetry (DTG) (Figure 11b) curves highlight a distinct improvement in the degree of hydration in 0.05-GO mix, as evidenced by several key thermal decomposition segments.
As quantified in Table 6, the 0.05-GO mix exhibited 12% and 7% overall increase in total hydration products (excluding evaporable water content) at 7 and 28 days, respectively. At both 7 and 28 days, the GO-enhanced samples exhibited a marked reduction (28% at both 7 and 28 days) in evaporable water content, indicating a denser pore structure and reduced free moisture within the matrix.
Slight increases in CSH dehydration for 0.05-GO, especially at 7 days, reflect a more advanced development of CSH gels, supporting the hypothesis of GO-facilitated hydration [153]. While the CSH dehydration of 0.05-GO slightly reduces by 28 days, the early difference reinforces the role of GO in accelerating hydration kinetics [124].
Notably, the GO-incorporated mixes showed higher portlandite (CH) decomposition levels across both ages (20% at 7 days and 31% at 28 days). This increase is indicative of enhanced cement hydration, as it corresponds with the increased consumption of evaporable water and previously observed macro-scale performance improvements. Moreover, the increase in CaCO3 decomposition (22% at 7 days and 26% at 28 days) suggest further hydration in 0.05-GO mix over 0-GO mix. Gholampour et al. [69] employed TGA to quantify non-evaporable water content as an indicator of cement hydration progression. Their study demonstrated that, at an optimal GO dosage of 0.1% bwoc, enhanced CSH bonding was evident, correlating with improvements in both tensile and compressive strengths. However, higher GO concentrations (0.5% bwoc and above) led to nanoparticle agglomeration, diminishing the beneficial effects due to poor dispersion (it is noted that, due to the low dosage of GO used and its minimal contribution to overall mass loss, any thermal decomposition associated with GO was assumed to be negligible and was therefore not included in the quantification of cement hydration products). In a comparable study, Li et al. [154] observed a 4.46% increase in CH content at a GO dosage of 0.04% bwoc, which aligns closely with the trends observed in the present investigation. Moreover, Krystek et al. [138] reported that GO addition accelerated the hydration of both alite and belite phases, thereby enhancing CSH formation. These findings, in conjunction with the current study, reinforce the hypothesis that well-dispersed GO flakes act as effective nucleation sites, promoting internal curing and accelerating early-stage hydration through increased water consumption. Moreover, these findings confirm that GO integration promotes a more robust and chemically mature cementitious matrix within the early curing phase, aligning well with the mechanical property enhancements observed in compressive, tensile, and elastic performance.

3.9. Calculation of Embodied Carbon and CO2 Index

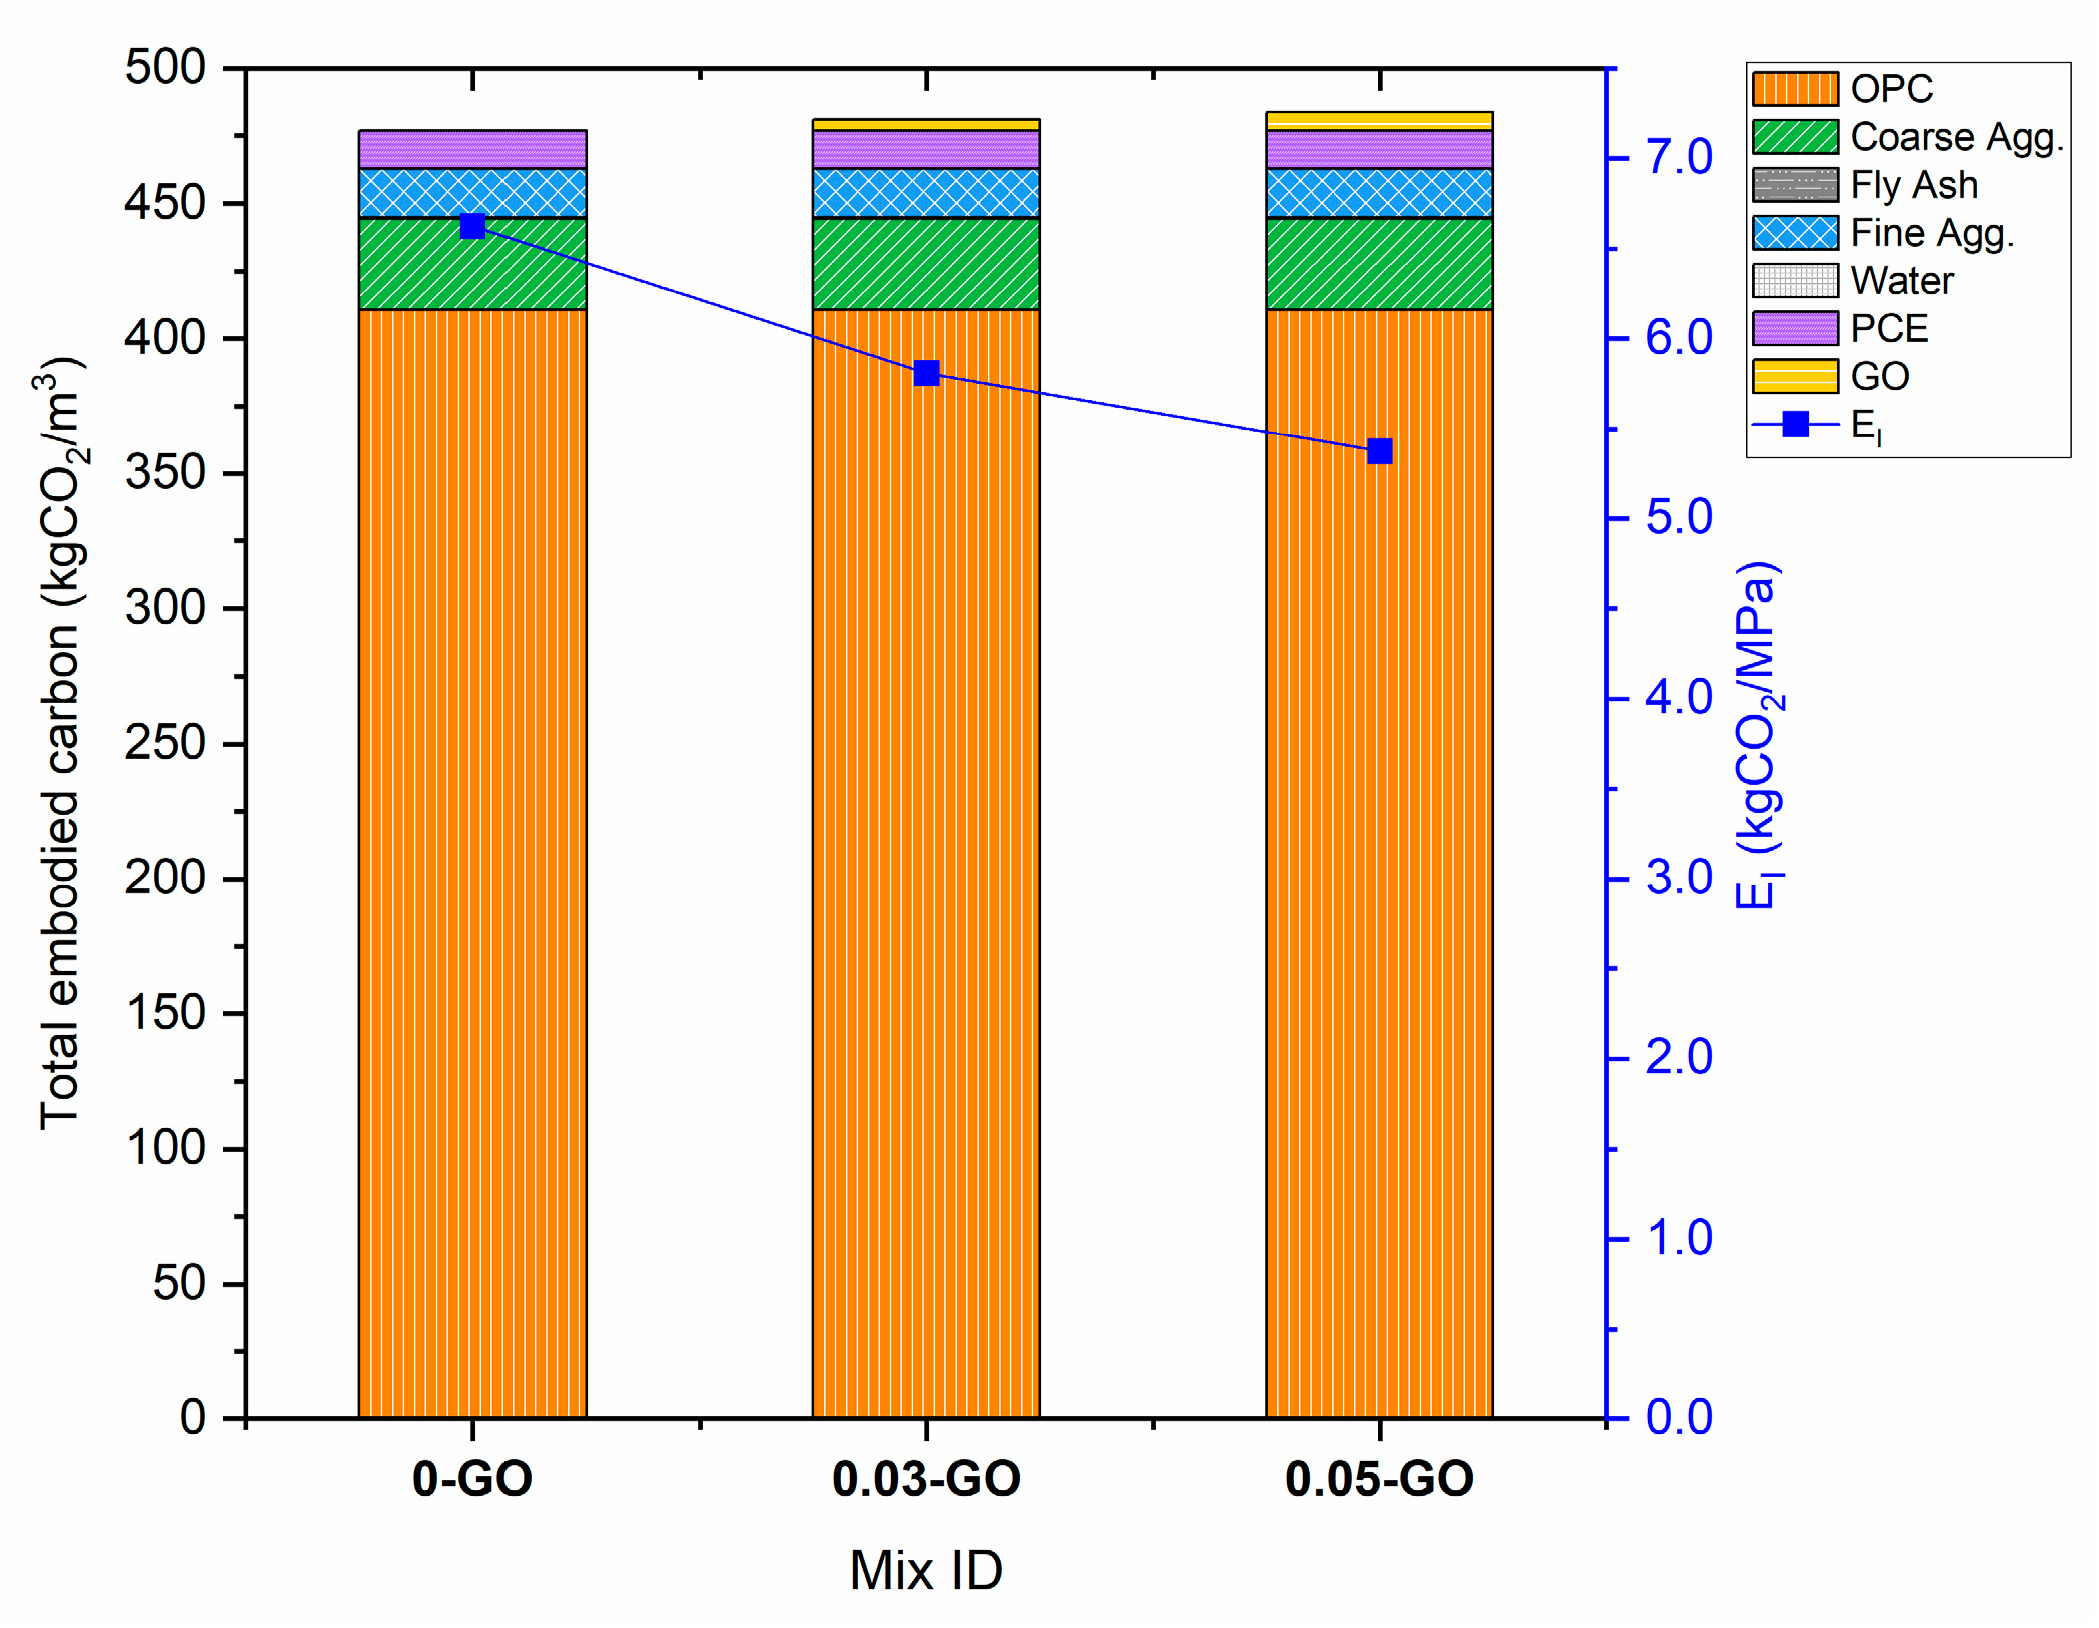
The embodied CO2 (in kgCO2/m3) was calculated based on the known embodied CO2 coefficients of each material (Table 4) and their respective quantities per cubic meter of concrete. Furthermore, EI (Equation (5)) expressed as the embodied CO2 per unit compressive strength (kgCO2/MPa) was introduced to assess the trade-off between environmental impact and mechanical performance.
As shown in Figure 12, the total embodied CO2 of the control mix (0-GO) was estimated at 476.94 kgCO2/m3, while the 0.03-GO and 0.05-GO mixes had slightly higher totals of 480.98 kgCO2/m3 and 483.67 kgCO2/m3, respectively. This incremental increase in embodied emissions, which is less than 1.5% for 0.03-GO and about 1.4% for 0.05-GO, can be primarily attributed to the inclusion of GO, which possesses a relatively high embodied carbon value (23.2 kgCO2/kg). Despite its low dosage, the high carbon intensity of GO contributes to measurable differences in the overall emissions of GO-modified mixes.
However, when comparing environmental impact in relation to compressive strength gains, a notable improvement is evident. The control, 0.03-GO, 0.05-GO yielded EI of 6.62, 5.81 and 5.37 kgCO2/MPa, respectively. Although the inclusion of GO marginally increases the absolute embodied CO2, it simultaneously enhances the strength-to-emissions ratio. Specifically, the CO2 efficiency improved by approximately 12.2% for the 0.03-GO mix and 18.9% for the 0.05-GO mix compared to the control. This demonstrates that optimized low-dosage GO integration can lead to environmentally superior concrete, where greater mechanical performance is achieved without proportionally increasing CO2 emissions.
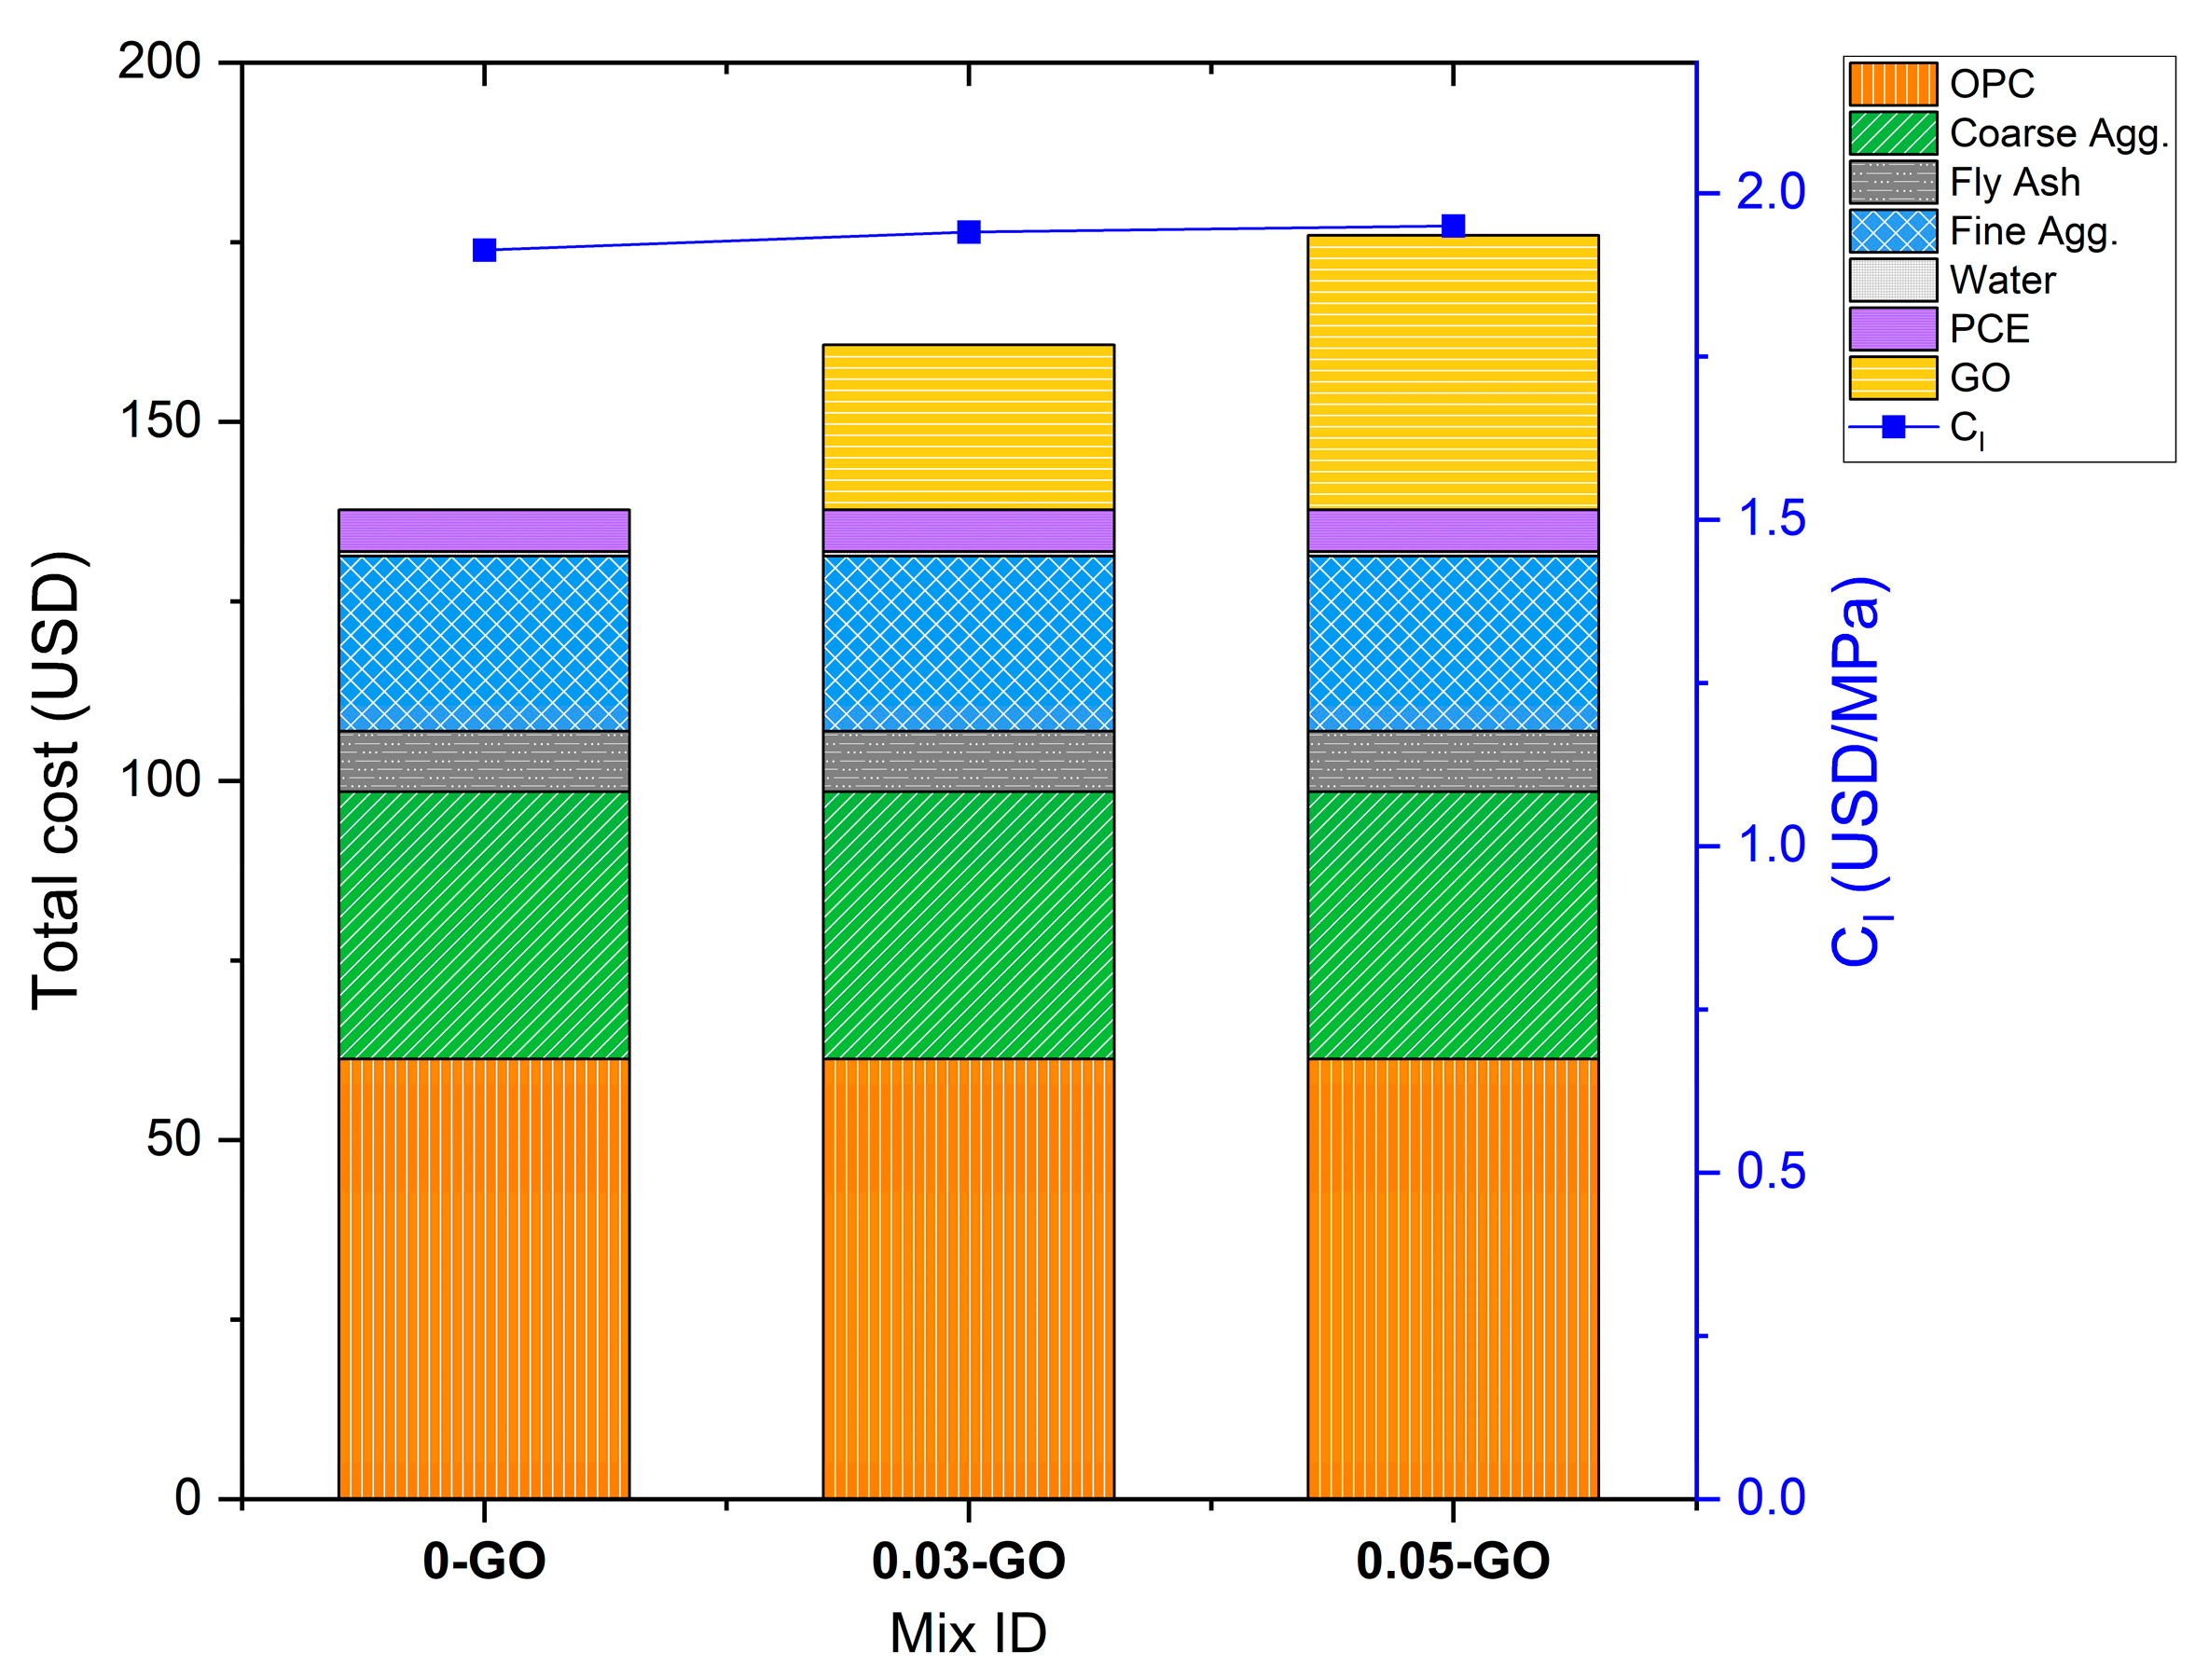
To evaluate the economic viability of GO concrete, a cost analysis was conducted as illustrated in Figure 13. The CI, expressed in USD/MPa, was derived by dividing the total cost (obtained from Table 4) per cubic meter of concrete by its corresponding 28-day compressive strength, as outlined in Equation (6). This metric enables an integrated comparison of both the material cost and the mechanical performance of each mix. A geographically specific scope (Australia) was selected for this assessment to ensure that accurate, current, and context-sensitive pricing data could be used. Broader economic generalization would require the inclusion of multi-regional cost modelling or sensitivity analyses, which are recommended for future studies.
With the market cost of GO set at 132 USD/kg, which is a conservative estimate reflecting the lowest currently available commercial rate, the resulting CI values were 1.91, 1.94 and 1.95 USD/MPa for control mix (0-GO), 0.03-GO, and 0.05-GO, respectively. These values reveal a marginal increase in the CI upon GO addition, despite the improvements in compressive strength performance (14.9% for 0.03-GO and 25% for 0.05-GO). This points out the economic potential of using GO at its current lowest market price, especially for performance-critical applications where strength enhancement is prioritized.
A breakeven analysis was also performed to identify the threshold at which GO incorporation remains cost-effective. It was determined that the breakeven unit cost of GO for the 0.05-GO mix lies at ~118.80 AUD/kg, beyond which the cost per MPa becomes less favourable than the control mix. Conversely, if GO is procured at the current average market value of 265 USD/kg [155], the CI increases to 2.11 and 2.24 for 0.03-GO and 0.05-GO mixes respectively, indicating a significantly reduced economic feasibility in standard commercial applications.
This illustrates the sensitivity of economic performance to GO pricing. While GO offers significant mechanical advantages, its cost remains a critical parameter against practical implementations. These findings support the argument for either targeted application in high-performance use cases or for seeking cost reductions through local production, large-scale synthesis, or sourcing lower-cost GO alternatives [156]. While the current market conditions allow for nearly cost-neutral integration of GO at lower dosages, strategic cost control and procurement decisions will be essential in enabling the broader adoption of GO-enhanced concrete.
Moreover, the relatively high embodied carbon and cost of GO remain challenges for widespread adoption. To improve the long-term feasibility of GO-based admixtures, emerging low-carbon synthesis methods warrant attention. For example, recent studies have explored the production of GO from biomass waste [157,158] or recycled graphite [159,160], significantly reducing energy input and emissions compared to conventional Hummers-based methods. Additionally, scalable GO recovery and reuse strategies, such as precipitation–redispersion cycles or post-use oxidation-state tuning, have shown potential for reducing life-cycle emissions and cost burdens. Incorporating such circular or low-impact manufacturing methods could significantly improve the economic and environmental indices of GO-enhanced concrete, especially when combined with cement reduction strategies.

4. Conclusions and Recommendations for Future Research

This study presented a comprehensive investigation into the macro-scale performance, fresh properties, strength gain mechanisms, and environmental–economic indices of GO-enhanced concrete. The results demonstrated that, when appropriately dispersed and dosed, GO can enhance strength development and microstructural refinement without compromising key fresh properties, which is an outcome essential for field-level implementation. Moreover, despite the high unit cost of GO, the cost and emission performance indices (CI and EI) remained within feasible ranges, especially when evaluated against compressive strength gains. Key outcomes of the study are summarized as follows:
  • Bleeding, air content, and slump retention were thoroughly assessed in GO-concrete, revealing that controlled mixing of GO-integrated PCE counteract GO-induced workability loss, making practical application more feasible.
  • Mechanical strength enhancements were recorded up to 25% in compressive strength with GO dosages of 0.05% bwoc, attributed to accelerated hydration and improved interfacial bonding.
  • TGA and 1H-NMR revealed a significant decrease in evaporable water and increases in hydration products in GO mixes, corroborating the microstructural strength gain mechanisms.
  • FTIR analysis confirmed the chemical compatibility between GO and PCE, validating that the non-invasive mixing method preserved PCE functionality, while SEM and EDS analyses demonstrated uniform GO dispersion within the cement matrix, supporting the effectiveness of the mixing approach and its contribution to microstructural enhancement.
  • Among the evaluated dosages, the 0.05% GO mix emerged as the most sustainable mix, exhibiting the lowest EI of 5.37 kgCO2/MPa, in contrast to the control mix (0-GO), which recorded a higher EI of 6.62 kgCO2/MPa.
  • The cost index (CI) for GO-admixed concretes was marginally elevated relative to the control (0-GO: 1.91, 0.03-GO: 1.94, 0.05-GO: 1.95) and the break-even GO cost threshold was determined to be USD 118.80/kg, with GO prices below this value supporting viable commercialization.
The experimental findings and performance enhancements observed in this study emphasize that the dosage-optimized and chemically compatible integration of GO with PCE is essential to achieving enhanced workability retention, strength development, and environmental performance in cementitious systems. The synergy between GO and PCE provides a pivotal insight for the scalable deployment and commercialisation of GO-enhanced concrete technologies. To build upon these results, further research is required to systematically evaluate the compatibility of GO with PCE and other chemical admixtures commonly used in commercial concrete products, as admixture interactions may significantly influence rheology and hydration behaviour. In parallel, efforts should be directed towards developing cost-effective and application-specific GO synthesis methods tailored to cementitious environments. Reducing the production cost of GO is critical to achieving economic feasibility at scale, particularly considering the breakeven threshold of ~AUD 180/kg established in this study. It should be noted that the environmental assessment conducted in this study followed a cradle-to-gate system boundary (EN 15978, stages A1–A3), which excludes use-phase, maintenance, and end-of-life impacts. Future research should adopt a cradle-to-grave perspective to capture potential durability-related benefits of GO-enhanced systems and their long-term environmental implications. The variability of GO quality across different sources may influence performance outcomes and, therefore, future work should evaluate the reproducibility of results using commercially available GO. While this study adopts industry-relevant mix designs, field-scale validation under practical casting and curing conditions is recommended. Future studies should also focus on evaluating the durability performance of GO-enhanced concrete under aggressive environmental conditions, such as freeze–thaw cycles, sulfate exposure, and carbonation environments, to fully assess its long-term suitability for infrastructure applications. Additionally, the integration of GO with sustainable concrete constituents such as recycled aggregates or SCMs could further expand its role in developing high-performance, low-carbon composites for next-generation construction materials. Such advancements would support the wider market adoption of GO-based concrete products and unlock further opportunities for sustainable infrastructure innovation.

Author Contributions

T.G.: Conceptualization, Methodology, Validation, Formal analysis, Investigation, Data Curation, Writing—original draft. P.D.: Conceptualization, Methodology, Validation, Formal analysis, Data Curation, Visualization, Writing—original draft. V.V.: Conceptualization, Investigation, Writing—review and editing, Supervision, Project administration, Funding acquisition. M.B.: Conceptualization, Methodology, Validation, Formal analysis, Investigation, Resources, Writing—review and editing, Supervision, Project administration. P.M.: Project administration, Writing—review and editing. R.S.: Validation, Investigation, Supervision. All authors have read and agreed to the published version of the manuscript.

Funding

This research was funded by Heidelberg Materials Australia and SmartCrete CRC grant number 23.0164.

Data Availability Statement

Data will be made available on request. The data that support the findings of this study are available from the corresponding author upon reasonable request.

Acknowledgments

The authors gratefully acknowledge the financial support, in-kind contributions, and provision of materials and laboratory facilities of Heidelberg Materials Australia and SmartCrete Cooperative Research Centre (CRC). Technical assistance and instrumentation access provided by the Melbourne TrACEES Platform at the University of Melbourne and Kyle Hearn of Royal Melbourne Institute of Technology (RMIT) University are also sincerely acknowledged. The in-kind support from Graphenea, Nova Graphene and CGT is also gratefully acknowledged.

Conflicts of Interest

Authors Michael Booy and Rish Satsangi were employed by the Heidelberg Materials Australia. The remaining authors declare that the research was conducted in the absence of any commercial or financial relationships that could be construed as a potential conflict of interest.

References

  1. Belaïd, F. How does concrete and cement industry transformation contribute to mitigating climate change challenges? Resour. Conserv. Recycl. Adv. 2022, 15, 200084. [Google Scholar] [CrossRef]
  2. Pearce, F. Can the World’s Most Polluting Heavy Industries Decarbonize; Yale School of the Environment: New Haven, CT, USA, 2021. [Google Scholar]
  3. Chen, C.; Xu, R.; Tong, D.; Qin, X.; Cheng, J.; Liu, J.; Zheng, B.; Yan, L.; Zhang, Q. A striking growth of CO2 emissions from the global cement industry driven by new facilities in emerging countries. Environ. Res. Lett. 2022, 17, 044007. [Google Scholar] [CrossRef]
  4. Andrew, R.M.; Peters, G.P. The Global Carbon Project’s Fossil CO2 Emissions Dataset; Zenodo: Geneva, Switzerland, 2024. [Google Scholar]
  5. Friedlingstein, P.; O’sullivan, M.; Jones, M.W.; Andrew, R.M.; Bakker, D.C.E.; Hauck, J.; Landschützer, P.; Le Quéré, C.; Luijkx, I.T.; Peters, G.P.; et al. Global carbon budget 2023. Earth Syst. Sci. Data 2023, 15, 5301–5369. [Google Scholar] [CrossRef]
  6. Barcelo, L.; Kline, J.; Walenta, G.; Gartner, E. Cement and carbon emissions. Mater. Struct. 2014, 47, 1055–1065. [Google Scholar] [CrossRef]
  7. Andrew, R.M. Global CO2 emissions from cement production. Earth Syst. Sci. Data 2018, 10, 195–217. [Google Scholar] [CrossRef]
  8. Ostovari, H.; Müller, L.; Skocek, J.; Bardow, A. From unavoidable CO2 source to CO2 sink? A cement industry based on CO2 mineralization. Environ. Sci. Technol. 2021, 55, 5212–5223. [Google Scholar] [CrossRef] [PubMed]
  9. Shanmugam, G. 200 Years of Fossil Fuels and Climate Change (1900–2100). J. Geol. Soc. India 2023, 99, 1043–1062. [Google Scholar] [CrossRef]
  10. Laveglia, A.; Ukrainczyk, N.; De Belie, N.; Koenders, E. Decarbonizing the lime-based construction materials industry: A practical guide for cradle-to-gate life-cycle inventory. Sustain. Prod. Consum. 2023, 40, 194–209. [Google Scholar] [CrossRef]
  11. Nie, S.; Zhou, J.; Yang, F.; Lan, M.; Li, J.; Zhang, Z.; Chen, Z.; Xu, M.; Li, H.; Sanjayan, J.G. Analysis of theoretical carbon dioxide emissions from cement production: Methodology and application. J. Clean. Prod. 2022, 334, 130270. [Google Scholar] [CrossRef]
  12. Cheng, D.; Reiner, D.M.; Yang, F.; Cui, C.; Meng, J.; Shan, Y.; Liu, Y.; Tao, S.; Guan, D. Projecting future carbon emissions from cement production in developing countries. Nat. Commun. 2023, 14, 8213. [Google Scholar] [CrossRef] [PubMed]
  13. Global Cement and Concrete Association. Concrete Future: The GCCA 2050 Cement and Concrete Industry Roadmap for Net Zero Concrete; Global Cement and Concrete Association: London, UK, 2021. [Google Scholar]
  14. Soomro, M.; Tam, V.W.; Evangelista, A.C.J. Production of cement and its environmental impact. In Recycled Concrete; Elsevier: Amsterdam, The Netherlands, 2023; pp. 11–46. [Google Scholar]
  15. EPD Australasia. Available online: https://epd-australasia.com (accessed on 18 April 2025).
  16. Amran, M.; Makul, N.; Fediuk, R.; Lee, Y.H.; Vatin, N.I.; Lee, Y.Y.; Mohammed, K. Global carbon recoverability experiences from the cement industry. Case Stud. Constr. Mater. 2022, 17, e01439. [Google Scholar] [CrossRef]
  17. Barbhuiya, S.; Kanavaris, F.; Das, B.B.; Idrees, M. Decarbonising cement and concrete production: Strategies, challenges and pathways for sustainable development. J. Build. Eng. 2024, 86, 108861. [Google Scholar] [CrossRef]
  18. Chaudhury, R.; Sharma, U.; Thapliyal, P.; Singh, L. Low-CO2 emission strategies to achieve net zero target in cement sector. J. Clean. Prod. 2023, 417, 137466. [Google Scholar] [CrossRef]
  19. Ginigaddara, T.; Mendis, P.; Devapura, P.; Mohotti, D.; Fonseka, I. Innovative low carbon graphene concrete. Concr. Aust. 2022, 48, 33–41. [Google Scholar]
  20. Meng, S.; Ouyang, X.; Fu, J.; Niu, Y.; Ma, Y. The role of graphene/graphene oxide in cement hydration. Nanotechnol. Rev. 2021, 10, 768–778. [Google Scholar] [CrossRef]
  21. Ruan, C.; Lin, J.; Chen, S.; Sagoe-Crentsil, K.; Duan, W. Effect of graphene oxide on the pore structure of cement paste: Implications for performance enhancement. ACS Appl. Nano Mater. 2021, 4, 10623–10633. [Google Scholar] [CrossRef]
  22. Ginigaddara, T.; Ekanayake, J.; Mendis, P.; Devapura, P.; Liyanage, A.; Vaz-Serra, P. An Introduction to High Performance Graphene Concrete. Electron. J. Struct. Eng. 2022, 22, 11–18. [Google Scholar] [CrossRef]
  23. Verma, P.; Rajib, C.; Chakrabarti, A. Synthesis process and characterization of graphene oxide (GO) as a strength-enhancing additive in concrete. Eur. J. Environ. Civ. Eng. 2024, 28, 2575–2603. [Google Scholar] [CrossRef]
  24. Dimov, D.; Amit, I.; Gorrie, O.; Barnes, M.D.; Townsend, N.J.; Neves, A.I.; Withers, F.; Russo, S.; Craciun, M.F. Ultrahigh performance nanoengineered graphene–concrete composites for multifunctional applications. Adv. Funct. Mater. 2018, 28, 1705183. [Google Scholar] [CrossRef]
  25. Shareef, K.; Rawoof, S.A.; Sowjanya, K.J.L. A feasibility study on mechanical properties of concrete with graphene oxide. Lateral 2017, 5, 10micrometer. [Google Scholar]
  26. Lai, H.; Li, Q.; Wang, X.; Xu, S. A comprehensive morphology study on the carbon nanotube agglomerations in cementitious composite. Carbon 2024, 223, 119014. [Google Scholar] [CrossRef]
  27. Xu, L.; Liu, K.; Wang, R. Effect and mechanism of carbon nanotubes on the properties of polyacrylate/cement composite cementitious materials. Constr. Build. Mater. 2024, 443, 137687. [Google Scholar] [CrossRef]
  28. Golewski, G.L.J.T.; Mechanics, A.F. Enhancement fracture behavior of sustainable cementitious composites using synergy between fly ash (FA) and nanosilica (NS) in the assessment based on digital image processing procedure. Theor. Appl. Fract. Mech. 2024, 131, 104442. [Google Scholar] [CrossRef]
  29. Ma, L.; Sun, M.; Yang, J.; Dai, Q.J. Nanosilica-enhanced geopolymer cementitious materials: Mechanistic insights from experimental and computational simulations. J. Build. Eng. 2024, 98, 111098. [Google Scholar] [CrossRef]
  30. Filho, A.W.; de Moura, M.R.; Aouada, F.A. Performance of cementitious mortars containing hydrogel–nanoclay hybrid nanocomposite. J. Sol-Gel Sci. Technol. 2024, 115, 263–280. [Google Scholar] [CrossRef]
  31. Thostenson, E.T.; Ren, Z.; Chou, T.-W. Advances in the science and technology of carbon nanotubes and their composites: A review. Compos. Sci. Technol. 2001, 61, 1899–1912. [Google Scholar] [CrossRef]
  32. De Volder, M.F.L.; Tawfick, S.H.; Baughman, R.H.; Hart, A.J. Carbon Nanotubes: Present and Future Commercial Applications. Science 2013, 339, 535–539. [Google Scholar] [CrossRef] [PubMed]
  33. Singh, L.P.; Karade, S.R.; Bhattacharyya, S.K.; Yousuf, M.M.; Ahalawat, S. Beneficial role of nanosilica in cement based materials—A review. Constr. Build. Mater. 2013, 47, 1069–1077. [Google Scholar] [CrossRef]
  34. Wei, X.-X.; Pei, C.; Zhu, J.-H. Towards the large-scale application of graphene-modified cement-based composites: A comprehensive review. Constr. Build. Mater. 2024, 421, 135632. [Google Scholar] [CrossRef]
  35. Salami, B.A.; Mukhtar, F.; Ganiyu, S.A.; Adekunle, S.; Saleh, T.A. Graphene-based concrete: Synthesis strategies and reinforcement mechanisms in graphene-based cementitious composites (Part 1). Constr. Build. Mater. 2023, 396, 132296. [Google Scholar] [CrossRef]
  36. Li, W.; Qu, F.; Dong, W.; Mishra, G.; Shah, S.P. A comprehensive review on self-sensing graphene/cementitious composites: A pathway toward next-generation smart concrete. Constr. Build. Mater. 2022, 331, 127284. [Google Scholar] [CrossRef]
  37. Çakır, M.V. The synergistic effect of hybrid nano-silica and GNP additives on the flexural strength and toughening mechanisms of adhesively bonded joints. Int. J. Adhes. Adhes. 2023, 122, 103333. [Google Scholar] [CrossRef]
  38. Ghazanlou, S.I.; Ghazanlou, S.I.; Ghazanlou, S.I.; Karimi, H.; Azimi, N.; Hosseinpour, S. Multifunctional performance of core–shell rGO@ Fe3O4 on the mechanical, electrical/thermal, EMI, and microstructure properties of cement-based composites. Constr. Build. Mater. 2023, 394, 132182. [Google Scholar] [CrossRef]
  39. Razaq, A.; Bibi, F.; Zheng, X.; Papadakis, R.; Jafri, S.H.M.; Li, H. Review on graphene-, graphene oxide-, reduced graphene oxide-based flexible composites: From fabrication to applications. Materials 2022, 15, 1012. [Google Scholar] [CrossRef] [PubMed]
  40. Lv, S.; Wu, L.; Li, Z.; Gao, R.; Liu, L. Investigation of dispersion behavior of GO in aqueous and effect of ultra-low dosage GO on structure and properties of cement-based composites. Constr. Build. Mater. 2022, 350, 128828. [Google Scholar] [CrossRef]
  41. Zeng, H.; Lai, Y.; Qu, S.; Yu, F. Exploring the effect of graphene oxide on freeze–thaw durability of air-entrained mortars. Constr. Build. Mater. 2022, 324, 126708. [Google Scholar] [CrossRef]
  42. Reddy, P.V.R.K.; Prasad, D.R. Investigation on the impact of graphene oxide on microstructure and mechanical behaviour of concrete. J. Build. Pathol. Rehabil. 2022, 7, 30. [Google Scholar] [CrossRef]
  43. Rao, P.; Prakash, J.; Alexander, R.; Shinde, M.; Dasgupta, K. Role of graphene oxide infusion in concrete to elevate strength and fire performance in construction concrete. Diam. Relat. Mater. 2024, 147, 111269. [Google Scholar] [CrossRef]
  44. Devasena, M.; Karthikeyan, J. Investigation on strength properties of graphene oxide concrete. Int. J. Eng. Sci. Invent. Res. Dev. 2015, 1, 307–310. [Google Scholar]
  45. Kabus, O.; Butska, L.; Makarenko, O.; Pershina, L.; Tymoshchenko, A. Evaluating the efficiency of the fluidity retention of ready-mix concrete during the transportation of it to the construction site. MATEC Web Conf. 2018, 230, 03005. [Google Scholar] [CrossRef]
  46. Lin, X. Synthesis and performance of a new long-acting slump retention agent at different temperatures. J. Phys. Conf. Ser 2024, 2713, 012005. [Google Scholar] [CrossRef]
  47. Mondal, S.K.; Welz, A.; Clinton, C.; Khayat, K.; Kumar, A.; Okoronkwo, M.U. Quantifying the Workability of Calcium Sulfoaluminate Cement Paste Using Time-Dependent Rheology. Materials 2022, 15, 5775. [Google Scholar] [CrossRef] [PubMed]
  48. Tao, Y.; Rahul, A.; Mohan, M.K.; De Schutter, G.; Van Tittelboom, K. Recent progress and technical challenges in using calcium sulfoaluminate (CSA) cement. Cem. Concr. Compos. 2023, 137, 104908. [Google Scholar] [CrossRef]
  49. Lei, Y.; Boucenna, I.; Thévenet, V.; Brett, W.; Paineau, E.; Ponton, A. The Rheological and Structural Properties of Aqueous Graphene Oxide Dispersions: Concentration and pH Dependence. Langmuir 2024, 40, 16048–16057. [Google Scholar] [CrossRef] [PubMed]
  50. Li, X.; Korayem, A.H.; Li, C.; Liu, Y.; He, H.; Sanjayan, J.G.; Duan, W.H. Incorporation of graphene oxide and silica fume into cement paste: A study of dispersion and compressive strength. Constr. Build. Mater. 2016, 123, 327–335. [Google Scholar] [CrossRef]
  51. Li, X.; Li, C.; Liu, Y.; Chen, S.J.; Wang, C.; Sanjayan, J.G.; Duan, W.H. Improvement of mechanical properties by incorporating graphene oxide into cement mortar. Mech. Adv. Mater. Struct. 2018, 25, 1313–1322. [Google Scholar] [CrossRef]
  52. Liu, C.; Huang, X.; Wu, Y.-Y.; Deng, X.; Zheng, Z. The effect of graphene oxide on the mechanical properties, impermeability and corrosion resistance of cement mortar containing mineral admixtures. Constr. Build. Mater. 2021, 288, 123059. [Google Scholar] [CrossRef]
  53. Chen, Y.; Li, X.; Dong, B.; Du, H.; Yan, R.; Wang, L. High-temperature properties of cement paste with graphene oxide agglomerates. Constr. Build. Mater. 2022, 320, 126286. [Google Scholar] [CrossRef]
  54. Bhojaraju, C.; Mousavi, S.S.; Brial, V.; DiMare, M.; Ouellet-Plamondon, C.M. Fresh and hardened properties of GGBS-contained cementitious composites using graphene and graphene oxide. Constr. Build. Mater. 2021, 300, 123902. [Google Scholar] [CrossRef]
  55. Gao, Y.; Jing, H.; Fu, G.; Zhao, Z.; Shi, X. Studies on combined effects of graphene oxide-fly ash hybrid on the workability, mechanical performance and pore structures of cementitious grouting under high W/C ratio. Constr. Build. Mater. 2021, 281, 122578. [Google Scholar] [CrossRef]
  56. Reddy, P.; Prasad, D.R. A study on workability, strength and microstructure characteristics of graphene oxide and fly ash based concrete. Mater. Today Proc. 2022, 62, 2919–2925. [Google Scholar] [CrossRef]
  57. Hong, X.; Lee, J.C.; Qian, B. Mechanical properties and microstructure of high-strength lightweight concrete incorporating graphene oxide. Nanomaterials 2022, 12, 833. [Google Scholar] [CrossRef] [PubMed]
  58. Zhang, F.; Pang, K.; Zhong, R.; Li, J.; Liu, Q.; Zhang, J. Effect of key design parameters on the physical/mechanical properties of coarse aggregated UHPC and its structural response subjected to bending. Constr. Build. Mater. 2024, 448, 138189. [Google Scholar] [CrossRef]
  59. Reis, E.D.; Resende, H.F.; Christoforo, A.L.; Costa, R.M.; Gatuingt, F.; Poggiali, F.S.J.; Bezerra, A.C.S. Assessment of physical and mechanical properties of concrete with carbon nanotubes pre-dispersed in cement. J. Build. Eng. 2024, 89, 109255. [Google Scholar] [CrossRef]
  60. Cheng, Z.; Liu, Y.; Wu, J.; Guo, X.; Chen, W.; Gao, Y. Graphene oxide-coated fly ash for high performance and low-carbon cementitious composites. J. Mater. Res. Technol. 2023, 25, 6710–6724. [Google Scholar] [CrossRef]
  61. de Souza, F.B.; Yao, X.; Gao, W.; Duan, W. Graphene opens pathways to a carbon-neutral cement industry. Sci. Bull. 2022, 67, 5–8. [Google Scholar] [CrossRef] [PubMed]
  62. Lv, H.; Du, M.; Li, Z.; Xiao, L.; Zhou, S. Cost optimization of graphene oxide-modified ultra-high-performance concrete based on machine learning methods. Inorganics 2024, 12, 181. [Google Scholar] [CrossRef]
  63. Devapura, P.; Ginigaddara, T.; Udumulla, D.; Mendis, P.; Booy, M.; Herath, N. Effect of Graphene Oxide on Interfacial Transition Zone and Strength Enhancement of Recycled Aggregate Concrete. J. Build. Eng. 2025, 105, 112570. [Google Scholar] [CrossRef]
  64. Munuera, J.; Britnell, L.; Santoro, C.; Cuéllar-Franca, R.; Casiraghi, C. A review on sustainable production of graphene and related life cycle assessment. 2D Mater. 2021, 9, 012002. [Google Scholar] [CrossRef]
  65. Papanikolaou, I.; Arena, N.; Al-Tabbaa, A. Graphene nanoplatelet reinforced concrete for self-sensing structures—A lifecycle assessment perspective. J. Clean. Prod. 2019, 240, 118202. [Google Scholar] [CrossRef]
  66. Surehali, S.; Volaity, S.S.; Simon, A.; Divigalpitiya, R.; Kumar, A.; Neithalath, N. New Generation Graphenes in Cement-Based Materials: Production, Property Enhancement, and Life Cycle Analysis. ACS Sustain. Chem. Eng. 2024, 12, 9193–9206. [Google Scholar] [CrossRef]
  67. Gutiérrez-Cruz, A.; Ruiz-Hernández, A.R.; Vega-Clemente, J.F.; Luna-Gazcón, D.G.; Campos-Delgado, J. A review of top-down and bottom-up synthesis methods for the production of graphene, graphene oxide and reduced graphene oxide. J. Mater. Sci. 2022, 57, 14543–14578. [Google Scholar] [CrossRef]
  68. Zeng, H.; Qu, S.; Tian, Y.; Hu, Y.; Li, Y. Recent progress on graphene oxide for next-generation concrete: Characterizations, applications and challenges. J. Build. Eng. 2023, 69, 106192. [Google Scholar] [CrossRef]
  69. Gholampour, A.; Kiamahalleh, M.V.; Tran, D.N.; Ozbakkaloglu, T.; Losic, D. Revealing the dependence of the physiochemical and mechanical properties of cement composites on graphene oxide concentration. RSC Adv. 2017, 7, 55148–55156. [Google Scholar] [CrossRef]
  70. ASTM C114-23; Standard Test Methods for Chemical Analysis of Hydraulic Cement. ASTM International: West Conshohocken, PA, USA, 2023.
  71. Ginigaddara, T.; Devapura, P.; Mendis, P.; Udumulla, P. A Multi-Scale Investigation of Graphene Oxide Enhanced Cementitious Composites through Liquid Phase Characterizations, Mechanical Properties and Microstructural Strength Gain Mechanisms. J. Build. Eng. 2025, 106, 112621. [Google Scholar] [CrossRef]
  72. ASTM C136/C136M-19; Standard Test Method for Sieve Analysis of Fine and Coarse Aggregates. ASTM International: West Conshohocken, PA, USA, 2019.
  73. ISO/TS 21356-1:2021; Nanotechnologies—Structural Characterization of Graphene—Part 1: Graphene from Powders and Dispersions. ISO: Geneva, Switzerland, 2021.
  74. AS 1012.2:2014; Methods of Testing Concrete Preparing Concrete Mixes in the Laboratory. Standards Australia: Sydney, Australia, 2014.
  75. Poinot, T.; Benyahia, K.; Govin, A.; Jeanmaire, T.; Grosseau, P. Use of ultrasonic degradation to study the molecular weight influence of polymeric admixtures for mortars. Constr. Build. Mater. 2013, 47, 1046–1052. [Google Scholar] [CrossRef]
  76. Silvestro, L.; Ruviaro, A.S.; Lima, G.T.d.S.; Matos, P.R.d.; Rodríguez, E.; Gleize, P. Sonicação de superplastificante à base de policarboxilato para aplicação em matrizes cimentícias. Rev. IBRACON Estrut. Mater. 2022, 16, e16205. [Google Scholar] [CrossRef]
  77. AS 1012.3.1:2014; Methods of Testing Concrete—Determination of Properties Related to the Consistency of Concrete—Slump Test. Standards Australia: Sydney, Australia, 2014.
  78. AS 1012.4.2:2014; Methods of Testing Concrete, Method 4.2: Determination of Air Content of Freshly Mixed Concrete—Measuring Reduction in Air Pressure in Chamber Above Concrete. Standards Australia: Sydney, Australia, 2014.
  79. AS 1012.6:2014; Methods of Testing Concrete Determination of Bleeding of Concrete. Standards Australia: Sydney, Australia, 2014.
  80. AS 1012.8.1:2014; Methods of Testing Concrete Method for Making and Curing Concrete—Compression and Indirect Tensile Test Specimens. Standards Australia: Sydney, Australia, 2014.
  81. AS 1012.8.2:2014; Methods of Testing Concrete Method for Making and Curing Concrete—Flexure Test Specimens. Standards Australia: Sydney, Australia, 2014.
  82. AS 1012.8.4:2015; Methods of Testing Concrete Method for Making and Curing Concrete—Drying Shrinkage Specimens Prepared in the Field or in the Laboratory. Standards Australia: Sydney, Australia, 2015.
  83. AS 1012.9:2014; Methods of Testing Concrete Compressive Strength Tests—Concrete, Mortar and Grout Specimens. Standards Australia: Sydney, Australia, 2014.
  84. AS 1012.10-2000; Methods of Testing Concrete, Method 10: Determination of Indirect Tensile strength of Concrete Cylinders (‘Brazil’ or Splitting Test). Standards Australia: Sydney, Australia, 2000.
  85. AS 1012.11-2000; Methods of Testing Concrete Determination of the Modulus of Rupture (Reconfirmed 2014). Standards Australia: Sydney, Australia, 2000.
  86. AS 1012.17-1997; Methods of Testing Concrete Determination of the Static Chord Modulus of Elasticity and Poisson’s Ratio of Concrete Specimens (Reconfirmed 2014). Standards Australia: Sydney, Australia, 1997.
  87. AS 1012.13:2015; Methods of Testing Concrete Determination of the Drying Shrinkage of Concrete for Samples Prepared in the Field or in the Laboratory. Standards Australia: Sydney, Australia, 2015.
  88. Aono, Y.; Matsushita, F.; Shibata, S.; Hama, Y. Nano-structural Changes of C-S-H in Hardened Cement Paste during Drying at 50°C. J. Adv. Concr. Technol. 2007, 5, 313–323. [Google Scholar] [CrossRef]
  89. Mahmoud, A.A.; El-Sayed, A.A.; Aboraya, A.M.; Fathy, I.N.; Abouelnour, M.A.; Elfakharany, M.E.; Fattouh, M.S.; Alahmer, A.E.; Nabil, I.M. Influence of elevated temperature exposure on the residual compressive strength and radiation shielding efficiency of ordinary concrete incorporating granodiorite and ceramic powders. Sci. Rep. 2025, 15, 3572. [Google Scholar] [CrossRef] [PubMed]
  90. BS EN 15978:2011; Sustainability of Construction Works—Assessment of Environmental Performance of Buildings—Calculation Method. BSI—British Standards Institution: Brussels, Belgium, 2011.
  91. Crawford, R.; Stephan, A.; Prideaux, F. Environmental Performance in Construction (EPiC) Database; The University of Melbourne: Melbourne, Australia, 2024. [Google Scholar]
  92. Grant, T.; Rocha, H. AusLCI (The Australian Life Cycle Inventory Database Initiative) Database Manual; Lifecycles: Melbourne, Australia, 2023. [Google Scholar]
  93. Zandifaez, P.; Asadi Shamsabadi, E.; Akbar Nezhad, A.; Zhou, H.; Dias-da-Costa, D. AI-Assisted optimisation of green concrete mixes incorporating recycled concrete aggregates. Constr. Build. Mater. 2023, 391, 131851. [Google Scholar] [CrossRef]
  94. Circular Ecology. Inventory of Carbon & Energy (ICE) Database, Version 3.0; Circular Ecology: Worcester, UK, 2019. [Google Scholar]
  95. Tran, N.P.; Wang, T.; Nguyen, T.N.; Jin, H.; Ngo, T.D. High-volume recycled glass cementitious and geopolymer composites incorporating graphene oxide. Constr. Build. Mater. 2024, 450, 138476. [Google Scholar] [CrossRef]
  96. Crawford, R.; Stephan, A.; Prideaux, F. EPiC database—Gravel. In Environmental Performance in Construction (EPiC) Database; The University of Melbourne: Melbourne, Australia, 2019. [Google Scholar]
  97. Crawford, R.; Stephan, A.; Prideaux, F. EPiC database—Sand. In Environmental Performance in Construction (EPiC) Database; The University of Melbourne: Melbourne, Australia, 2020. [Google Scholar]
  98. Crawford, R.; Stephan, A.; Prideaux, F. EPiC database—Water. In Environmental Performance in Construction (EPiC) Database; The University of Melbourne: Melbourne, Australia, 2020. [Google Scholar]
  99. Graphene Labs. Products & Services. Available online: https://graphenelabs.com.au/ (accessed on 12 March 2025).
  100. Cheng, S.; Chen, K.; Wu, Q.; Chen, X.; Zhao, C.; Wu, Z. Influence of industrial-grade graphene oxide on macro and micro properties of ultra-high performance concrete incorporating recycled fine aggregate. Constr. Build. Mater. 2024, 417, 135427. [Google Scholar] [CrossRef]
  101. Nguyen, H.D.; Zhang, Q.; Sagoe-Crentsil, K.; Duan, W. Graphene oxide-coated sand for improving performance of cement composites. Cem. Concr. Compos. 2021, 124, 104279. [Google Scholar] [CrossRef]
  102. Kedir, A.; Gamachu, M.; Alex, A.G.; Faggio, G. Cement-based graphene oxide composites: A review on their mechanical and microstructure properties. J. Nanomater. 2023, 2023, 6741000. [Google Scholar] [CrossRef]
  103. Abdalla, J.A.; Thomas, B.S.; Hawileh, R.A.; Kabeer, K.S.A. Influence of nanomaterials on the workability and compressive strength of cement-based concrete. Mater. Today Proc. 2022, 65, 2073–2076. [Google Scholar] [CrossRef]
  104. Secrieru, E.; Mohamed, W.; Fataei, S.; Mechtcherine, V. Assessment and prediction of concrete flow and pumping pressure in pipeline. Cem. Concr. Compos. 2020, 107, 103495. [Google Scholar] [CrossRef]
  105. Liu, S.; Li, S.; Wang, Q.; Zhang, R.; Liu, X. Effect of Polycarboxylate-Silane Modified Graphene Oxide Composite on the Properties of Cement Pastes. Materials 2022, 15, 5313. [Google Scholar] [CrossRef] [PubMed]
  106. Harichane, A.; Belalia, F. Influence of Polycarboxylate Superplasticizer on the Calorimetric and Physicomechanical Properties of Mortar. IgMin Res. 2023, 1, 133–135. [Google Scholar]
  107. Trikkaliotis, D.G.; Christoforidis, A.K.; Mitropoulos, A.C.; Kyzas, G.Z. Graphene oxide synthesis, properties and characterization techniques: A comprehensive review. ChemEngineering 2021, 5, 64. [Google Scholar] [CrossRef]
  108. Lai, G. Research on synthesis and properties of amphoteric early strength polycarboxylate superplasticizer. In IOP Conference Series: Materials Science and Engineering; IOP Publishing: Bristol, UK, 2019; p. 022056. [Google Scholar]
  109. Lee, S.; Kim, B.; Seo, J.; Cho, S. Beneficial use of MIBC in metakaolin-based geopolymers to improve flowability and compressive strength. Materials 2020, 13, 3663. [Google Scholar] [CrossRef] [PubMed]
  110. Anwar, A.; Liu, X.; Zhang, L. To what extent can polycarboxylate superplasticizers enhance the dispersion characteristics of modified graphene oxide in cement? Insights from ultrasonication and high-shear mixing methods. Cem. Concr. Res. 2025, 195, 107881. [Google Scholar] [CrossRef]
  111. Duan, H.; Zhou, T.; Li, B.; Pang, Y.; Lou, H.; Yang, D.; Qiu, X. Synthesis, performance evaluation, and adsorption–dispersion mechanism of sulfonic acid-terminated long side chain polycarboxylate superplasticizers. Langmuir 2024, 40, 24956–24967. [Google Scholar] [CrossRef] [PubMed]
  112. Hoogenboom, R.; Muhammad, M.; de Schutter, G.; Lesage, K. The Use of a Polymer Comprising Side Chains Having a Sterically Hindered Amine as Chemical Admixture for a Cementitious Material. US20250145528A1, 8 May 2025. [Google Scholar]
  113. Hover, K.C.; Bickley, J.; Hooton, R.J.R.R.; Foundation, E. Guide to Specifying Concrete Performance Phase II Report of Preparation of a Performance-based Specification for Cast-In-Place Concrete; NRMCA P2P Steering Committee: Silver Spring, Maryland, 2008. [Google Scholar]
  114. Mohammed, A.; Sanjayan, J.G.; Duan, W.H.; Nazari, A. Graphene Oxide Impact on Hardened Cement Expressed in Enhanced Freeze–Thaw Resistance. J. Mater. Civ. Eng. 2016, 28, 04016072. [Google Scholar] [CrossRef]
  115. Lee, S.-J.; Jeong, S.-H.; Kim, D.-U.; Won, J.-P. Graphene oxide as an additive to enhance the strength of cementitious composites. Compos. Struct. 2020, 242, 112154. [Google Scholar] [CrossRef]
  116. Huang, C.-Y.; Lin, Y.-C.; Chung, J.H.; Chiu, H.-Y.; Yeh, N.-L.; Chang, S.-J.; Chan, C.-H.; Shih, C.-C.; Chen, G.-Y. Enhancing cementitious composites with functionalized graphene oxide-based materials: Surface chemistry and mechanisms. Int. J. Mol. Sci. 2023, 24, 10461. [Google Scholar] [CrossRef]
  117. Amini, K.; Ghasemi, A.; Amiri, S.S.; Mirvalad, S.; Korayem, A.H. The synergic effects of metakaolin and polycarboxylate-ether on dispersion of graphene oxide in cementitious environments and macro-level properties of graphene oxide modified cement composites. Constr. Build. Mater. 2021, 270, 121462. [Google Scholar] [CrossRef]
  118. National Ready Mixed Concrete Association (NRMCA). CIP 5—Plastic Shrinkage Cracking; NRMCA: Alexandria, VA, USA, 2021. [Google Scholar]
  119. Reid (Reid NZ). Hot Weather & Tilt-up Guide; Reid NZ: Auckland, New Zealand, 2022. [Google Scholar]
  120. Li, X.; Liu, Y.M.; Li, W.G.; Li, C.Y.; Sanjayan, J.G.; Duan, W.H.; Li, Z. Effects of graphene oxide agglomerates on workability, hydration, microstructure and compressive strength of cement paste. Constr. Build. Mater. 2017, 145, 402–410. [Google Scholar] [CrossRef]
  121. Jing, G.; Wu, J.; Lei, T.; Wang, S.; Strokova, V.; Nelyubova, V.; Wang, M.; Ye, Z. From graphene oxide to reduced graphene oxide: Enhanced hydration and compressive strength of cement composites. Constr. Build. Mater. 2020, 248, 118699. [Google Scholar] [CrossRef]
  122. Devi, S.C.; Khan, R.A. Compressive strength and durability behavior of graphene oxide reinforced concrete composites containing recycled concrete aggregate. J. Build. Eng. 2020, 32, 101800. [Google Scholar] [CrossRef]
  123. de Souza, F.B.; Shamsaei, E.; Sagoe-Crentsil, K.; Duan, W. Proposed mechanism for the enhanced microstructure of graphene oxide–Portland cement composites. J. Build. Eng. 2022, 54, 104604. [Google Scholar] [CrossRef]
  124. Fu, Q.; Wang, Z.; Xue, Y.; Niu, D. Catalysis and regulation of graphene oxide on hydration properties and microstructure of cement-based materials. ACS Sustain. Chem. Eng. 2023, 11, 5626–5643. [Google Scholar] [CrossRef]
  125. Lv, S.; Ma, Y.; Qiu, C.; Sun, T.; Liu, J.; Zhou, Q. Effect of graphene oxide nanosheets of microstructure and mechanical properties of cement composites. Constr. Build. Mater. 2013, 49, 121–127. [Google Scholar] [CrossRef]
  126. Mowlaei, R.; Lin, J.; de Souza, F.B.; Fouladi, A.; Korayem, A.H.; Shamsaei, E.; Duan, W. The effects of graphene oxide-silica nanohybrids on the workability, hydration, and mechanical properties of Portland cement paste. Constr. Build. Mater. 2021, 266, 121016. [Google Scholar] [CrossRef]
  127. Zeng, H.; Lai, Y.; Qu, S.; Yu, F. Effect of graphene oxide on permeability of cement materials: An experimental and theoretical perspective. J. Build. Eng. 2021, 41, 102326. [Google Scholar] [CrossRef]
  128. Abdulkadir, I.; Mohammed, B.S.; Ali, M.O.A.; Liew, M.S. Effects of graphene oxide and crumb rubber on the fresh properties of self-compacting engineered cementitious composite using response surface methodology. Materials 2022, 15, 2519. [Google Scholar] [CrossRef] [PubMed]
  129. Sharma, S.; Kothiyal, N.; Chitkara, M. Enhanced mechanical performance of cement nanocomposite reinforced with graphene oxide synthesized from mechanically milled graphite and its comparison with carbon nanotubes reinforced nanocomposite. RSC Adv. 2016, 6, 103993–104009. [Google Scholar] [CrossRef]
  130. Fan, L.; Zheng, J.; Wu, C.; Wang, H.; Li, F.; Song, F. Graphene oxide at carbon nanotubes/cement matrix abnormally enhance its hydration products and interlayer stress transfer at an important hydration accelerated period: Experimental study and molecular dynamics simulation. Colloids Surfaces A Physicochem. Eng. Asp. 2025, 717, 136830. [Google Scholar] [CrossRef]
  131. Yang, H.; Zhu, E.; Liu, L. Analysis of the Effect of Pore Structure on the Mechanical Properties of Concrete Based on the Meso Numerical Model. Appl. Sci. 2022, 12, 5428. [Google Scholar] [CrossRef]
  132. Muthukumarana, T.; Arachchi, M.; Somarathna, H.; Raman, S. A review on the variation of mechanical properties of carbon fibre-reinforced concrete. Constr. Build. Mater. 2023, 366, 130173. [Google Scholar] [CrossRef]
  133. Jonnalagadda, S.; Vemuri, S. Choosing Conventional Concrete, Ultra-High Performance Concrete or Steel as Material of Construction: An Opinion. Eur. Mod. Stud. J. 2023, 7, 280–288. [Google Scholar] [CrossRef]
  134. Marí, A.R.; Bairán, J.M.; Duarte, N. Long-term deflections in cracked reinforced concrete flexural members. Eng. Struct. 2010, 32, 829–842. [Google Scholar] [CrossRef]
  135. Liu, Q.; Li, Y.; Ming, X.; Zhao, H.; Sun, Z.; Li, Z.; Sun, G. Optimizing concrete performance with polymer-cement networks: Enhanced flexural strength and crack resistance. Mater. Today Commun. 2025, 42, 111068. [Google Scholar] [CrossRef]
  136. Bagheri, A.; Negahban, E.; Asad, A.; Abbasi, H.A.; Raza, S.M. Graphene oxide-incorporated cementitious composites: A thorough investigation. Mater. Adv. 2022, 3, 9040–9051. [Google Scholar] [CrossRef]
  137. Guan, X.; Yu, L.; Li, H. Experimental study on fracture mechanics of cementitious materials reinforced by graphene oxide–silica nanocomposites. Constr. Build. Mater. 2022, 325, 126758. [Google Scholar] [CrossRef]
  138. Krystek, M.; Pakulski, D.; Patroniak, V.; Górski, M.; Szojda, L.; Ciesielski, A.; Samorì, P. High-Performance Graphene-Based Cementitious Composites. Adv. Sci. 2019, 6, 1801195. [Google Scholar] [CrossRef] [PubMed]
  139. Lin, Z.; Fan, D.; Yang, S. Modelling and Experimentation on Mechanical Properties of Graphene-Oxide Cement. MATEC Web Conf. 2019, 274, 05004. [Google Scholar] [CrossRef]
  140. Gilbert, I. Shrinkage, cracking and deflection-the serviceability of concrete structures. Electron. J. Struct. Eng. 2001, 1, 15–37. [Google Scholar] [CrossRef]
  141. Menu, B.; Jolin, M.; Bissonnette, B. Studies on the Influence of Drying Shrinkage Test Procedure, Specimen Geometry, and Boundary Conditions on Free Shrinkage. Adv. Mater. Sci. Eng. 2017, 2017, 9834159. [Google Scholar] [CrossRef]
  142. Cement Concrete Aggregates Australia (CCAA). Concrete Testing and Quality Assurance; CCAA: Mascot, Australia, 2020. [Google Scholar]
  143. Ullah, M.; Imtiazi, S.B.A.; Khushnood, R.A.; Pervaiz, E.; Ahmed, W.; Ullah, A.; Qureshi, Z.A. Synthesis, characterization and application of graphene oxide in self consolidating cementitious systems. Constr. Build. Mater. 2021, 296, 123623. [Google Scholar] [CrossRef]
  144. Kumar, S.; Bheel, N.; Zardari, S.; Alraeeini, A.S.; Almaliki, A.H.; Benjeddou, O. Effect of graphene oxide on mechanical, deformation and drying shrinkage properties of concrete reinforced with fly ash as cementitious material by using RSM modelling. Sci. Rep. 2024, 14, 18675. [Google Scholar] [CrossRef] [PubMed]
  145. Chen, Z.; Xu, Y.; Hua, J.; Wang, X.; Huang, L.; Zhou, X. Mechanical Properties and Shrinkage Behavior of Concrete-Containing Graphene-Oxide Nanosheets. Materials 2020, 13, 590. [Google Scholar] [CrossRef] [PubMed]
  146. Li, P.; Li, W.; Wang, K.; Zhao, H.; Shah, S.P. Hydration and microstructure of cement paste mixed with seawater–an advanced investigation by SEM-EDS method. Constr. Build. Mater. 2023, 392, 131925. [Google Scholar] [CrossRef]
  147. Sargam, Y.; Wang, K.J.C.; Research, C. Quantifying dispersion of nanosilica in hardened cement matrix using a novel SEM-EDS and image analysis-based methodology. Cem. Concr. Res. 2021, 147, 106524. [Google Scholar] [CrossRef]
  148. Xiong, G.; Ren, Y.; Wang, C.; Zhang, Z.; Zhou, S.; Kuang, C.; Zhao, Y.; Guo, B.; Hong, S. Effect of power ultrasound assisted mixing on graphene oxide in cement paste: Dispersion, microstructure and mechanical properties. J. Build. Eng. 2023, 69, 106321. [Google Scholar] [CrossRef]
  149. Kowalczyk, R.M.; Gajewicz, A.M.; McDonald, P.J. The mechanism of water–isopropanol exchange in cement pastes evidenced by NMR relaxometry. RSC Adv. 2014, 4, 20709–20715. [Google Scholar] [CrossRef]
  150. Moraes, T.B. Transformada inversa de laplace para analise de sinais de ressonância magnética nuclear de baixo campo. Química Nova 2021, 44, 1020–1027. [Google Scholar] [CrossRef]
  151. Yang, Y.; Liu, J.; Su, X.; Liu, L.; Chen, Z.; Zhu, J.; Shi, C. Investigation of early hydration of cement by hydrogen nuclear magnetic resonance (1H NMR): New insights into paramagnetic effect. J. Build. Eng. 2024, 98, 111362. [Google Scholar] [CrossRef]
  152. Muller, A.C.A. Characterization of Porosity & CSH in Cement Pastes by 1H NMR. Ph.D. Thesis, EPFL, Lausanne, Switzerland, 2014. [Google Scholar]
  153. Murali, M.; Alaloul, W.S.; Mohammed, B.S.; Musarat, M.A.; Salaheen, M.A.; Al-Sabaeei, A.M.; Isyaka, A. Utilizing graphene oxide in cementitious composites: A systematic review. Case Stud. Constr. Mater. 2022, 17, e01359. [Google Scholar] [CrossRef]
  154. Li, X.; Lu, Z.; Chuah, S.; Li, W.; Liu, Y.; Duan, W.H.; Li, Z. Effects of graphene oxide aggregates on hydration degree, sorptivity, and tensile splitting strength of cement paste. Compos. Part A Appl. Sci. Manuf. 2017, 100, 1–8. [Google Scholar] [CrossRef]
  155. Smith, S.C.; Rodrigues, D.F. Carbon-based nanomaterials for removal of chemical and biological contaminants from water: A review of mechanisms and applications. Carbon 2015, 91, 122–143. [Google Scholar] [CrossRef]
  156. Trikkaliotis, D.G.; Mitropoulos, A.C.; Kyzas, G.Z. Low-cost route for top-down synthesis of over- and low-oxidized graphene oxide. Colloids Surf. A Physicochem. Eng. Asp. 2020, 600, 124928. [Google Scholar] [CrossRef]
  157. Ramli, R.; Hidayat, R. Graphene Oxide Based on Biomass Waste: Synthesis and Applications. In Graphene-A Wonder Material for Scientists and Engineers; IntechOpen: London, UK, 2022. [Google Scholar]
  158. Bahmei, F.; Bahramifar, N.; Ghasemi, S.; Younesi, H.; Weil, M. Comparison of environmental impacts in the production of graphene from biomass waste and the Hummers’ method. J. Clean. Prod. 2025, 497, 145145. [Google Scholar] [CrossRef]
  159. Alcaraz, L.; Díaz-Guerra, C.; Fernández-Martínez, R.; Gómez-Mancebo, M.B.; Sotillo, B.; Llorente, I.; López, F.A. Second life of recycled graphite for sustainable production of multilayer graphene related materials with multiple potential applications. Mater. Charact. 2024, 209, 113695. [Google Scholar] [CrossRef]
  160. Ribeiro, J.S.; Freitas, M.B.; Freitas, J.C. Recycling of graphite and metals from spent Li-ion batteries aiming the production of graphene/CoO-based electrochemical sensors. J. Environ. Chem. Eng. 2021, 9, 104689. [Google Scholar] [CrossRef]
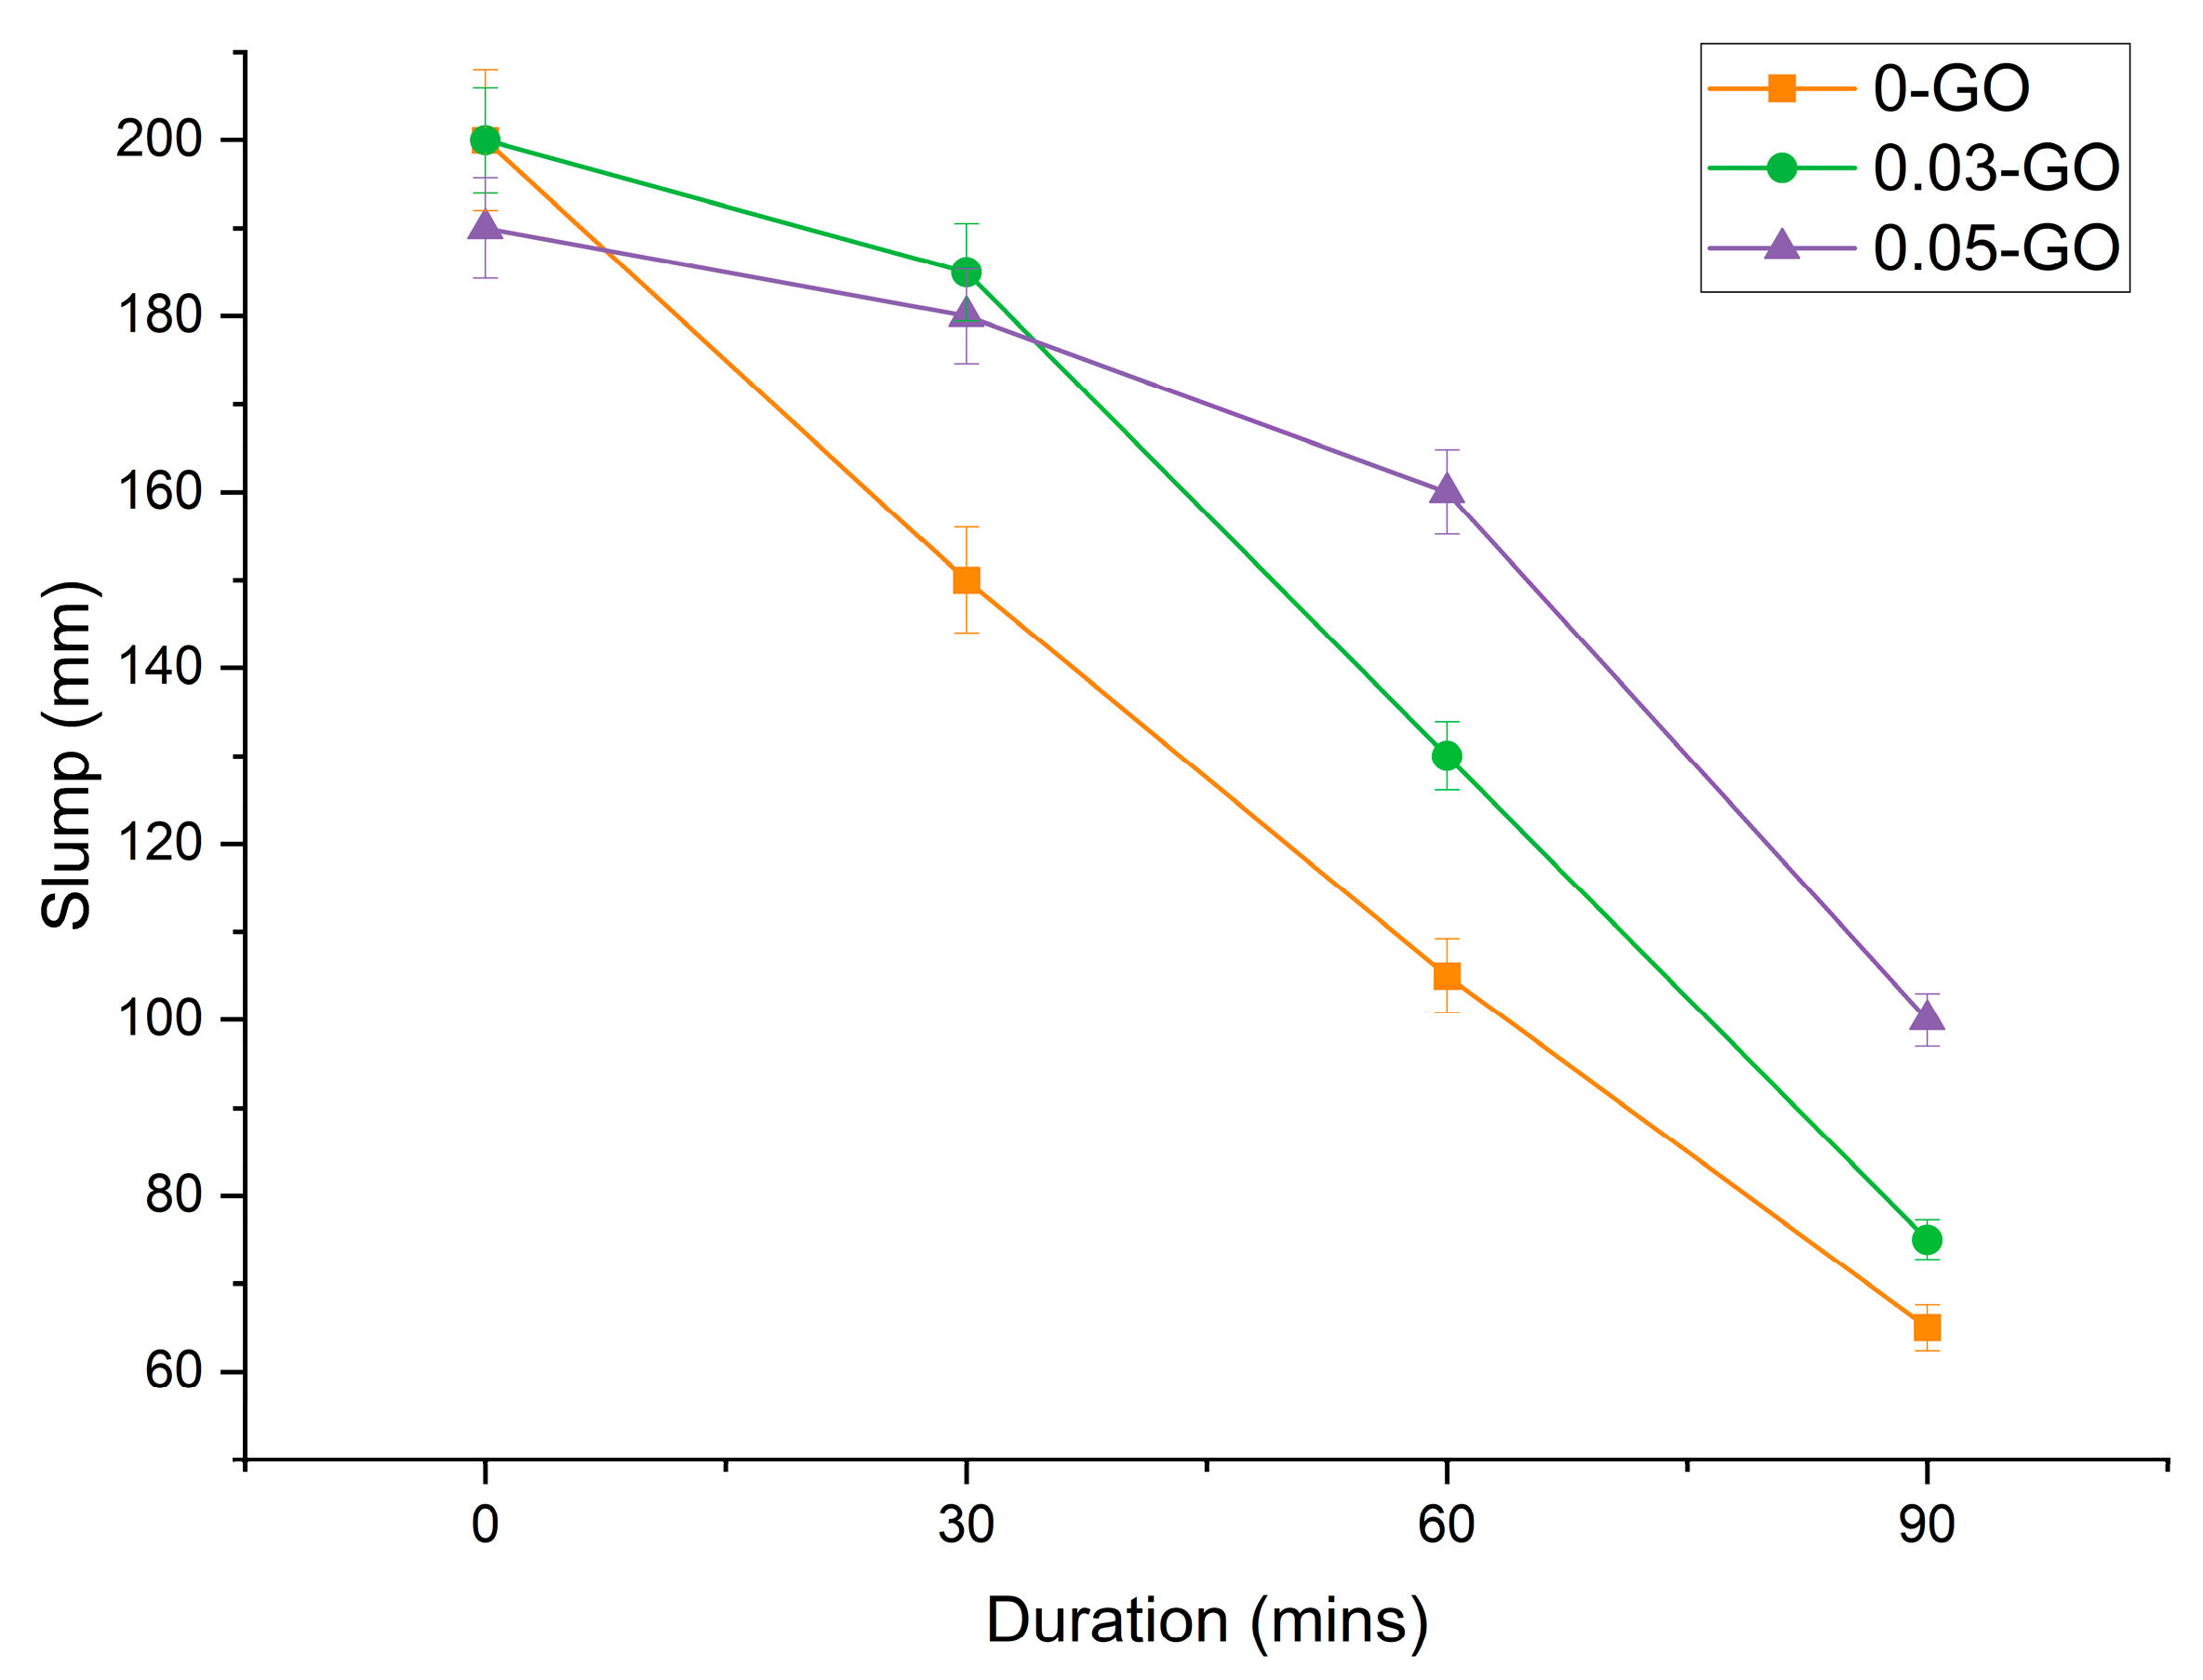
Figure 1. Variation in slump value across different mixes over duration.
Constrmater 05 00047 g001
Figure 2. FTIR spectra of GO, PCE and GO+PCE.
Constrmater 05 00047 g002
Figure 3. Variation in air content across different mixes.
Constrmater 05 00047 g003
Figure 4. Variation in average compressive strength across different mixes.
Constrmater 05 00047 g004
Figure 5. Variation in average split tensile strength across different mixes.
Constrmater 05 00047 g005
Figure 6. Variation in average flexure strength across different mixes.
Constrmater 05 00047 g006
Figure 7. Variation in average modulus of elasticity across different mixes.
Constrmater 05 00047 g007
Figure 8. Variation in average drying shrinkage across different mixes over time.
Constrmater 05 00047 g008
Figure 9. SEM images and EDS elemental maps of 0-GO and 0.05-GO specimens at 28 days; (a) SEM image of 0-GO, (b) SEM image of 0.05-GO, (c) EDS mapping for Carbon in 0-GO, (d) EDS mapping for Carbon in 0.05-GO, (e) EDS mapping for Calcium in 0-GO, (f) EDS mapping for Calcium in 0.05-GO, (g) EDS mapping for Aluminum in 0-GO, (h) EDS mapping for Aluminum in 0.05-GO, (i) EDS mapping for Silicon in 0-GO, (j) EDS mapping for Silicon in 0.05-GO.
Constrmater 05 00047 g009
Figure 10. T2 distribution map at 4hrs and 21 days of curing.
Constrmater 05 00047 g010
Figure 11. (a) TGA and (b) DTG curves of 0-GO and 0.05GO at 7 and 28 days of curing.
Constrmater 05 00047 g011
Figure 12. Embodied CO2 and EI of concrete mixes.
Constrmater 05 00047 g012
Figure 13. Embodied CO2 emissions and EI of concrete mixes.
Constrmater 05 00047 g013
Table 1. Concrete Mixture Proportions (kg/m3).
Mix IDOPCFly AshWaterCoarse
Aggregates
Fine
Aggregates
PCE *GO
0-GO4641161759407403.0500
0.03-GO4641161759407403.0500.174
0.05-GO4641161759407403.0500.290
* Polycarboxylate-ether based High Range Water Reducer (PCE).
Table 2. Chemical composition of OPC. Reprinted from Ref. [71].
Portland ClinkerLimestone (CaCO3)Residue AshesSlags, Ferrous Metal, Blast FurnaceGypsum (CaSO4 2H2O)
>87.5%<7.5%<7.5%<7.5%<5%
Table 3. Properties and Characteristics of GO.
PropertyValueExperimental MethodRef.
Particle size of graphite100–200 µmSieve Analysis[72]
d-spacing0.8447 nmX-ray diffraction (XRD)[73]
ID/IG0.8255Raman spectroscopy[73]
Carbon: Oxygen (C/O)1.67X-ray Photoelectron Spectroscopy (XPS)[73]
Oxygen content36.31%XPS[73]
Table 4. CO2 emissions and unit cost of raw materials.
MaterialCO2 Emissions (kgCO2-eq)Cost per kg (USD)
OPC0.885 [93]0.13 [93]
Fly Ash0.004 [94]0.07 [95]
Coarse Aggregate0.036 [96]0.04 [93]
Fine Aggregate0.024 [97]0.03 [93]
PCE4.610 [95]1.91 [95]
Water0.001 [98]0.003 [93]
GO23.2 [19]118.80 [99]
Table 5. Results of bleeding tests.
Time0 min15 min30 min45 min60 min90 min
0-GO000000
0.03-GO000000
0.05-GO000000
Table 6. Quantified distribution of mass percentages attributed to evaporable water and hydration products.
SegmentEquation0-GO: 7 Days0.05-GO: 7 Days0-GO: 28 Days0.05-GO: 28 Days
Evaporable water (~25–115 °C)Equation (1)9.767.309.967.40
CSH dehydration (115–450 °C)Equation (2)9.5110.2511.0511.04
CH decomposition (450–600 °C)Equation (3)1.181.421.031.35
CaCO3 decomposition (600–800 °C)Equation (4)2.833.442.533.20
Total Hydration Products (%)13.5215.1114.5915.59
Disclaimer/Publisher’s Note: The statements, opinions and data contained in all publications are solely those of the individual author(s) and contributor(s) and not of MDPI and/or the editor(s). MDPI and/or the editor(s) disclaim responsibility for any injury to people or property resulting from any ideas, methods, instructions or products referred to in the content.