Article

Quantifying the Effects of Material Input Levels on Jointed Plain Concrete Pavement (JPCP) Performance and Slab Thickness

1
Kimmel School of Construction Management, College of Engineering and Technology, Western Carolina University, Cullowhee, NC 28723, USA
2
Department of Engineering Technology and Construction Management, William States Lee College of Engineering, University of North Carolina, Charlotte, NC 28223, USA
3
Department of Civil and Environmental Engineering, William States Lee College of Engineering, University of North Carolina, Charlotte, NC 28223, USA
*
Author to whom correspondence should be addressed.
Constr. Mater. 2024, 4(1), 251-270; https://doi.org/10.3390/constrmater4010014
Submission received: 28 November 2023 / Revised: 22 January 2024 / Accepted: 26 January 2024 / Published: 21 February 2024

Abstract

:
The mechanistic-empirical pavement design guide (MEPDG) is a commonly accepted design principles guide that aids in jointed plain concrete pavement (JPCP) design and performance analysis. The MEPDG uses three different design parameter input levels, referred to as level one, level two, and level three, providing increasing confidence in the analysis at the lower numbered levels, which use more locally relevant (level two) or project-specific (level one) data. The state-of-the-art pavement ME software (version 2.6.2) uses MEPDG design principles to predict pavement performance. The three performance indicators for JPCP systems (international roughness index (IRI), joint faulting, and transverse cracking) experience significant changes when simulating under a different input level. The IRI and faulting indicator changed by 78 percent when using inputs varying from level one to level three, with the cracking indicator change being more severe at 87 percent. To accommodate the change in performance indicator values between input level one and input level three, increasing the concrete slab thickness is necessary to achieve comparable pavement performance. An increase in the Portland cement concrete (PCC) layer from one inch to two inches is required when input level three simulations are performed, demonstrating the economic and sustainability benefits of using project-specific level one inputs. Understanding the impact of simulation input levels will help to meet design and sustainability goals and improve the lifecycle performance of JPCP systems.

1. Introduction

The mechanistic-empirical pavement design guide (MEPDG) is the current state-of-the-art tool for the design and performance analysis of rigid pavements [1,2,3,4,5]. Although the MEPDG is widely used as a design and analysis tool in the United States, the approach and software are available for international use. The MEPDG approach has established three levels of design input. This allows the designer to input project-specific information for some aspects of pavement design (level one) where that information is available or to accept nationally averaged default values for inputs where no information is available (level three). There is also a middle level of the inputs, level two, where the designer might be able to input a different parameter than what is required, and the software will render the correlation or a more specific regional value can be used [6]. Level one requires the engineer to obtain the most accurate design inputs. Level two requires testing, but the use of correlations is allowed. Level three generally uses estimated values. Thus, level one has the least possible error associated with inputs, while level two has more, and level three has the most [7]. The utilized input level will affect the resulting design, reliability, and cost of the pavement [7]. The recommended level of input depends on the significance that the input has on the pavement’s design (i.e., the impact of future pavement damage and distress predictions) and the ability to measure it [7]. Level one is viewed as the most accurate design level requiring site-specific weight and volume data collected at or near the project site. Level two has intermediate accuracy with a modest knowledge of the traffic characteristics requiring regional weight data and site-specific volume data, and level three is the least accurate design level with knowledge of only statewide default weight and volume data [8].
As agencies in the United States and abroad strive to improve both the economy and sustainability of their pavement infrastructure, research to better understand the influence of different types of data will help to justify the costs associated with the collection of site-specific data and will support the efforts to quantify the benefits of design changes and alternative approaches [9,10]. The specifications used in China are the specifications of highway cement and concrete pavement design (JTG D40-2002). These pavement design specifications can be traced back to those used in Soviet Russia in the 1950s, primarily based on mechanistic design methods to determine pavement thickness. In the US, the various editions of the AASHTO guide for the design of pavement structures were developed based on the results from the 1960s AASHO road test and new research results conducted in recent decades, such as the National Cooperative Highway Research Program (NCHRP) project 1-37A to produce a mechanistic-empirical (M-E) pavement analysis system for pavement design. Relative to the design procedure in JTG D40-2002, the proposed MEPDG design guide leaps a big step forward in predicting pavement performances with climate, traffic, and material considerations. It was found that pavements designed with the Chinese specification are subject to serious premature failures [6].
The MEPDG establishes three measures of performance for JPCPs: the international roughness index (IRI), faulting, and cracking. IRI-based specifications are currently used around the world by many nations and typically include provisions based only on road surface type, road functional category, road speed limit, road construction type, and AADT. IRI thresholds are specified as a constant value in a segment of a defined length, the average value of all the segments in a section, or one or more percentiles of observations. The IRI for a single path and the mean roughness index (MRI) for two-wheel paths are mostly used around the world [11]. In the US, IRI thresholds are more often a function of road construction type and road speed limit. However, many non-US countries have specifications that are a function of road function categories with defined speed limits [11].
The IRI of a JPCP was found to be a function of the initial IRI, age, faulting, number of spalled joints, number of transverse cracks, precipitation, and freezing index [12]. Thus, it was recommended to use the IRI as a design criterion for this type of pavement. The IRI and age are the most significant factors affecting IRI values over time, followed by distress and, finally, environmental factors [12].
Faulting is a common distress type in a JPCP and is defined as the difference in elevation across a transverse joint or crack. Faulting can result from a combination of factors, such as inefficient load transfer at the joints, slab pumping, slab settlements, curling, warping, and inadequate base support conditions. Faulting plays a prominent role in pavement surface roughness over time, affecting both ride comfort and driver safety [13]. The presence of dowel bars was identified as the most important design feature to reduce joint faulting for a JPCP. For non-doweled JPCPs, an increase in load transfer efficiency was effective in reducing joint faulting in areas experiencing high to moderate precipitation in a JPCP with sealed joints [14]. In this same study, when analyzing pavements in lower precipitation areas, an increase in strong subgrade support was required in order to reduce joint faulting. In lower precipitation and lower temperature areas, skewed joints were found to decrease joint faulting for non-doweled JPCPs [14].
Cracking is the primary distress in JPCPs due to traffic loading and environmental stresses. Each pass of traffic loading results in damage-causing stress in concrete slabs. Environmental conditions, such as curling caused by vertically differential temperatures in the slab and warping caused by vertically differential shrinkage, also create stresses that contribute to damage in the concrete slab [15].
As agencies move to mechanistic-empirical pavement design approaches, decisions must be formed regarding the investments an agency desires to (or is able to) choose in obtaining to support the analysis and design process. Level one input parameters are measured directly; they are site- or project-specific. This level represents the greatest knowledge about the input parameter for a specific project [16] but can also require an investment of resources to support laboratory and/or in-situ testing.
In a study conducted by Li and Cramer on the MEPDG, the detailed inputs required for the level one option were treated as independent variables with very specific calculation purposes. The interrelationship between the concrete strength inputs and concrete component properties was not directly addressed within the program and was established via laboratory testing [17]. Hall, Beam, and Lee stated that the accuracy of the model, no matter how good the inputs, can only be as good as the calibration that has been put into the inputs [18]. When the accuracy of pavement performance is compared among the three design levels, it was observed that ME design level one yields cracking and an IRI somewhat close to the field values. Therefore, it can be concluded that the incorporation of all material properties in design input level one improves the ME performance prediction [19], although the exact extent of the improvement could vary widely due to the vast range of local and project-specific conditions that could be encountered. When considering locally calibrated distress models in Tennessee, level two traffic (locally calibrated) predicted distresses that were much closer to the measured values than all the traffic levels, whereas the nationally calibrated distress models mostly favored level three inputs. For the calibrated distress prediction models, locally calibrated distress model predictions were much closer to the measured values compared to nationally calibrated distress models [20]. In a study conducted by Hossain, the use of level two PCC CTE inputs resulted in a more conservative JPCP design than that using level one inputs [21].
Many transportation agencies in the United States have performed research to better understand the significance and value of level one (or project-specific) inputs on rigid pavement design. The mechanistic-empirical procedure in the MEPDG uses the principles of engineering mechanics to calculate pavement responses mechanistically, as well as the empirical distress transfer functions for predicting pavement performance. The empirical distress transfer functions used in the MEPDG are nationally calibrated using design inputs and distress data largely from the national long-term pavement performance (LTPP) database. Although this effort was comprehensive, further calibration and validation studies to suit local conditions are highly recommended by the NCHRP project 1-37A as a prudent step in implementing a new design procedure that is very different from previous procedures [22]. For example, the Florida Department of Transportation (FDOT) study identified the significance of the PCC property measurement and the consequential use of hierarchy level one for important and large-scale projects, as the resultant pavement structure differed up to three inches in thickness for the same concrete mixture [23]. In a study for North Carolina rigid pavements, Cavalline et al. [9,10] found that default MEPDG inputs were conservative, and new locally representative input values measured via a laboratory study would result in a design pavement thicknesses up to 1 inch thinner than what is currently being utilized.
Tanesi and Meininger performed a study on CTE level input and found that when two concrete mixtures were compared using inputs at levels one and two, considerable differences in the predicted percentages of slabs with transverse cracking, faulting, and IRIs were found. The use of level two inputs resulted in higher PCC CTE values and, as a consequence, higher predicted distresses [24]. In another study, it was found that the mixture-specific laboratory measurements of level one PCC moduli of ruptures and moduli of elasticity may be appropriate for high-value projects [25,26]. A study by the South Carolina Department of Transportation (SCDOT) indicated that material properties for the PCC surface layer, base layer, and subgrade layer are basic input parameters for the AASHTOWare Pavement ME Design (PMED) software. Thus, field testing, sampling, and laboratory testing of these materials are needed to obtain the missing data and achieve level one inputs for each of the identified pavement sections [27]. If adequate resources are available for level one laboratory testing, results from flexural strength, moduli of elasticity, Poisson’s ratio, and CTE should be utilized as inputs to the PMED software. In addition, unit weight, cementitious material content, w/c ratio, cement type, and curing can also be determined and used in the analysis. Level one inputs will essentially override all other default values suggested for the design [28].

Significance of the Work

As described above, there are known significant differences in the three performance indicators, IRIs, faulting, and cracking between the level one, two, and three input levels. The differences between the different input levels should be taken into consideration when designing JPCPs. This study analyzes and quantifies the impact of material input levels on JPCP performance and provides recommendations on the PCC slab layer thickness depending on which level of analysis is being used.
Although the data used to support the analysis is local to North Carolina, the United States of America, the work can be used to guide other agencies and stakeholders in performing similar analyses of the impact of level one inputs on pavement analysis and design. The findings of this study provide an improved understanding of how the Pavement-ME software behaves based upon which level of analysis is being used, helping agencies to justify the cost, time, and resources required to obtain level one inputs to support PCC pavement design. Furthermore, the approach provides users with an improved understanding of Pavement-ME software behavior, supporting more cost-effective, sustainable, and efficient pavement design. Users of Pavement-ME software in the United States and internationally can gain insights that will help them understand the differences in performance indicator values between different simulation levels. The findings of this study could encourage further research by other entities into improved inputs and the local calibration of mechanistic-empirical pavement design for their regions.

2. Methodology

Concrete mixture groups were created to test concrete performance under multiple mixture designs. The mixture designs were based on the type of coarse aggregate, fine aggregate, and percentage of fly ash. The mixtures used in this study used the following denotation for the mixture matrix. The coarse aggregates were designated as C1 (amphibolite and biotite gneiss from Statesville Quarry, Statesville, NC, USA) and C2 (granite from Knightdale Quarry, Knightdale, NC, USA). The fine aggregates (both natural silica sands) were designated as N1 (Emery Pit, Jackson Springs, NC, USA) and N2 (Buckleberry Mine, Princeton, NC, USA). The cement type was designated as O (ordinary Portland cement), as there is only one type. The class F fly ash (from Roxboro, NC, USA) replacement rates for Portland cement were 0 percent, 20 percent, or 30 percent. Figure 1 and Figure 2 show the mixture preparation and laboratory testing, respectively.
The mixture matrix used in the broader study supporting this work consisted of 24 concrete mixtures and provided the framework of the mixtures that were batched, tested, and analyzed as part of this overall project. The mixture preparation and laboratory testing were performed to gather the level one inputs necessary for the pavement-ME simulations. In the study described in this paper, the mixtures used were the mixtures that had all of the necessary laboratory testing data complete for the simulations, C1N1OF20, C1N1OF30, C1N2O, C1N2OF20, C1N2OF30, C2N1O, and C2N1OF20. Additional studies will be performed on the other mixtures in the future. Table 1 provides the mixture proportions for the six mixtures used in the study. Additional information on the materials used in the concrete mixtures and test results is provided in Summers (2023) and Sabih et al. (2024) [29,30].
As shown in Table 1, each mixture has a different composition. Different types of coarse aggregates were selected for use, along with two natural sands and three different replacement rates of fly ash for Portland cement (0 percent, 20 percent, and 30 percent). Table 1 shows the different mixture identifications used for the mixtures batched and tested. The letter “C” represents the coarse aggregate. The letter “N” represents natural sand. The letter “O” represents ordinary Portland cement. The letter “F” represents the fly ash. The subscripts “20” and “30” represent a 20 percent fly ash composition and a 30 percent fly ash composition, respectively. An example of a mixture designation is C1N1OF20 based on coarse aggregate-1, natural sand-1, OPC, and 20 percent fly ash.
For the purposes of this study, the mixtures selected for analysis were tested in the laboratory, and test data for up to 90 days was obtained. The test data for the CTE and compressive strength is shown in Table 2. The elastic moduli and MOR values are listed in Table 3. For levels two and three, the PMED default CTE value of 10.44 (5.8) (cm/cm)/°C ((in./in.)/°F) for the concrete prepared with the granitic coarse aggregate was used.
The default design inputs, as shown in Table 4, were kept constant for the entire simulation work. There were four pavement layers, which included the PCC layer, a lime-stabilized base course layer, a crushed gravel base course layer, and a subgrade layer. The JPCP design life was also kept constant at 30 years. Each input level requires different material inputs for analysis in the PMED software. Level one requires time series testing data for EM and MOR. Level two requires time series test data for compressive strength. Level three requires testing data for the 28-day compressive strength value.

3. Level One, Two, and Three Analyses and Results

The level one, two, and three input levels were used to support the pavement-ME simulations for mixtures C1N1OF20, C1N1OF30, C1N2O, C1N2OF20, C1N2OF30, C2N1O, and C2N1OF20. Based on the simulation results for each paving mixture, the performance indicators obtained using level one, two, and three inputs were assessed to see the difference in performance predictions. As expected, the results indicated a significant change in the performance indicator predictions of the IRI, faulting, and cracking at different input levels. The relative magnitude of each of these changes was assessed to provide guidance to the agency sponsoring this work, as well as to others interested in supporting work to obtain local or project-specific inputs for mechanistic-empirical pavement design. Each performance indicator, IRI, faulting, and cracking were individually assessed, and the results are described in the following sections.

3.1. Level One Results

As previously described, level one is known to be the most accurate input level, providing project-specific or mixture-specific data. Inputs for 7-, 14-, 28-, and 90-day EM and MOR values, along with the 28-day CTE value, are required to run the design simulations. Each simulation performed was based on the laboratory test results for that specific mixture. The performance indicator results for each individual mixture of the simulation for the level one inputs are shown in Figure 3, Figure 4 and Figure 5. The IRI indicator showed a significant change between the mixtures that were assessed. The highest value for the simulations performed on the mixtures was 175, and the lowest value was 141. There was a 24 percent difference in the values for the level one IRI indicator.
The faulting indicator also showed a significant fluctuation. In Figure 4, the highest value for faulting is 0.11, and the lowest value for faulting is 0.09. There is a 22 percent difference between the highest and lowest values for the level one faulting indicator.
The cracking indicator showed an upward trend as each assessed mixture included more fly ash, as shown in Figure 5. The lowest value for cracking was 4 percent, and the highest value was 37 percent. This is a 33 percent difference in the highest and lowest values within the level one cracking indicator, which is the most significant one.

3.2. Level Two Results

Level two simulations were performed for each individual mixture. Level two simulations are known to not be as accurate as level one simulations since the inputs are often regional or historically used values. Level two simulations require 7-day, 14-day, 28-day, and 90-day compressive strength values. Each simulation performed for level two is based on each individual mixture’s laboratory test results for the 7-day, 14-day, 28-day, and 90-day compressive strength values. For level two, the CTE default value was used. This value was identified as 10.44 (5.8) (cm/cm)/°C, ((in./in.)/°F) for the granites. Based on these inputs, level two simulations were performed. The results for the level two simulations are shown in Figure 6, Figure 7 and Figure 8. The IRI indicator for level two had a high value of 282 and a low value of 225. The difference in the level two IRI values was 25 percent. The level two IRI indicator followed the same trend as the level one IRI indicator but with more fluctuations in the indicator value. Figure 6 shows a higher visual difference in indicator value compared to Figure 3.
The high value for the level two faulting indicator was 0.17, and the low value was 0.15, as shown in Figure 7. The difference in values for the faulting indicator was 13 percent. The level two faulting indicator showed a decreasing trend in faulting as fly ash was added to the mixture. The level two faulting indicator followed the same trend as the level one faulting indicator. In the level two faulting indicator, there were more fluctuations in the indicator value than in the level one faulting indicator value.
Figure 8 presents the level two cracking indicator results. The high value for the level two cracking indicator was 100 percent, and the lowest value for the level two cracking indicator was 58 percent. The percentage difference in the level two cracking indicator was 42 percent. Compared to the level one cracking indicator, the level two cracking indicator had higher cracking values for every mixture. The level two cracking indicator showed almost every mixture as 100 percent cracking, which is a significant change in the predictor value for level one.

3.3. Level Three Results

The level three input level is known to not be as accurate as the level one or two input levels since the level three values are the default values. The requirement for the level three input level is the 28-day compressive strength value. The CTE value used for the level three input level was the CTE default value of 10.44 (5.8) (m/m)/°C, ((in./in.)/°F). Based on these inputs, the simulations were performed, and the indicator results were produced for the IRI, faulting, and cracking. The results for the IRI, faulting, and cracking indicators for level three are shown in Figure 9, Figure 10 and Figure 11. The level three IRI indicator had a high value of 280 and a low value of 222, as shown in Figure 9. The percentage difference in the level three IRI indicator value was 26 percent. The level three IRI indicator, compared to the level one IRI indicator, had higher values. The level three IRI indicator followed a similar trend in the prediction of indicator values between the different mixtures. The level two IRI indicator predicted very similar values to the level three IRI indicator. The level three IRI indicator had slightly lower values compared to the level two IRI indicator.
The high value for the level three faulting indicator was 0.17, and the low value was 0.15, as shown in Figure 10. The percentage difference in the level three faulting indicator values was 13 percent. Compared to the level one faulting indicator, the level three faulting indicator followed a similar trend in mixture prediction. The level three faulting indicator predicted the performance indicator to be a higher value than the level one faulting indicator. The level three faulting indicator compared to the level two faulting indicator was nearly identical.
In Figure 11, the high value for the level three cracking indicator was 100 percent, and the lowest value for the level three cracking indicator was 54 percent. The percentage difference in the level three cracking indicator was 46 percent. The level three cracking indicator, compared to the level one cracking indicator, showed significantly higher values. The level three cracking indicator showed a similar trend in the prediction of indicator values between the different mixtures and showed similar cracking values to the level two cracking indicator predictions. The level two cracking indicator, compared to the level three cracking indicator, had a higher value of prediction for the C1N2OF20 mixture. The rest of the mixtures assessed between the level two and level three cracking indicators were the same.

4. Level One, Two, and Three Indicator Comparisons

Levels one, two, and three are known to have differences in performance indicator values. Analysis of the differences between the level one, two, and three indicators is necessary to understand the use of these input levels while designing new JPCP systems. Based on the data from the level one, two, and three simulations, the analysis of the difference in each performance indicator was conducted. Through the analysis of the IRI, faulting, and cracking indicators, there will be a greater understanding of the percentage difference in the pavement performance between each input level. To show a clear comparison of each input level and indicator results, the IRI indicator, faulting indicator, and cracking indicator were separately assessed.

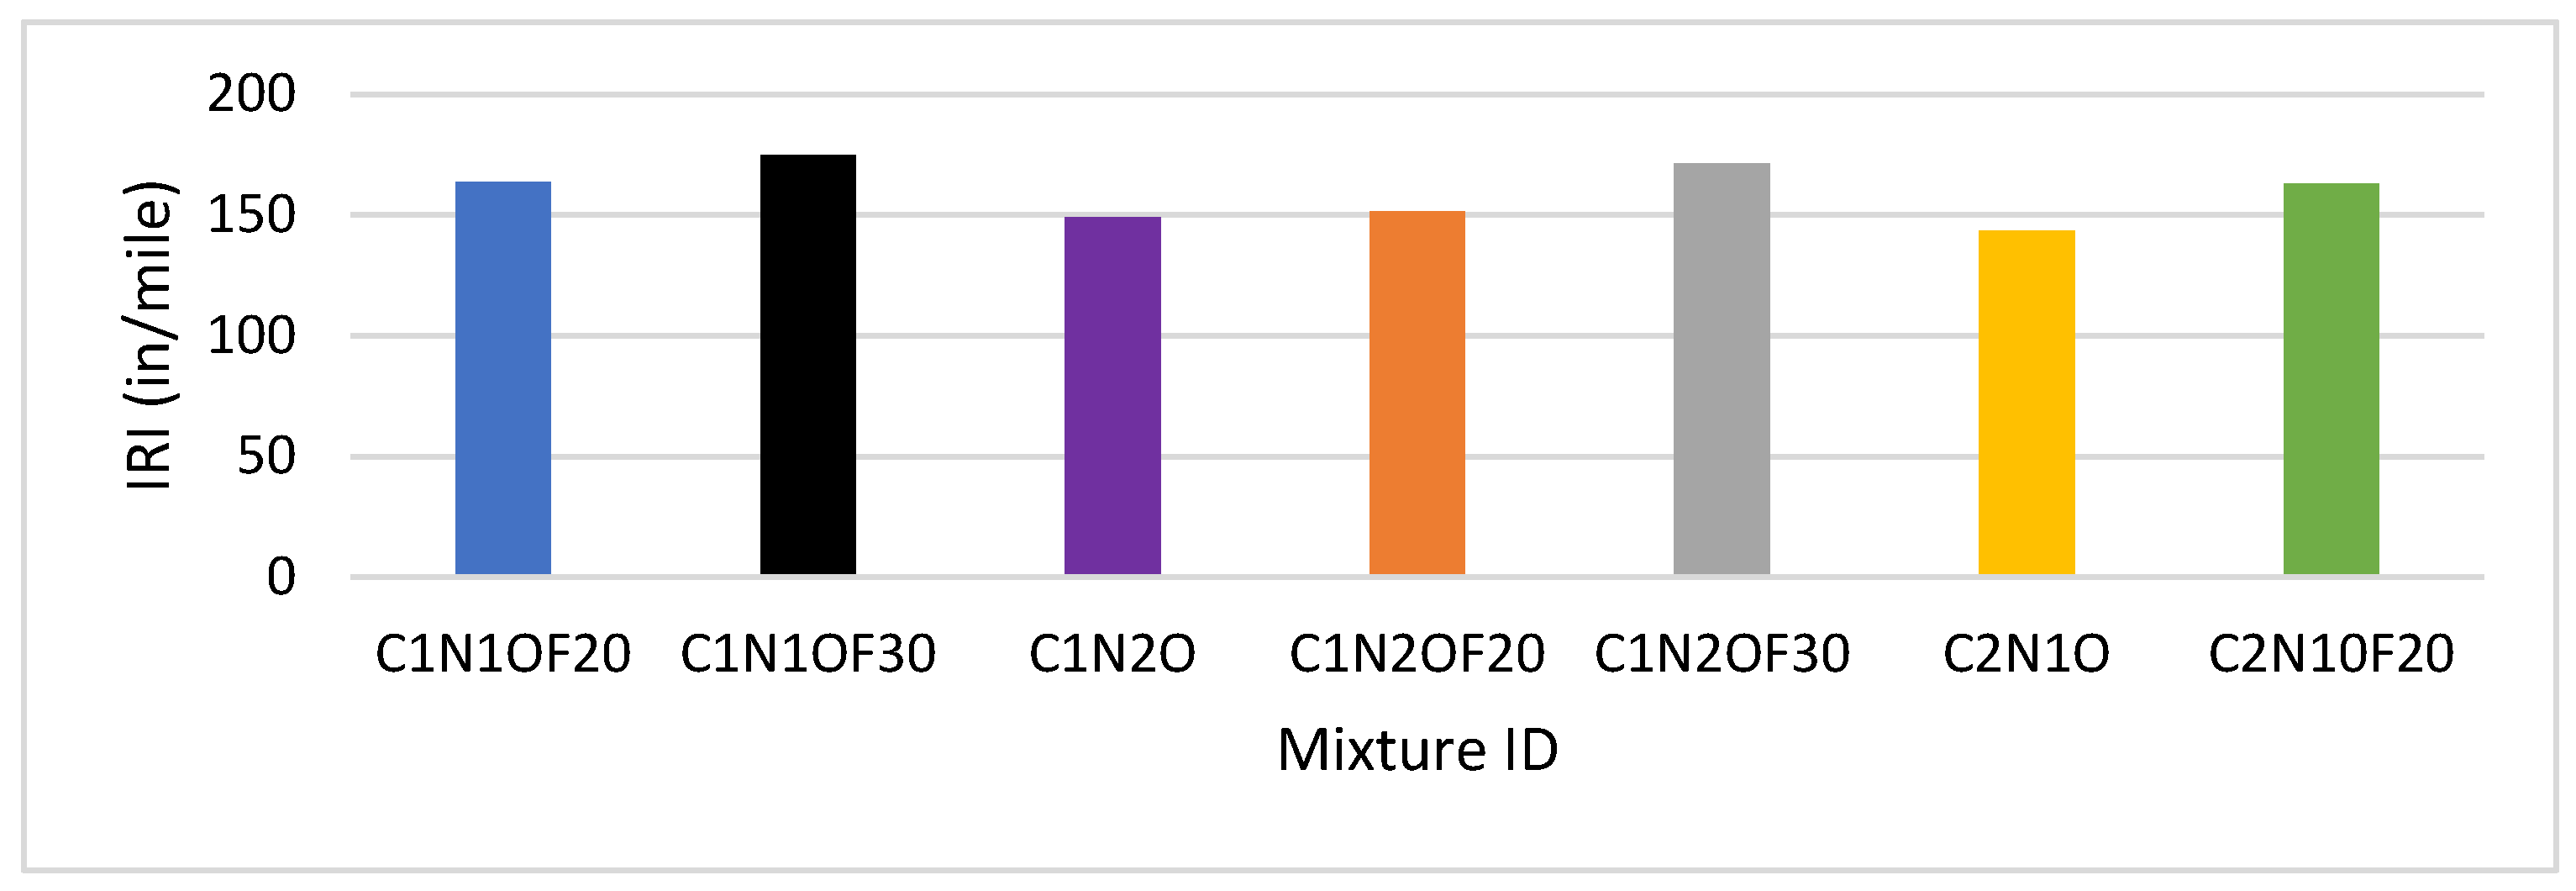
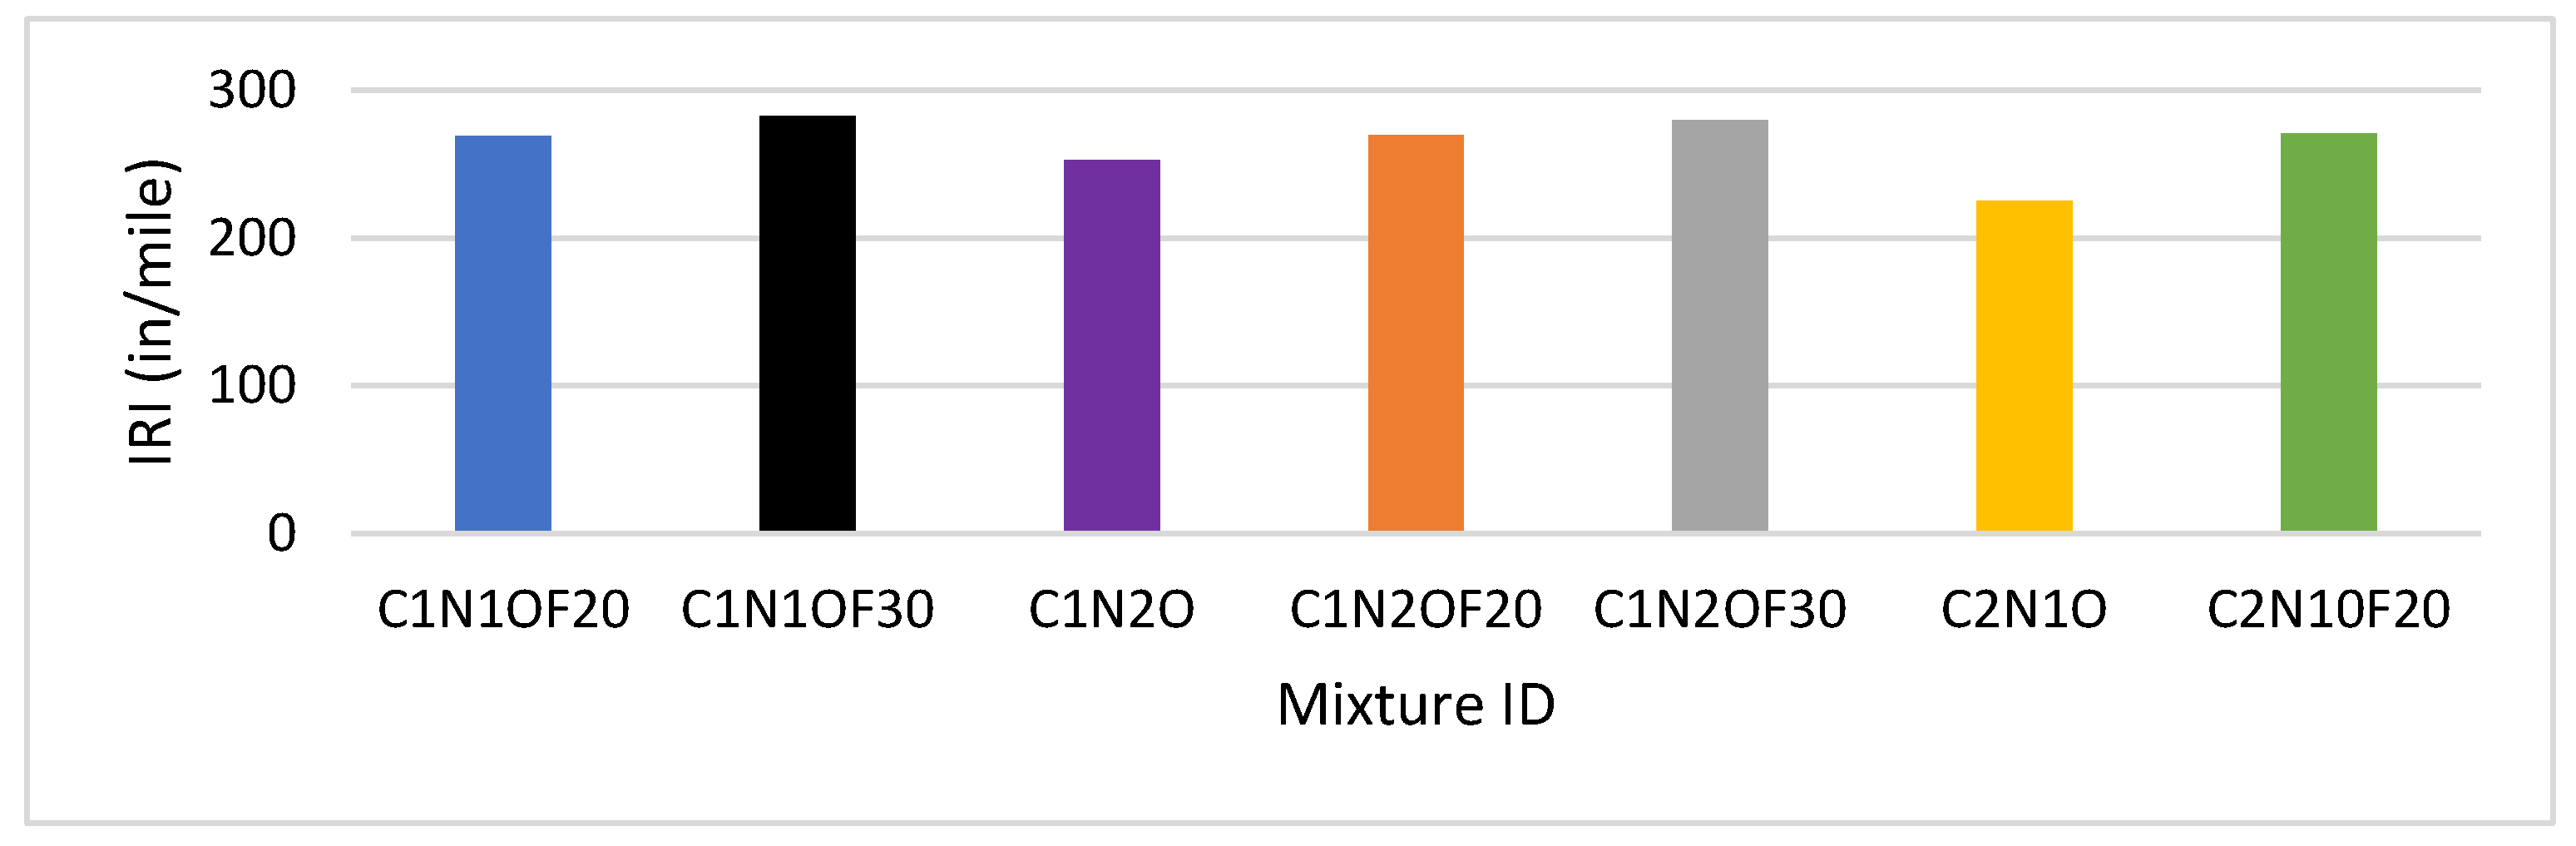
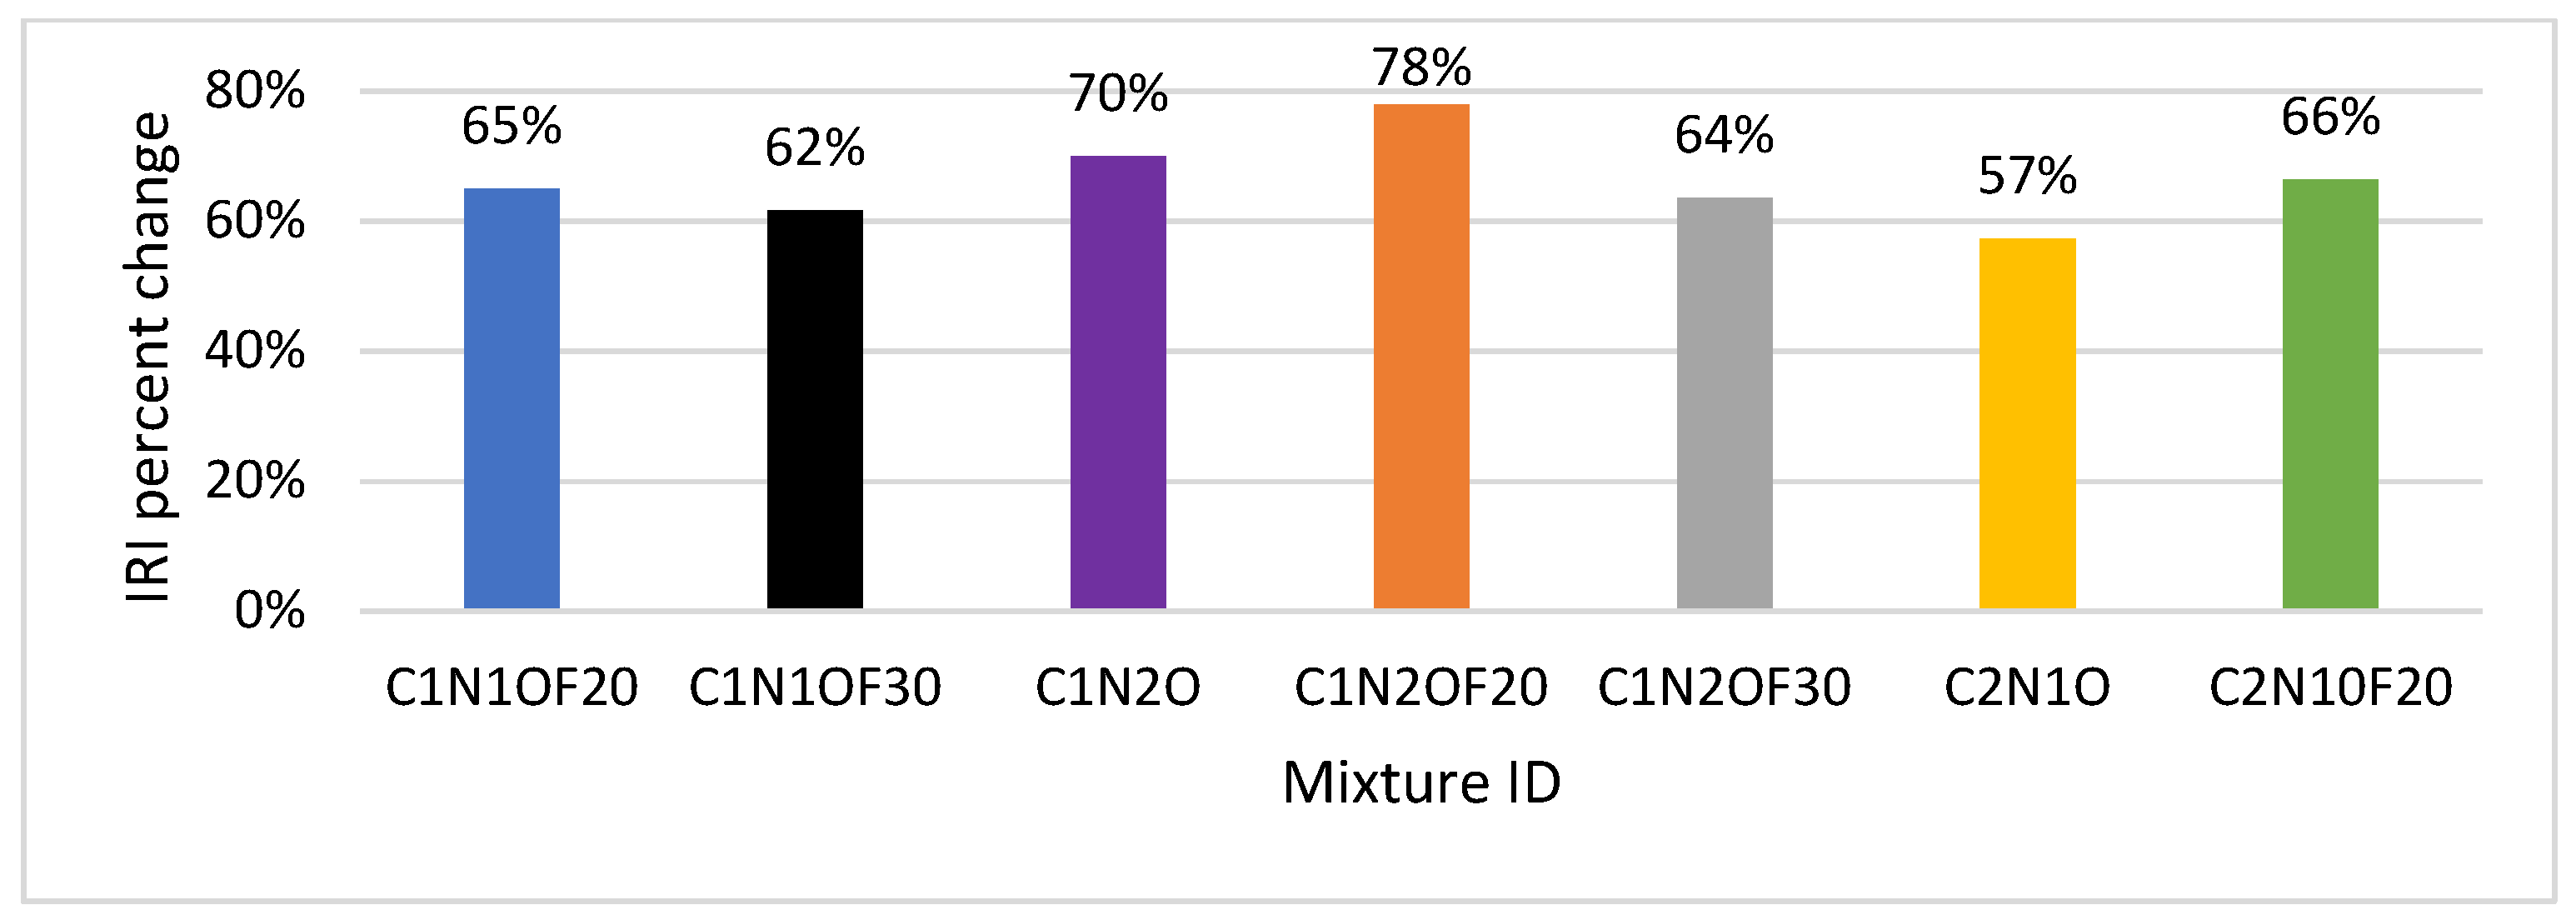
4.1. IRI Indicator Analysis

Figure 12 shows the comparison of the level one through to the level three indicator results for the IRIs. The level one IRI indicator had much lower values than both the level two and level three IRI indicators for each mixture. Figure 13 shows the percentage change in the performance indicators between the level one and level three simulations. The highest percentage difference between the level one through to the level three inputs was 78 percent, and the lowest difference between the level one through to level three inputs was 57 percent. There is a clear difference in the IRI indicator values between level one through to the level three inputs.
The IRI indicators for level two and level three were almost similar for every paving mixture being simulated using this set of design parameters. However, there was a significant difference between the level two/level three results and the level one results (as explained earlier). The reason behind the difference in values could be tied to the use of more material data points for the level one analysis. With more laboratory test results being used for the level one analysis for each individual mixture, the results were more accurate than those of the level two/level three analysis. This necessitates the use of level one lab-tested inputs for any JPCP system to be designed through PMED.

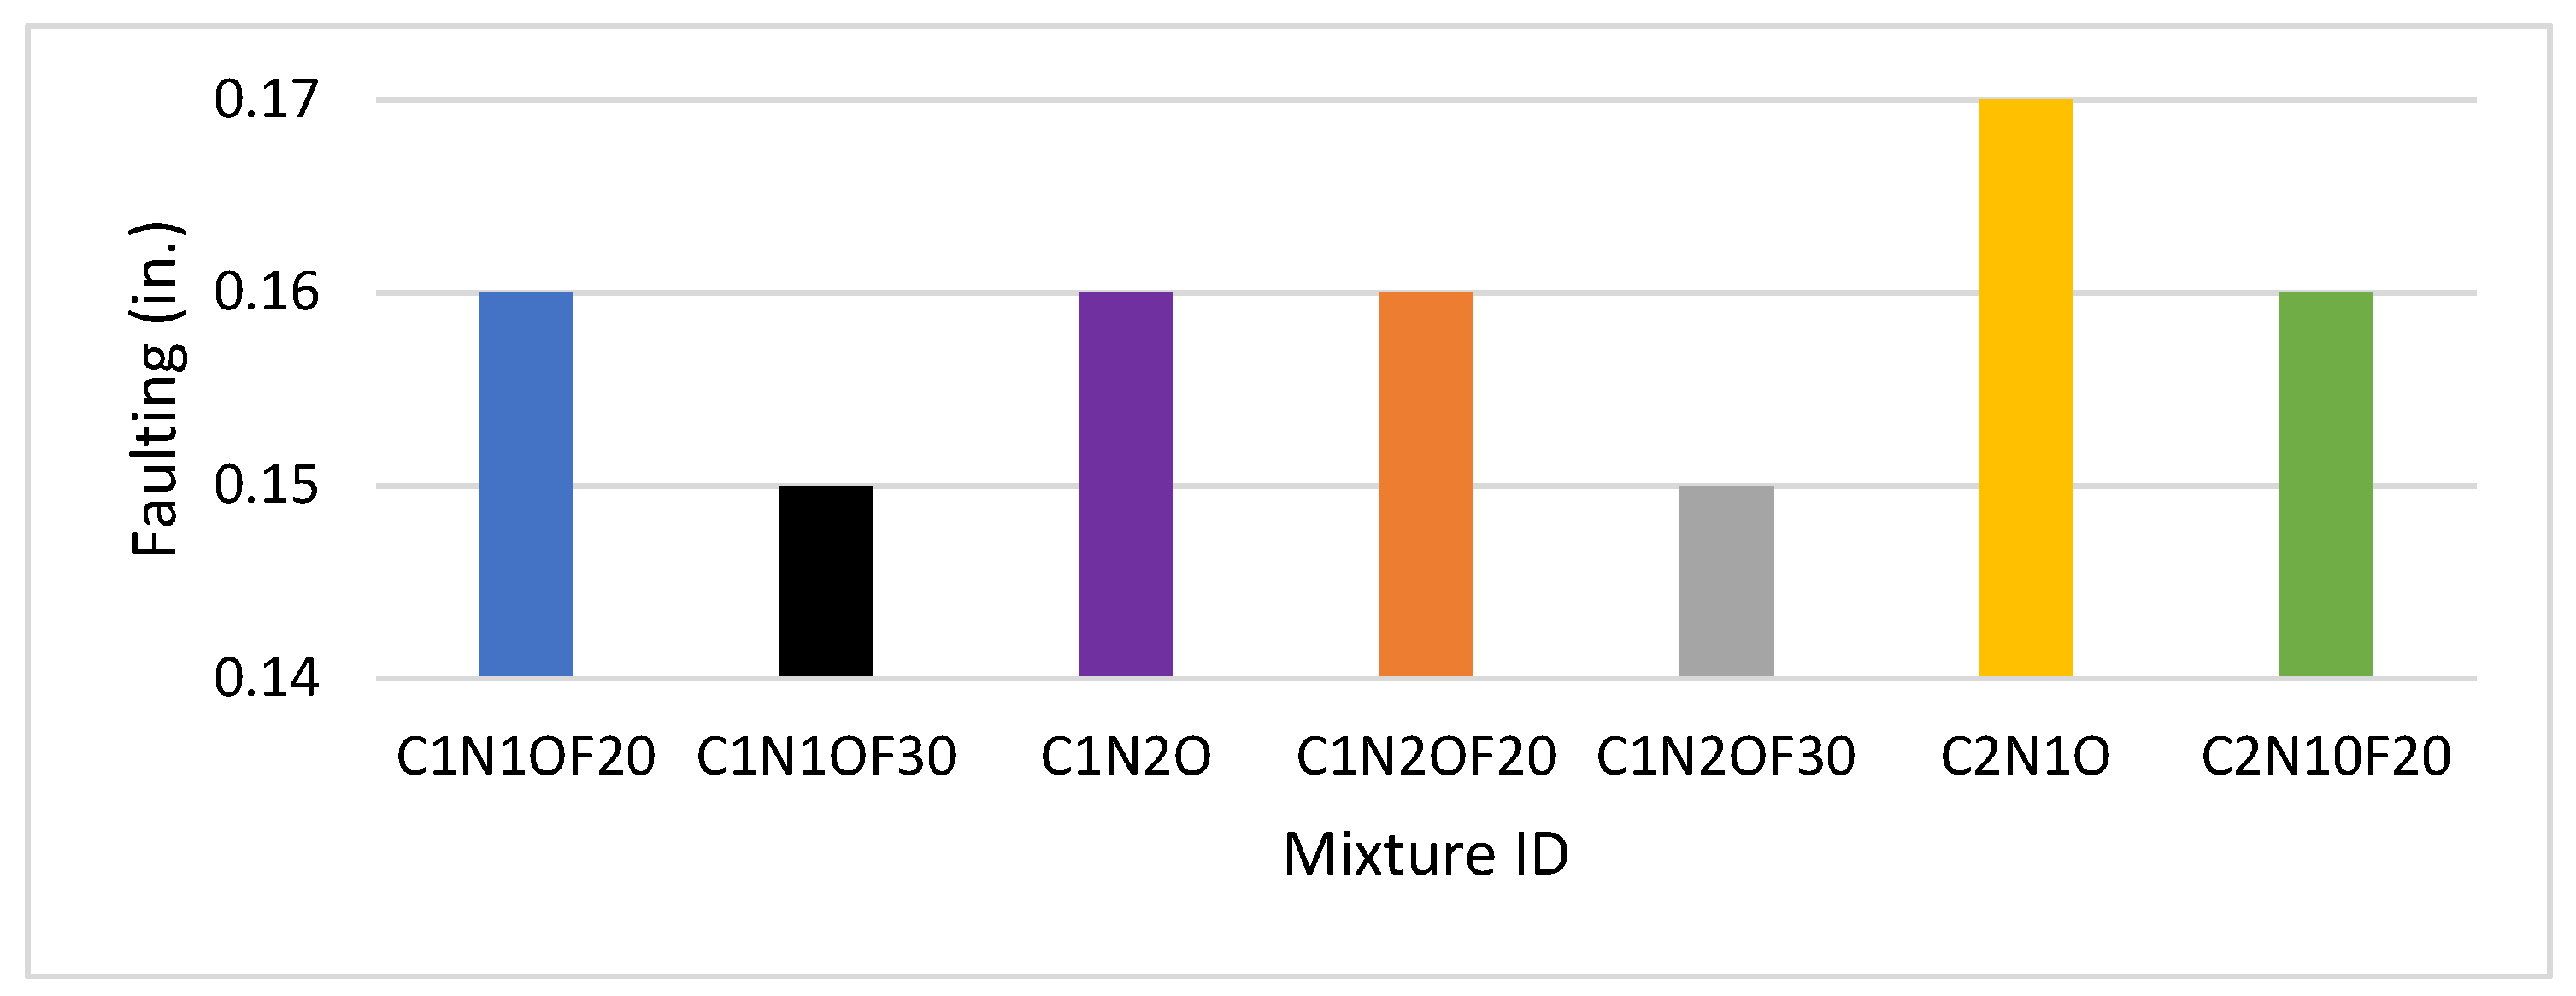
4.2. Faulting Indicator Analysis

The faulting indicator results for levels one, two, and three showed that there was a significant difference between level one and the other two input levels. The comparative analysis is shown in Figure 14. The level one faulting indicator was significantly lower than the level two and level three faulting indicators. For each individual mixture, the faulting indicator was nearly doubled for levels two and three when compared to level one. The results for level two and level three had almost similar indicator values.
In Figure 15, the percentage difference between the level one indicator value and the level three indicator value is compared. The highest percentage change between the indicator values was 78 percent, which is present in the C2N1OF20 mixture. Additionally, the lowest change in the indicator values was in the C2N1O mixture, at 45 percent. The highest faulting indicator value was for level two or level three. The level two and level three inputs were very similar to each other, with little difference in values. The level two and level three values for faulting were significantly higher than the level one inputs.
With the above in view, using level two or level three inputs may result in inaccurate JPCP design and level one inputs are recommended to be incorporated for the design of any JPCP system. Using level two/level three inputs may result in an overdesigned pavement, resulting in the overspending of material and financial resources. These findings should be useful for pavement designers in understanding the potential relative impact of investment in and use of level one inputs.

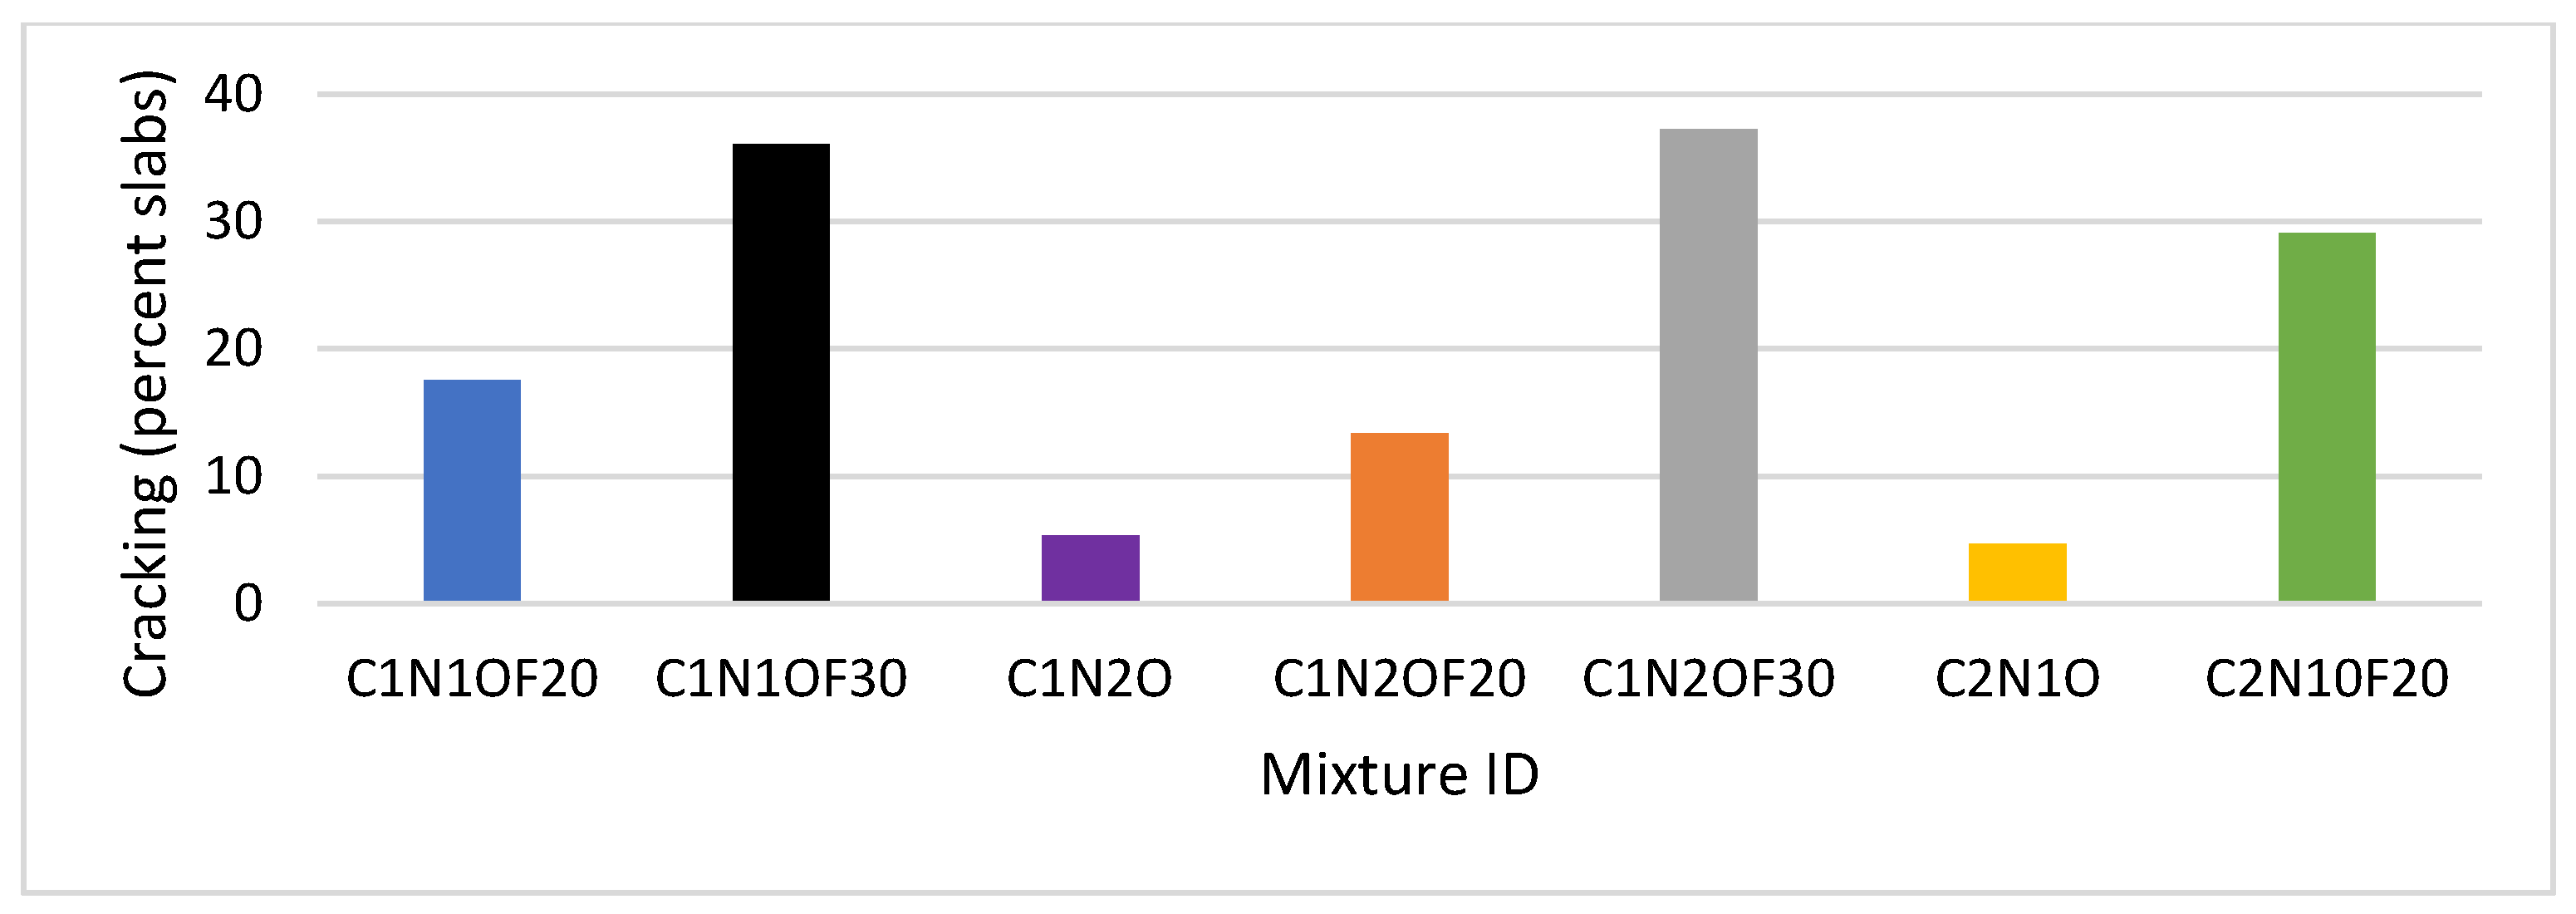
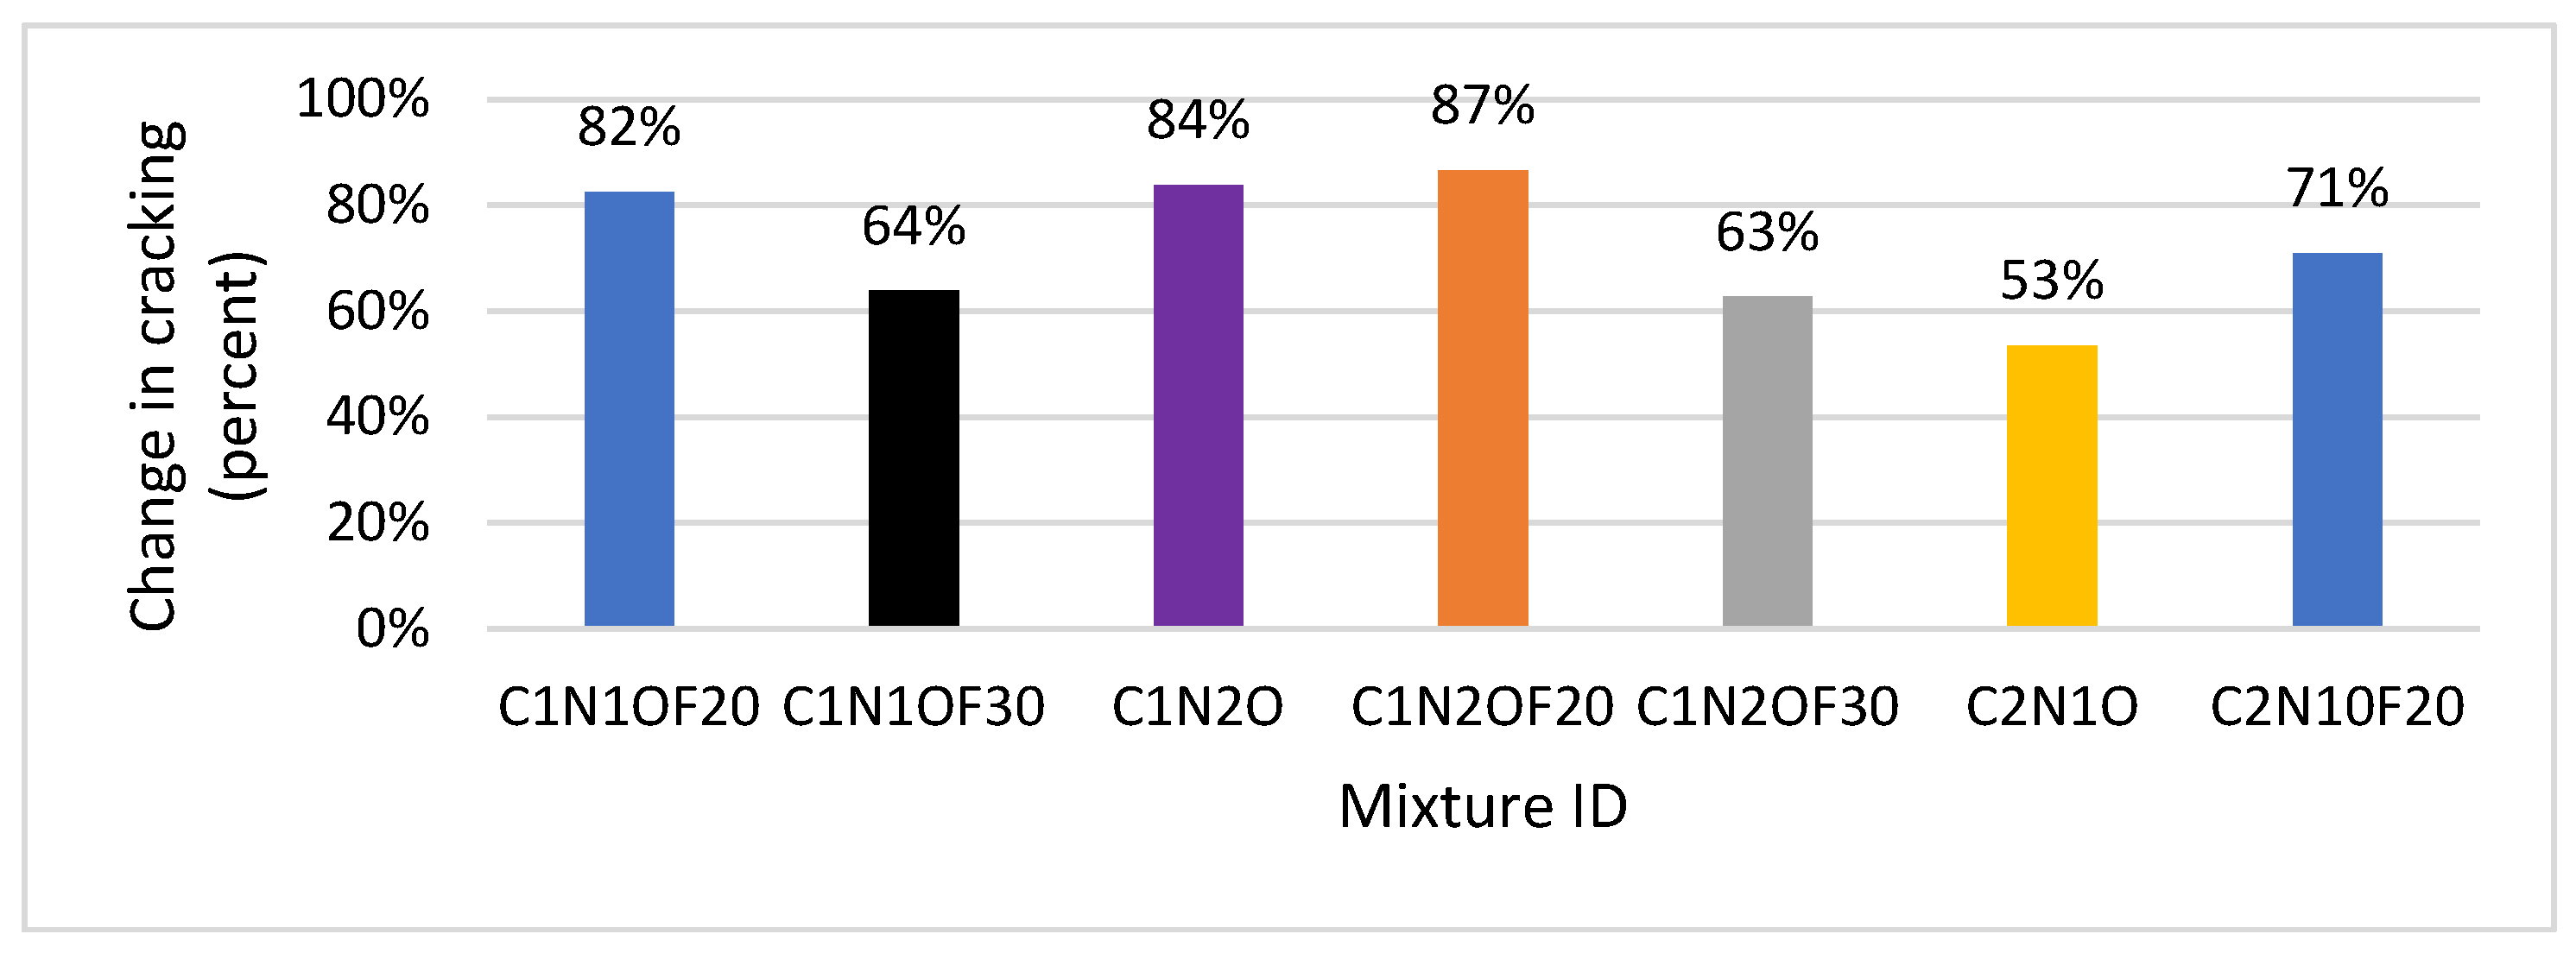
4.3. Cracking Indicator Analysis

The cracking indicator analysis between levels one, two, and three showed that there was a significant difference in the results. The comparative analysis is shown in Figure 16. The level one cracking indicator values were significantly lower than those of levels two and three. The level one indicator values were the most precise values based on the highest number of laboratory test results used for the level one simulation. The level two and level three results for the cracking indicator were almost similar for most of the paving mixtures.
The percentage change between level one and the highest indicator values of level two or level three showed that there was a significant percentage change. The percentage change in the cracking indicator values is shown in Figure 17. The highest percentage change occurred in the C1N2OF20 mixture, with a percentage change of 87 percent. The lowest percentage change in the cracking indicator values was the C2N1O mixture at 53 percent.
The simulation results shown in Figure 16 and Figure 17 confirm that there was a very large difference between level one and the other input levels. Prior research has already shown that level one inputs are the most accurate, and these simulation results indicate that use of level two or level three inputs may result in overdesigned pavement systems. Thus, efforts should be considered to incorporate level one concrete material inputs in the design process if resources and time are available.
The level one inputs are the most accurate out of all three input levels, as supported by the findings from the literature and testing simulations. This is as expected, and the analysis of the simulation results supports the findings that there is a significant increase in the IRI, faulting, and cracking indicators as the concrete material inputs are changed from level one to level two/level three. As described above, this work helps to quantify the differences in the performance indicators, providing knowledge to those hoping to understand the potential value of level one inputs or aiming to justify investments for obtaining them. The IRI indicator showed a percentage increase in the performance indicator value up to 78 percent when the input level was changed from level one to level three. The faulting indicator showed a percentage change of up to 78 percent when changed from level one, and the cracking indicator showed a percentage change of up to 87 percent when changed from level one to level three. Using the most accurate input level – level one – significantly influences the performance indicator analysis and should be taken into consideration when designing JPCP systems.

5. Effects of the Input Levels on Design Slab Thickness of JPCPs

Concrete slab thickness is one of the most important parameters in JPCP design and also substantially contributes to the initial cost of the pavement’s construction. The concrete slab is the strongest structural layer in the JPCP system, and it supports the major portion of stresses, strains, and deflections occurring due to traffic and temperature loading. Variations in concrete slab thickness impact the lifetime performance of JPCP systems. The adjustment of the level three slab thickness parameter to match the level one cracking performance indicator demonstrated a difference in the level one and level three design slab thicknesses.
The performance indicator results for the C1N1OF20, C1N1OF30, C1N2O, C1N2OF20, C1N2OF30, C2N1O, and C2N1OF20 mixtures were compiled for the level one and level three results at the baseline model of an 8-inch PCC slab thickness. The only performance indicator used was the cracking performance indicator. The performance indicator results for 8 inches are shown in Table 5. Simulations were performed through PMED software, adjusting the slab thickness at the level three input design for each individual mixture. The slab thickness was changed during the simulations to match the level three performance indicators to the level one indicators. The performance indicators at the level three design level were not an exact match to the level one performance indicators, but all the indicators fell within a reasonable range of equivalency. Each individual mixture reacted differently to the change in the level three PCC thickness.

Slab Thickness Results

Changes in the PCC slab thickness in the JPCP system within the level three framework to match the level one cracking indicator results are shown in Table 6. Each mixture produced unique performance indicator results, causing each mixture to result in a different slab thickness when the level three cracking indicator matched the level one cracking indicator. The change in slab thickness is shown in Figure 18. The highest change is shown as a 2-inch difference in the concrete slab thickness between the baseline model of 8 inches simulated with the level one inputs and the new adjusted slab thickness for the level three input simulations. The percentage change in the PCC thickness values between the level one and level three design is shown in Figure 19, and it is evident that there was a significant change in concrete slab thickness, with a 25 percent change in the pavements designed using three mixtures, a 19 percent change in the pavements designed using two mixtures, and a 13 percent change in the pavements designed using the remaining two mixtures. These results show a significant increase in the recommended PCC thickness between the two design/analysis approaches and represent a major cost increase (and increase in material use) for the level three input approach.

6. Performance Indicator Results

6.1. Comparison of JPCP Cracking with the Level Three Baseline Models and Readjusted Level Three Models

The performance indicator results also significantly changed through the readjustment of the level three slab thicknesses. The comparison of the original baseline model for the level three inputs to the newly adjusted level three inputs is shown in Figure 20. There was a significant change in the cracking indicator results when the level three PCC slab thickness was changed to reflect the level one cracking indicator results. In Figure 21, the percentage change in the cracking indicator values is shown. The percentage change ranged from 84.73 percent to 51.45 percent. It is evident that with the increase in slab thickness, the cracking performance indicator significantly decreased.

6.2. Comparison of JPCP Cracking with the Level One Baseline Models and Readjusted Level Three Models

The comparison of the JPCP cracking indicator between the level one baseline models and the readjusted level three models was conducted, as shown in Figure 22. All the simulations for the level one baseline models had a constant concrete slab thickness of 8 inches. The slab thickness for each individual mixture varied for the readjusted level three simulations, and the details are shown in Abbreviations section. There was still some variation in the cracking performance indicator results between the level one and readjusted level three values even after slab thickness adjustments were conducted. However, the difference in the cracking indicator values was very small, and these scenarios could be considered equivalent for comparative and analytical purposes.

7. Conclusions

As expected, level one material inputs provide the most accurate simulation results out of all three input levels, and there is a significant increase in the IRI, faulting, and cracking indicators as the concrete material inputs are changed from level one to level two/level three. The IRI indicator showed a percentage increase in performance indicator value up to 78 percent when the input level was changed from level one to level three. The faulting indicator showed a percentage change of up to 78 percent when changed from level one, and the cracking indicator showed a percentage change of up to 87 percent when changed from level one to level. Using the most accurate input level – level one – significantly influences the performance indicator analysis and should be taken into consideration when designing JPCP systems.
This should result in the design of pavements that provide the sustainability benefits of a lower initial cost, lower environmental impact (due to less material use), and more predictable service lives and maintenance/rehabilitation activities.
The increase in PCC slab thickness for the readjusted level three simulations resulted in improved JPCP performance within the transverse cracking indicator. Increasing the slab thickness caused the level three cracking indicator to align with the level one (baseline) cracking indicator. Each paving mixture behaved differently within the framework of readjusted level three models because of their specific mechanical and thermal properties. The overall difference in PCC slab thickness between the level one and level three designs was from 1 to 2 inches. This represents a significant material and monetary cost difference, with the level one thickness being more optimal for a variety of economic and sustainability reasons.
It is evident from this analysis that using level three inputs for JPCP design will result in a thicker concrete slab, and using level one inputs will produce a more accurate and economical JPCP design. Future research into the life cycle cost differences between pavements designed with level one inputs versus level three inputs would provide a more holistic perspective of the benefits of investing in level one inputs for the design/analysis of a pavement project. Case studies on the service life performance of pavements designed using level one inputs compared to those designed using level two or level three inputs would provide additional insight into both the accuracy of the local pavement-ME calibration as well as provide additional data to support project-specific inputs and the local calibration of the models in the software. Although this work was performed using the materials and characteristics local to one location in the United States, both the approach and the findings could be useful for pavement designers internationally.

Author Contributions

Conceptualization, G.S. and M.D.M.; methodology, G.S. and M.D.M.; software, M.D.M.; validation, G.S. and M.D.M.; formal analysis, G.S., M.D.M., T.L.C., C.S. and B.Q.T.; investigation, G.S., M.D.M., T.L.C., C.S. and B.Q.T.; resources, G.S., T.L.C. and B.Q.T.; data curation, M.D.M.; writing—original draft preparation, G.S. and M.D.M.; writing—review and editing, G.S., M.D.M., T.L.C., C.S. and B.Q.T.; supervision, G.S., T.L.C. and B.Q.T.; project administration, G.S., T.L.C. and B.Q.T.; funding acquisition, G.S., T.L.C. and B.Q.T. All authors have read and agreed to the published version of the manuscript.

Funding

This research was funded by North Carolina Department of Transportation under grant number RP 2022-07.

Data Availability Statement

The data will be provided upon request.

Acknowledgments

The contents of this paper reflect the views of the authors and not necessarily the views of the NCDOT. The authors are responsible for the accuracy of the data presented herein. Additionally, this paper does not constitute a standard, specification, or regulation, and does not necessarily reflect the official policies of NCDOT. The authors would like to thank NCDOT personnel Clark Morrison, Andrew Wargo, Shihai Zhang, Mustan Kadibhai, and the rest of the project steering and implementation committee for their support. The authors would like to express many thanks to the entities that donated cement, aggregates, and admixtures to support this research project.

Conflicts of Interest

The authors declare no conflict of interest.

Abbreviations

Symbol/AbbreviationDescription
AADTAnnual Average Daily Traffic
AASHTOAmerican Association of Highway and Transportation Officials
AASHTOWareSoftware that follows AASHTO standards
CTECoefficient of Thermal Expansion
EMElastic Modulus
FDOTFlorida Department of Transportation
in.Inch
IRIInternational Roughness Index
JPCPJointed Plain Concrete Pavement
JTG D40-2002Specifications of Highway Cement and Concrete Pavement Design in China
KpaKilopascal
LTPPLong-Term Pavement Performance
M-EMechanistic-Empirical
MEPDGMechanistic-Empirical Pavement Design Guide
mi.Mile
Mix IDMixture Identification
MORModulus of Rupture
MRIMean Roughness Index
NCDOT North Carolina Department of Transportation
NCHRPNational Cooperative Highway Research Program
NCHRP Project 1-37AThe project that produced a guide for M-E design and analysis
PaPascal
Pavement-MESimulation Software used in this study that has AASHTOWare
PCCPortland Cement Concrete
pcyPounds per Cubic Yard
psiPounds per Square Inch
SCDOTSouth Carolina Department of Transportation

References

  1. AASHTO. Guide for the Design of Pavement Structures; AASHTO: Washington, WA, USA, 1993. [Google Scholar]
  2. AASHTO. Mechanistic-Empirical Pavement Design Guide: A Manual of Practice; AASHTO: Washington, WA, USA, 2008. [Google Scholar]
  3. AASHTO. Guide for the Local Calibration of the Mechanistic-Empirical Pavement Design Guide; AASHTO: Washington, WA, USA, 2010. [Google Scholar]
  4. AASHTO. Mechanistic-Empirical Pavement Design Guide: A Manual of Practice, 2nd ed.; AASHTO: Washington, WA, USA, 2015. [Google Scholar]
  5. AASHTO. Mechanistic-Empirical Pavement Design Guide: A Manual of Practice, 3rd ed.; AASHTO: Washington, WA, USA, 2021. [Google Scholar]
  6. Li, Q.; Wang KC, P.; Qiu, Y. Comparative Study of Jointed Plain Concrete Pavement (JPCP) Design Methodologies in China and United States. In Proceedings of the International Conference on Transportation Engineering, Chengdu, China, 22–24 July 2007. [Google Scholar]
  7. Darter, M.I.; Titus-Glover, L.; Wolf, D.J. Development of a Traffic Data Input System in Arizona for the MEPDG; FHWA-AZ-13-672; Federal Highway Administration: Washington, WA, USA, 2013.
  8. Stone, J.R.; Kim, Y.R.; List, G.F.; Rasdorf, W.; Sayyady, F.; Jadoun, F.; Ramachandran, A.N. Development of Traffic Data Input Resources for the Mechanistic Empirical Pavement Design Process; FHWA/NC/2008-11; Department of Transportation: Raleigh, NC, USA, 2011.
  9. Cavalline, T.L.; Tempest, B.Q.; Blanchard, E.H.; Medlin, C.D.; Chimmula, R.R. Improved Data for Mechanistic-Empirical Design for Concrete Pavements; Final Report, Project FHWA/NC/2015-03; North Carolina Department of Transportation: Raleigh, NC, USA, 2018.
  10. Cavalline, T.L.; Tempest, B.Q.; Blanchard, E.; Medlin, C.; Chimmula, R.; Morrison, C. Impact of Local Calibration Using Sustainable Materials for Rigid Pavement Analysis and Design. ASCE J. Transp. Part B Pavements 2018, 144, 04018044. [Google Scholar] [CrossRef]
  11. Múčka, P. International roughness index specifications around the world. Road Mater. Pavement Des. 2016, 18, 929–965. [Google Scholar] [CrossRef]
  12. El-Saad, A.M.N.A. International Roughness Index as a Criterion in Design of Rigid Pavement. Ph.D. Thesis, Mansoura University, El-Mansoura, Egypt, 2015. [Google Scholar]
  13. Agurla, M.; Lin, S. Long-term pavement performance automated faulting measurement. In Proceedings of the 9th International Conference on Managing Pavement Assets, Washington, WA, USA, 18–21 May 2015. [Google Scholar]
  14. Jung, J.S.; Owusu-Antwi, E.B. Design Factors That Affect Joint Faulting for Jointed Plain Concrete Pavements. Int. J. Highw. Eng. 2004, 67–73. [Google Scholar]
  15. Saboori, A.; Lea, J.; Harvey, J.; Lea, J.; Mateos, A.; Wu, R. Pavement ME JPCP Transverse Cracking Model Calibration and Design Catalog Framework (Version 2.5.5); University of California Pavement Research Center: Davis, CA, USA, 2021. [Google Scholar]
  16. Saboori, A.; Harvey, J.; Lea, J.; Wu, R.; Mateos, A. Pavement ME Sensitivity Analysis (Version 2.5.3); University of California Pavement Research Center: Davis, CA, USA, 2021. [Google Scholar] [CrossRef]
  17. Li, R.; Cramer, S. AASHTO Mechanistic–Empirical Pavement Design Guide Parametric Study; University of Wisconsin–Madison: Madison, WI, USA, 2012. [Google Scholar]
  18. Hall, K.D.; Beam, S.; Lee, M. AASHTO 2002 Pavement Design Guide Design Input Evaluation Study; Final Report, TRC-0302; State Highway and Transportation Department: Washington, WA, USA, 2006.
  19. Hasan, M.M.; Rahman, A.; Tarefder, R.A. Investigation of Accuracy of Pavement Mechanistic Empirical Prediction Performance by Incorporating Level 1 Inputs. J. Traffic Transp. Eng. 2020, 7, 259–268. [Google Scholar] [CrossRef]
  20. Mbakisya, O.; Kelvin, M.; Sampson, U.; Joseph, O. Evaluation of AASHTO Mechanistic Empirical Design Guide Inputs to the Performance of Tennessee Pavements. In Proceedings of the International Road Federation World Meeting & Exhibition, Orlando, FL, USA, 6 October 2022. [Google Scholar]
  21. Hossain, M.; Khanum, T.; Tanesi, J.; Schieber, G.; Montney, R. The PCC Coefficient of Thermal Expansion Input for the Mechanistic-Empirical Pavement Design Guide. In Proceedings of the 85th Annual Meeting of the Transportation Research Board, National Research Council, Washington, WA, USA, 22–26 January 2006. [Google Scholar]
  22. Kim, S.; Ceylan, H.; Ma, D.; Gopalakrishnan, K. Calibration of pavement ME design and mechanistic-empirical pavement design guide performance prediction models for Iowa pavement systems. J. Transp. Eng. 2014, 140, 04014052. [Google Scholar] [CrossRef]
  23. Ping, W.V.; Kampmann, R. Engineering Properties of Florida Concrete Mixes for Implementing the AASHTO Recommended Mechanistic-Empirical Rigid Pavement Design Guide; Florida A & M University-Florida State University College of Engineering: Tallahassee, FL, USA, 2008. [Google Scholar]
  24. Tanesi, J.; Meininger, R. Coefficient of Thermal Expansion—Its role in concrete pavement performance. In Proceedings of the International Workshop on Best Practices for Concrete Pavements, Sao Paulo, Brazil, 21–23 October 2007. [Google Scholar]
  25. Ceylan, H.; Kim, S.; Gopalakrishnan, K.; Schwartz, C.W.; Li, R. Sensitivity quantification of jointed plain concrete pavement mechanistic-empirical performance predictions. Constr. Build. Mater. 2013, 43, 545–556. [Google Scholar] [CrossRef]
  26. Ceylan, H.; Gopalakrishnan, K.; Kim, S.; Schwartz, C.W.; Li, R. Global sensitivity analysis of jointed plain concrete pavement mechanistic–empirical performance predictions. Transp. Res. Rec. J. Transp. Res. Board 2013, 2367, 113–122. [Google Scholar] [CrossRef]
  27. Gassman, S.L.; Rahman, M.M. Calibration of the AASHTO Pavement Design Guide to South Carolina Conditions—Phase I: Final Report; Federal Highway Administration: Washington, WA, USA, 2016.
  28. Rao, C. Guidelines for PCC Inputs to AASHTOWare Pavement ME; FHWA/MS-DOT-RD-14-260; Rao Research and Consulting: Champaign, IL, USA, 2014. [Google Scholar]
  29. Summers, C. Investigating Time Sensitive Thermal and Mechanical Inputs for Rigid Pavements. Master’s Thesis, University of North Carolina, Charlotte, NC, USA, 2023. [Google Scholar]
  30. Sabih, G.; Cavalline, T.L.; Tempest, B.Q. Investigating Thermal and Mechanical Inputs for Rigid Pavement Design in North Carolina; Final Report, Project FHWA/NC/2022-07; North Carolina Department of Transportation: Raleigh, NC, USA, 2024; under preparation.
Figure 1. Mixture Preparation.
Constrmater 04 00014 g001
Figure 2. Laboratory testing of compressive strength and moduli of elasticity.
Constrmater 04 00014 g002
Figure 3. Level one IRI performance indicator results. Note 1 inch = 2.54 cm and 1 mile = 1.60934 km.
Constrmater 04 00014 g003
Figure 4. Level one faulting indicator results. Note 1 inch = 2.54 cm.
Constrmater 04 00014 g004
Figure 5. Level one cracking indicator results.
Constrmater 04 00014 g005
Figure 6. Level two IRI indicator results. Note 1 inch = 2.54 cm and 1 mile = 1.60934 km.
Constrmater 04 00014 g006
Figure 7. Level two faulting indicator results. Note 1 inch = 2.54 cm.
Constrmater 04 00014 g007
Figure 8. Level two cracking indicator results.
Constrmater 04 00014 g008
Figure 9. Level three IRI indicator results. Note 1 inch = 2.54 cm and 1 mile = 1.60934 km.
Constrmater 04 00014 g009
Figure 10. Level three faulting indicator results. Note 1 inch = 2.54 cm.
Constrmater 04 00014 g010
Figure 11. Level three cracking indicator results.
Constrmater 04 00014 g011
Figure 12. Level one, level three, and level three IRI indicator comparison. Note 1 inch = 2.54 cm and 1 mile = 1.60934 km.
Constrmater 04 00014 g012
Figure 13. Percentage change in the IRIs between level one and level three.
Constrmater 04 00014 g013
Figure 14. Level one, level two, and level three faulting indicator comparison. Note 1 inch = 2.54 cm.
Constrmater 04 00014 g014
Figure 15. Percentage change in faulting between level one and level three.
Constrmater 04 00014 g015
Figure 16. Level one, level two, and level three cracking indicator comparison.
Constrmater 04 00014 g016
Figure 17. Percentage change in cracking between level one and level three.
Constrmater 04 00014 g017
Figure 18. Comparison of level one and level three design slab thickness. Note 1 inch = 2.54 cm.
Constrmater 04 00014 g018
Figure 19. Percentage change in slab thickness between the level one and level three simulations.
Constrmater 04 00014 g019
Figure 20. Comparison of the level three baseline models and adjusted level three models.
Constrmater 04 00014 g020
Figure 21. Percentage change in the cracking indicator between the level three baseline model and adjusted level three model.
Constrmater 04 00014 g021
Figure 22. Level one baseline model vs. adjusted level three model.
Constrmater 04 00014 g022
Table 1. Concrete mixture proportions.
Mixture IDMixture Proportions, kg/m3 (pcy)
CementFly AshCoarse AggregateFine AggregateWater
C1N1OF20271.9
(458.4)
67.9
(114.6)
1172.4
(1976.2)
730.6
(1231.5)
142.3
(240)
C1N1OF30237.9
(401.1)
101.9
(171.9)
1172.4
(1976.2)
720.1
(1213.8)
142.3
(240)
C1N2O339.9
(573.0)
0
(0)
1172.4
(1976.2)
744.3
(1254.6)
142.3
(240)
C1N2OF20271.9
(458.4)
67.9
(114.6)
1172.4
(1976.2)
723.6
(1219.7)
142.3
(240)
C1N2OF30237.9
(401.1)
101.9
(171.9)
1172.4
(1976.2)
713.2
(1202.3)
142.3
(240)
C2N1O339.9
(573.0)
0
(0)
1059.5
(1786.0)
751.5
(1266.7)
142.3
(240)
Note: 1 pound = 0.453 kg and 1 yard = 0.9144 m.
Table 2. CTE and compressive strength test results.
Compressive Strength, (kPa (psi))
Mixture IDCTE @ 28 Days
(cm/cm)/°C ((in./in.)/°F)
7 Days14 Days28 Days90 Days
C1N1OF209.77 × 10−6
(5.43 × 10⁻⁶)
19,201
(2785)
22,311
(3236)
29,668
(4303)
38,996
(5656)
C1N1OF309.59 × 10−6
(5.33 × 10⁻⁶)
12,789
(1855)
14,568
(2113)
21,897
(3176)
29,916
(4339)
C1N2O9.65 × 10−6
(5.36 × 10⁻⁶)
27,496
(3988)
29,013
(4208)
34,825
(5051)
41,602
(6034)
C1N2OF209.36 × 10−6
(5.20 × 10⁻⁶)
19,953
(2894)
17,023
(3469)
30,509
(4425)
36,397
(5279)
C1N2OF309.29 × 10−6
(5.16 × 10⁻⁶)
11,541
(1674)
17,347
(2516)
24,890
(3610)
30,612
(4440)
C2N1O9.41 × 10−6
(5.23 × 10⁻⁶)
28,861
(4186)
31,619
(4586)
40,189
(5829)
43,126
(6255)
C2N1OF209.22 × 10−6
(5.12 x 10⁻⁶)
17,354
(2517)
20,484
(2971)
30,068
(4361)
31,674
(4594)
Table 3. Elastic modulus and modulus of the rupture test results.
Mix ID7 Day EM
(Pa (psi))
7 Day MOR
(kPa (psi))
14 Day EM (Pa (psi))14 Day
MOR
(kPa (psi))
28 Day EM (Pa (psi))28 Day MOR
(kPa (psi))
90 Day EM (Pa (psi))90 Day MOR
(kPa (psi))
C1N1OF201.44 × 1010
(2.10 × 10⁶)
3619
(525)
1.63 × 10¹⁰
(2.37 × 10⁶)
3674
(533)
1.87 × 10¹⁰
(2.71 × 10⁶)
4240
(615)
2.13 × 10¹⁰
(3.09 × 10⁶)
4550
(660)
C1N1OF301.39 × 1010
(2.02 × 10⁶)
3040
(441)
1.43 × 10¹⁰
(2.08 × 10⁶)
3144
(456)
1.69 × 10¹⁰
(2.45 × 10⁶)
3792
(550)
1.83 × 10¹⁰
(2.65 × 10⁶)
4081
(592)
C1N2O1.71 × 1010
(2.49 × 10⁶)
4033
(585)
1.73 × 10¹⁰
(2.51 × 10⁶)
4095
(594)
1.88 × 10¹⁰
(2.72 × 10⁶)
4640
(673)
2.03 × 10¹⁰
(2.94 × 10⁶)
4674
(678)
C1N2OF201.64 × 1010
(2.39 × 10⁶)
3723
(540)
1.57 × 10¹⁰
(2.27 × 10⁶)
3743
(543)
1.84 × 10¹⁰
(2.67 × 10⁶)
4219
(612)
1.90 × 10¹⁰
(2.75 × 10⁶)
4426
(642)
C1N2OF301.58 × 1010
(2.30 × 10⁶)
3261
(473)
1.50 × 10¹⁰
(2.17 × 10⁶)
3502
(508)
1.72 × 10¹⁰
(2.49 × 10⁶)
3819
(554)
2.03 × 10¹⁰
(2.95 × 10⁶)
4123
(598)
C2N1O1.78 × 1010
(2.59 × 10⁶)
4178
(606)
1.69 × 10¹⁰
(2.45 × 10⁶)
4247
(616)
1.83 × 10¹⁰
(2.66 × 10⁶)
4640
(673)
1.90 × 10¹⁰
(2.76 × 10⁶)
4750
(689)
C2N1OF201.35 × 1010
(1.97 × 10⁶)
3495
(507)
1.45 × 10¹⁰
(2.11 × 10⁶)
3571
(518)
1.72 × 10¹⁰
(2.49 × 10⁶)
3867
(561)
1.75 × 10¹⁰
(2.54 × 10⁶)
4178
(606)
Table 4. JPCP default parameters used for the simulations.
Input ParameterConstant Value
Design life30 years
Performance CriteriaInitial IRI, m/km (in/mi)0.994 (63)
Terminal IRI, m/km (in/mi)2.91 (185)
Transverse cracking, percentage of cracked slabs10
Mean joint faulting, mm (in)3.05 (0.12)
Traffic Data for AnalysisTwo-way AADTT6000
Number of lanes in the design direction2
Average axle spacing: short, medium, long, m (ft)3.66, 4.57, 5.49
(12, 15, 18)
Percent of trucks: short, medium, long17, 22, 61
JPCP Design PropertiesJoint spacing, m (ft)4.57 (15)
Dowel diameter, mm (in)31.8 (1.25)
Dowel spacing, mm (in)305 (12)
Widened slabNot widened
Tied shouldersTied
Surface shortwave absorptivity0.85
Table 5. Level one and level three cracking indicator results for the baseline model.
Mixture IDLevel One (Percentage of Cracked Slabs)Level Three (Percentage of Cracked Slabs)
C1N1OF2017.51100
C1N1OF3036.13100
C1N2O5.3586.16
C1N2OF2013.3877.14
C1N2OF3037.29100
C2N1O4.6954.66
C2N1OF2029.11100
Table 6. Comparison of the cracking results for varying slab thicknesses.
Level 1 Cracking (Percent)Level 3 Cracking (Percent)
Mixture ID8 Inches10 Inches9.5 Inches9 Inches
Percent slabsC1N1OF2017.51-15.27-
C1N1OF3036.1335.65--
C1N2O5.354.8--
C1N2OF2013.38--12.97
C1N2OF3037.29-36.68-
C2N1O4.693.21--
C2N1OF2029.11--33.36
Note: 1 inch = 2.54 cm.
Disclaimer/Publisher’s Note: The statements, opinions and data contained in all publications are solely those of the individual author(s) and contributor(s) and not of MDPI and/or the editor(s). MDPI and/or the editor(s) disclaim responsibility for any injury to people or property resulting from any ideas, methods, instructions or products referred to in the content.

