Article

Investigating Ageing Effects on Bored Pile Shaft Resistance in Cohesionless Soil Through Field Testing

School of Engineering and Built Environment, University of Derby, Markeaton Street, Derby DE22 3AW, UK
*
Author to whom correspondence should be addressed.
Geotechnics 2025, 5(3), 59; https://doi.org/10.3390/geotechnics5030059
Submission received: 28 June 2025 / Revised: 11 August 2025 / Accepted: 19 August 2025 / Published: 1 September 2025
(This article belongs to the Special Issue Recent Advances in Soil–Structure Interaction)

Abstract

This study investigates the influence of time (ageing) on the uplift capacity of bored piles in cohesionless silty sand through a full-scale field testing programme. Four reinforced concrete piles, two shorter (16 m) and two longer (21 m), were installed and tested under axial tension at two different ageing intervals: 35 days and 165 days post-construction. The load-displacement behaviour, load transfer characteristics, and shaft friction mobilisation were monitored using load cells and embedded strain gauges. Results showed that while all piles exhibited similar ultimate capacities, the aged piles consistently demonstrated stiffer responses and earlier mobilisation of shaft resistance. Extrapolated estimates showed modest increases in estimated ultimate uplift capacity, ranging from 2% to 7%, with ageing. Strain gauge data also indicated more uniform load transfer in the aged piles, suggesting time-dependent improvements in pile-soil interface behaviour. The findings confirm that even in cohesionless silty sand, moderate ageing effects can enhance uplift performance, but the extent of improvement is small and variable. These findings provide a valuable reference for evaluating uplift design assumptions and interpreting field test behaviour in similar soil environments.

Graphical Abstract

1. Introduction

Pile foundations, essential for supporting high structures such as transmission towers, offshore platforms, and high-rise buildings, rely heavily on the shaft resistance developed along the soil-pile interface [1,2]. Research has demonstrated that following installation, the shaft resistance of piles can change over time. This phenomenon is called “pile ageing” [3]. With a growing emphasis on sustainable design [4,5,6], understanding the mechanisms and quantifying the effects of ageing offers opportunities to optimise pile performance while reducing embodied carbon through efficient design.
It is important to clarify that in geotechnical literature, the term ageing can carry different implications. In some contexts, it refers to the degradation of geomaterials (e.g., due to weathering or chemical alteration), which can lead to reduced engineering performance. However, in the context of pile foundations, particularly in sands and silts, ageing generally denotes beneficial changes, such as increases in shaft resistance with time following installation.
Pile ageing is well-supported by numerous studies demonstrating its occurrence across a wide range of pile types and soil conditions. Historically, ageing was initially observed in displacement piles in clay, where it was attributed to the dissipation of pore pressure and ensuing consolidation [7]. Subsequent research has further expanded our understanding of this phenomenon. Of particular interest is the effect of ageing observed in driven piles in sand, where significant increases in pile capacity have been documented. Chow et al. (1997) [3] documented long-term increases of up to 85% in the shaft capacity of open-ended steel piles driven into dense sands. These increases were attributed to stress relaxation and dilation processes over five years.
Building on these findings, Bullock et al. (2005) [8] presented data from field tests in Florida showing side shear capacity increases of 50% within 100 days and 70% over five years. The authors also proposed empirical correlations between shaft capacity and time after installation. Jardine et al. (2006) [9] reinforced these observations through detailed uplift load testing of steel tubular piles. They reported shaft resistance gains of up to 220% over 235 days, following a semi-logarithmic trend. Their work also showed that preloading or retesting piles could reduce the apparent gains from ageing.
Further insights were provided by Skov and Denver (1988) [10], who proposed a logarithmic relationship between time and bearing capacity based on static and dynamic tests of steel piles in mixed sands, with capacity doubling in the first 90 days. This was supported by Ng et al. (1988) [11], who used pressure cells in static tests of precast concrete piles driven in loose to medium-dense sands. They observed a 300% increase in radial stresses over 98 days, attributed to stress redistribution and constrained dilation around the pile shaft. Fellenius et al. (1989) [12] confirmed similar patterns in silty sand, reporting a 60% increase in shaft resistance over 132 days based on static and dynamic testing.
Gavin et al. (2013) [13] carried out uplift load tests on open-ended steel piles driven into dense sands and observed capacity increases of up to 185% within seven months. These increases were associated with the growth of radial effective stresses and restrained dilation during loading. Karlsrud et al. (2014) [14] provided a broad dataset of axial load tests across multiple sites with piles driven in sand and clay. In sands, shaft resistance increased by factors of 1.75 to 2.5 over periods of up to two years. In clays, the most pronounced effects were observed in low-plasticity, low-OCR soils, with gains of around 55% between 3 months and 2 years. Carroll et al. (2017) [15] examined small-diameter piles (48–60 mm) and found that corrosion and bonding of soil particles to the pile surface significantly affected ageing outcomes.
Buckley et al. (2018) [16] investigated piles driven into low- to medium-density chalk and observed a more than 500% increase in shaft resistance after 8 months. Most of this gain occurred in the first 100 days, driven by radial stress growth and reconsolidation effects. Carroll et al. (2020) [17] reported on a multi-site field campaign involving 51 tension tests on steel micro-piles. Ageing effects were observed for up to 696 days and were influenced by pile roughness, corrosion, and installation technique.
Igoe and Gavin (2021) [18] studied a steel pile driven into dense glacial fine sand. They found a 200% increase in shaft capacity over 116 days, attributing the gain to stress redistribution, particle interlocking, and the formation of a chemical crust at the soil–pile interface. Bittar and Lehane (2024) [19] reported that steel pipe piles developed a welded crust over time, enhancing shaft friction by 30% to 50% beyond standard design values. Their results supported the need to adjust shaft friction design parameters in sand, as current standards like ISO 19901-4 [20] may underestimate the long-term gains from ageing. Manthey et al. (2024) [21] investigated the time-dependent resistance of open-ended steel piles in sand. The study indicated that ageing has significantly enhanced the resistance to both tension and compression piles.
In theory, the mechanisms governing pile ageing involve several plausible contributing factors. These can be broadly categorised into changes within the surrounding soil and alterations at the pile-soil interface. The relative importance of each mechanism depends on factors such as soil conditions, pile material, stress conditions and the installation method. Understanding these processes is essential for evaluating the long-term performance of pile foundations. Figure 1 illustrates a summary of the factors influencing the ageing mechanisms.
During pile installation, particularly with driven piles, the surrounding soil undergoes significant compression and densification. This disturbed soil may gradually relax, leading to an increase in the radial stress acting against the pile shaft [3]. Additionally, both cohesive and cohesionless soils can exhibit secondary compression or creep, where continued deformation under constant load further enhances the shaft resistance over time.
The dynamic nature of the pile-soil interface plays a significant role in ageing. In some cases, the installation process can lead to the formation of a thin crust of cemented soil particles adhering to the pile surface. Corrosion processes have the potential to gradually increase the roughness of the pile surface [9]. Moreover, soil particles may reorganise against the pile shaft over time. All these changes at the interface can significantly increase friction, contributing to the pile’s enhanced shaft capacity.
The specific soil type heavily influences ageing mechanisms [14,22]. In cohesive soils, such as clays, the dissipation of excess pore water pressures generated during pile installation and the ensuing soil consolidation are primary drivers of ageing [7,23]. In addition, creep has been identified as a key mechanism contributing to long-term shaft resistance increases in clays, allowing for gradual deformation and stress redistribution under sustained load [14,23]. Ageing effects are generally more pronounced and develop faster in cohesionless soils like sand [19], where stress relaxation and particle rearrangement occur more readily [23,24]. In these soils, creep is associated with grain-scale mechanisms such as dilation and interlocking, which enhance radial confinement and interface friction over time, though typically to a lesser degree than in clays. Pile type (e.g., driven, bored, or jacked) and material (such as steel or concrete) influence ageing by determining the initial degree of soil disturbance. This, in turn, impacts the extent of soil relaxation and the changes at the pile-soil interface that occur over time [25,26].
The role of initial stress state and stress redistribution in pile–soil interaction has been emphasised in prior studies. Lehane et al. (1993) [27] demonstrated that anisotropic stress fields around piles significantly influence the mobilisation of shaft friction, particularly in sands. Randolph (2003) [28] similarly noted the importance of confining stress evolution in empirical and analytical approaches to pile design. More recently, Tra et al. (2025) [29] used numerical methods to show that stress redistribution, even in layered soft soil profiles, contributes to improved load transfer efficiency over time. These findings reinforce the idea that time-dependent confinement changes are central to ageing effects, especially in the absence of excess pore pressure dissipation.
Despite this body of work, very few studies have investigated the ageing behaviour of bored piles in cohesionless soils. In particular, field data on skin friction from uplift tests for bored piles are scarce [30]. Although bored pile installation causes less soil disturbance than driven piles, the processes of boring and concreting still compress and rearrange the surrounding soil. After excavation, material removal can lead to soil relaxation and slight loosening. Over time, the disturbed soil reconsolidates around the pile. This process enhances friction at the soil-pile interface and increases shaft capacity as the pile ages [23].
This knowledge gap is important in light of field observations made by the authors during transmission tower inspections. In several cases, towers showed signs of instability despite no visible damage to their bored pile foundations. These incidents raised concerns that time-dependent changes in shaft resistance may have affected performance.
This study investigates whether ageing contributes to uplift resistance in bored piles installed in cohesionless soil. Four full-scale bored concrete piles were tested in non-plastic silty sand. Two were tested 35 days after installation; the other two were tested after 165 days. The test group included two smaller piles designed for suspension towers and two larger piles used for heavy-angle towers. Strain gauges were embedded in the larger piles to monitor how axial loads were transferred along the shaft. The objectives are to quantify the extent to which ageing enhances shaft resistance in bored piles and to explore how these effects vary with displacement and load level. The findings provide data to inform pile design in cohesionless soils and assess any potential short- to medium-term benefits of ageing for uplift resistance.

2. Materials and Methods

The experimental approach was designed to evaluate the impact of ageing on the uplift resistance of bored piles in cohesionless soils. This was achieved through a series of uplift pile tests, a widely conducted method for assessing the shaft resistance and pull-out behaviour of piles [31,32,33]. These tests were performed as part of a live transmission line project in the eastern coastal region of the Kingdom of Saudi Arabia (KSA) between 2022 and 2025. The project, which involved the construction of over 300 transmission towers, provided a unique opportunity to study ageing in operational conditions.
Within the scope of this research, four piles (designated as A1, A2, B1, and B2) were constructed and tested at different ageing intervals. Piles A1 and A2 were short piles with the exact dimensions and configuration, intended for suspension towers. Piles B1 and B2 were longer piles of matching geometry, designed for heavy-angle towers that experience higher uplift forces. This arrangement allowed direct comparison between pile performance at two ageing intervals (35 and 165 days) while keeping pile geometry and load conditions consistent within each set.
While the testing duration in this study extends to 165 days, the focus is on early to medium-term ageing behaviour. This time frame captures the initial evolution of shaft resistance, which several studies have shown to be the most critical period for mobilisation of ageing effects in cohesionless soils [9,13,17,34].

2.1. Site Description and Ground Investigation

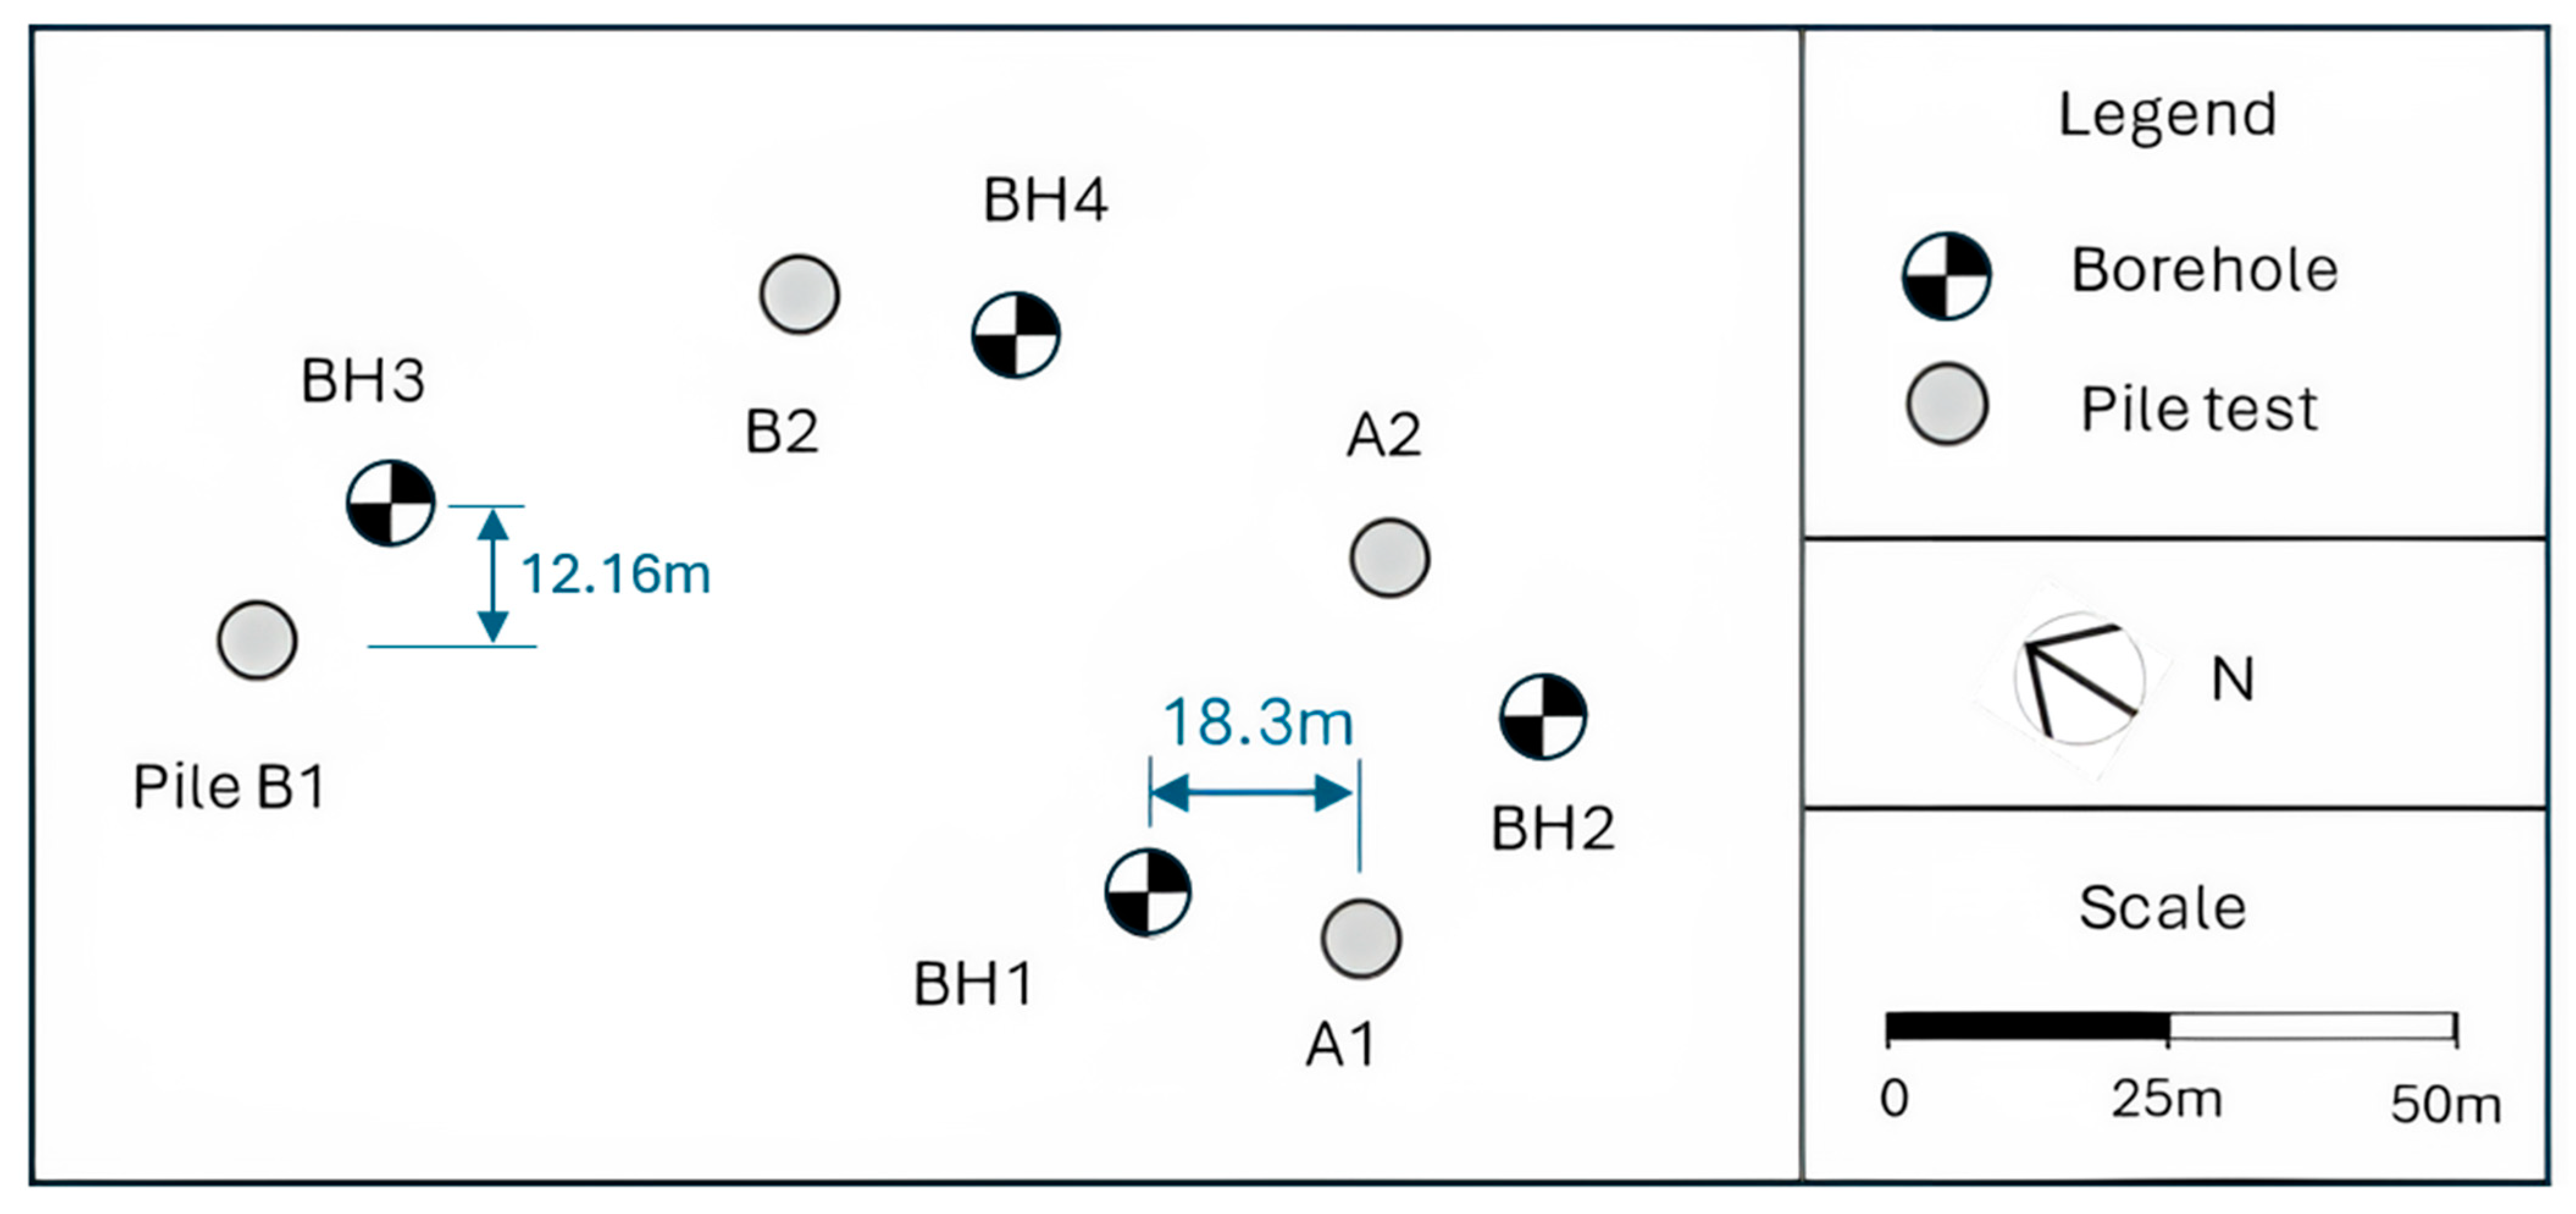
The site extends over 25,000 m2 on the outskirts of Dammam, eastern KSA. Ground investigation was planned and conducted ahead of the pile testing. The ground investigation and subsequent soil testing adhered to the standards outlined in ASTM-D2488 [35]. This included drilling four boreholes, each strategically positioned near the four piles. Figure 2 illustrates the site layout used for the geotechnical investigation, including pile test and borehole positions.
The boreholes were drilled to a maximum depth of 22 m, with Standard Penetration Tests (SPT) conducted to assess the soil properties. Soil samples were recovered from these boreholes for laboratory testing to determine the engineering properties of the soil. No geophysical methods were used in the ground investigation to detect voids or weak zones that may affect foundation stability [36], as the area was classified as low risk for such features based on regional geological mapping and prior investigations.
Table 1 summarises the detailed ground profile, including soil description and parameters at various depths below ground level (BGL). According to the sieve test, Atterberg limits and the Unified Soil Classification System (USCS), the soil was identified as non-plastic silty sand (SM). The sieve test results, shown in Figure 3, indicate that the soil is mainly sand mixed with an average of 18.7% silt and 10.6% fine gravel.
The ground investigation revealed that the test site is underlain by a profile of interbedded silty sand and fine sand. Stratigraphic logs from the boreholes confirm a consistent sequence across the site (Table 1), with no significant lateral variability. The upper layer (0–5.3 m) consists of loose silty sand, underlain by medium-dense to dense fine sand extending to depths of approximately 20 m.
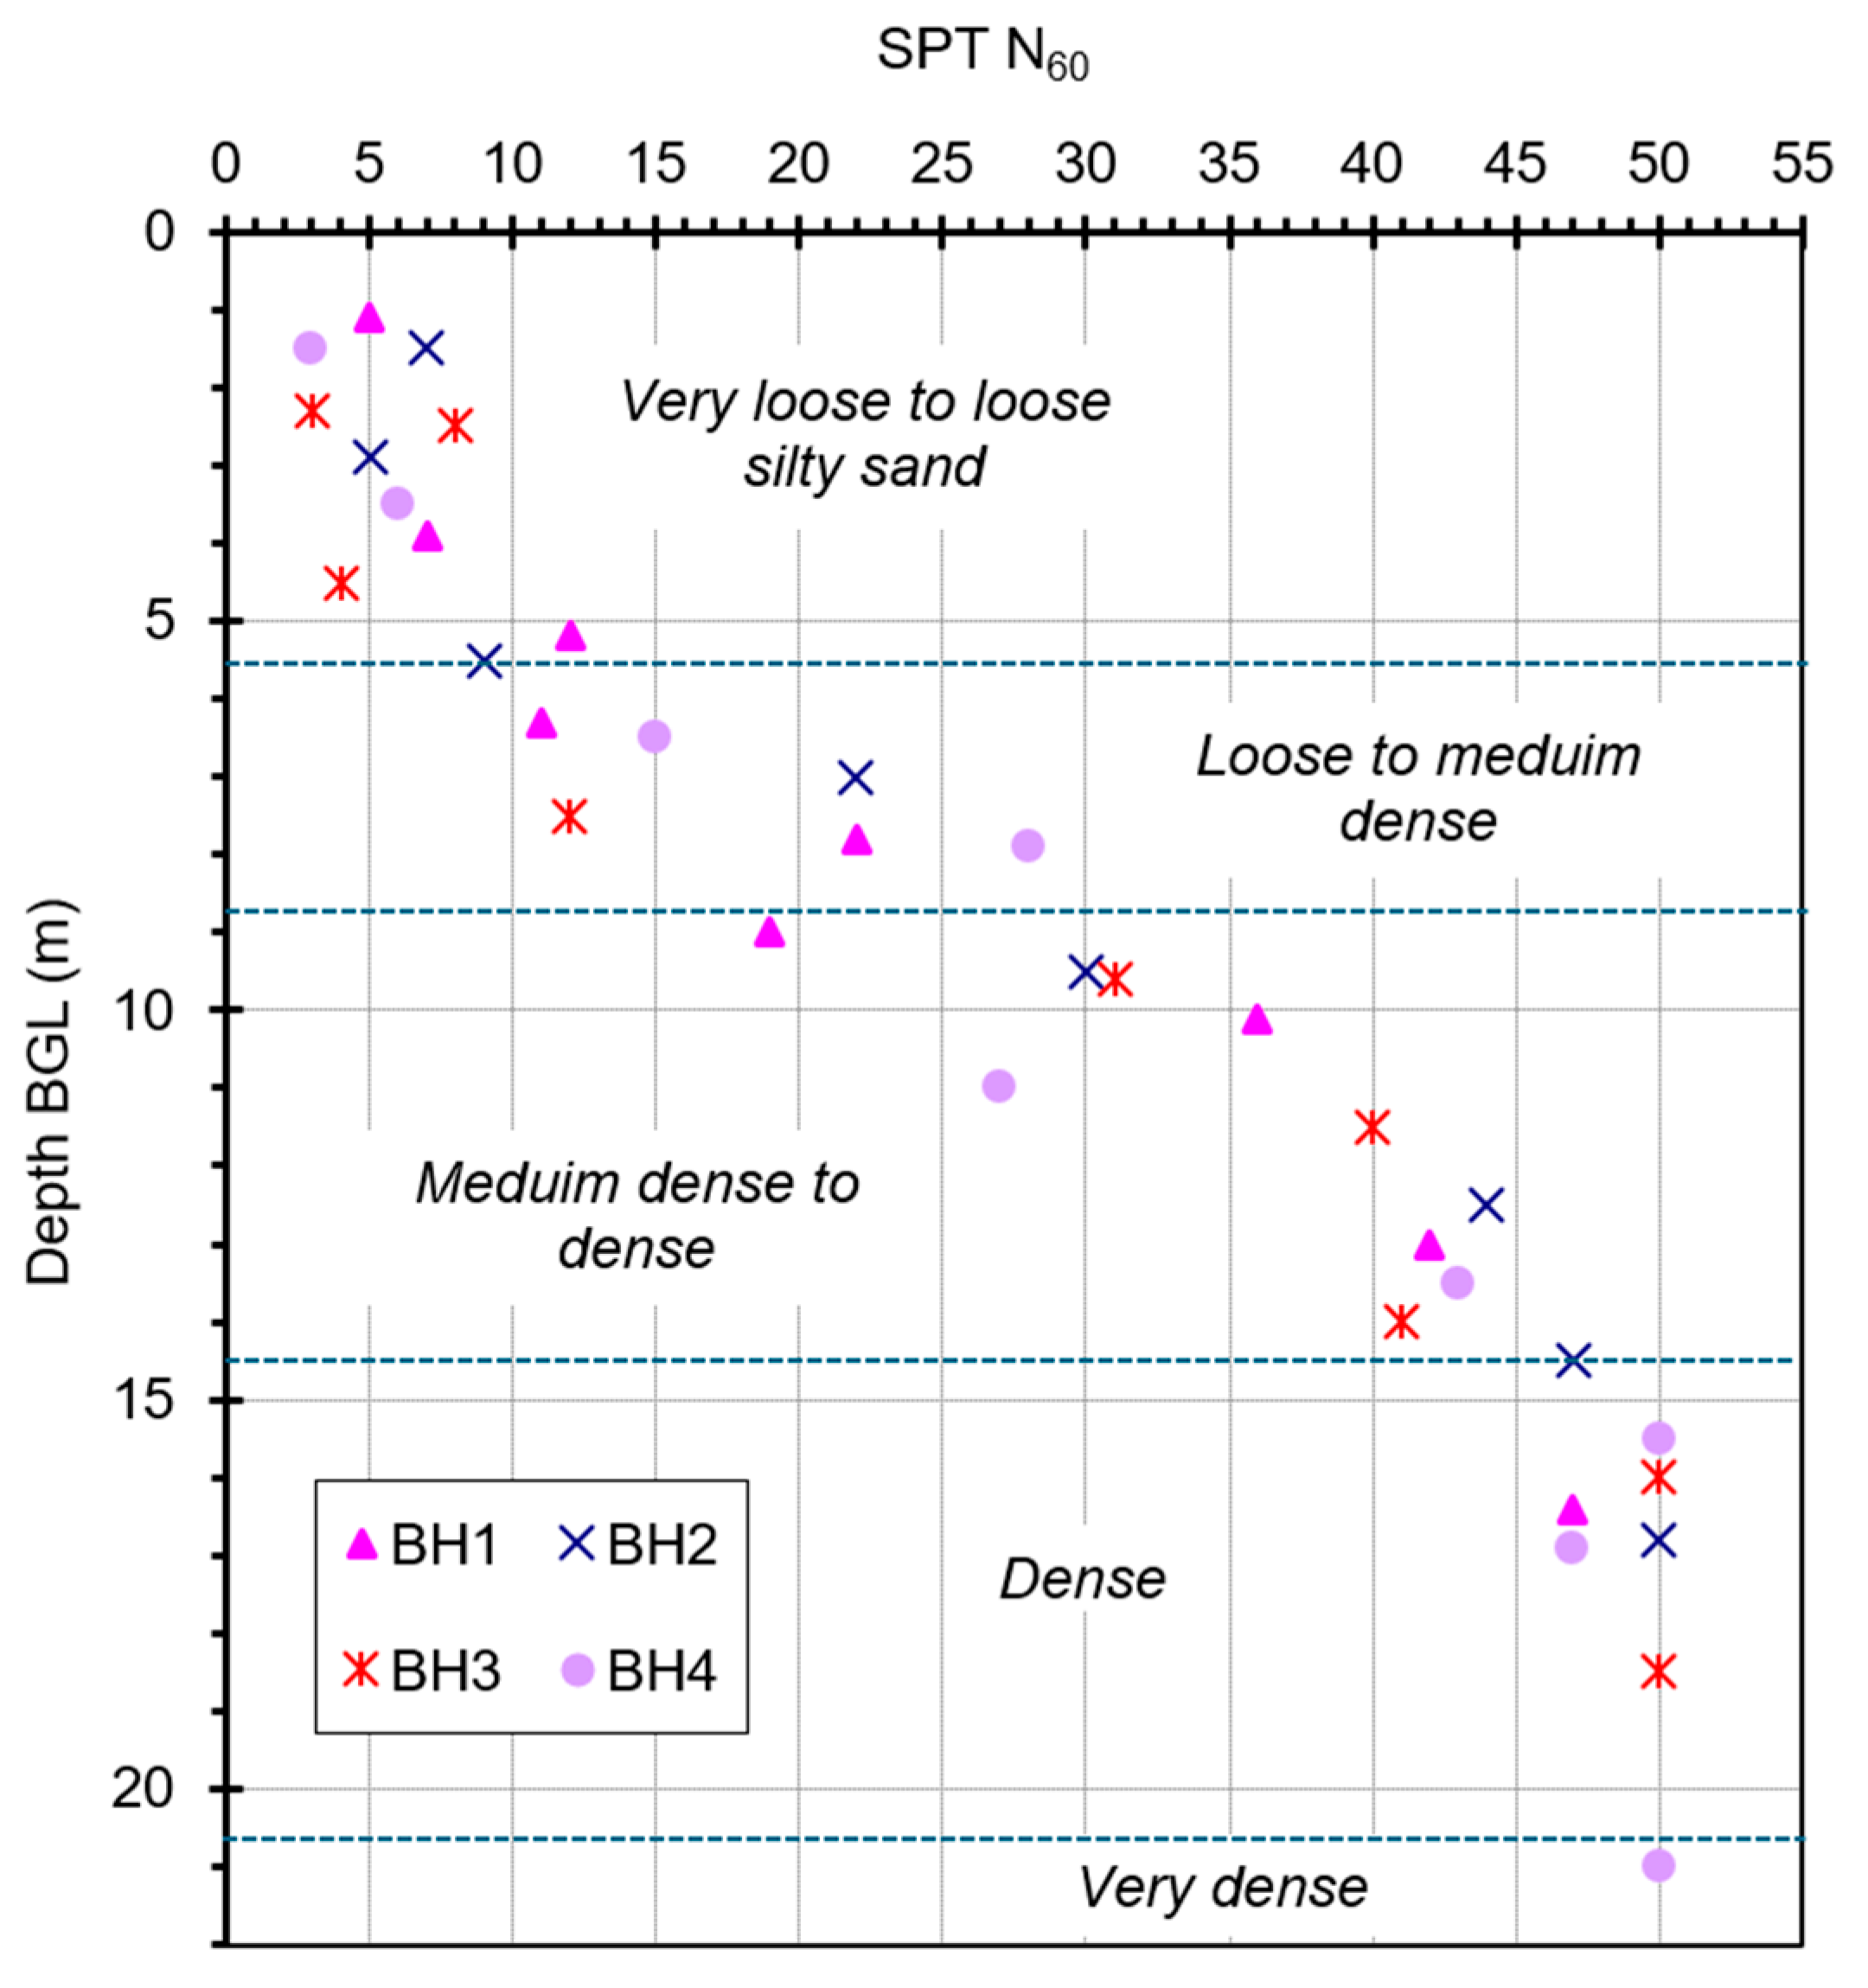
Figure 4 presents the SPT N60 values obtained from four boreholes (BH1 to BH4), plotted against depth (m BGL). The data illustrate the relative density and consistency of silty sand layers across the site. SPT N-values ranged from 3 to 8 in the upper 5 m, increased to 8–28 between 5.3 and 8.5 m, and exceeded 45 in the lower sand layer beyond 15 m. Groundwater was encountered at approximately 1.8–2.0 m below ground level during drilling and remained stable throughout testing.

2.2. Design and Scheduling of Uplift Tests

The four bored concrete piles (A1, A2, B1, B2) were constructed on-site and tested using uplift tests on two different dates to examine the effect of ageing on shaft resistance. A1 and B1 were tested 35 days after installation, and the others after 165 days. The 35-day interval ensured that the initial testing was conducted after the concrete had achieved its specified strength, allowing for a realistic assessment of the shaft resistance without the confounding effects of ongoing concrete curing. The 165-day period represented a longer-term interval to capture the continued development of shaft resistance. This timeframe aligns with observations in previous studies where notable ageing effects were reported within the first six months [8,38].
Piles A1 and A2 were smaller and intended for suspension towers, whereas Piles B1 and B2, instrumented with strain gauges, are larger and typically used for heavy-angle towers. Suspension towers experience lower uplift forces as they primarily support vertical loads. Their piles resist mainly axial forces, resulting in lower shaft resistance and uplift load intensity [39]. In contrast, heavy-angle towers bear vertical and horizontal loads, leading to higher uplift force intensity. A summary of the tested piles and their applied loads is provided in Table 2.
The cast-in-situ test piles had nominal diameters of 1.0 m (A1 and A2) and 1.8 m (B1 and B2), with lengths of 16 m and 21 m, respectively. Reinforcement cages were fabricated using longitudinal steel bars with a reinforcement ratio of approximately 1.2%, designed to resist axial uplift forces. Low-strain pile integrity testing (PIT) was carried out on all piles shortly after casting to confirm pile length and detect possible anomalies. The test results confirmed that the piles were constructed to the intended lengths, with no detectable signs of bulging, necking, or cross-sectional irregularities. Based on the PIT method used and the equipment resolution, the interpreted pile length was estimated to be accurate within ±0.3 m. No dynamic testing was conducted, as the study focused on static uplift response and time-dependent shaft behaviour.
In these field tests, the maximum applied uplift forces were 200% of the design load for each pile. The design loads were determined using the soil parameters in Table 1 and the pile design method for cohesionless soil proposed by O’Neil and Reese [40]. This method is further explained in [41]. It involves determining lateral earth pressure and effective overburden pressure at various depths, as well as the friction angle between the concrete pile and the soil. The method assumes optimal construction conditions, including specific concrete slumps and slurry use to prevent hole collapse.

2.3. Pile Construction, Instrumentation and Loading Procedures

2.3.1. Pile Construction

The bored piles were constructed using a full-length steel casing to maintain borehole stability during excavation and concreting. After excavation, the casing remained in place while concrete was poured, ensuring proper placement and compaction. The casing was removed immediately after casting, allowing the surrounding soil to begin reconsolidating against the concrete pile. This reconsolidation enhanced the pile-soil bond and contributed to the observed ageing effects.
The concrete was designed to achieve a compressive strength of 5500 psi (37.9 MPa) within 28 days, as specified in ACI 318-19 [42] for high-performance structural concrete. The mix included 8% micro silica by mass of cement, improving the concrete’s durability, resistance to chemical attack, and bond strength at the pile-soil interface. A slump of 200 mm ensured sufficient workability for proper placement and compaction under site conditions. Care was taken to avoid voids or imperfections during casting, ensuring uniform contact with the surrounding soil.
Concrete samples were extracted from the in-situ pours during construction and tested for compressive strength in accordance with ASTM C39 [43]. The elastic modulus, determined from companion cylinders using ASTM C469 [44], was 4,286,000 psi (approximately 29.5 GPa), based on tests conducted at 28 days, which is the standard reference age for concrete properties. Although the tested piles were loaded at 35 and 165 days after casting, the potential influence of concrete maturation beyond 28 days was considered negligible for the purposes of strain gauge interpretation. This is because the analysis focused on relative axial load distribution, and the strains induced under uplift loading remained within the linear elastic range. Nonetheless, future studies may benefit from explicitly incorporating time- and strain-dependent concrete properties to enhance accuracy in interpreting load transfer.

2.3.2. Experimental Setup and Pile Instrumentation

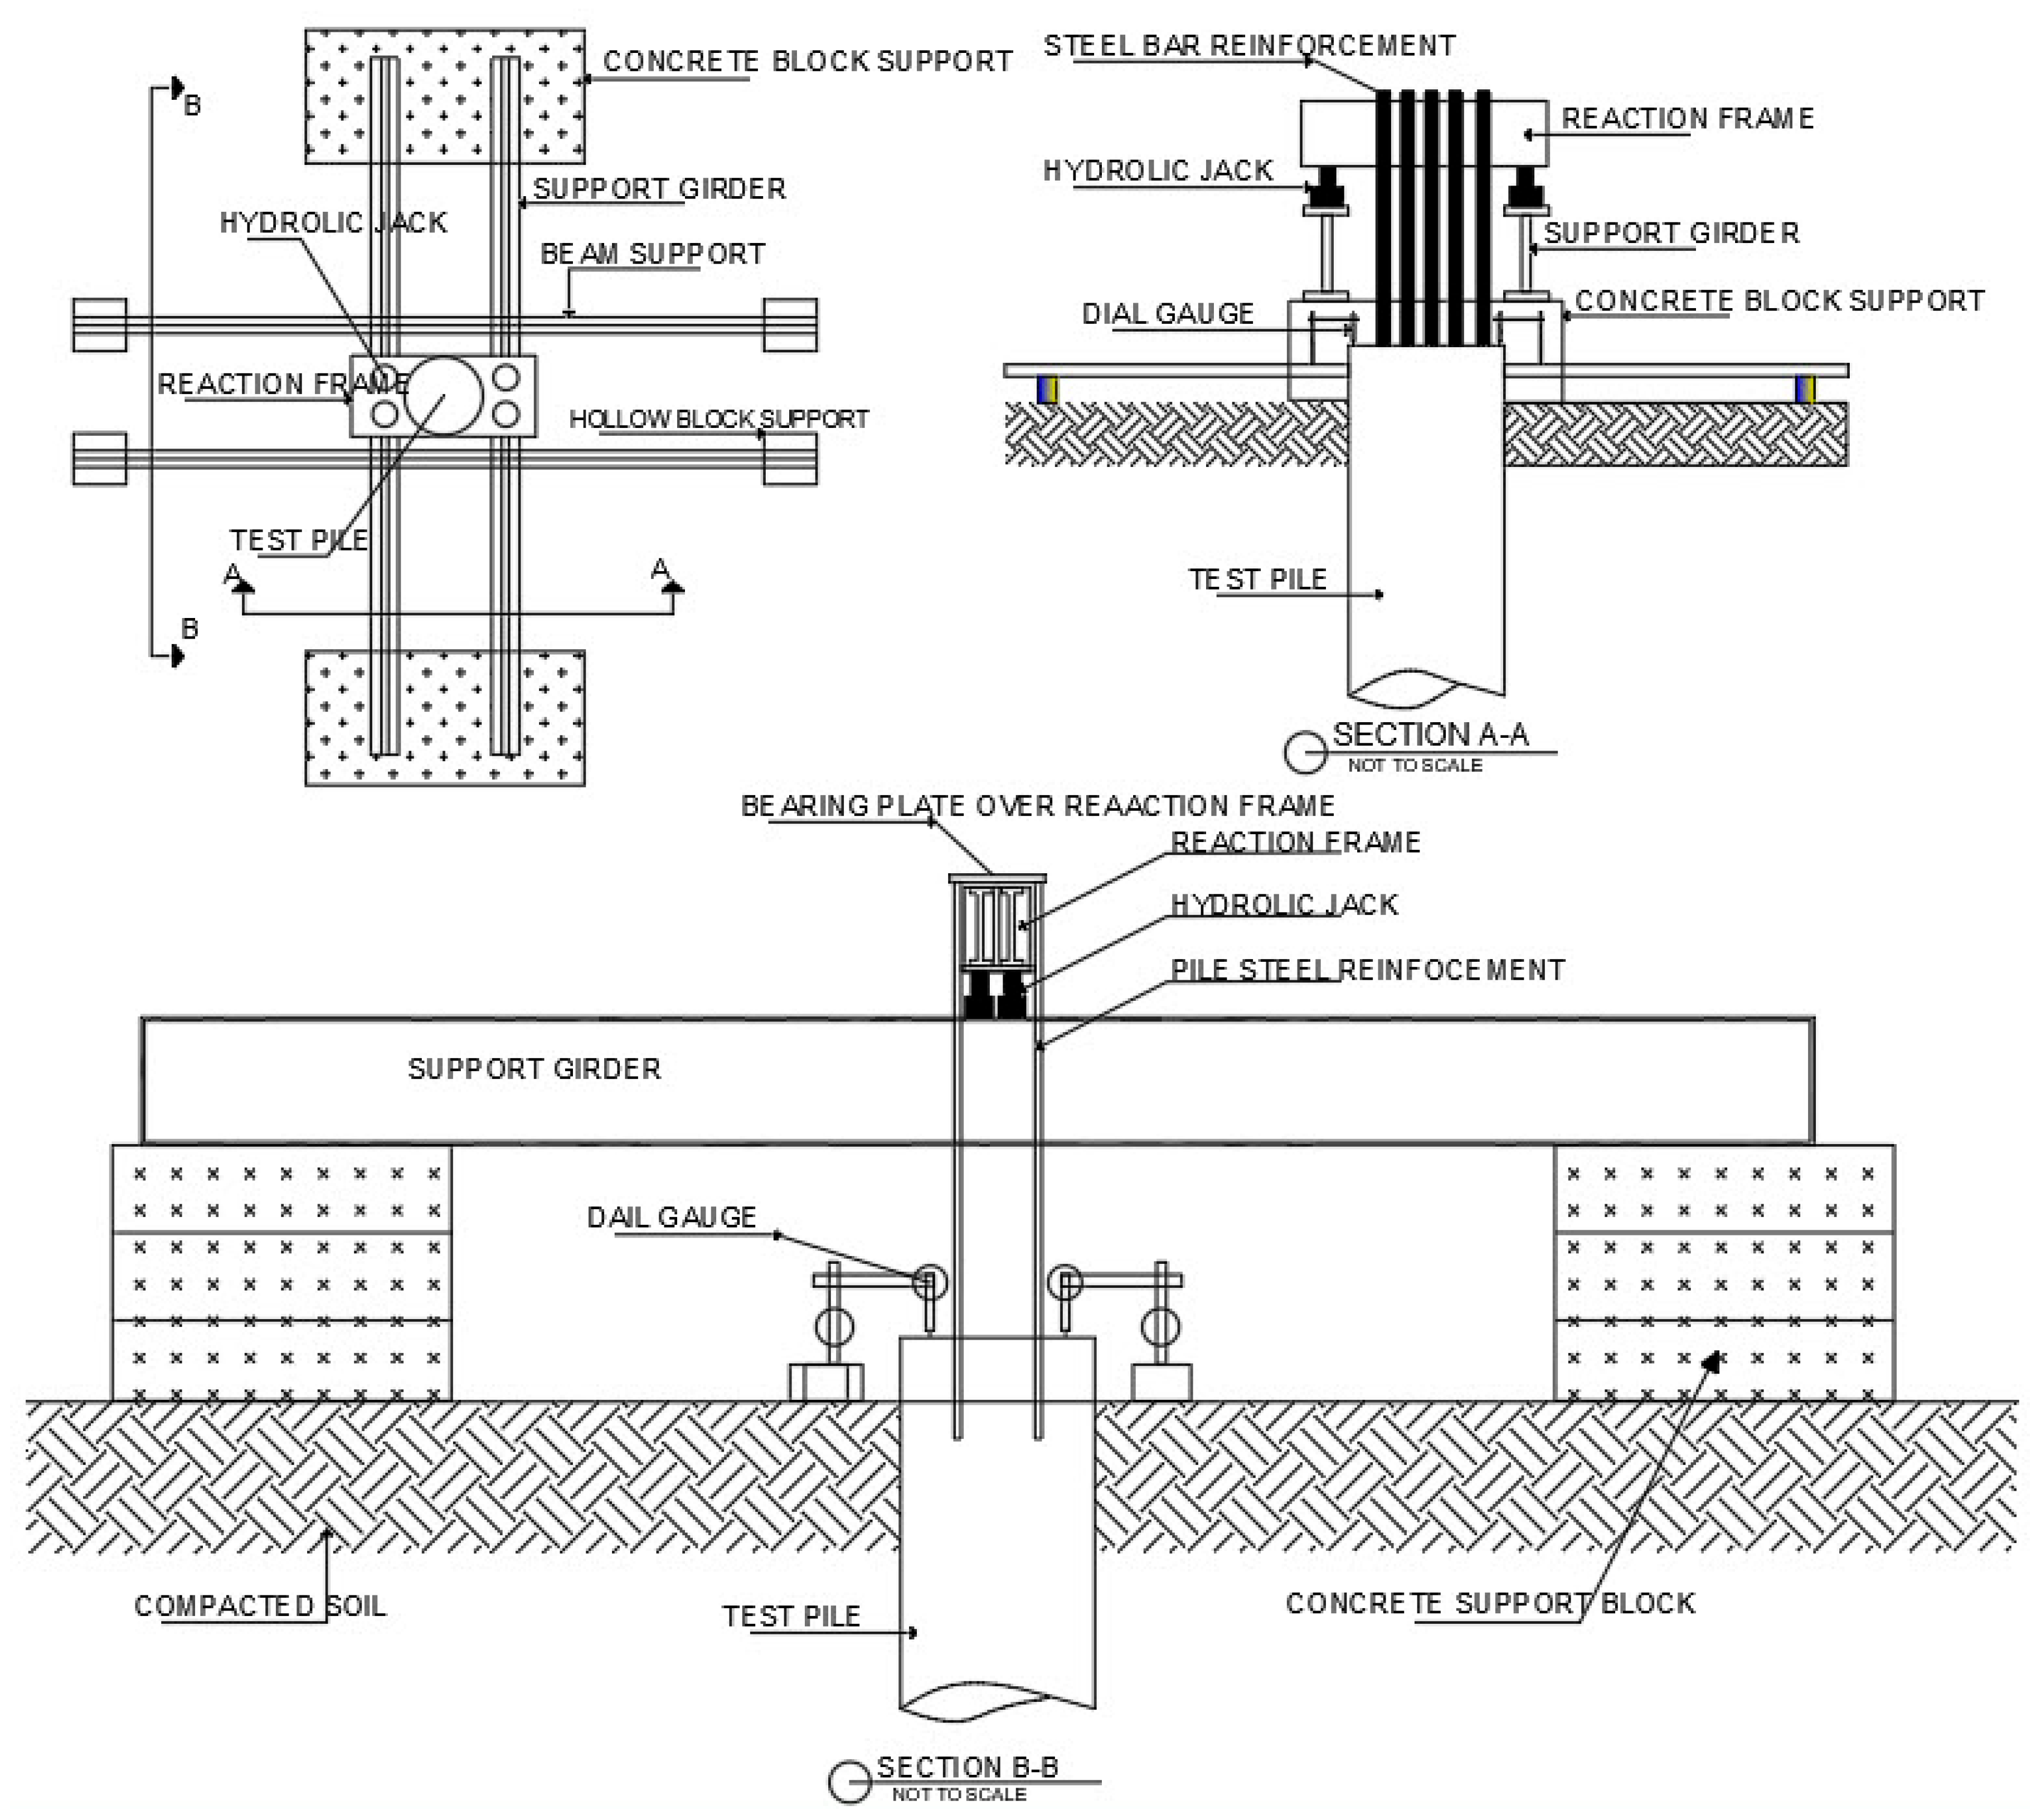
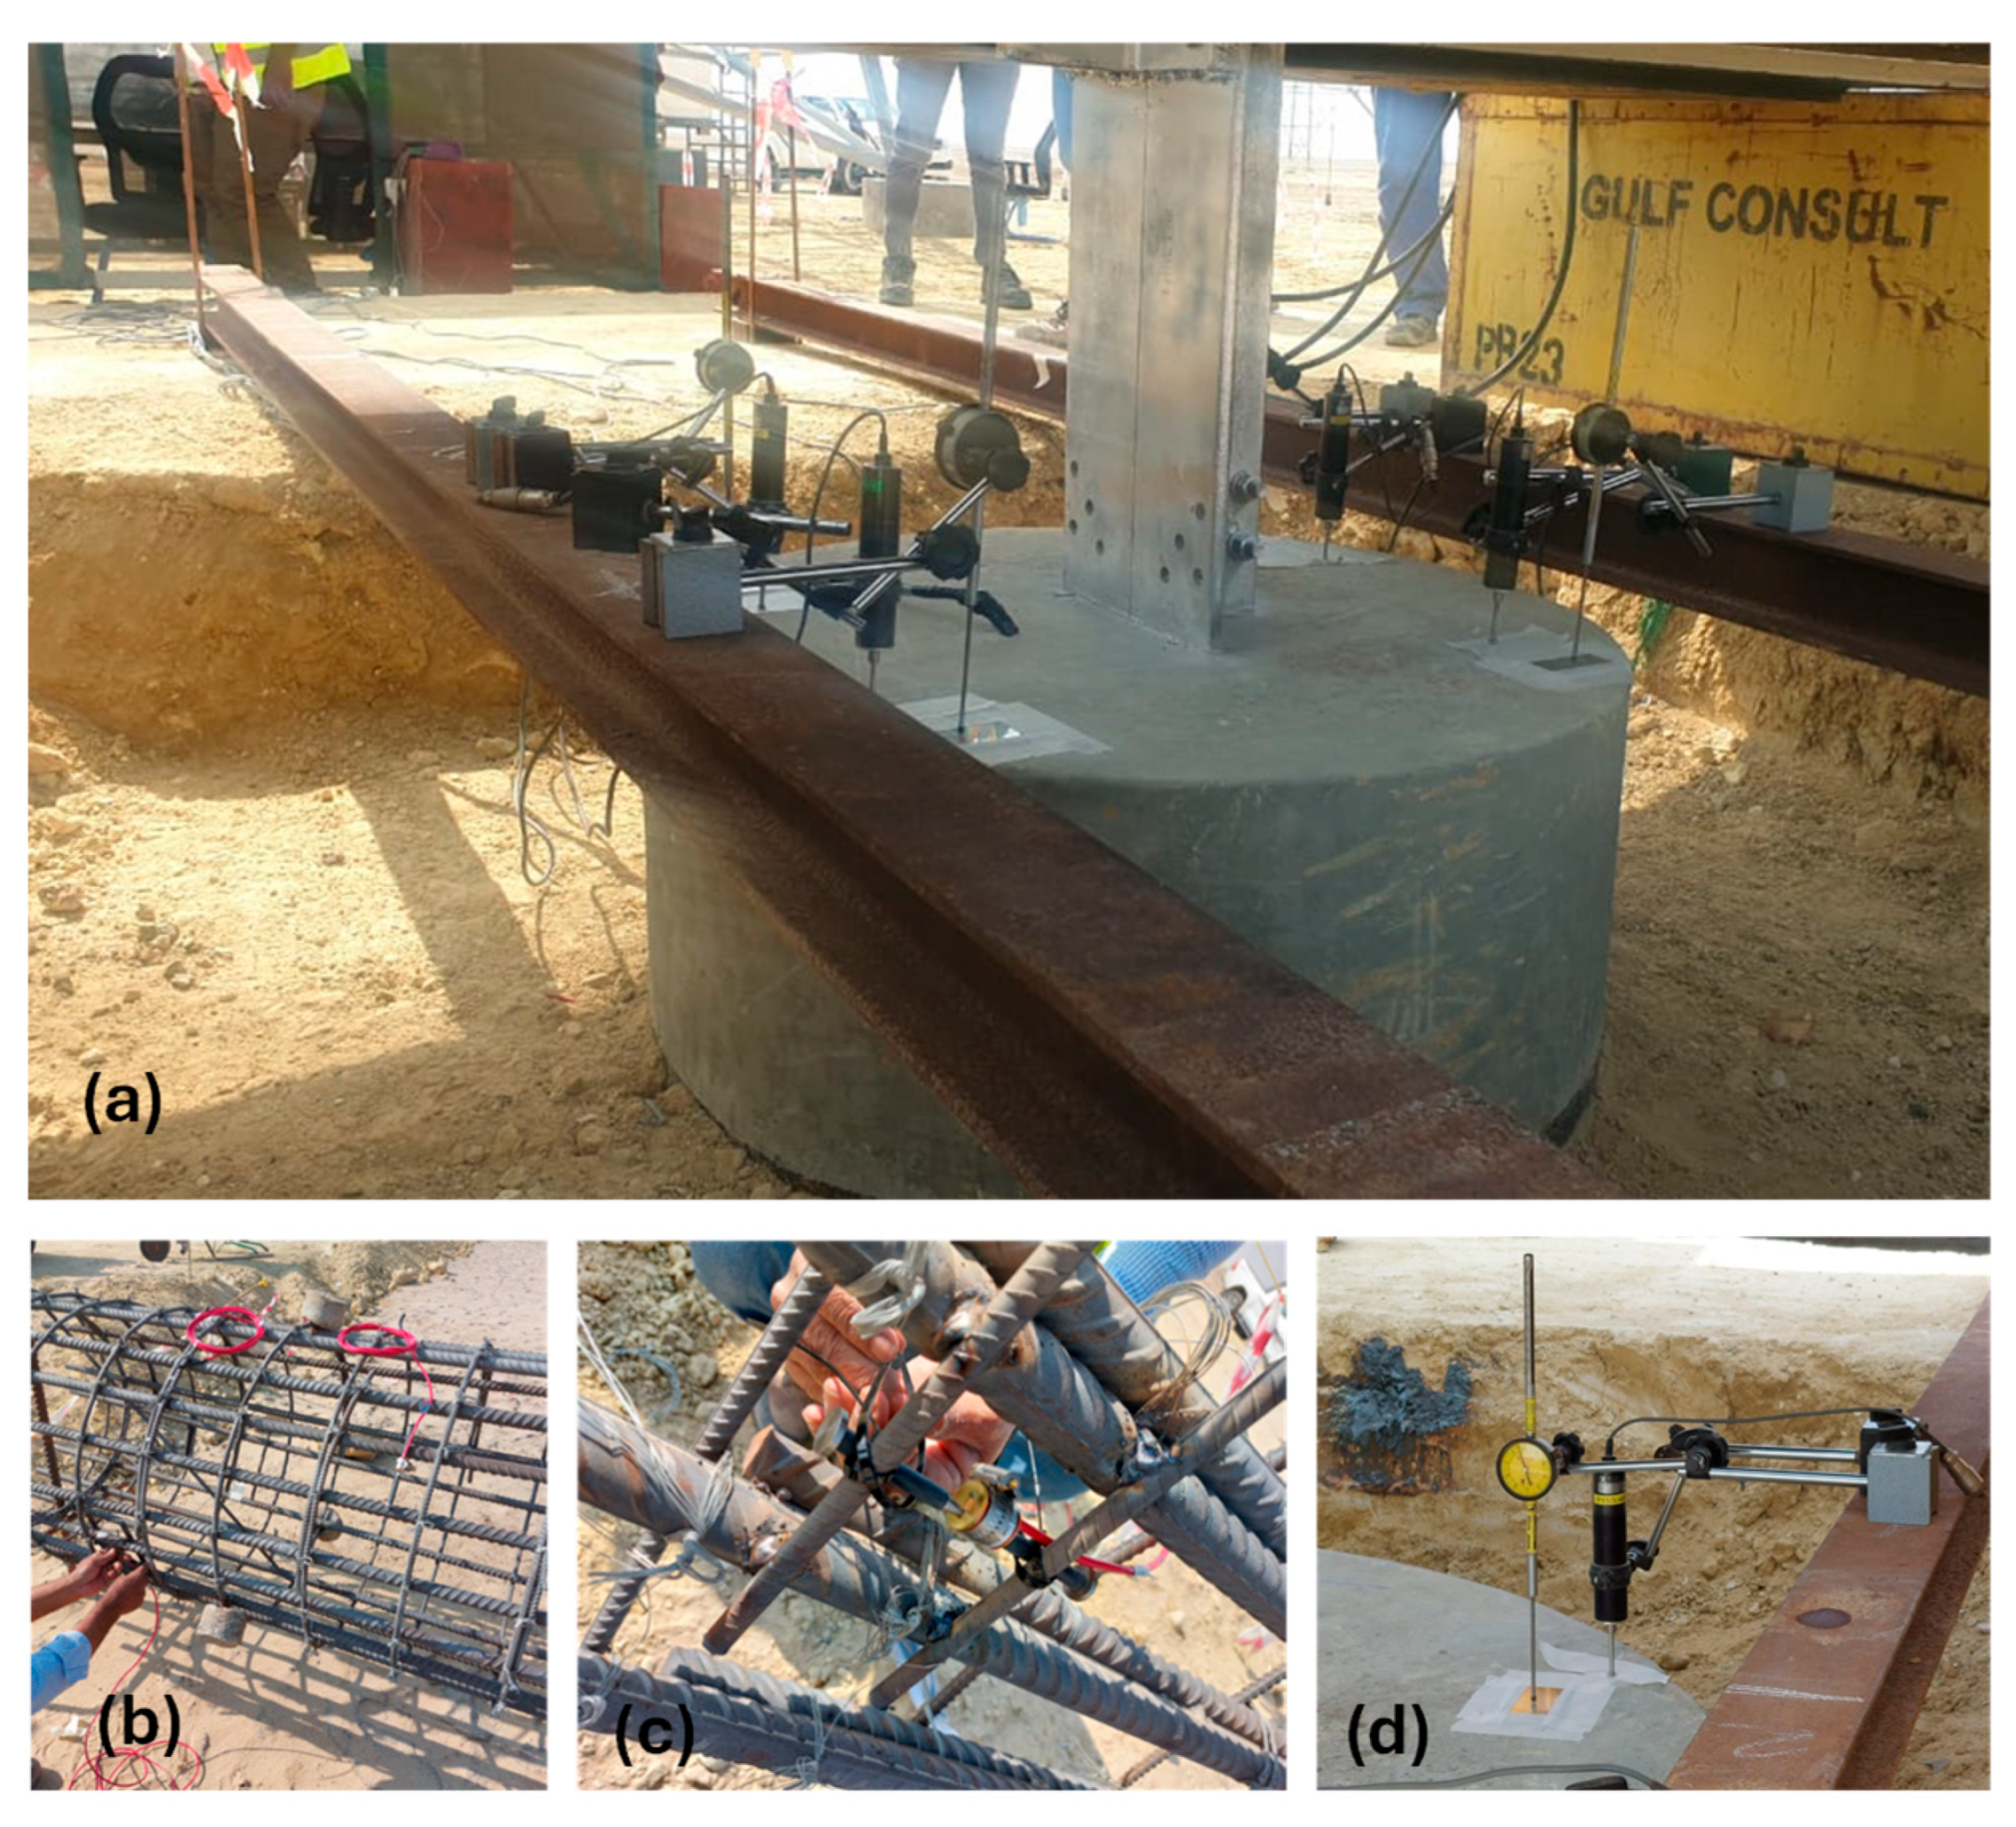
Figure 5 provides a schematic illustration of the experimental setup and apparatus. Pile head displacements were measured using dial gauges and displacement transducers. The dial gauges were affixed to a reference frame using magnetic holders, with their plungers pointed at glass squares firmly attached to the test pile in the direction opposite to the applied load. Displacement transducers provided precise measurements of pile movement, which were recorded alongside strain data for a complete assessment of pile behaviour. Before testing, all initial readings from the strain gauges and displacement transducers were recorded to establish a baseline.
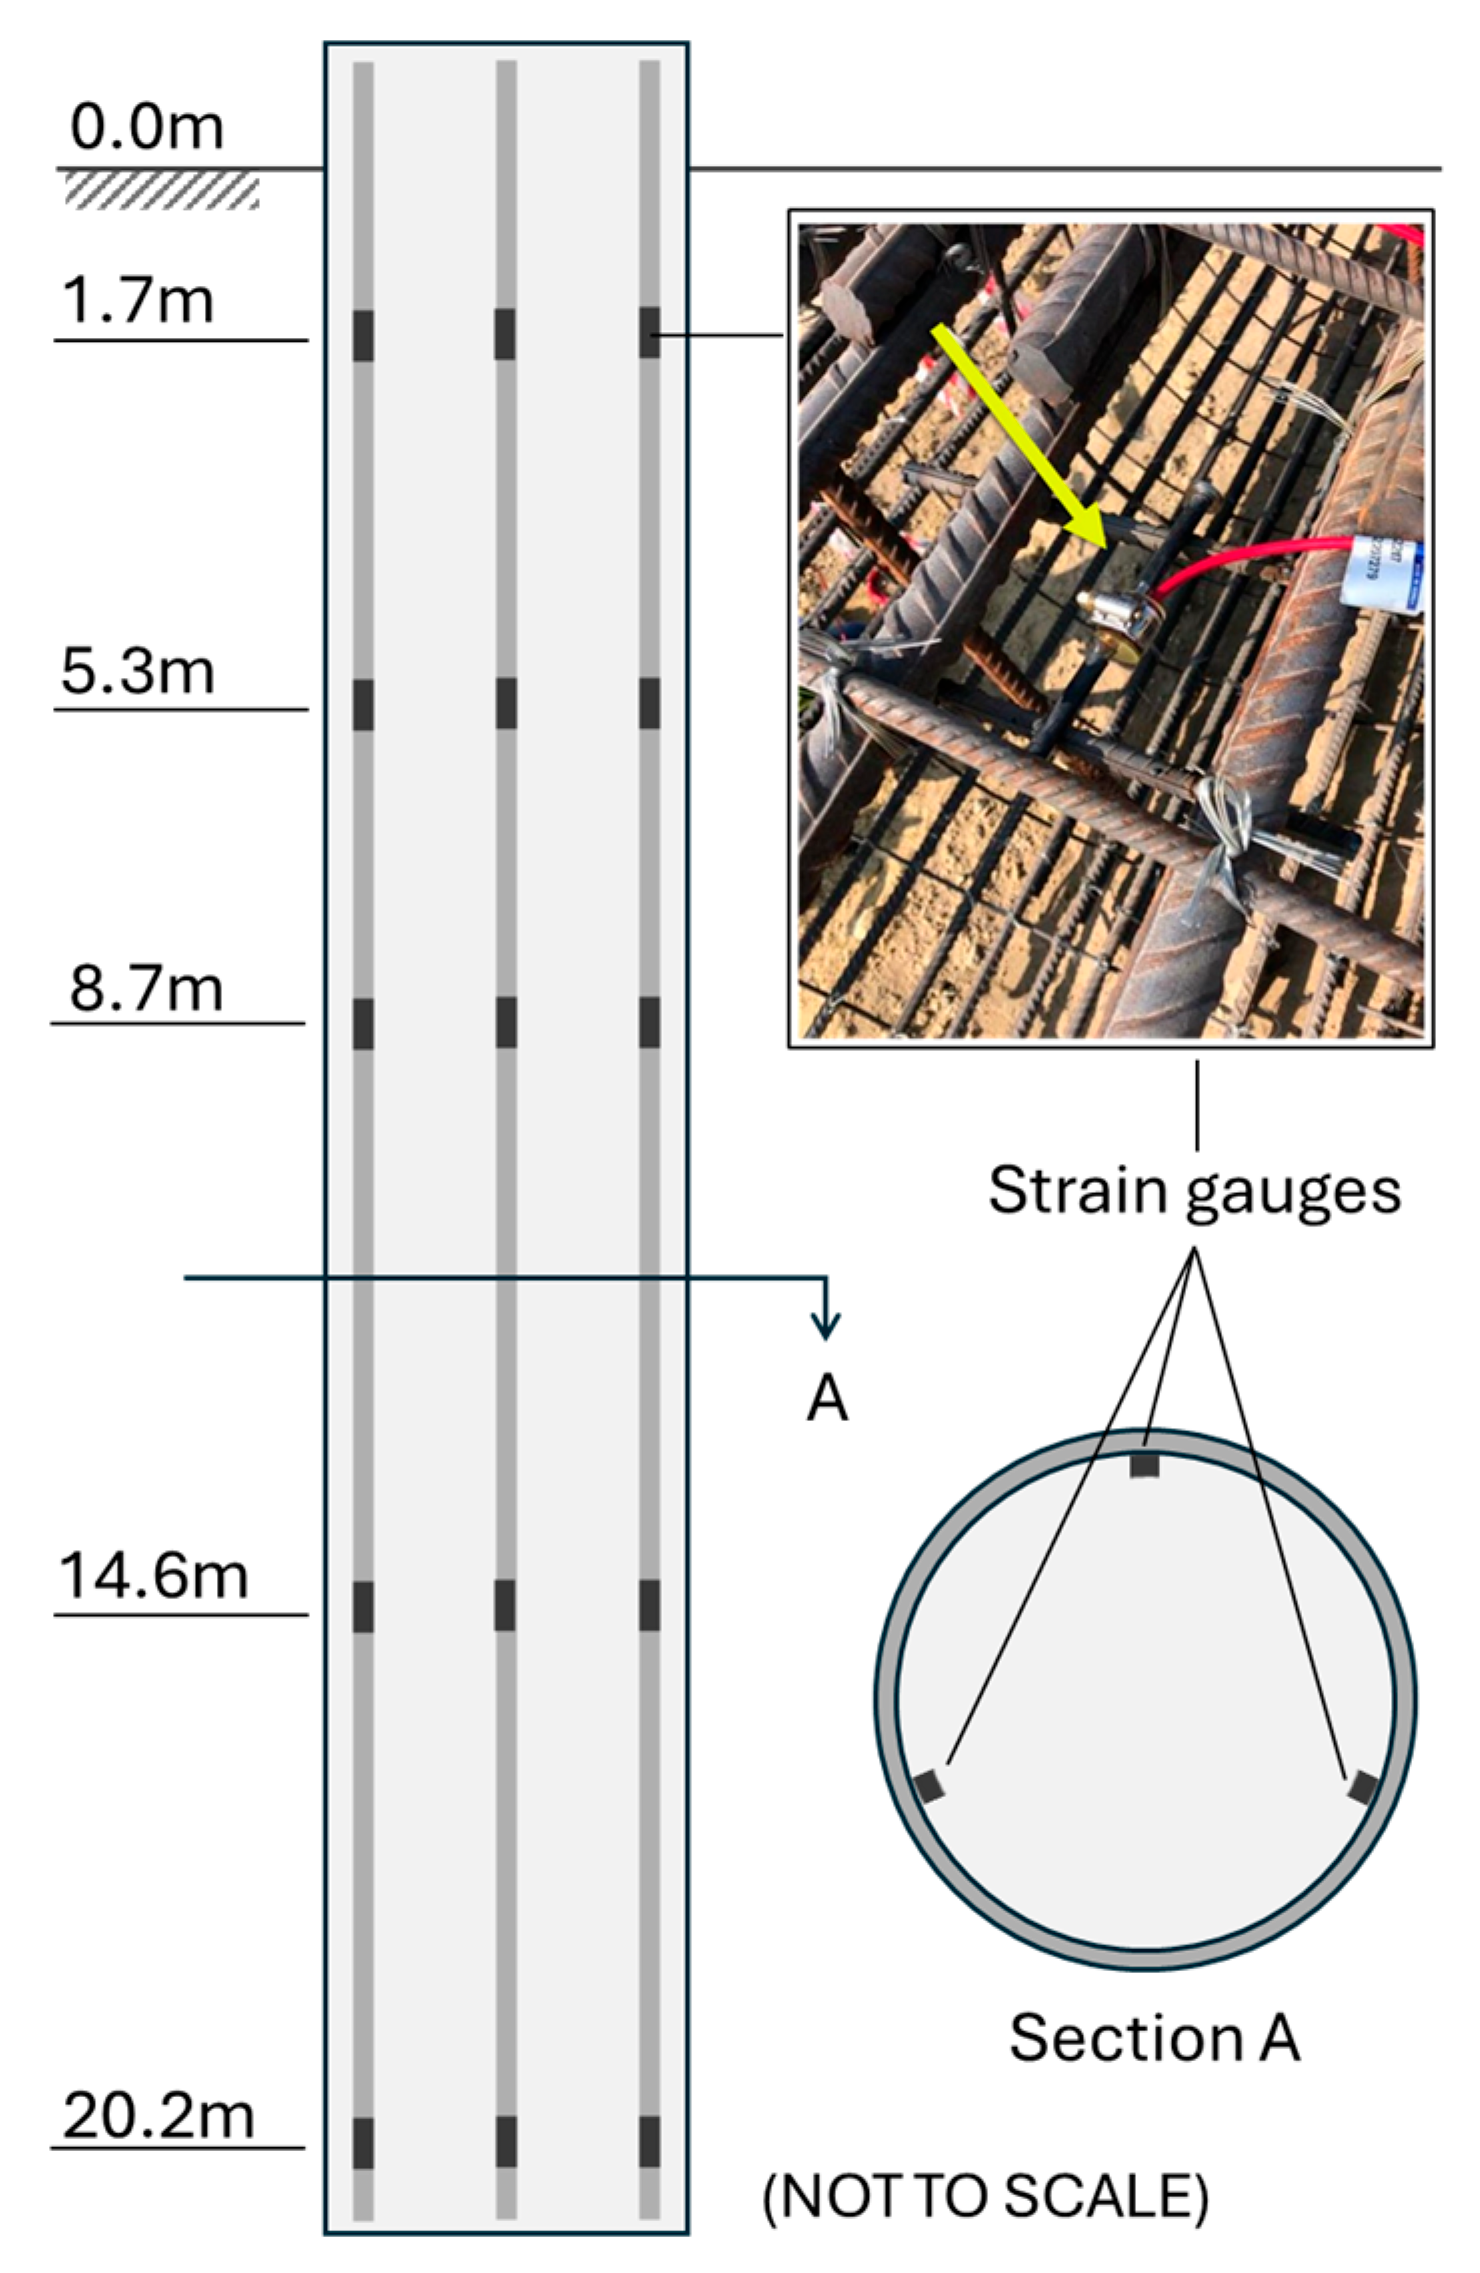
To monitor the performance of the piles during uplift tests, vibrating wire strain gauges were installed at five different levels within the larger piles (B1 and B2), with three gauges at each level to measure strain across the pile’s cross-section, as shown in Figure 6. These levels corresponded to interface soil layers (identified from borehole investigations), allowing for detailed analysis of load transfer along the pile shaft and variations in shaft resistance across different strata. The strain gauges facilitated the measurement of micro-strains within the pile, providing valuable data on how axial load was distributed and transferred along the pile shaft over time. Data were logged continuously during the tests, allowing for real-time monitoring of displacement and strain.

2.3.3. Loading Procedures

The static axial uplift load tests were conducted following ASTM D3689-07 [45]. The tensile load application was facilitated by hydraulic pistons, with a capacity of 200 tons × 2 used for testing piles A1 and A2, and 200 tons × 6 for testing piles B1 and B2. The hydraulic pistons were mounted on top of a Kentledge beam, forming part of the full-scale load-testing setup illustrated in Figure 7.
The applied load was increased incrementally in 25% design load steps, and the load increments were maintained until the specified settlement criterion of 0.25 mm per hour was achieved. The minimum and maximum holding times at each load increment were 20 min and 60 min, respectively. Testing continued until a load level of 200% of the design load was reached, which was held for a minimum of 12 h. During this 12-h holding period, pile head displacement was continuously monitored to assess creep behaviour, following the criteria set out in ASTM D3689-07 [45]. Load increments were maintained until the rate of movement fell below 0.25 mm per hour, indicating stabilised conditions. No significant ongoing deformation was observed during the hold at 200% load, suggesting that time-dependent effects such as creep or stress relaxation during the final loading stage were minimal.
Following the initial loading phase, where the applied load was gradually increased to 200% of the design load, an unloading phase was performed. The load was decreased progressively, allowing the assessment of the pile’s elastic recovery and any permanent deformation. The load-displacement curve indicates that the reloading phase did not follow the original loading path, suggesting some irreversible deformation had occurred.
Data gathered during the tests included total load applied, corresponding pile head displacement, and strain distribution along the shaft. These measurements provided insights into the shear resistance mobilised along the pile and its overall performance under uplift loading conditions.

3. Results and Discussion

3.1. Load-Displacement Behaviour

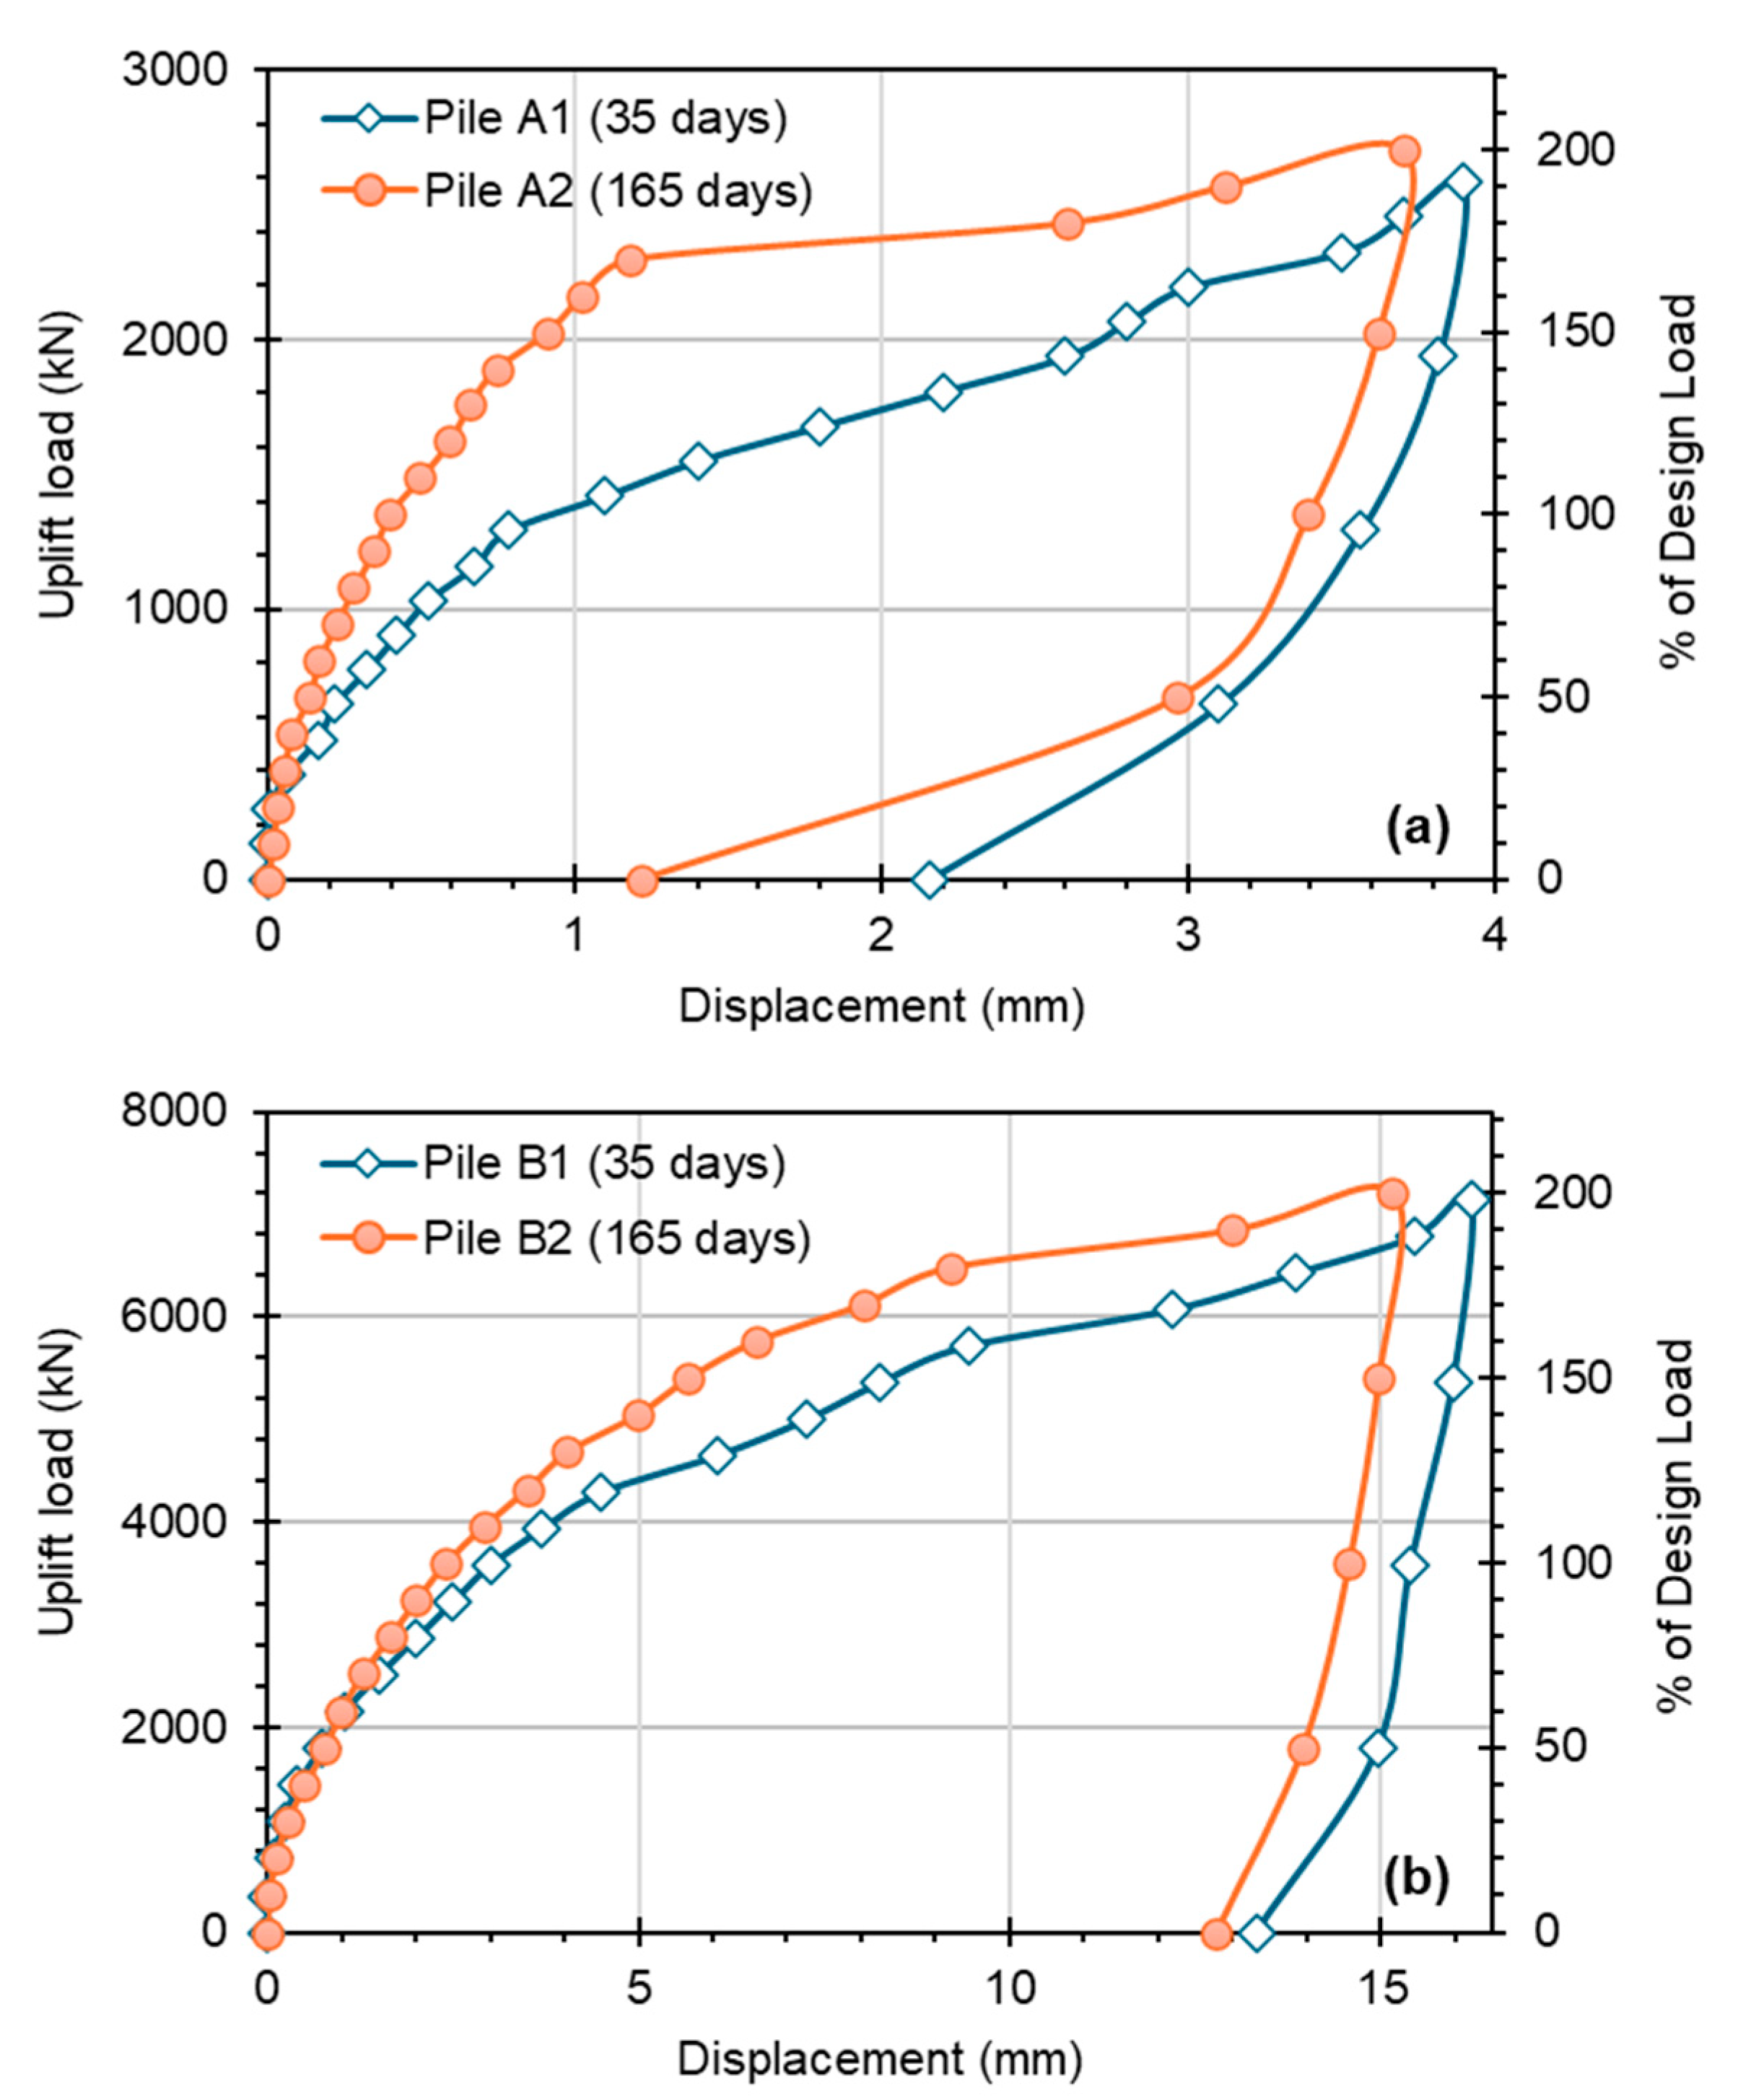
Figure 8 presents the results of uplift tests conducted on the pairs of piles, tested at 35 days and 165 days after installation. The load-displacement curves highlight the differences in performance due to the effect of ageing on shaft resistance. The tests were carried out up to 200% of the design load, and the behaviour of the piles during both the loading and unloading phases is captured in the results. Since both piles in each set, (A1, A2) and (B1, B2), were designed for the same capacities, this comparison can be carried out to evaluate the effect of ageing.
It should be noted that Displacement data for A1 and B1 were corrected using the most stable LVDT pairs, as early test setups showed signs of minor instrument support movement. This adjustment improved the consistency of the curves, but irregularities remain and may indicate residual disturbance effects. Together with the limited number of load tests, these factors represent important constraints when interpreting the results.
For the smaller piles A1 and A2 (Figure 8a), the results show that the younger pile (A1) exhibited an initial stiff response, with uplift load increasing rapidly for small displacements. As loading progressed, the stiffness gradually decreased, indicating a non-linear behaviour. The test on Pile A1 reached a maximum uplift load of approximately 2700 kN at a displacement of about 3.8 mm. In contrast, Pile A2 demonstrated a stiffer initial load-displacement response compared to Pile A1. It mobilised a much higher uplift load at smaller displacements, reaching approximately 2250 kN at just over 1 mm of displacement.
Figure 8b shows the load-displacement curves for larger piles B1 and B2, tested under similar ageing periods (35 days and 165 days, respectively). The curves reveal similar trends of increased stiffness with longer ageing periods, as evidenced by the large displacement of B1 compared to B2 at a given load. However, the figure also shows that the ageing effects begin to diminish as the applied load approaches 200% of the design load, indicating that the increase in stiffness has a practical limit.
All tested piles showed residual displacement upon unloading, indicating permanent plastic deformation within the soil-pile system. The magnitude of this residual displacement was notably larger for the Set B piles, consistent with the higher loads sustained and the greater extent of soil mobilisation and deformation.

3.2. Strain Gauge Interpretation

3.2.1. Distribution of Axial Load

Out of the four tested piles, two (B1 and B2) were instrumented with strain gauges. Strain gauge data provides valuable insights into how the axial load is distributed and transferred along the pile shaft. The axial load at various depths was calculated based on the strain gauge readings. The strain (ε) recorded at different levels in the pile was converted into stress using the elastic modulus of the pile materials, namely, concrete and steel reinforcement.
Thus, the load carried by the concrete (Pc) is determined using the equation:
P c = ε   E c A p A s
where ε represents the strain measured in the pile, Ec is the elastic modulus of concrete, Ap is the total cross-sectional area of the pile, and As is the cross-sectional area of the steel reinforcement.
Similarly, the load carried by the steel reinforcement (Ps) is calculated as:
P s = ε   E s   A s  
where Es is the elastic modulus of steel. Consiquantly, the total axial load (Ptotal) at any depth is the sum of the loads carried by the concrete and the steel reinforcement:
P t o t a l = P c + P s
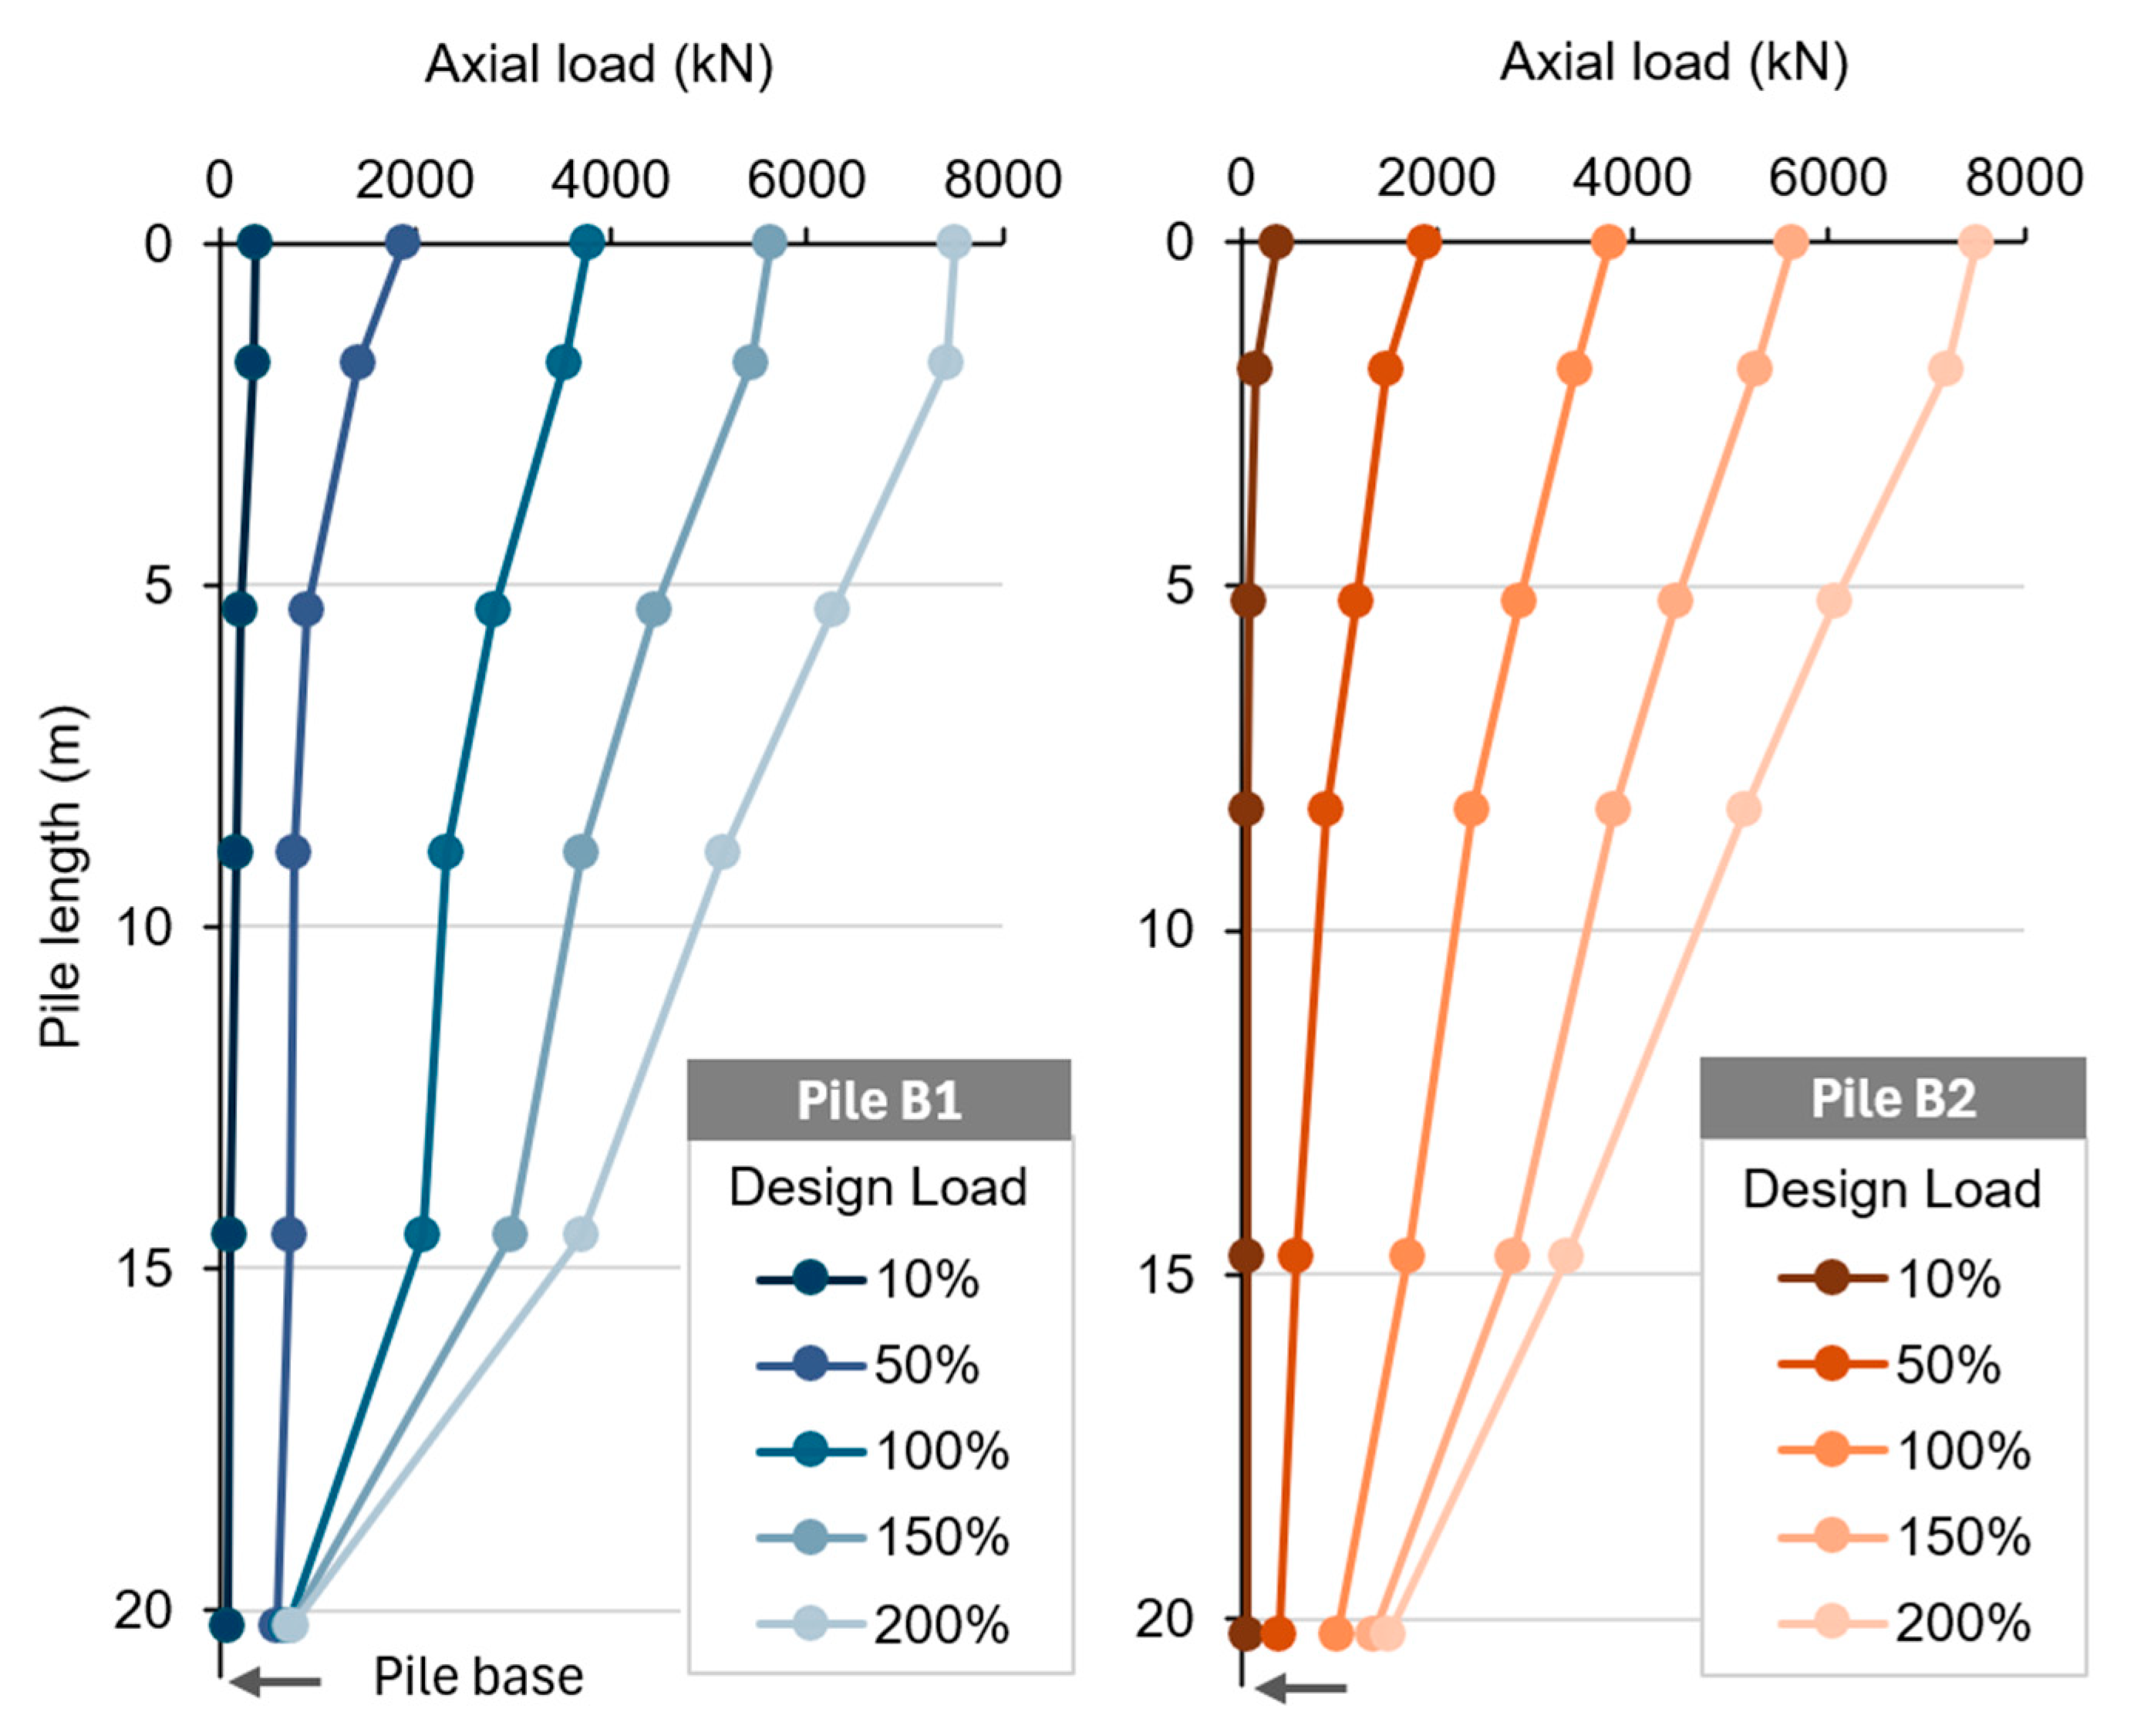
Figure 9 illustrates the distribution of axial uplift load along the depth of Piles B1 (35 days) and B2 (165 days), as derived from strain gauge measurements. The loads are expressed as percentages of the design load (10%, 50%, 100%, 150%, and 200%) and demonstrate how the load is transferred along the shaft at various stages of testing. For both piles, the load is predominantly transferred to the surrounding soil along the shaft, with no significant concentration of load at the pile base, as expected for bored piles under tension.
For Pile B1, tested at 35 days, load transfer is less uniform. At lower load levels (10–100% of design load), a considerable portion of the applied load is resisted by the upper segments (0–10 m), while deeper segments contribute progressively more resistance at higher loads. At 200% load, the load continues to mobilise downward, indicating delayed engagement of the deeper shaft resistance. This behaviour is consistent with typical shaft resistance mobilisation patterns for bored piles under uplift.
In contrast, Pile B2 (165 days) demonstrates a more even distribution of load along the shaft at all load levels. Even at low loads (10–50%), resistance is more effectively mobilised over the full depth, especially below 10 m. As the applied load increases, the deeper segments (particularly 15–20 m) engage earlier than in B1, indicating more rapid mobilisation of shaft friction. This suggests that the longer rest period allowed for better stress redistribution and interface adaptation between the pile and the surrounding sand.
It is important to note that the deepest strain gauge in Pile B2 was installed at 20.22 m depth, whereas the pile toe extended to 21.0 m. This leaves a 0.78 m segment of the pile uninstrumented near the base. Consequently, any load transfer occurring in this zone -from residual skin friction-would have been recorded by the lowest gauge, potentially leading to an overestimation of the base resistance. While bored piles are not typically expected to mobilise significant end resistance in uplift, this apparent high resistance attributed to this short zone is unrealistic for the given length and is likely due to the gauge capturing combined effects from both the base region and the adjacent shaft segment.

3.2.2. Distribution of Shaft Resistance

In the uplift tests, the primary resistance to the applied upward force is the shaft resistance (skin friction), as there is no contribution from end-bearing resistance [46]. Therefore, the distribution of shaft resistance can be directly correlated with the axial uplift load derived from the strain gauge readings [47].
The local shaft resistance or unit skin friction (Sf) between two adjacent levels (where strain gauges are placed) was calculated using the following equation:
S f = P Z   π D
where ΔP represents the change in axial load between two adjacent levels, ΔZ is the vertical distance between the two strain gauge levels, and D denotes the pile diameter.
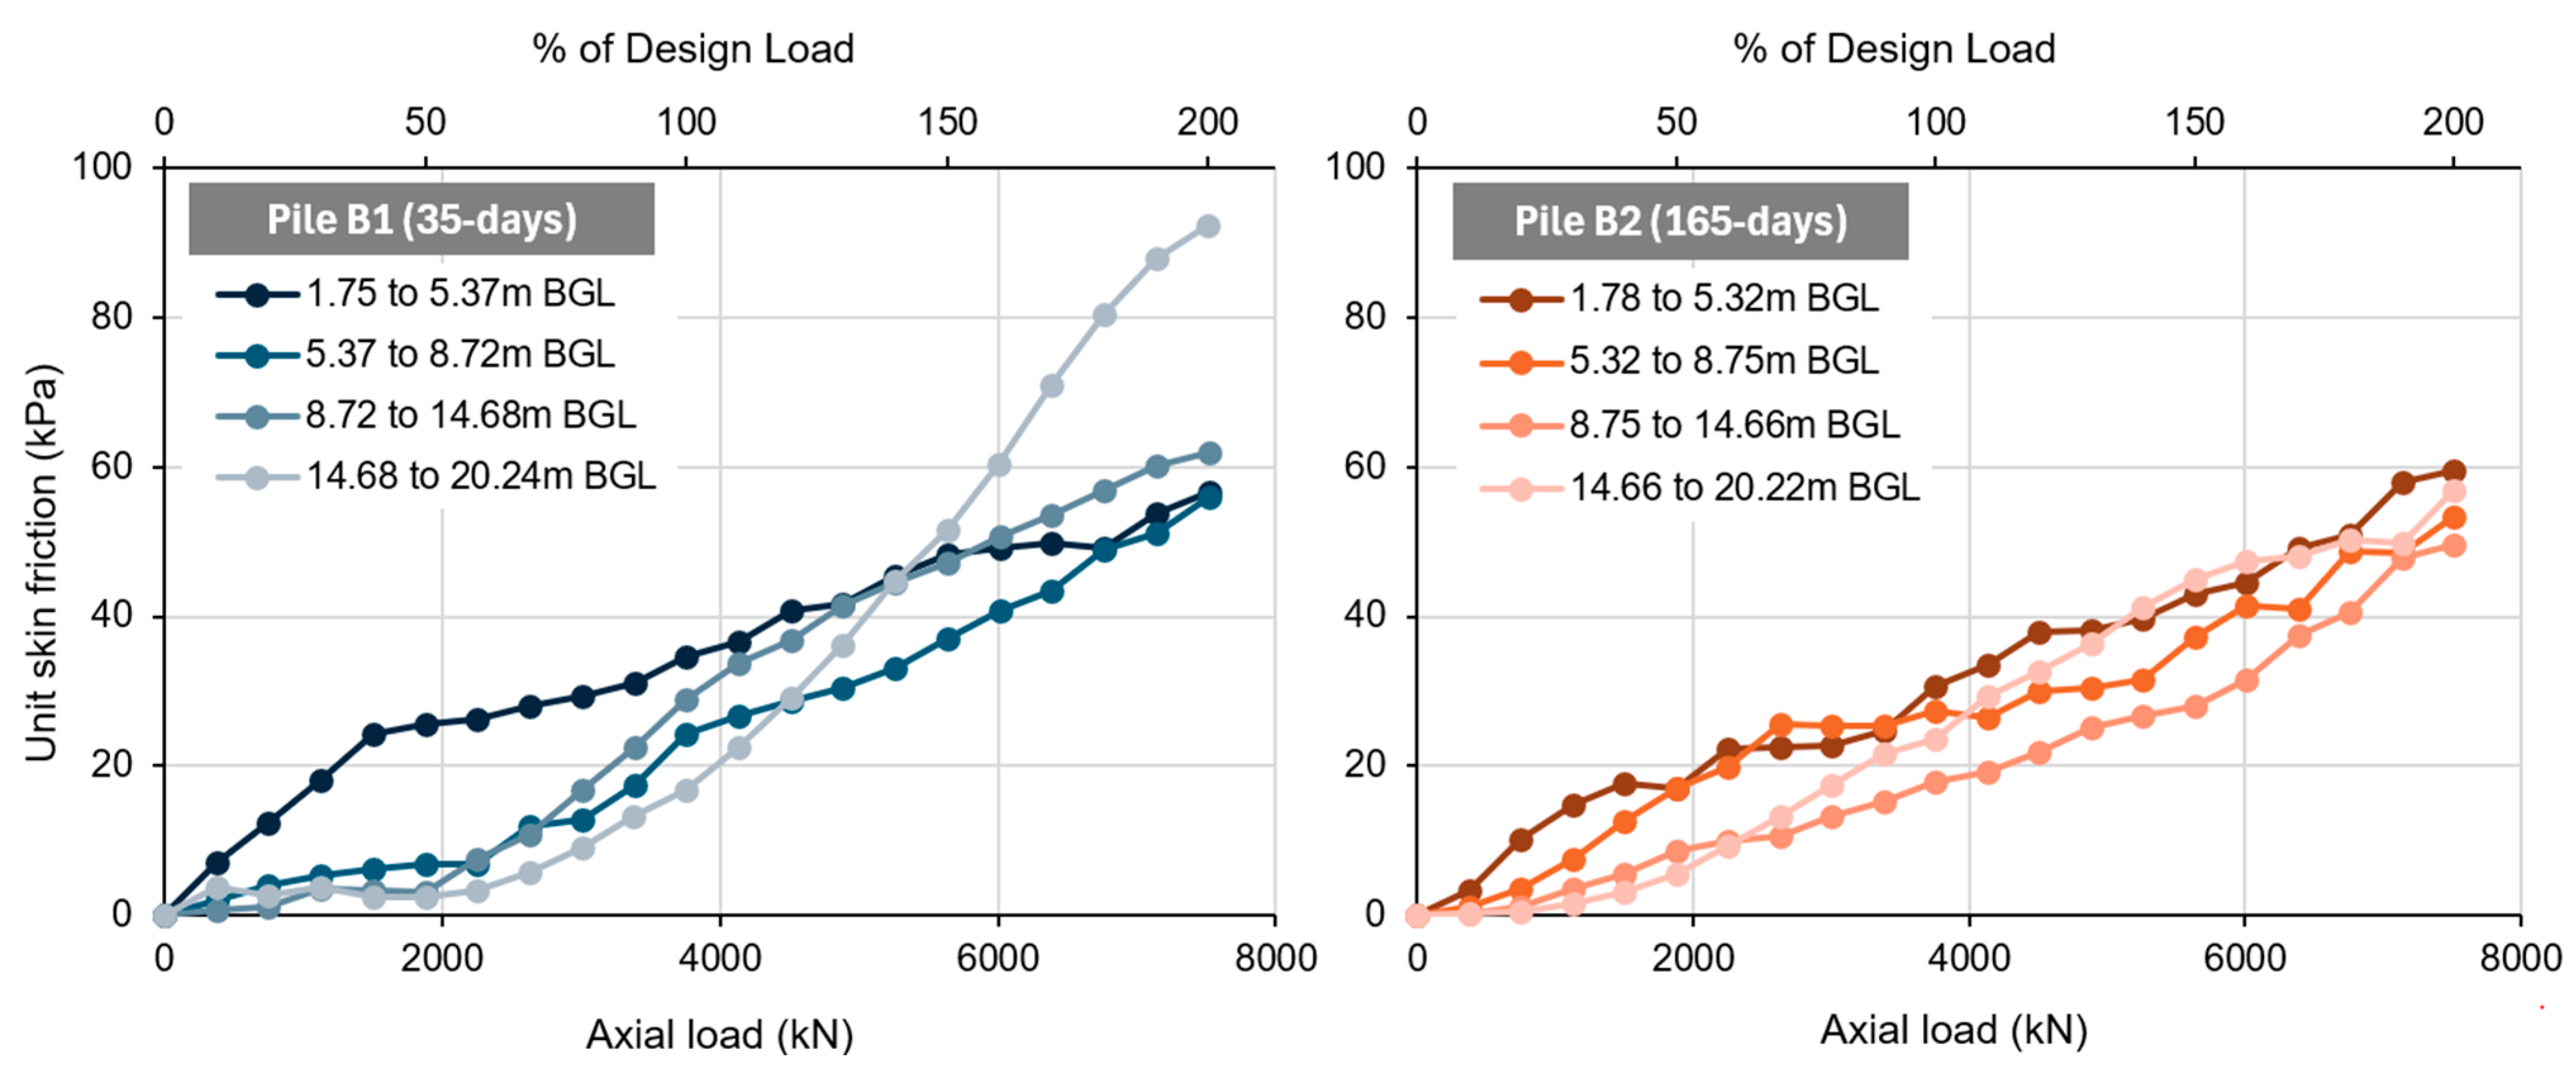
Using this equation, the variation of unit skin friction was determined at different levels along the pile shaft at different stages of applied uplift load, as presented in Figure 10.
For pile B1 (35-days), as depicted in Figure 10 (left), the unit skin friction generally increased with applied load for all depth segments (1.75–5.37 m BGL, 5.37–8.72 m BGL, 8.72–14.68 m BGL, and 14.68–20.24 m BGL). The shallowest segment exhibited the highest initial rates of skin friction mobilisation. In contrast, deeper segments showed a more gradual increase at lower loads, with values converging or deeper sections surpassing shallower ones at very high applied loads (e.g., beyond 6000 kN).
In contrast, pile B2 (Figure 10), tested at 165 days post-installation, exhibited a generally higher and more rapid mobilisation of unit skin friction across the tested depth segments (1.78–5.32 m BGL, 5.32–8.75 m BGL, 8.75–14.66 m BGL, and 14.66–20.22 m BGL) at lower to moderate applied loads (e.g., up to 4000 kN). The shallowest and mid-depth segments of Pile B2 consistently demonstrated higher unit skin friction values across the load range compared to the deeper sections, and less convergence at higher loads compared to Pile B1. Notably, while the peak unit skin friction values attained at maximum applied loads (approximately 7600 kN) were broadly similar for both piles (ranging from 50 to 60 kPa across depths), the rate at which these values were mobilised differed slightly. This slight difference could be attributed to ageing effects, though normal construction variability and measurement uncertainties could also contribute.
The measured unit skin friction values (Figure 10) were compared with theoretical estimates calculated using the β-method [40]. While the β-method predicted increasing resistance with depth, the field tests showed a more uniform distribution, particularly in the aged condition. The computed average skin friction (59 kPa) closely matched the observed average from the tests (55 kPa). At equivalent load percentages, the load distributions for B1 and B2 were broadly comparable, and the apparent higher mobilisation in the deepest segment of B2 is likely influenced by the unreliability of the lowest strain gauge.

3.3. Estimation of Ultimate Uplift Load Capacity

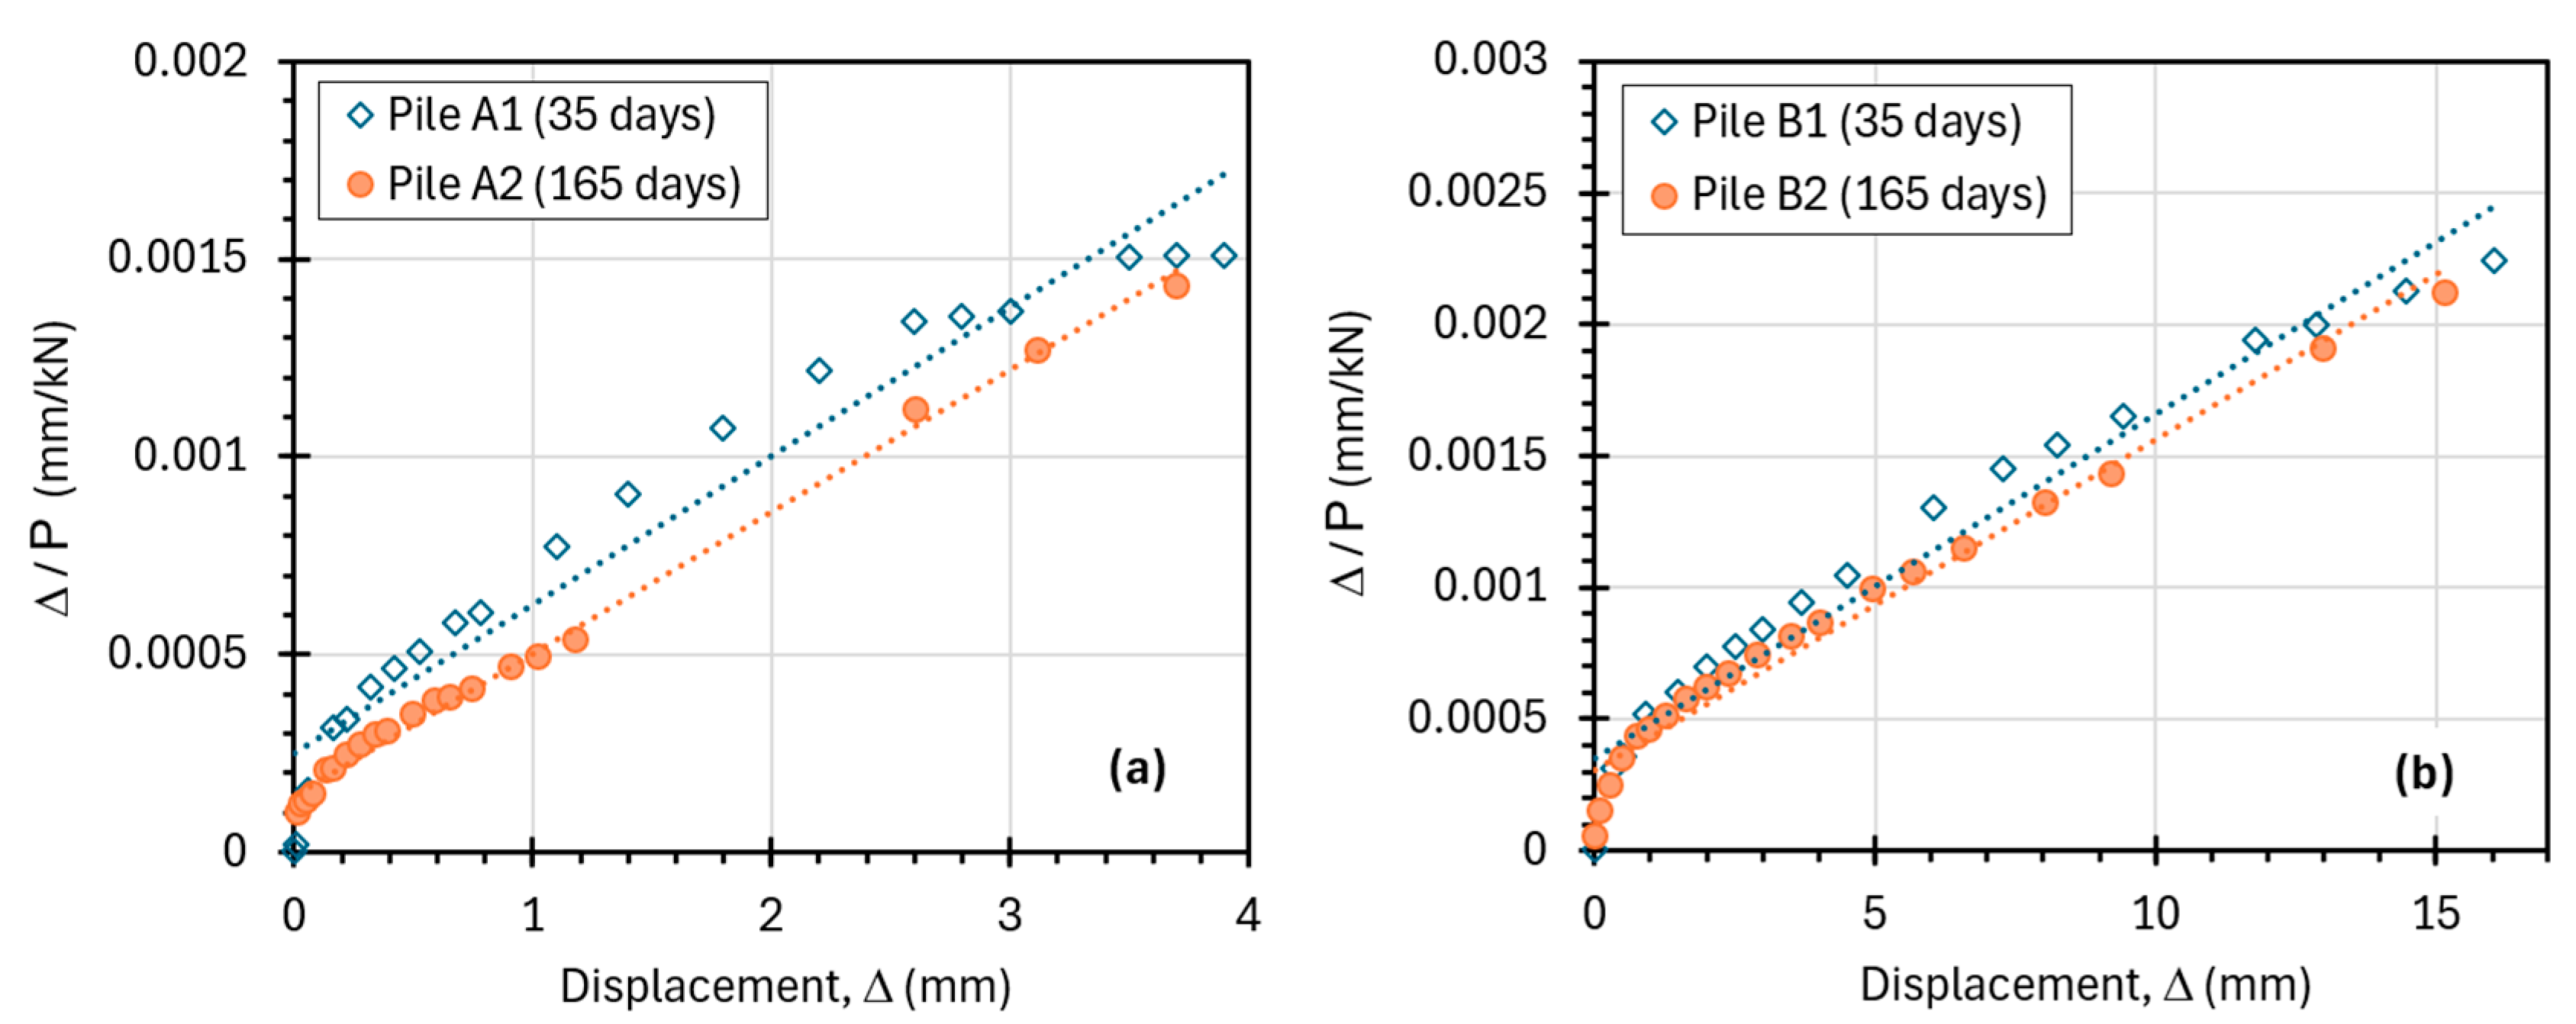
To evaluate the ultimate uplift capacity of the piles beyond the maximum applied load during testing, the Chin (1970) [48] hyperbolic method was applied to all four tested piles (A1, A2, B1, and B2). This method is particularly useful in cases where piles are not loaded to failure, as it extrapolates the load–displacement curve to infer the asymptotic capacity. The Chin equation is expressed as:
P = 1 P u + b
where Δ is the pile head displacement (mm), P is the applied uplift load (kN), Pu is the estimated uplift load capacity (kN), and b is the intercept representing inverse initial stiffness (mm/kN).
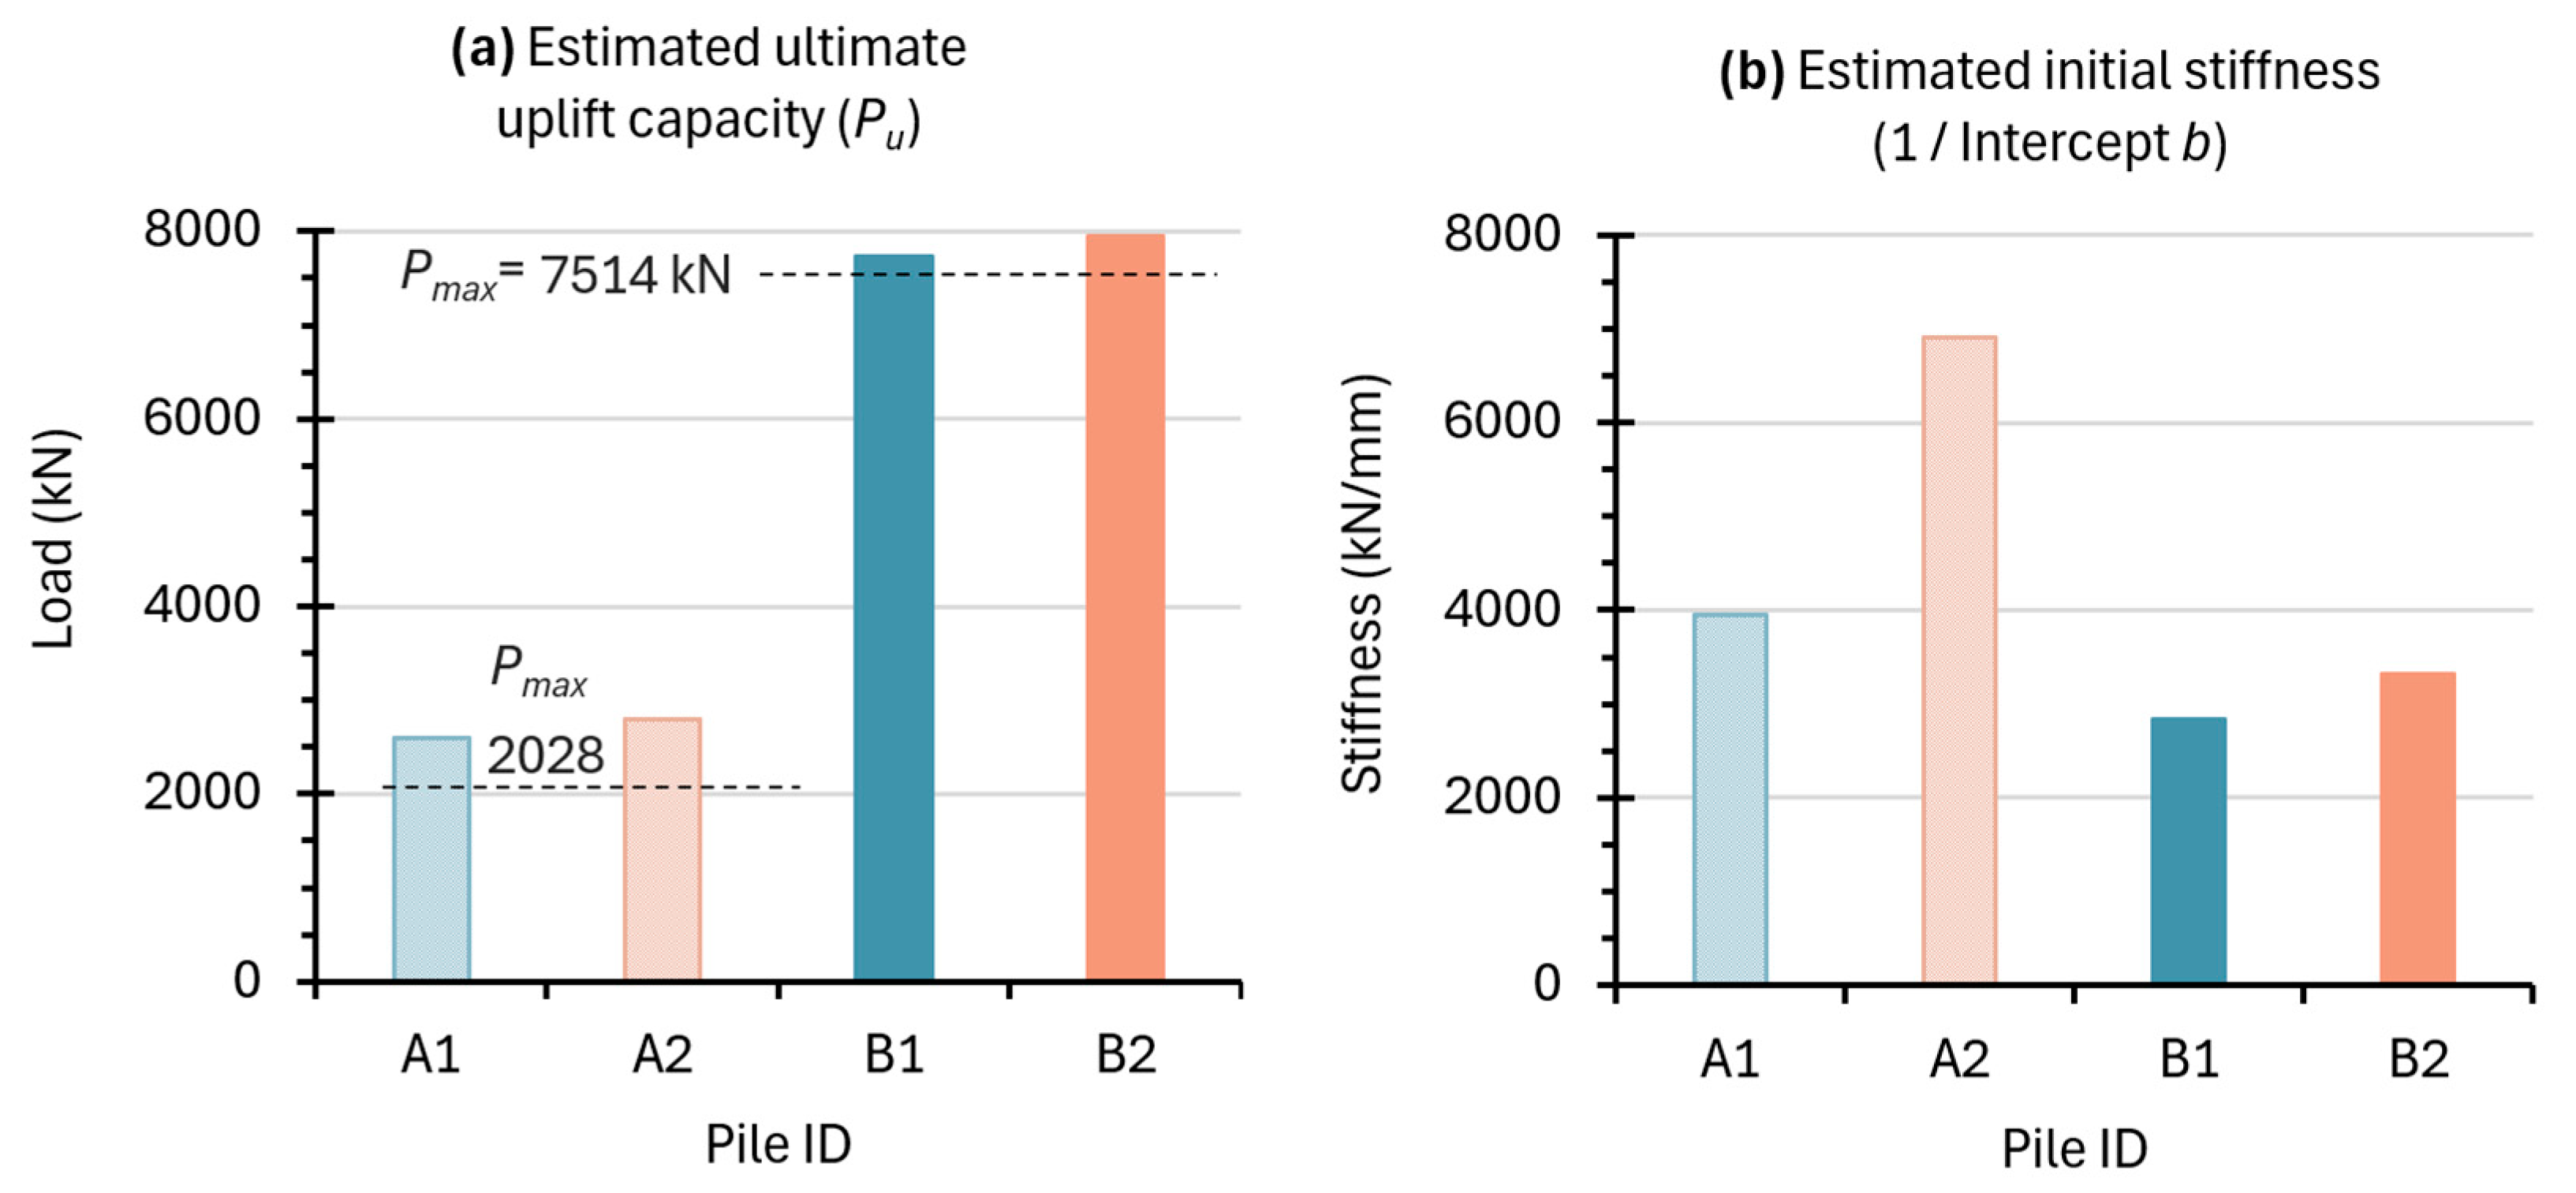
By plotting Δ/P versus Δ, the slope α of the best-fit line corresponds to 1/Pu, and the intercept b gives an estimate of the initial stiffness as 1/b. Figure 11 presents the experimental Δ/P–Δ data and corresponding fitted hyperbolas for each pile. The resulting parameters, including slope α, intercept b, and calculated ultimate load Pu, are summarised in Table 3. Additionally, Figure 12 compares the estimated Pu with the maximum applied uplift load Pmax and presents the derived initial stiffness for each pile.
For A1 and B1 (Figure 11), the experimental data did not align well with the fitted hyperbolas, and the Chin method therefore produces less reliable estimates of ultimate capacity and stiffness for these cases. For A2 and B2, the Chin method provided more consistent estimates. The observed differences between younger and aged piles should be interpreted cautiously, particularly for B1, where stiffness inferences are tentative.
In general, the analysis shows that all four piles were loaded to below their estimated ultimate capacities, confirming that full failure was not reached during testing. The two bored piles (A1 and A2) showed ultimate uplift capacities of 2603 kN and 2789 kN, respectively. Although A2 was tested after a longer rest period (165 days vs. 35 days for A1), the difference in estimated capacity is modest, suggesting limited but measurable improvement that could be attributed to ageing or other time-dependent mechanisms. Similarly, the initial stiffness of A2 (6906 kN/mm) was higher than that of A1 (3954 kN/mm), indicating a stiffer load–displacement response in the aged pile.
For the larger piles (B1 and B2), the estimated ultimate capacities were substantially higher, at 7740 kN and 7947 kN, respectively. While the B2 pile, tested at 165 days, showed a slightly higher Pu and initial stiffness (1/b), the difference relative to B1 is small (about 2.7%), and should be interpreted cautiously. These results may reflect a combination of ageing effects, improved soil–pile interaction over time, and inherent test or installation variability.
The trend of slightly increased capacity and stiffness in the aged piles (A2 and B2) aligns with existing literature on time-dependent behaviour of piles in sand [9,13]. However, the differences are not large and should not be overstated. These findings suggest that ageing may enhance pile performance in uplift over moderate time periods. However, the extent of improvement is variable and may depend on additional factors such as soil conditions, pile construction quality, and loading history.
It is important to note that no external surface loading or structural development occurred in the vicinity of the test piles during the interval between the two test periods. Site inspection records confirmed that the ground remained unloaded and undisturbed, and the area was free from construction activity. Therefore, the observed differences in load transfer behaviour and shaft resistance might be attributed to internal soil mechanisms such as stress redistribution, creep, or interface adjustment rather than changes in boundary loading conditions.

4. Conclusions

This study examines how ageing influences shaft resistance and load-transfer mechanisms in bored piles, a topic that has received limited attention compared to driven piles. The findings are based on a series of full-scale static uplift load tests conducted on four bored concrete piles installed in cohesionless silty sand, with two piles tested after 35 days and the remaining two after 165 days. Key findings include:
The measured uplift response showed modest but consistent increases in shaft resistance and initial stiffness with ageing, particularly in the 165-day-old piles (A2 and B2) compared to their younger counterparts (A1 and B1). The difference was most evident in the early stages of loading, where stiffer load–displacement responses and faster mobilisation of shaft friction were observed in the aged piles.
Extrapolated estimates of ultimate uplift capacity using the Chin method confirmed that all piles were loaded to below their ultimate uplift capacities. Estimated capacities were slightly higher in the aged piles, with increases of approximately 7% for A2 over A1 and 2.7% for B2 over B1. Although these differences align with previous findings on pile ageing in sand, they are relatively modest and should be interpreted in the context of field variability and test uncertainties.
Strain gauge data revealed more efficient and uniform load transfer along the shaft in the aged pile B2, supporting the hypothesis that stress redistribution and improved pile-soil bonding occur over time. Nonetheless, a small load concentration near the pile base was observed in B2, which may be partially attributed to instrumentation limits near the toe.
Unit skin friction profiles, derived from strain data, showed closer agreement with theoretical β-method estimates in the aged piles. However, ageing did not produce dramatic increases in peak shaft resistance. This suggests that, for bored piles in silty sand, improvements from ageing are gradual and depth-dependent, influenced by factors such as stress state, soil density, and construction quality.
In summary, the results suggest that moderate rest periods after installation may enhance shaft resistance mobilisation in bored piles under uplift in silty sand. However, the effects observed were modest, and their variability highlights the need for caution in generalising these findings. To improve confidence in design and interpretation, future studies should include a larger number of test piles and extend the monitoring period to capture long-term behaviour. Incorporating direct measurements of stress changes, pore pressures, and more detailed construction records will also be key to isolating the mechanisms that govern pile ageing in non-cohesive soils.

Author Contributions

Conceptualisation, O.H.; Methodology, O.H. and A.M.; Field investigation and data collection, A.M.; Data curation and formal analysis, A.M. and O.H.; Writing the original draft, O.H.; Reviewing and editing the manuscript, O.H. and A.M. Supervision, O.H. All authors have read and agreed to the published version of the manuscript.

Funding

This research received no external funding.

Institutional Review Board Statement

Not applicable.

Informed Consent Statement

Not applicable.

Data Availability Statement

The data supporting the findings of this study are available from the corresponding author (O.H.) upon reasonable request.

Conflicts of Interest

The authors declare no conflicts of interest.

References

  1. Efstathopoulos, G.E.; Balomenos, G.P. Effects of Wave Load Models on the Uplift Fragility Assessment of Pile-Supported Wharves and Piers Exposed to Storm Surge and Waves. Eng. Struct. 2023, 290, 116372. [Google Scholar] [CrossRef]
  2. Taghavi, A.; McVay, M.; Niraula, L.; Davidson, M.; Patil, A. Axial and Lateral Resistance Coupling in the Analysis of Large-Diameter Drilled Shafts. Eng. Struct. 2020, 206, 110160. [Google Scholar] [CrossRef]
  3. Chow, F.C.; Jardine, R.J.; Nauroy, J.F.; Brucy, F. Time-Related Increases in the Shaft Capacities of Driven Piles in Sand. Geotechnique 1997, 47, 353–361. [Google Scholar] [CrossRef]
  4. Abushama, K.; Hawkins, W.; Pelecanos, L.; Ibell, T. Minimising the Embodied Carbon of Reinforced Concrete Piles Using a Multi-Level Modelling Tool with a Case Study. Structures 2023, 58, 105476. [Google Scholar] [CrossRef]
  5. Hamza, O.; Abogdera, A.; Zoras, S. Emissions-Based Options Appraisal for Modular Building Foundations: A Case Study. Proc. Inst. Civ. Eng. Sustain. 2023, 177, 162–173. [Google Scholar] [CrossRef]
  6. Mihálik, J.; Gago, F.; Vlček, J.; Drusa, M. Evaluation of Methods Based on CPTu Testing for Prediction of the Bearing Capacity of CFA Piles. Appl. Sci. 2023, 13, 2931. [Google Scholar] [CrossRef]
  7. Randolph, M.F.; Wroth, C.P. An Analytical Solution for the Consolidation around a Driven Pile. Int. J. Numer. Anal. Methods Geomech. 1979, 3, 217–229. [Google Scholar] [CrossRef]
  8. Bullock, P.J.; Schmertmann, J.H.; McVay, M.C.; Townsend, F.C. Side Shear Setup. I: Test Piles Driven in Florida. J. Geotech. Geoenviron. Eng. 2005, 131, 292–300. [Google Scholar] [CrossRef]
  9. Jardine, R.J.; Standing, J.R.; Chow, F.C. Some Observations of the Effects of Time on the Capacity of Piles Driven in Sand. Géotechnique 2006, 56, 227–244. [Google Scholar] [CrossRef]
  10. Skov, R.; Denver, H. Time-Dependence of Bearing Capacity of Piles. In Proceedings of the Third International Conference on the Application of Stress-Wave Theory to Piles, Ottawa, ON, Canada, 25–27 May 1988; pp. 25–27. [Google Scholar]
  11. Ng, E.; Briaud, J.L.; Tucker, L.M. Field Testing of 5 Axially Loaded Single Piles in Sand at Hunter’s Point; Research Report to FHWA; Geo Resource Consultants Inc.: San Francisco, CA, USA, 1988. [Google Scholar]
  12. Fellenius, B.H.; Riker, R.E.; O’Brien, A.J.; Tracy, G.R. Dynamic and Static Testing in Soil Exhibiting Set-Up. J. Geotech. Eng. 1989, 115, 984–1001. [Google Scholar] [CrossRef]
  13. Gavin, K.G.; Igoe, D.J.P.; Kirwan, L. The Effect of Ageing on the Axial Capacity of Piles in Sand. Proc. Inst. Civ. Eng. 2013, 166, 122–130. [Google Scholar] [CrossRef]
  14. Karlsrud, K.; Jensen, T.G.; Lied, E.K.W.; Nowacki, F.; Simonsen, A.S. Significant Ageing Effects for Axially Loaded Piles in Sand and Clay Verified by New Field Load Tests. In Proceedings of the Offshore Technology Conference, OTC, Houston, TX, USA, 5–8 May 2014; p. D041S045R001. [Google Scholar]
  15. Carroll, R.; Carotenuto, P.; Dano, C.; Salama, I.; Silva, M.; Gavin, K.; Jardine, R. Field Studies on the Axial Capacity of Small Diameter Piles and Ageing Effects in Sands. In Offshore Site Investigation Geotechnics 8th International Conference Proceeding; Society for Underwater Technology: London, UK, 2017; pp. 1160–1169. [Google Scholar]
  16. Buckley, R.M.; Jardine, R.J.; Kontoe, S.; Lehane, B.M. Effective Stress Regime around a Jacked Steel Pile during Installation Ageing and Load Testing in Chalk. Can. Geotech. J. 2018, 55, 1577–1591. [Google Scholar] [CrossRef]
  17. Carroll, R.; Carotenuto, P.; Dano, C.; Salama, I.; Silva, M.; Rimoy, S.; Gavin, K.; Jardine, R. Field Experiments at Three Sites to Investigate the Effects of Age on Steel Piles Driven in Sand. Géotechnique 2020, 70, 469–489. [Google Scholar] [CrossRef]
  18. Igoe, D.; Gavin, K. Investigation of Cyclic Loading of Aged Piles in Sand. J. Geotech. Geoenviron. Eng. 2021, 147, 02451. [Google Scholar] [CrossRef]
  19. Bittar, E.M.; Lehane, B.M. An Experimental Study on Factors Affecting the Ageing of Shaft Friction on Steel Displacement Piles in Sand. Géotechnique 2024, 75, 348–361. [Google Scholar] [CrossRef]
  20. ISO 19901-4; Oil and Gas Industries Including Lower Carbon Energy—Specific Requirements for Offshore Structures Part 4: Geotechnical Design Considerations. ISO: Geneva, Switzerland, 2025.
  21. Manthey, S.; Vogt, S.; Cudmani, R.; Kidane, M. Experimental Study on the Time-Dependent Bearing Resistance of Open-Ended Steel Piles in Sand. Géotechnique 2024, 4, 985–1006. [Google Scholar]
  22. Taheri, A. Investigation of the Pile Aging Effect of a Fixed Offshore Platform Located in Persian Gulf Using Nonlinear Soil-Pile Interactions. Int. J. Marit. Technol. 2017, 8, 59–64. [Google Scholar] [CrossRef]
  23. Karlsson, M.; Yannie, J.; Dijkstra, J. Modeling Aging of Displacement Piles in Natural Soft Clay. J. Geotech. Geoenviron. Eng. 2019, 145, 4019070. [Google Scholar] [CrossRef]
  24. Gavin, K.; Igoe, D. A Field Investigation into the Mechanisms of Pile Ageing in Sand. Géotechnique 2021, 71, 120–131. [Google Scholar] [CrossRef]
  25. Korff, M.; Mair, R.J.; Van Tol, F.A.F. Pile-Soil Interaction and Settlement Effects Induced by Deep Excavations. J. Geotech. Geoenviron. Eng. 2016, 142, 4016034. [Google Scholar] [CrossRef]
  26. Zhang, M.; Sang, S.; Wang, Y.; Bai, X. Factors Influencing the Mechanical Characteristics of a Pile–Soil Interface in Clay Soil. Front. Earth Sci. 2020, 7, 364. [Google Scholar] [CrossRef]
  27. Lehane, B.M.; Jardine, R.J.; Bond, A.J.; Frank, R. Mechanisms of Shaft Friction in Sand from Instrumented Pile Tests. J. Geotech. Eng. 1993, 119, 19–35. [Google Scholar] [CrossRef]
  28. Randolph, M.F. Science and Empiricism in Pile Foundation Design. Géotechnique 2003, 53, 847–875. [Google Scholar] [CrossRef]
  29. Tra, T.H.; Nguyen, T.T.; Huynh, T.Q.; Ishikawa, T. Load Transfer Behaviour of Super Long Piles in Multi-Layer Soft Soil through Field Testing and Numerical 3D FEM Modelling. Soils Found. 2025, 65, 101627. [Google Scholar] [CrossRef]
  30. Rocha de Albuquerque, P.J. Uplift Behavior of Bored Piles in Tropical Unsaturated Sandy Soil. In Proceedings of the 18th International Conference on Soil Mechanics and Geotechnical Engineering, Paris, France, 2–6 September 2013. [Google Scholar]
  31. Guner, S.; Chiluwal, S. Cyclic Load Behavior of Helical Pile-to-Pile Cap Connections Subjected to Uplift Loads. Eng. Struct. 2021, 243, 112667. [Google Scholar] [CrossRef]
  32. Al-Mhaidib, A.I.; Edil, T.B. Model Tests for Uplift Resistance of Piles in Sand. Geotech. Test. J. 1998, 21, 213–221. [Google Scholar] [CrossRef]
  33. Xu, W.; Miao, H.; Chen, Y. Pull-out Behavior and Damage Assessment of Core Concrete of Full-Scale Prestressed High-Strength Hollow Square Piles. Structures 2023, 51, 1906–1918. [Google Scholar] [CrossRef]
  34. Buckley, R.M.; Jardine, R.J.; Kontoe, S.; Parker, D.; Schroeder, F.C. Ageing and Cyclic Behaviour of Axially Loaded Piles Driven in Chalk. Géotechnique 2018, 68, 146–161. [Google Scholar] [CrossRef]
  35. ASTM D2488; Standard Practice for Description and Identification of Soils (Visual-Manual Procedures). ASTM: West Conshohocken, PA, USA, 2017.
  36. Hussain, Y.; Uagoda, R.; Borges, W.; Prado, R.; Hamza, O.; Cárdenas-Soto, M.; Havenith, H.-B.; Dou, J. Detection of Cover Collapse Doline and Other Epikarst Features by Multiple Geophysical Techniques, Case Study of Tarimba Cave, Brazil. Water 2020, 12, 2835. [Google Scholar] [CrossRef]
  37. Peck, R.B.; Hanson, W.E.; Thornburn, T.H. Foundation Engineering; Wiley: New York, NY, USA, 1974; Volume 10. [Google Scholar]
  38. Jardine, R.J.; Buckley, R.M.; Kontoe, S.; Barbosa, P.; Schroeder, F.C. Behaviour of Piles Driven in Chalk. In Engineering in Chalk: Proceedings of the Chalk 2018 Conference, Proceedings of the Chalk 2018 Conference, London, UK, 17–18 September 2018; ICE Publishing: London, UK, 2018; pp. 33–51. [Google Scholar]
  39. Kalaga, S.; Yenumula, P. Design of Electrical Transmission Lines: Structures and Foundations; CRC Press: Boca Raton, FL, USA, 2016; ISBN 1315755688. [Google Scholar]
  40. O’Neil, M.W.; Reese, L.C. Drilled Shafts: Construction Procedures and Design Methods; Federal Highway Administration; Office of Infrastructure: Washington, DC, USA, 1999.
  41. Reese, L.C.; Isenhower, W.M.; Wang, S.-T. Analysis and Design of Shallow and Deep Foundations; John Wiley & Sons: Hoboken, NJ, USA, 2005; Volume 10, ISBN 0471431591. [Google Scholar]
  42. ACI 318-19(22); Building Code Requirements for Structural Concrete and Commentary. ACI: Farmington Hills, MI, USA, 2022.
  43. ASTM-C39/C39M; Standard Test Method for Compressive Strength of Cylindrical Concrete Specimens. ASTM: West Conshohocken, PA, USA, 2001.
  44. ASTM C469; Standard Test Method for Static Modulus of Elasticity and Poisson’s Ratio of Concrete in Compression. ASTM: West Conshohocken, PA, USA, 2014; Volume 4.
  45. ASTM D3689-07; Standard Test Methods for Deep Foundations Under Static Axial Tensile. ASTM: West Conshohocken, PA, USA, 2020; Volume 7.
  46. Shlash, A. Experimental Study of Ultimate Uplift Resistance of Roughened Model Piles in Sand; The University of Wisconsin-Madison: Madison, WI, USA, 1994; ISBN 9798597006949. [Google Scholar]
  47. Jardine, R.; Chow, F.; Overy, R.; Standing, J. ICP Design Methods for Driven Piles in Sands and Clays; Thomas Telford London: London, UK, 2005; Volume 112. [Google Scholar]
  48. Chin, F.K. Estimation of the Ultimate Load of Piles from Tests Not Carried to Failure. In Proceedings of the 2nd Southeast Asian Conference on Soil Engineering, Singapore, 11–15 June 1970. [Google Scholar]
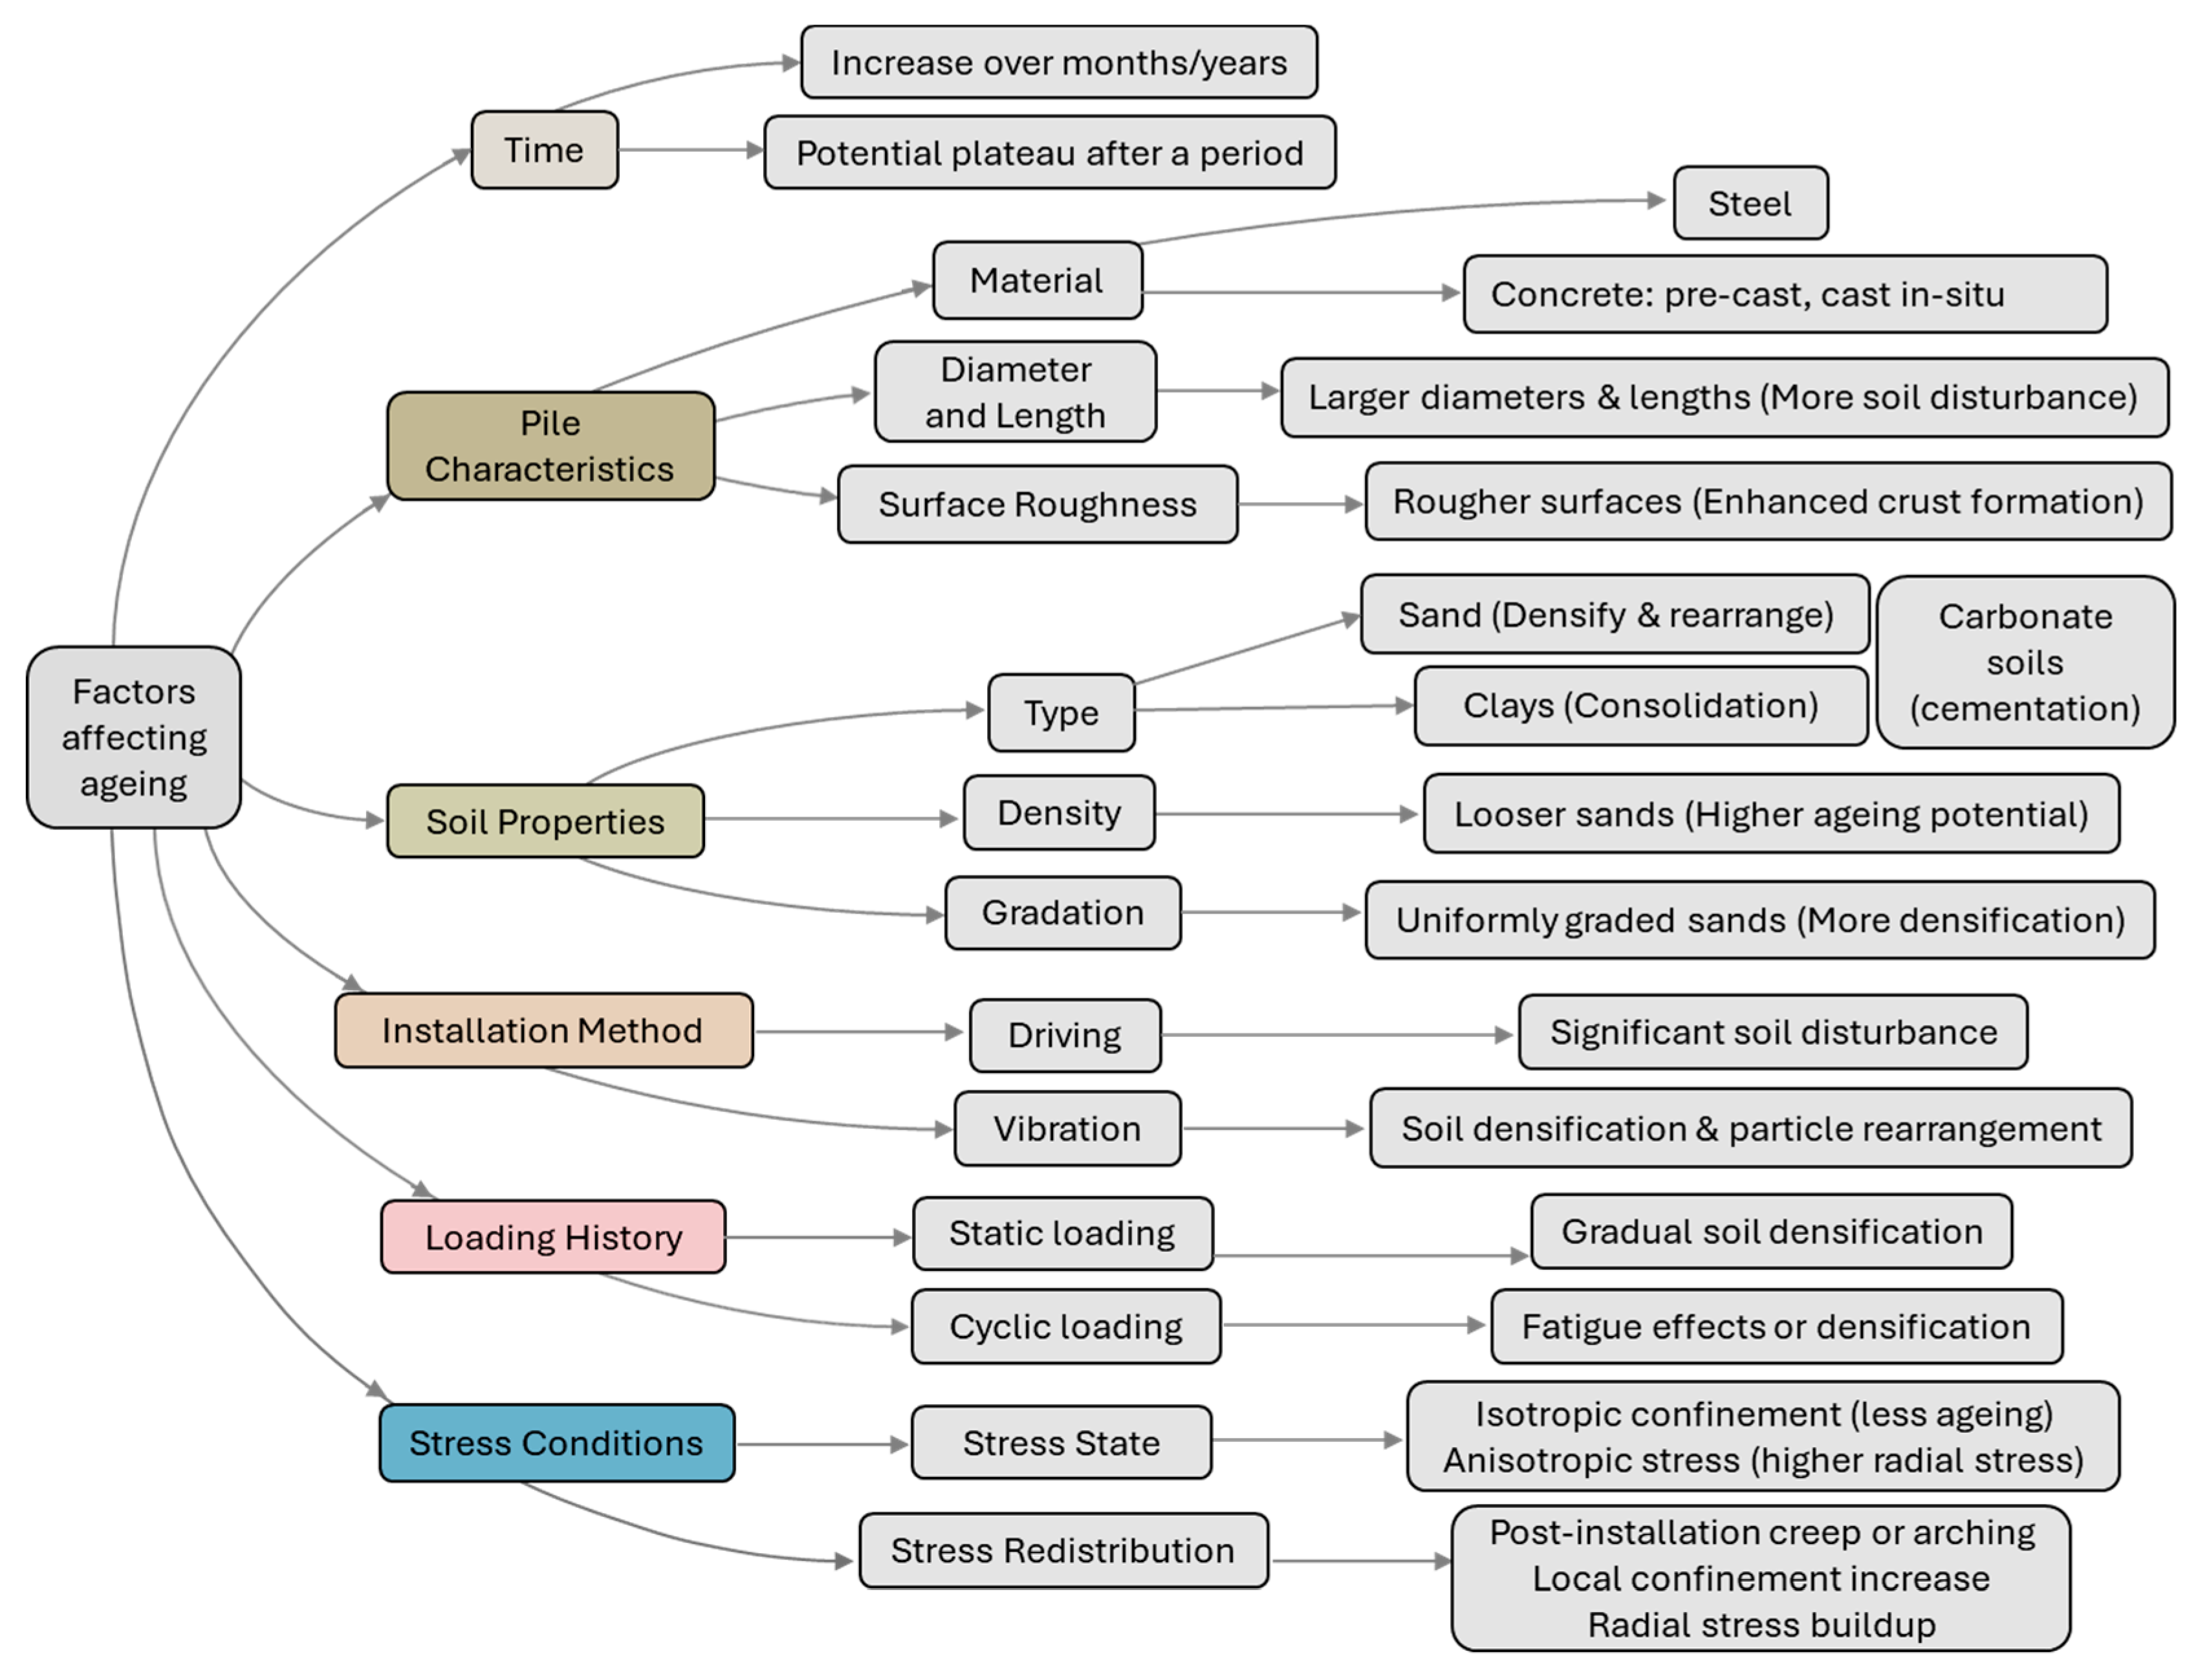
Figure 1. Conceptual diagram of factors influencing pile ageing—considered in the literature.
Geotechnics 05 00059 g001
Figure 2. Site layout showing pile test locations and borehole positions for site investigation.
Geotechnics 05 00059 g002
Figure 3. Results of sieve tests conducted on soil samples recovered from the boreholes near the experimental piles (A1, A2, B1, B2) at different depths below ground surface.
Geotechnics 05 00059 g003
Figure 4. Ground profile with SPT N-values plotted against depth.
Geotechnics 05 00059 g004
Figure 5. Sketches of the setup of the load test (Not to scale), including cross-sections A-A and B-B.
Geotechnics 05 00059 g005
Figure 6. Strain gauges installed at five different levels within piles B1 and B2—three gauges at each level. The yellow arrow indcates to one of the stain gauges. Section A shows the distribution of the gauges at each level.
Geotechnics 05 00059 g006
Figure 7. Photos taken during the piles’ construction and testing: (a) pile in preparation for the test, (b,c) preparation of pile reinforcement and strain gauge installation. (d) LVDT placed on the pile head.
Geotechnics 05 00059 g007
Figure 8. The load-displacement obtained from the uplift load test: (a) smaller piles A1 and A2, (b) larger piles B1 and B2.
Geotechnics 05 00059 g008
Figure 9. The applied uplift load distribution with depth—estimated from strain gauge—for piles B1 (35 days) and B2 (165 days).
Geotechnics 05 00059 g009
Figure 10. The variation of unit skin friction in piles B1 (35 days) and B2 (165 days) at different elevations.
Geotechnics 05 00059 g010
Figure 11. Hyperbolic fitting of uplift load test data using the Chin (1970) [48] method: (a) piles A1 and A2; (b) piles B1 and B2. The dashed lines are the fitted curves.
Geotechnics 05 00059 g011
Figure 12. Comparison of estimated uplift capacity and stiffness across tested piles.
Geotechnics 05 00059 g012
Table 1. Ground summary and properties at the piles’ locations.
Ave Depth BGL (m)Bulk Density (kg/m3)SPT (N60)Peak Friction Angle * (°)Description of Density of the Silty Sand
0–5.31426–16883–828–33Very loose to loose
5.3–8.51688–17918–2833–38 Loose to medium dense
8.5–14.41791–197228–4538–40Medium dense to dense
14.4–20.81972–2060>4540–42Dense
from 20.82060–2171>5042–45 Dense to very dense
* Based on SPT correlation (Peck et al. 1974 [37]) and direct shear box tests.
Table 2. Summary of pile details used for the uplift tests.
Pile InformationPile Set APile Set B
A1A2B1B2
Targeted structureSuspension towerHeavy-angle tower
Axial uplift design load (kN)10143757
Design pile length & Dia (m)16.0 & 1.021.0 & 1.8
Pile age after installation (days)3516535165
Max. applied uplift load (kN)2028202875147514
Embedded strain gaugesNoNoYesYes
Table 3. Summary of regression parameters and estimated ultimate uplift capacity for the piles.
Pile IDMaximum Applied Uplift Load, Pmax (kN)Slope α (1/kN)Intercept b (mm/kN)Estimated Ultimate Uplift Capacity, Pu (kN)
A120280.0003841720.0002529712603
A220280.0003585510.0001448462789
B175140.0001291990.0003535117740
B275140.0001258380.0003020437947
Disclaimer/Publisher’s Note: The statements, opinions and data contained in all publications are solely those of the individual author(s) and contributor(s) and not of MDPI and/or the editor(s). MDPI and/or the editor(s) disclaim responsibility for any injury to people or property resulting from any ideas, methods, instructions or products referred to in the content.