Article

Determination of the Unsaturated Hydraulic Parameters of Compacted Soil Under Varying Temperature Conditions

by
Rawan El Youssef
*,
Sandrine Rosin-Paumier
and
Adel Abdallah
LEMTA, Centre National de la Recherche Scienfique (CNRS), Université de Lorraine, 54000 Nancy, France
*
Author to whom correspondence should be addressed.
Geotechnics 2025, 5(2), 38; https://doi.org/10.3390/geotechnics5020038
Submission received: 1 May 2025 / Revised: 2 June 2025 / Accepted: 3 June 2025 / Published: 6 June 2025

Abstract

:
Heat storage in compacted soil embankments is a promising technology in energy geotechnics, but its impact on the thermo-hydraulic behavior of unsaturated soils remains insufficiently understood. This paper investigates coupled heat and moisture transfer in unsaturated soil under different thermal conditions using a new bottom-heating method. The thermo-hydraulic response is monitored along the soil column and compared to an isothermal drying test. Variations in suction and water content were analyzed to determine water retention curve and to derive unsaturated hydraulic conductivity using the instantaneous profile method. The water retention curve exhibited deviations under thermal conditions, with reduced water contents observed only at intermediate suctions. Unsaturated hydraulic conductivity decreased significantly at moderate suctions but increased by up to one order of magnitude at high suctions. Heat-driven moisture redistribution was examined through flux calculations, highlighting that vapor-phase transport contributed significantly, up to 88%, to the upward water migration. These findings contribute to a better understanding of thermo-hydraulic interactions in unsaturated soils, which is essential for optimizing thermal storage applications in compacted embankments.

1. Introduction

Most energy demand is still satisfied by using fossil fuels, which are limited and have a negative impact on the environment. The trend is therefore towards renewable, sustainable, and affordable energies with less environmental impact [1,2]. Among the various types of renewable energy, solar energy has great potential to provide part of the electrical and thermal energy required for human needs. However, the intermittent nature of solar energy requires effective storage solutions to ensure availability when needed, particularly across different seasons. In this context, seasonal thermal energy storage is considered as a solution for heat conservation during summer in a suitable environment, and for its retrieval to meet energy needs during winter [3]. Sunku Prasad et al. [4] indicated the efficacy of using geological media for thermal energy storage. Over the past decade, underground thermal energy storage facilities have been conceptualized in several countries, particularly using geothermal probes to store and retrieve thermal energy [5,6]. More recently, compacted soil embankments have gained attention as a flexible solution for thermal energy storage, taking advantage from compacted soils’ suitable thermal properties and availability [7], and offering the potential to integrate such systems into existing and future infrastructure projects.
The efficiency of a seasonal thermal storage system relies on a deep understanding of thermal and hydraulic properties of unsaturated soils subjected to temperature variations [8]. Indeed, the thermal properties of a soil, such as thermal conductivity and heat capacity, strongly depend on its water content and structure [9]. Studies have shown that thermal conductivity as well as heat capacity both increase with the dry density and water content of the material [1,10,11]. Boukelia demonstrated on a compacted loamy soil, that these thermal properties increase with the compaction water content, reaching a maximum value around the Proctor optimum [12]. On the wet side of the compaction curve, thermal conductivity decreases while heat capacity stabilizes at a plateau.
During the activation of thermal exchangers in embankments, significant thermal and hydraulic gradients develop. These gradients induce complex phenomena such as heat transfer, water movement in liquid and/or vapor states toward the surface layers [13], and modifications of the soil’s thermo-hydraulic properties. Numerous studies have demonstrated that temperature significantly affects the water retention curve of unsaturated soils. An increase in temperature reduces both the surface tension and viscosity of water, leading to a decrease in matric suction at a given water content. This relationship has been confirmed through experiments on various soil types, showing a shift in the retention curve toward lower suction values with increasing temperature. King [14] was the first to observe this impact. However, more specific studies only emerged from the 1950s onward. Gardner conducted experiments at temperatures between 0 and 50 °C, placing tensiometers in samples of sand, sandy marl, and organic soil [15]. More recently, Tang and Cui [16] showed that for compacted sodium bentonite tested at two different temperatures (20 and 80 °C), higher temperatures reduced the soil’s water retention capacity at the same suction level. This trend was also observed by [17] on unsaturated compacted silt.
The unsaturated hydraulic conductivity is also influenced by temperature. Romero [18] and Romero et al. [19] studied the hydraulic behavior of Boom clay under unsaturated conditions, and found it to be higher at 80 °C than at 20 °C for the same void ratio and degree of saturation. It is noteworthy that the effect of temperature was more pronounced at high saturation degrees, while it tended to be negligible at a saturation level lower than 75 ± 5%. The water viscosity decrease induced by heating facilitates the flow through the pore network, thereby increasing unsaturated hydraulic conductivity [20,21,22].
Among the various methods used to derive the unsaturated hydraulic properties of soils, the drying column test based on the instantaneous profile method was widely used (e.g.,: [23,24,25,26]). This method requires an appropriate technique for suction monitoring and the filter-paper method was proven to be accurate enough and cost effective [27]. This method is based on the hydraulic equilibrium between the soil and a filter paper, allowing for the determination of suction under unsaturated conditions by relying on a calibration curve of the filter paper. However, temperature can influence the measured suction values, requiring special attention when analyzing results. Haghighi et al. [28] conducted filter-paper calibration tests at 10 °C, 25 °C, and 50 °C using vapor equilibrium for suctions greater than 400 kPa and axis translation techniques for suctions below 400 kPa. They proposed a single calibration equation for Whatman No. 42 filter paper. Applied to kaolin clay, this equation revealed a decrease in water retention at higher temperatures. It was later validated by [29] for kaolin clay at 5 °C, 24 °C, and 45 °C, showing coherent trends. In a more recent study, Yang et al. [30] developed two specific calibration equations for 25 °C and 40 °C. They used them on three soil types: granitic-red soil, sandy soil, and debris, using the vapor equilibrium method for suction control. Their results, interpreted using the Burdine model, showed that higher temperatures led to increasing unsaturated hydraulic conductivity due to reduced water viscosity and surface tension.
In all above experimental studies, the thermal effects on unsaturated soils have been analyzed under homogeneous and controlled temperature conditions. However, in real operating conditions, soil embankment used to store heat will be subject to the temperature gradient, inducing transient heat transfer and phase change, impacting moisture distribution and the hydro-dynamic processes. In such conditions, the vapor phase plays a key role in mass transport by locally modifying evaporation and condensation conditions. Experimental studies, such as those by [31,32,33], have shown that this mechanism can significantly influence heat distribution in the soil by transporting a substantial amount of energy as latent heat of vaporization. Furthermore, around heat exchangers, the soil is expected to undergo repeated thermal and hydraulic cycles. To simulate such conditions, several laboratory-scale model tests have been performed, particularly on engineered barriers made of compacted bentonite. Experiments conducted by [34,35,36,37,38,39], applied temperature gradients to bentonite samples equipped with moisture and temperature sensors. Their results consistently showed water migration induced by temperature, with a decrease in water content near the heat source and an increase in more distant zones. However, these studies mainly focused on qualitative observations of moisture redistribution. Recent studies have begun to quantify the thermo-hydraulic processes occurring under thermal gradients. Liu et al. [26] performed a laboratory experiment on a loess soil column subjected to bottom heating and monitored the coupled thermo-hydraulic behavior over time. Their numerical analysis quantified the enhanced vapor diffusion and showed that vapor fluxes contributed significantly, up to 50%, to the total water loss in the early stages of drying. More recently, Gao et al. [40] extended this approach to sandy soil columns in the context of thermal energy storage. Using a large-scale setup with vertical thermal gradients, they observed evaporation near the heat source and condensation in cooler zones, leading to an increase in local moisture content due to vapor accumulation followed, after reaching a peak, by a decrease under prolonged heating. Their results confirmed that both the heat-source temperature and the initial moisture content were key factors influencing the direction and intensity of moisture transfer. While these results demonstrate the importance of vapor-phase transport, they developed and validated coupled heat and moisture transfer models, their study focused mainly on the calibration of model parameters (the tortuosity factor for vapor diffusion and an empirical evaporation parameter [26], temperature and water redistribution [40]), and did not explore the impact of heat-induced redistribution on the water retention curve or unsaturated hydraulic properties. Hence, there is still a clear need for more research focused on geothermal applications.
The present study proposes an experimental protocol designed for a more detailed analysis of the interactions between heat and moisture transfer, as well as the thermal effects on the soil’s hydrodynamic properties. A short-duration drying test, performed in a reduced-scale setup, is developed to allow for controlling the thermal gradient. During the test, temperature and suction are regularly monitored within the soil column. The effects on the retention curve and the unsaturated hydraulic conductivity will be analyzed, as well as the heat-induced moisture redistribution through flux calculations, including the role of the vapor phase in evaporation and condensation processes. The objective is to enhance understanding the thermo-hydraulic interactions in unsaturated soils from the perspective of optimizing thermal storage applications in embankments.

2. Materials and Methods

This section presents the tested soil, the sample preparation, and the experimental approach developed to investigate soil drying under isothermal and non-isothermal conditions. An initial test was conducted using stainless steel molds to ensure reliable measurements of water content and suction, based on a validated method from previous studies [27]. However, due to the high thermal conductivity of metallic molds, a new setup using plastic molds with smaller dimensions was designed. The lower thermal conductivity of plastic allows heat to be applied while limiting lateral losses. To validate this configuration, an isothermal test was first performed. Once validated, the setup was used to assess the impact of temperature through a non-isothermal drying test.

2.1. Soils Properties

The soil tested in this study was collected in the Paris region (France). After drying, pulverization, and sieving, subsequent X-ray diffraction analysis revealed that the soil is primarily composed of quartz (81%) with smaller amounts of dolomite (7%), calcite (5%), clay minerals (5%), and feldspath (3%). Particle-size distribution analysis showed that approximately, 20% of the soil particles are smaller than 2 μm, and 37% are smaller than 63 μm [41]. The main soil properties as determined by [12] on the fraction smaller than 2 mm are shown in Table 1.
The Atterberg limits of the soil were determined in accordance with [42] revealing a liquid limit (LL) of 30.7%, a plastic limit (PL) of 21.6%, and a plasticity index (PI) of 9.1. According to the Unified Soil Classification System [43] the material is classified as sandy lean clay. According to the French soil classification standard [44], it is classified as a low-plasticity clay (F1).
Boukelia et al. [45] identified the optimal compaction state for the soil that enhances heat storage efficiency at an optimum water content (w) of 16.3% and a dry density (ρd) of 1.72 Mg.m−3 (95% of the optimum proctor). Therefore, all samples tested in this study were compacted at this initial compaction state. In this condition, the water content at saturation is estimated to be 18.5% (wsat) and the saturated hydraulic conductivity ks was measured at 1.2·10−9 m/s [27].

2.2. Experimental Setup

2.2.1. Preparation and Assembly of the Reference Isothermal Drying Test

The wet soil was compacted in 10 stainless steel molding cells, at the initial compaction state determined in Section 2.1, each cell having a thickness of 20 mm and a diameter of 70 mm. Each sample was gradually saturated by adding small increments of water at the surface, with resting periods between additions to facilitate uniform infiltration through capillary action, then sealed separately for 24 h to achieve homogenization. To ensure the reliability of this method, a preliminary test was performed on similarly prepared samples, which were sectioned and analyzed for local water content, confirming a satisfactory degree of homogeneity. The 10 samples were superimposed to form column 1 with a height of 200 mm (Figure 1b).
A series of dry filter papers (Whatman 42, Cat No. 1442-055) protected by a pair of larger filter papers (Whatman 42, Cat No. 1442-090), (all sourced from GE Healthcare Life Sciences, Little Chalfont, UK), were interposed between the samples (Figure 1a). Regularly weighing the filter papers allows to monitor the soil matric suction profiles Ψh (h meaning the distance to the interface). After assembling the column, it was sealed for hydraulic equilibrium for at least 24 h at 20 ± 1 °C.

2.2.2. Preparation and Assembly of the Newly Designed Non-Isothermal Drying Test

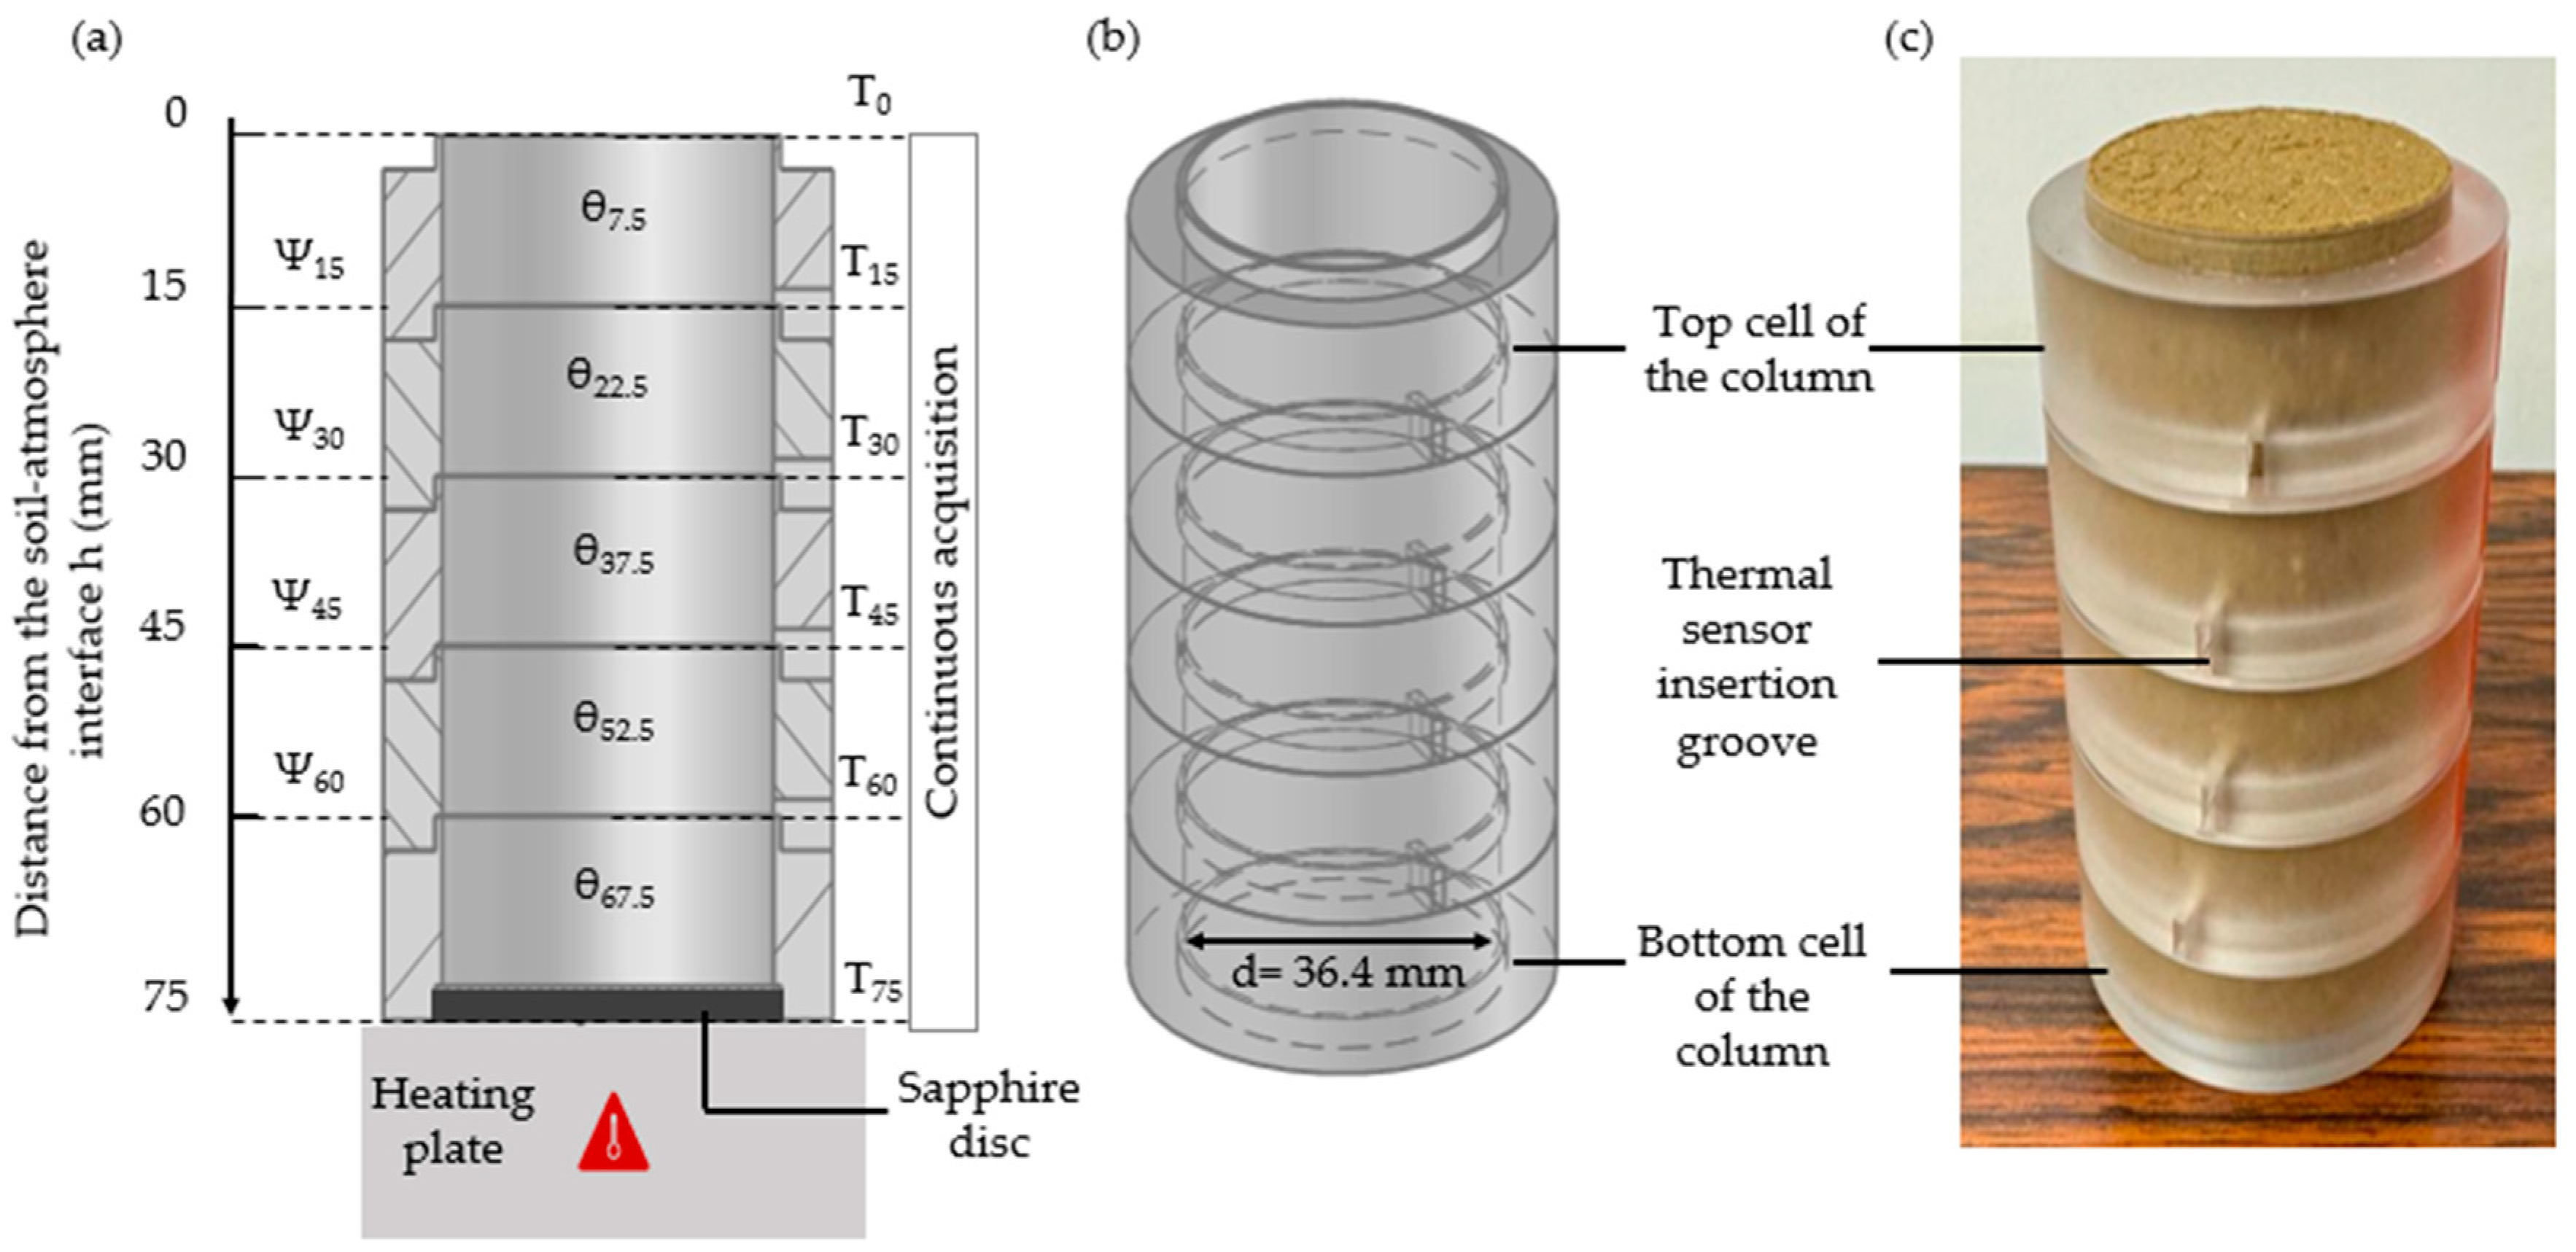
A new design (Figure 2a,b) was developed using smaller plastic cells with a thickness of 15 mm and a diameter of 36.4 mm to reduce the test duration. The plastic cells were designed with small grooves to introduce thermocouples, ensuring accurate temperature measurements within the soil column. Ten soil samples were compacted at the initial compaction state into the plastic cells. Five of these specimens were superimposed to form column 2, and the remaining five were superimposed to setup column 3 (Figure 2c). Both columns are 75 mm high. The filter-paper setup and sealing procedure used for column 1 were similarly applied to columns 2 and 3.
For non-isothermal test, column 3 was placed on a Decagon Temperature homogenization plate capable of controlling temperature in the range of −10 to 90 °C ± 1 °C. A sapphire disk with a diameter of 36.4 mm was placed at the bottom of the column for optimal heat conduction. Local temperature values were measured using Thermocouples sensors (RS Pro type K, 1/0.2 mm in diameter, ±1.5 °C precision) inserted between the cells on top of the calibration filter papers (T15; T30; T45; T60) (Figure 2a). One additional sensor measured the ambient air temperature (T0), while a second one monitored the temperature at the base of the column (T75) (between the sapphire disk and the heating plate), and a third sensor was placed directly on the heating plate to ensure its temperature stability. These sensors were connected to a computer system which allowed them to record and monitor the temperature in real time.

2.3. Experimental Program

This part presents the three drying tests (E1, E2 and E3) conducted on soil columns prepared as described in Section 2.1.

2.3.1. Isothermal Drying Tests (E1 and E2)

Tests E1 and E2, corresponding to columns 1 and 2, respectively, were performed under reference temperature conditions, measuring soil suction at a constant temperature of 20 ± 1 °C. After reaching hydraulic equilibrium, the top of each column was opened to allow drying. At different time intervals, columns were carefully disassembled, and the soil specimens as well as the filter papers were weighed and then repositioned. These measurements enabled monitoring of the evolution of volumetric water content and matric suction profiles (see Section 2.4 for details). Both tests were continued until stabilization of the measured soil water contents (84 days for test E1 and 11 days for test E2).

2.3.2. Non-Isothermal Drying Test (E3)

Test E3 was conducted under non-isothermal conditions. After hydraulic equilibrium, column 3 was placed on the heating plate maintained at 40 ± 1 °C, while the top of the column was exposed to the room environment at 20 ± 1 °C. Three measurements of soil specimen and filter papers were performed daily, respecting the minimum interval of 3 h. The temperatures at the filter papers levels were recorded all along the test using the thermocouples. The test lasted for 7 days, until the water content stabilized.
Table 2 summarizes the three tests conducted, highlighting the key conditions for each.

2.4. Soil Matric Suction Determination

The filter-paper method [46] is a simple and effective technique for measuring a wide range of soil suction. It is based on a calibration curve that relates the water content of the filter paper to the matric suction of the soil if a sufficient equilibrium time is respected. Preliminary tests concluded that a time interval of three hours was sufficient to reach equilibrium between the filter papers and the compacted soil used in this study. Similar preliminary tests should be performed to verify the response time for other soil types. The weight of the filter papers at each depth was measured using a precision balance with an accuracy of ±0.0001 g (METTLER AE200).
At a constant temperature (tests E1 and E2), suction can be calculated using the standard calibration equation obtained by [47] for initially dry filter papers (Whatman No. 40) (Equation (1)):
L o g Ψ = 5.3344 0.0882   w f     p o u r   w f < 39.8 % 2.4778 0.0165   w f   p o u r   w f 39.8 %
where Ψ refers to the suction (in kPa) and wf is the water content of the filter paper (in %).
In test E3, it is essential to account for temperature impact on the filter-paper calibration curve to ensure reliable soil suction measurements. The correction proposed by [28] is used (Equation (2)):
L n   Ψ = a + b . w f + c . T + d . w f . T 1 + f . w f + g . T + h . w f . T
where T is the temperature in Kelvin, and a, b, c, d, f, g, and h, with values presented in Table 2, are constant parameters (Table 3).

3. Results

3.1. Water Content and Matric Soil Suction Profiles

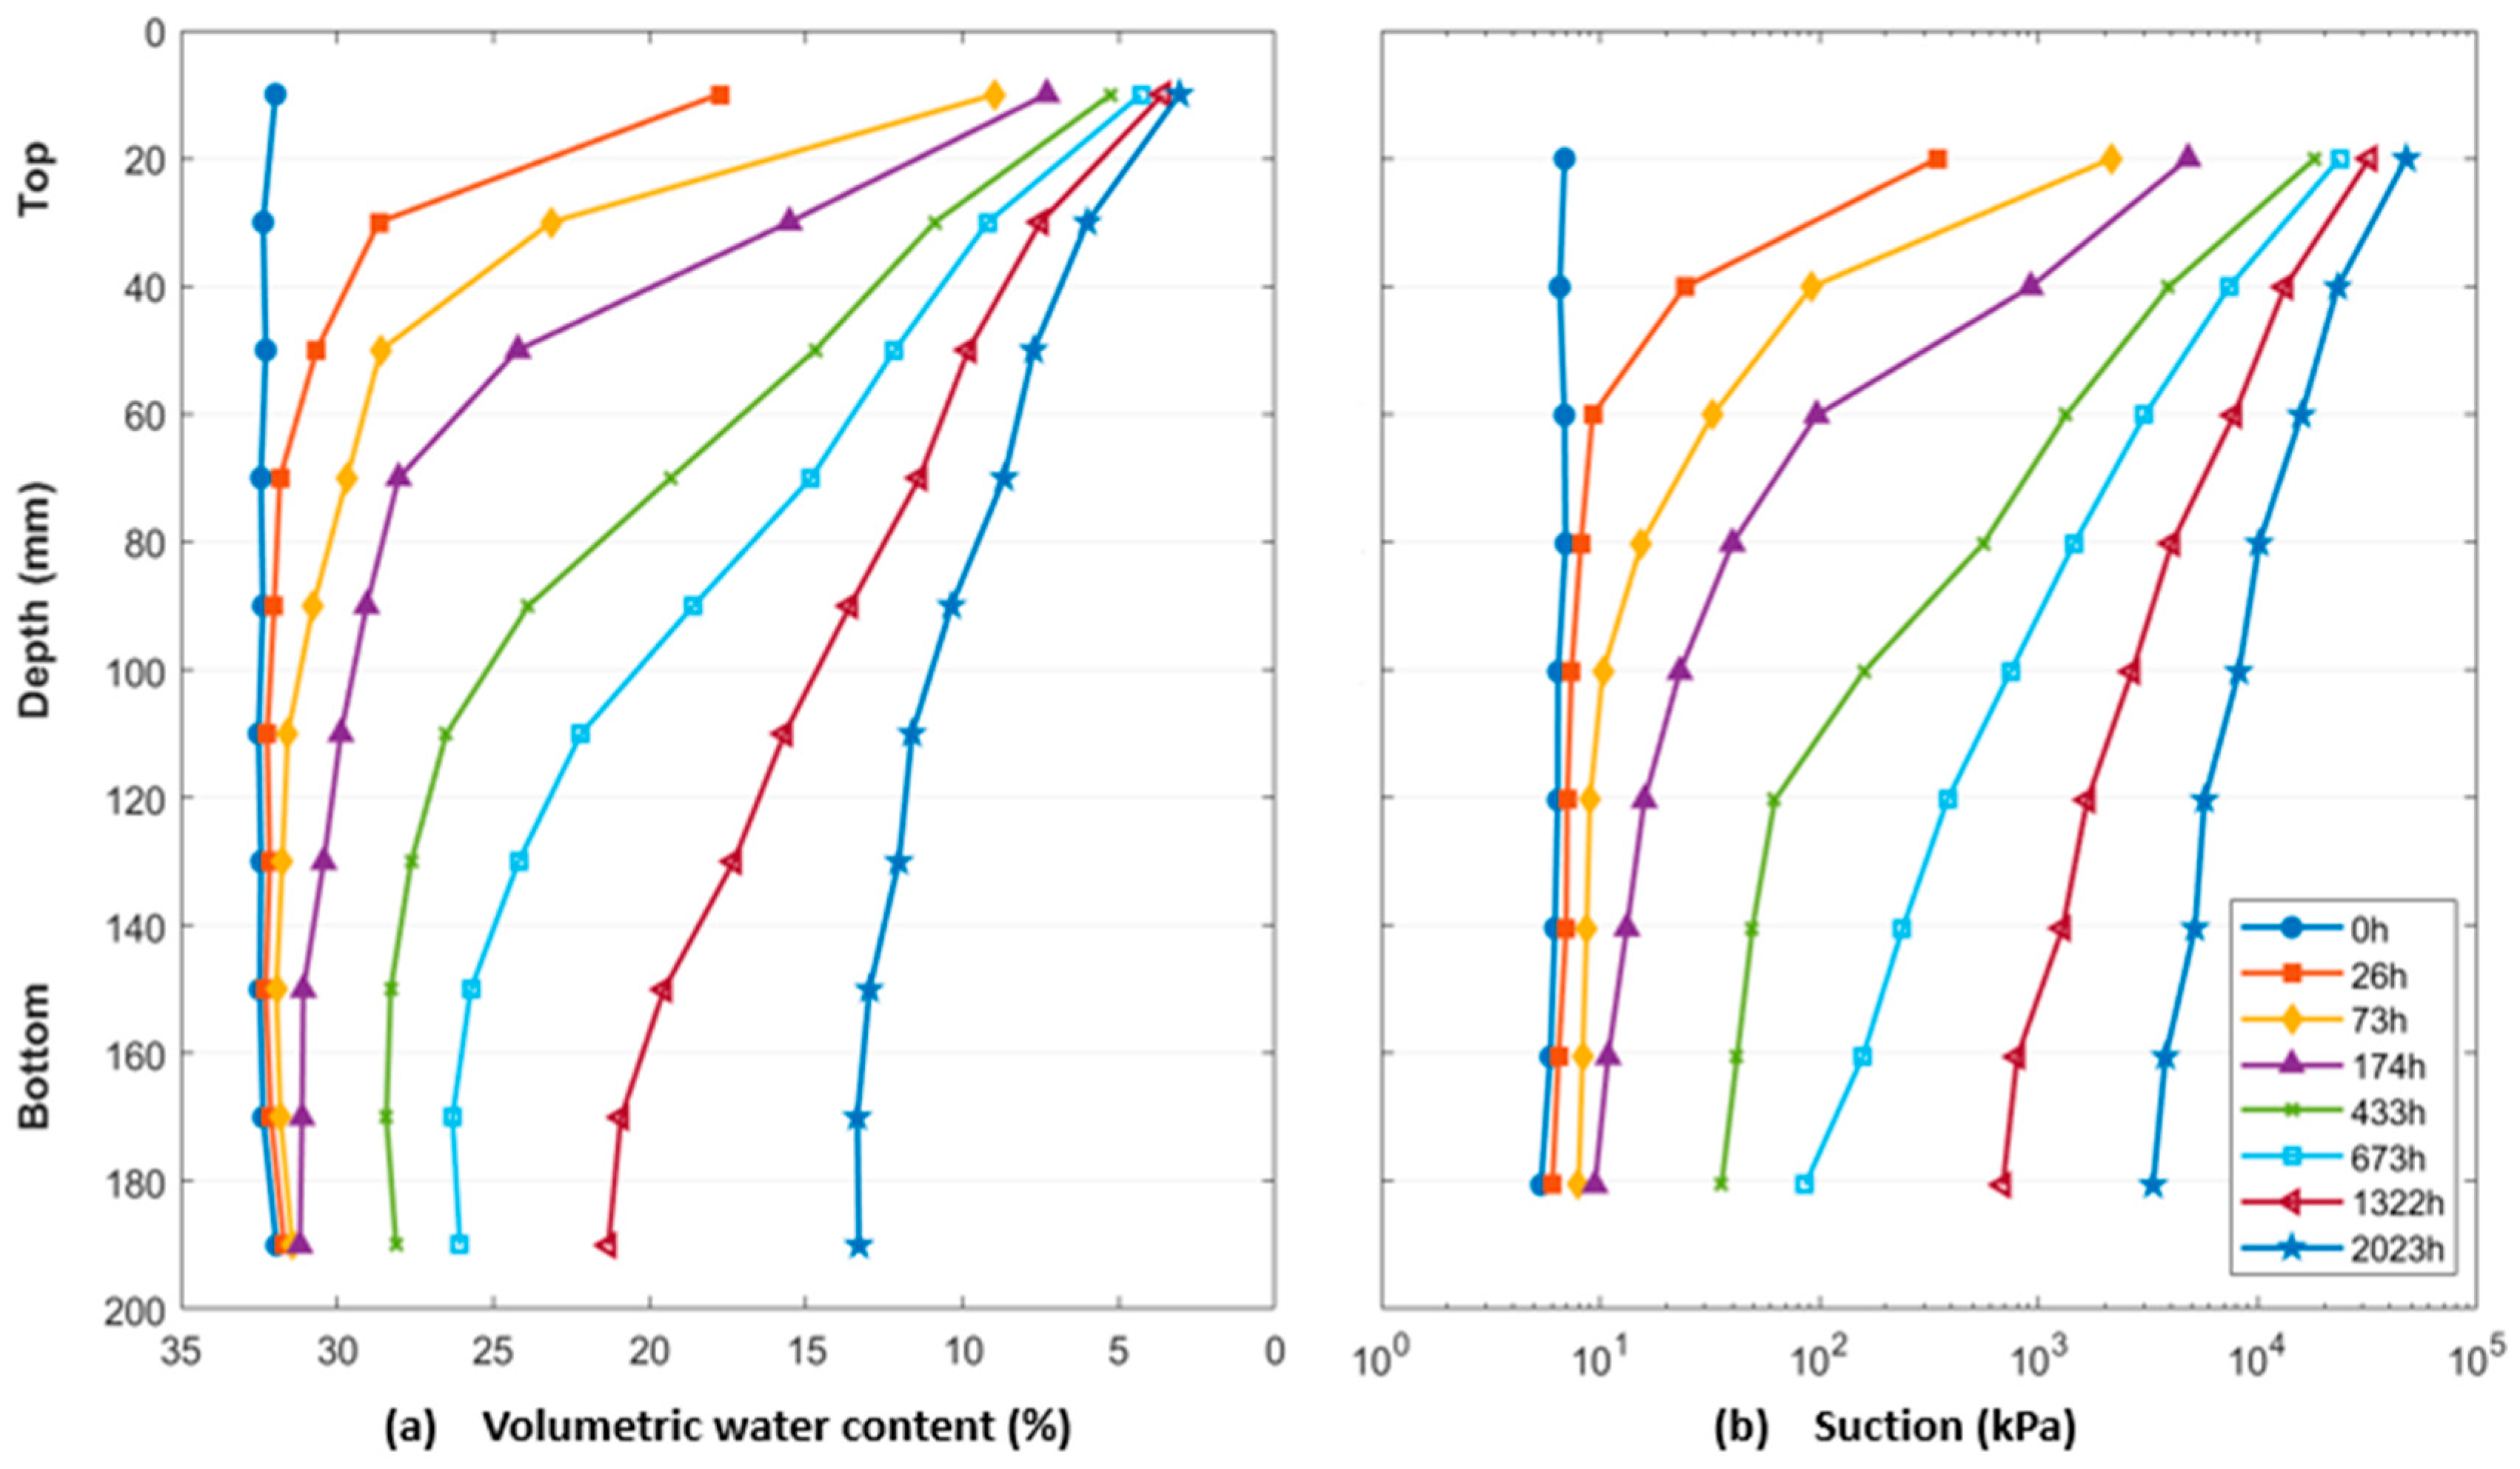
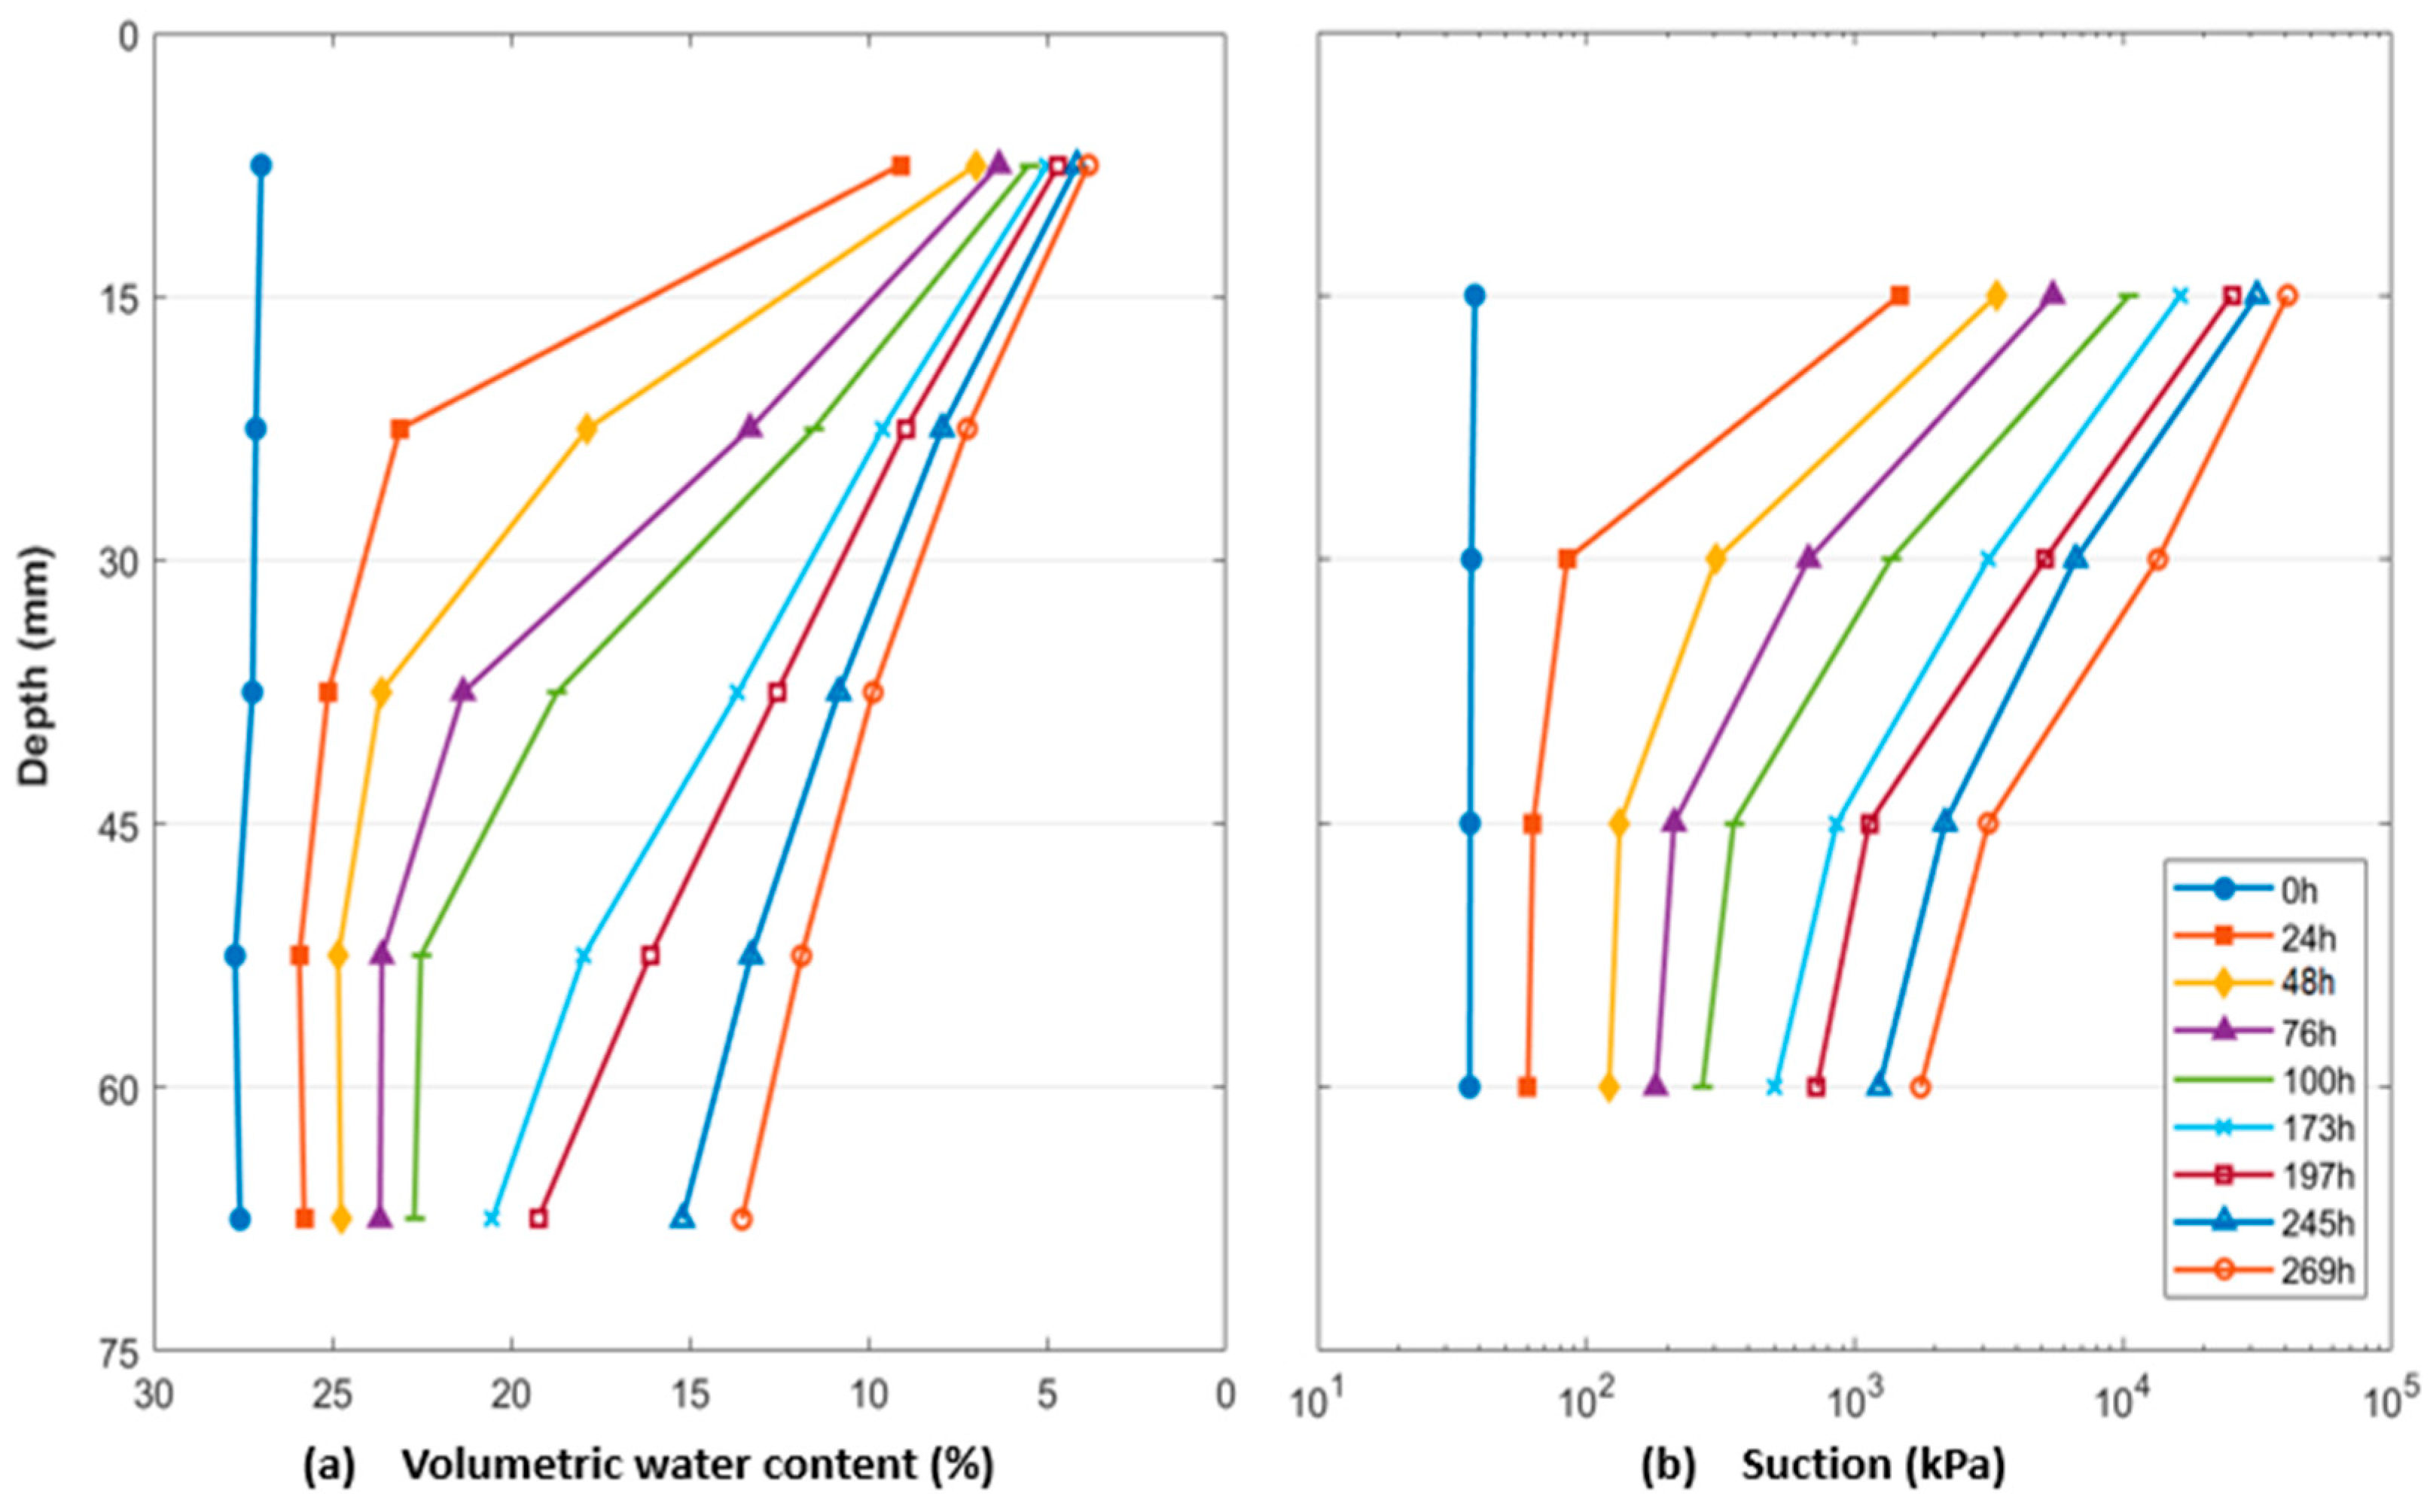
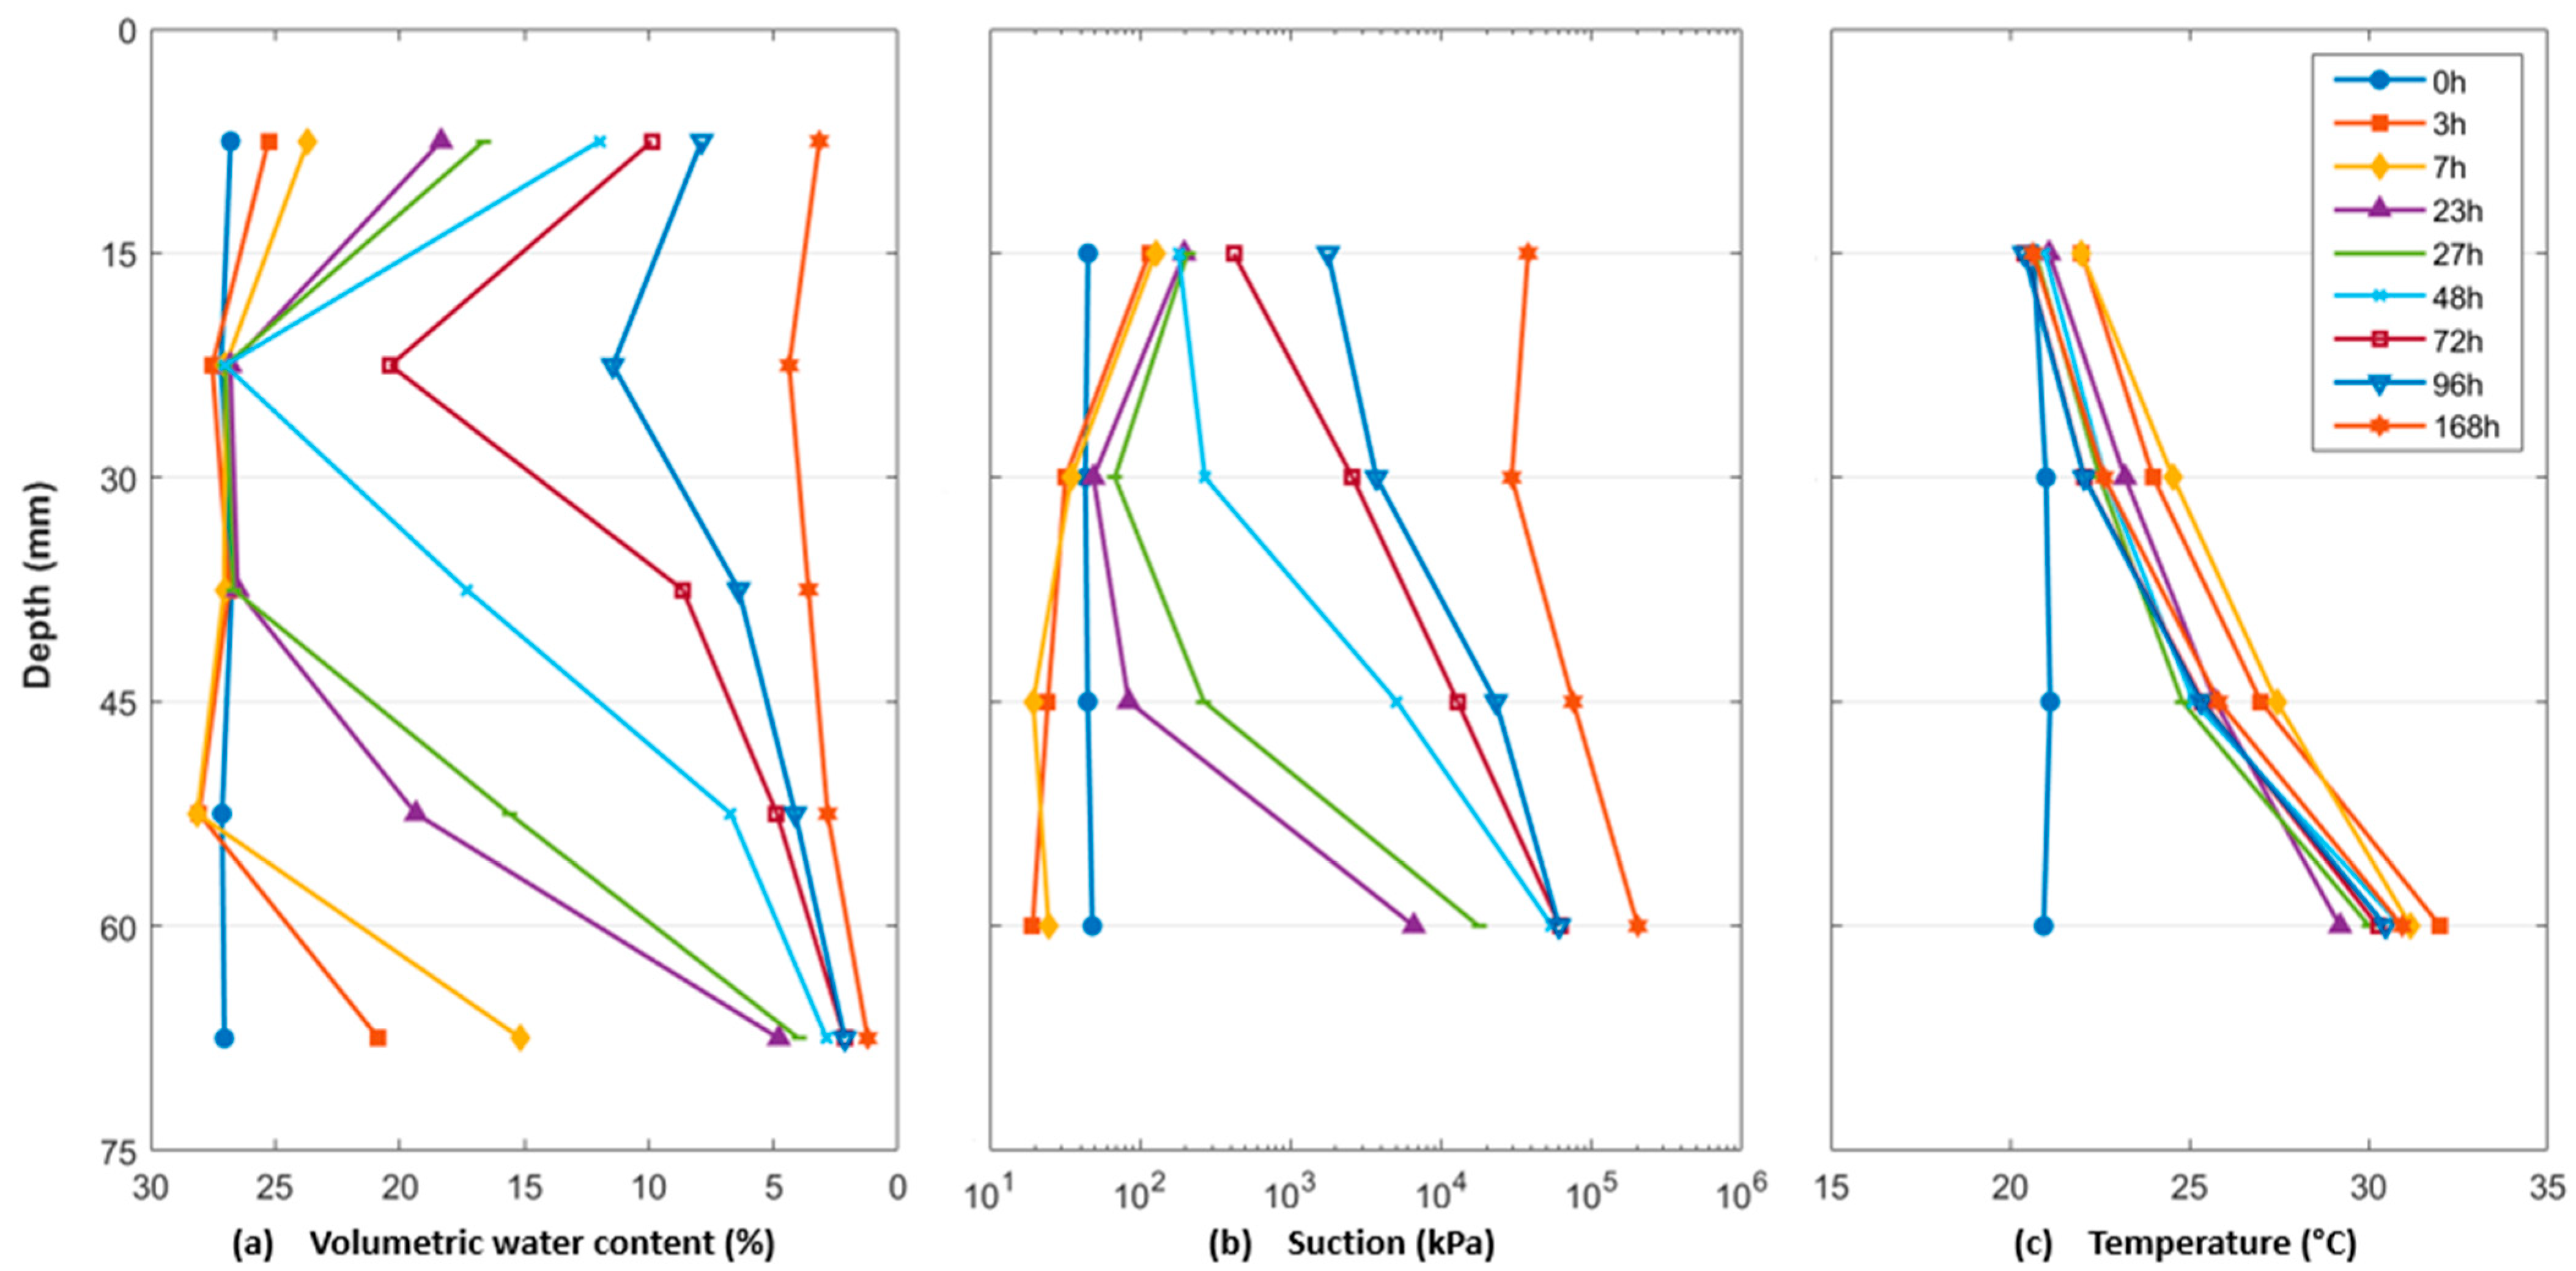
Figure 3, Figure 4, and Figure 5 present water content and suction profiles of tests E1, E2 and E3, respectively. For isothermal drying tests (E1 and E2), only a few selected profiles are presented for the sake of clarity (among the 30 and 14 profiles, respectively).
These results indicate a homogeneous initial state in columns. Column E1, initially saturated, presented and initial volumetric water content (θ) of 32.2 ± 0.3% and an initial suction (Ψ) of 6.5 ± 5 kPa. Columns E2 and E3, prepared at the initial compaction state without saturation, have a homogenous θ of 27.3 ± 0.4% and Ψ of 42.0 ± 6 kPa.

3.1.1. Isothermal Drying Tests

Considering isothermal tests E1 and E2, as the drying progresses, a suction gradient develops at the soil-atmosphere interface, and increases over time. At the top of the columns, evaporation is intense, leading to a rapid decrease in volumetric water content. In just 3 days, θ of the top cell drops from 32.0% to 8.9% in E1 test, whereas at the bottom of the column, θ remains close to its initial value. After 84 days, a marked gradient in water content is still significant with 3% at the top and 14% at the base.
The E2 test is shorter (only 11 days) but begins at lower saturation state and focuses on thinner samples. After 11 days, θ decreases from 27.0% to 5.8% at the top and remains 17.9% at the base.
These two tests show an intense evaporation at the top but a slow downward progression of drying.

3.1.2. Non-Isothermal Drying Test

Considering non-isothermal test E3, the water content profiles are clearly affected by the thermal gradient (Figure 5a). As the heating plate maintains a temperature of 40 °C at the base, a vertical thermal gradient establishes within the column after 3h between 32 °C (T60) and 22 °C (T15) (Figure 5c). These temperature measurements at each depth are used to estimate the soil matric suction shown in Figure 5b, based on Equation (2). The pore-water near the base of the column undergoes heating, increasing vapor pressure while transferring moisture topward. As a result, the intermediate levels, Ψ15, Ψ30, and Ψ45, show a slight decrease during the first 23h due to moisture accumulation in the mid-column. Ψ finally increases all over the column as the surface evaporation continues. At the base of the column, θ decreases sharply, reaching 2.1% after 3 days and 1.2% after 7 days. At the end of test E3, θ of all samples are below 4.5%, indicating significant over-drying as compared to E2. This complex phenomenon will be analyses in depth in following part. To ensure the repeatability of the non-isothermal test (E3), the experiment was repeated under the same conditions. The results obtained for water content, suction, and temperature profiles showed consistent behavior between the two tests, with minimal variations, less than 0.5% for water content. Furthermore, the water retention curves obtained are reasonably comparable. This confirms the reliability and repeatability of the measurements.

3.2. Water Retention Curve

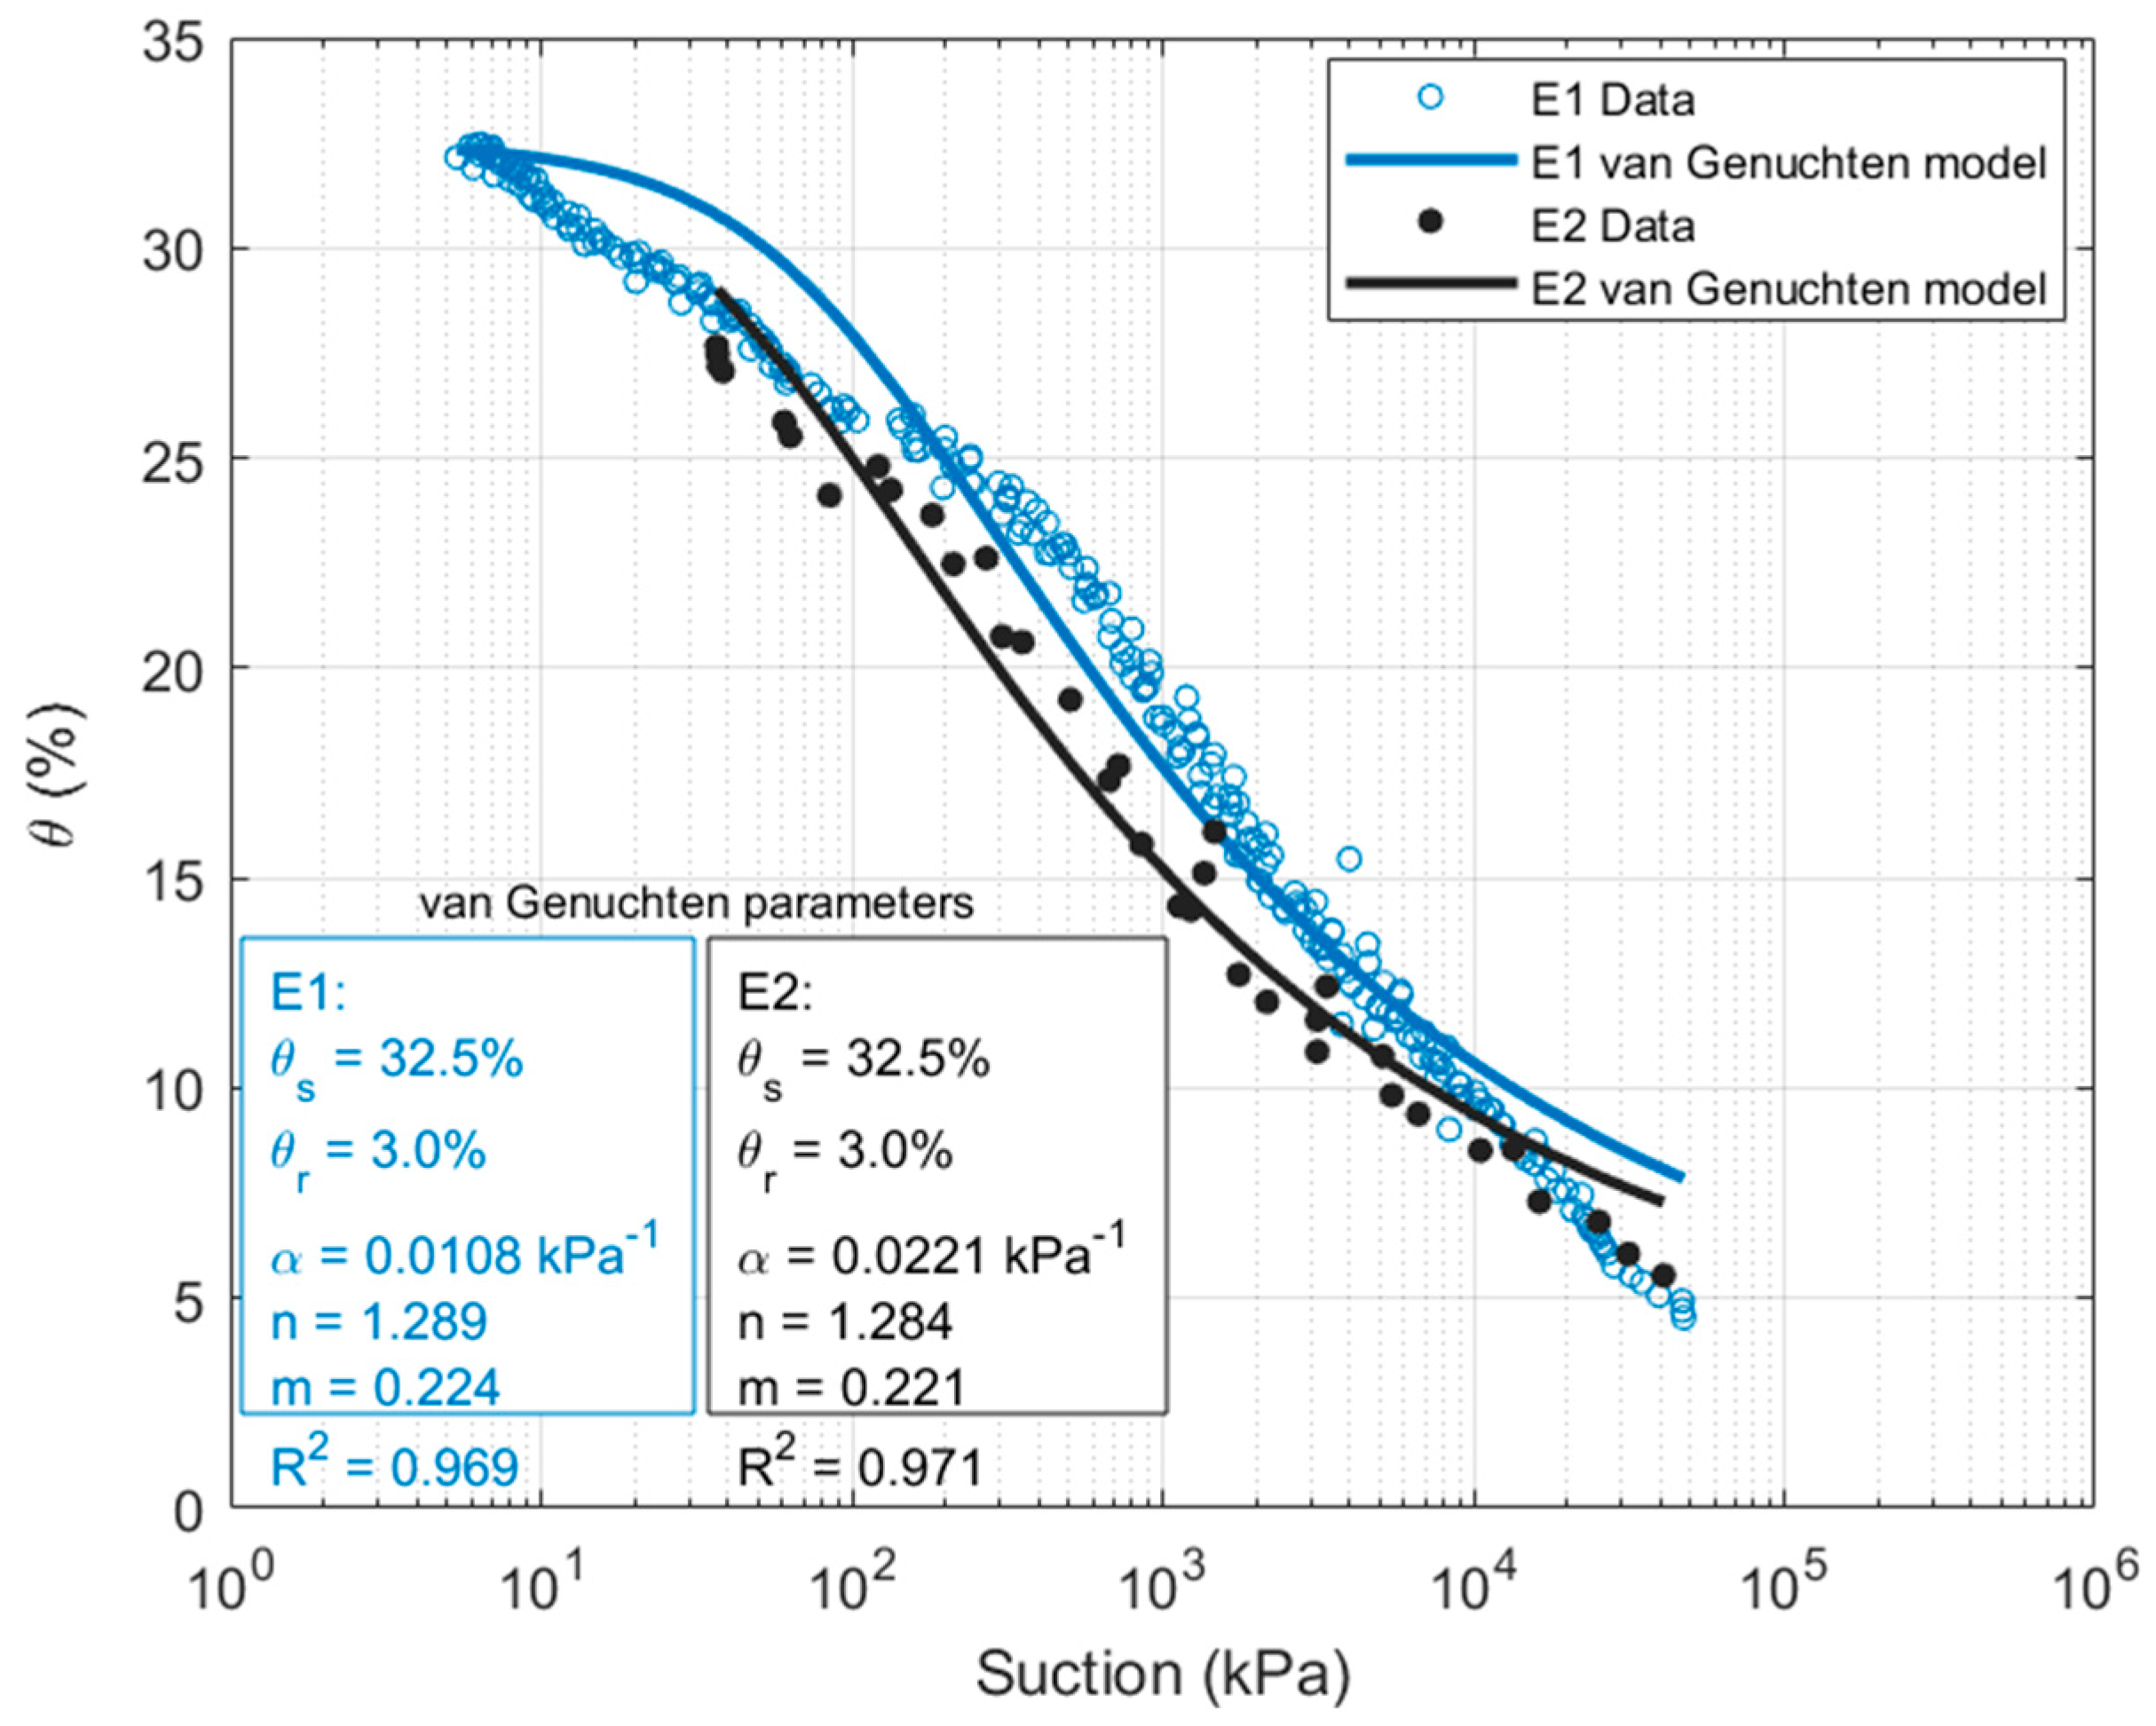
The suction and volumetric water content profiles allow for determining the soil water retention curves (SWRCs) (Figure 6). For each depth of filter paper, the water content value corresponds to the average of the water contents of the two adjacent soil samples in contact with it. The van Genuchten model [48] was chosen to fit these curves (Equation (3)).
S e = θ θ s θ s θ r = 1 ( ( 1 + | α Ψ | ) n ) m
where θs is the volumetric water content at saturation, and θr is the residual volumetric water content. The parameter α (kPa−1) can be related to the inverse of the air-entry pressure, while m and n (with the m = 1 − 1/n restriction) are shape parameters related to the pore-size distribution.

3.2.1. Isothermal Drying Tests

Figure 6 shows that the data from test E1 at 20 °C are reproduced well by the model for suctions between 100 and 10,000 kPa. The SWRC obtained from E2 is in accordance with the one obtained from E1 under similar isothermal conditions. This demonstrates the repeatability of the results and validates the newly developed molding cells. The new device allowed for reducing the test duration from 84 days to 11 days while covering the same suction range. The retention curves obtained in this study are also in agreement with the results by [27] on the same soil and under similar initial conditions.

3.2.2. Non-Isothermal Drying Test

The comparison between the water retention curves derived from tests E2 and E3 (Figure 7) highlights the impact of temperature on soil water retention behavior. The experimental points match well at low and high suction values, while a significant deviation is observed for intermediate suctions.
To investigate the reason of these deviations, the SWRCs were plotted as a function of depth (Figure 7). This representation clearly shows that the experimental points deviating at intermediate suctions (between 100 and 1000 kPa) correspond predominantly to measurement located near the soil surface. This deviation may be attributed to the transformation of a portion of the liquid water into vapor, leading to a moisture redistribution within the upper soil layers.

3.3. Unsaturated Hydraulic Conductivity

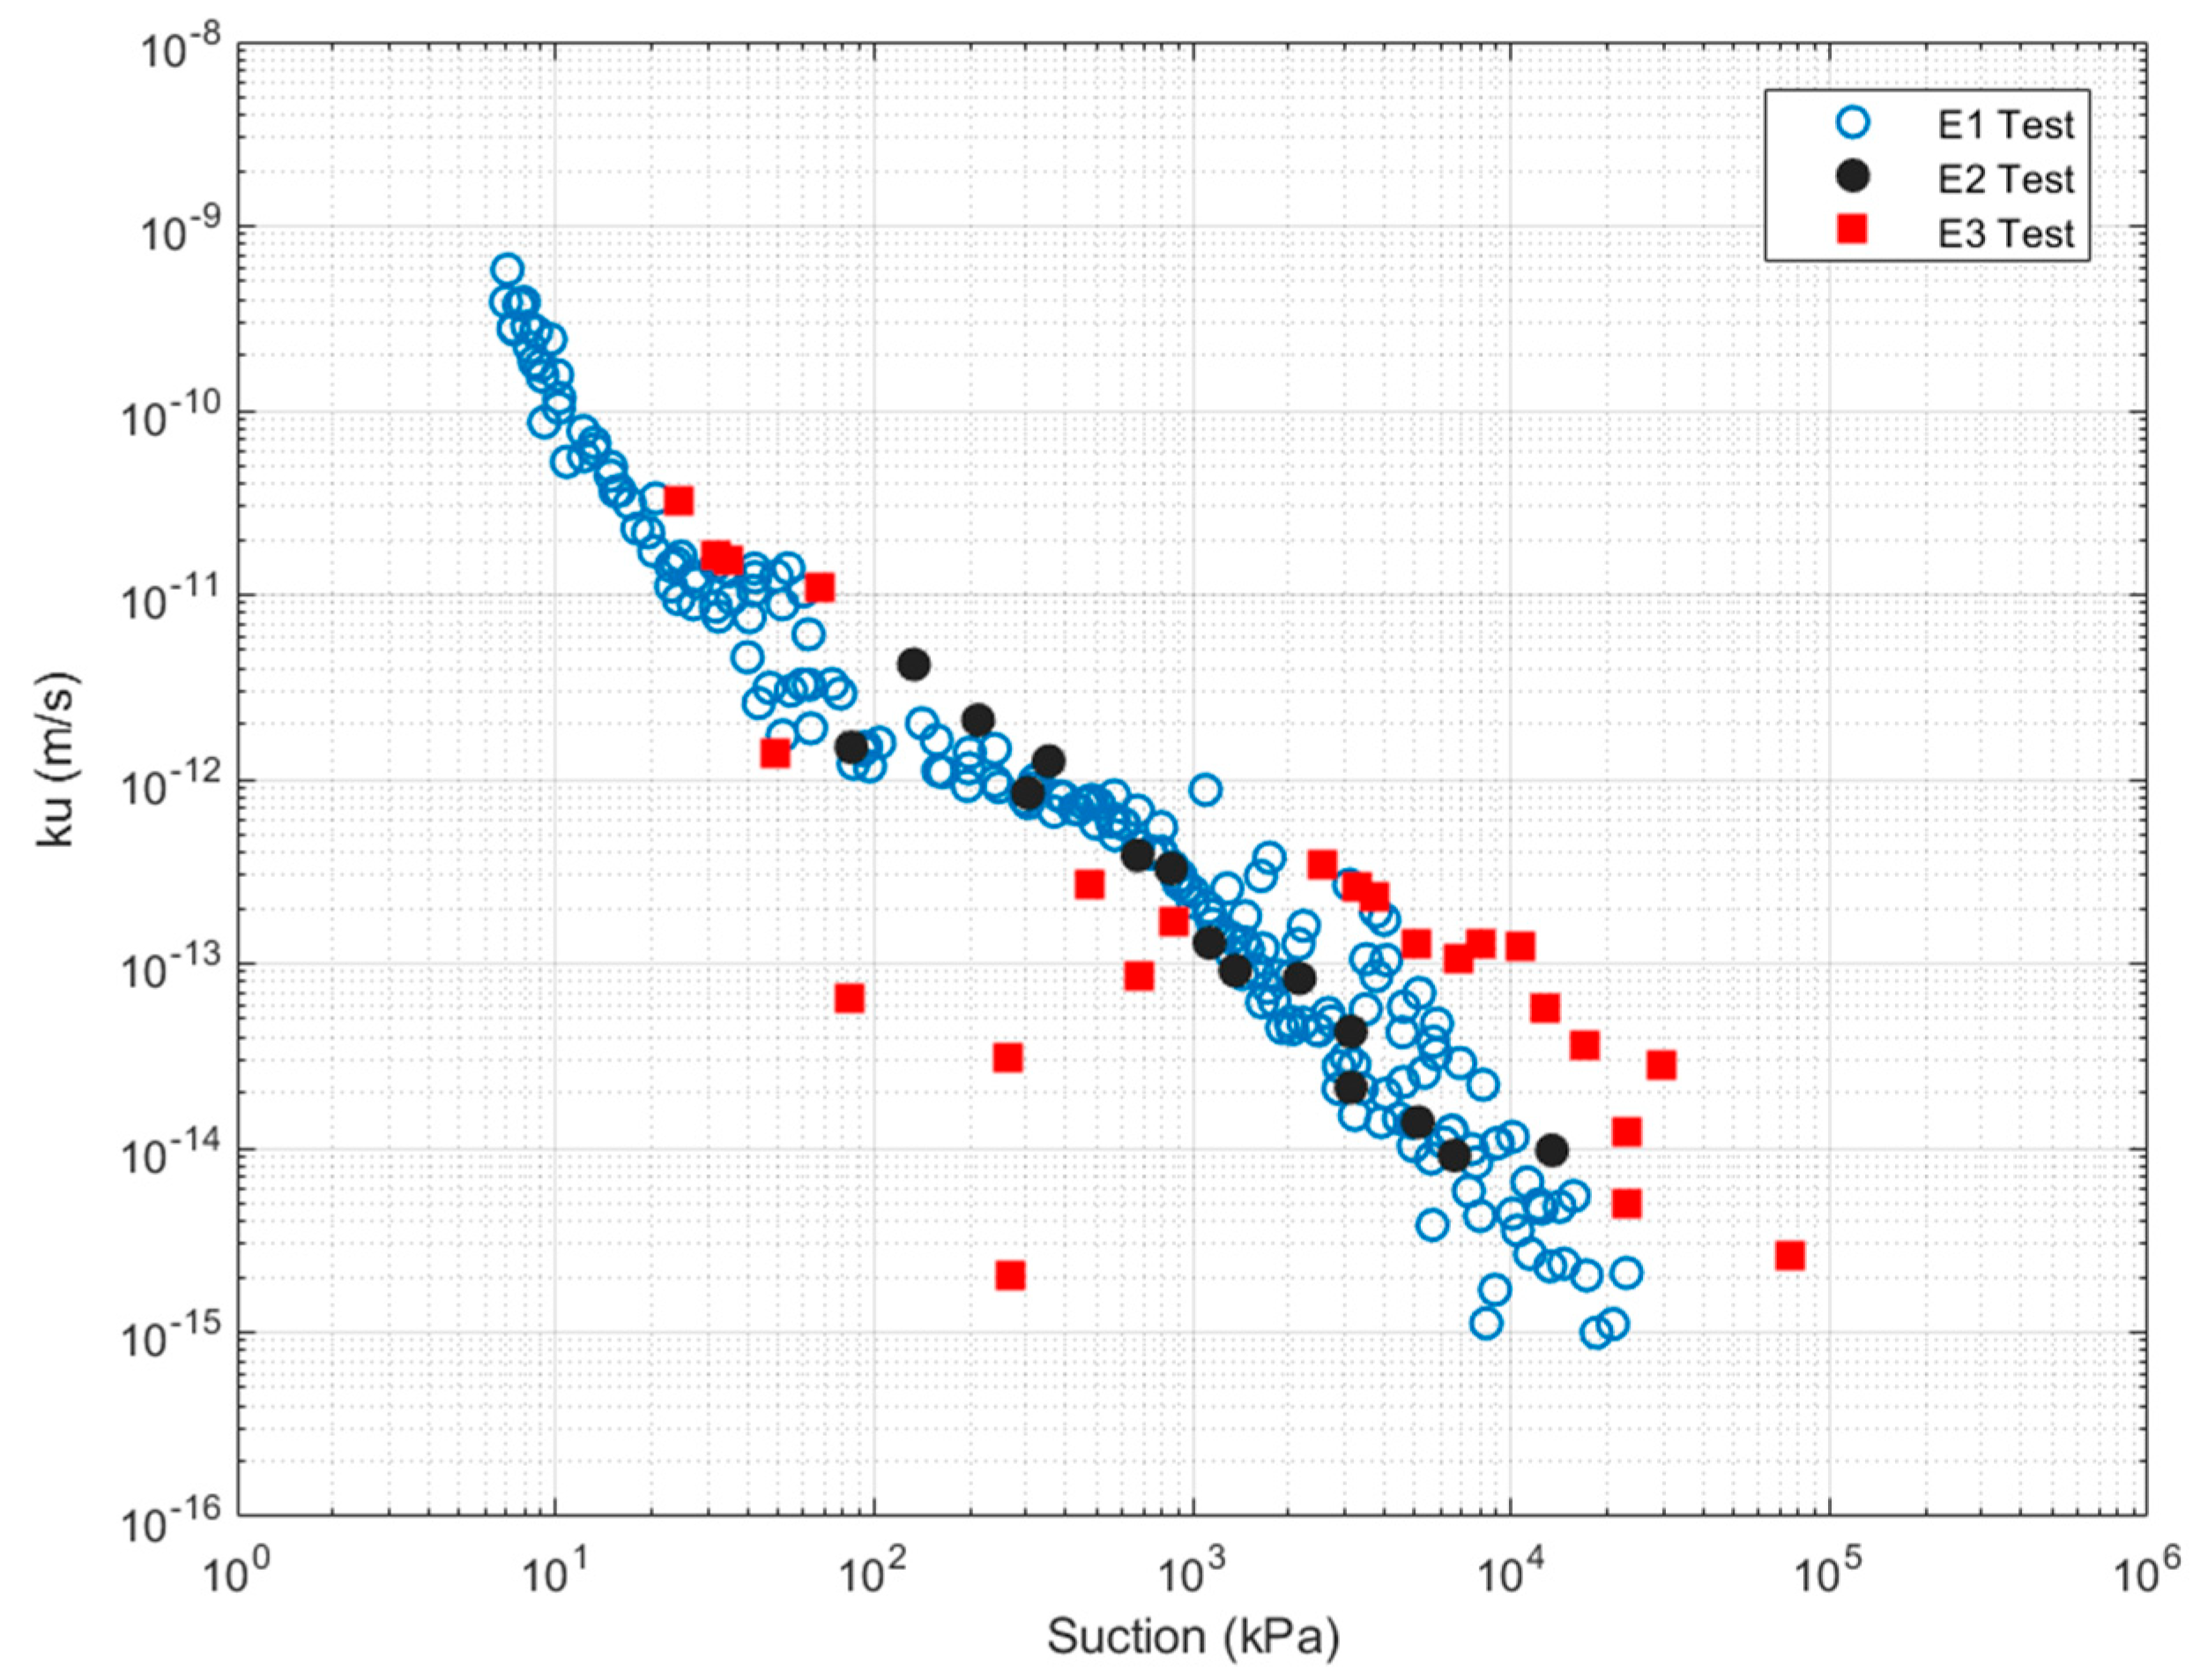
The water content and suction profiles allow us to define, respectively, the flow velocity (v) and the hydraulic gradient (dΨ/dz) on each interval. Then, the unsaturated hydraulic conductivity (ku) is determined for isothermal test E1 and E2 (Figure 8) using generalized Darcy’s law (Equation (4)):
k u = v d Ψ d z
The permeability is directly related to the viscosity of water. The higher the viscosity, the lower the permeability. Therefore, for non-isothermal test E3, the permeability of the soil is determined using Equation (5) according to the French testing standard [49].
k u = k u T ° η T η 20 °
With
η T η 20 ° = e x p ( 2.44   ×   10 2 20 T + 1.8   ×   10 4 20 T 2 + 2.5   ×   10 6 20 T 3
where ku is the permeability coefficient at 20 °C; ku(T) is the permeability coefficient at temperature T; η20 is the dynamic viscosity at 20 °C; ηT is the dynamic viscosity at temperature T.
The unsaturated hydraulic conductivity curves obtained from E1 and E2 tests under the same isothermal conditions are consistent demonstrating acceptable repeatability of the results.
The evolution of hydraulic conductivity under the influence of temperature gradient (E3) (Figure 8) reveals, however, the complex interaction between vapor transfer and suction variations within the column. Hydraulic conductivities in suctions ranging from 10 to 100 kPa correspond in fact to negative hydraulic gradients. As the initial suction is 45 kPa (Figure 5b), all the lower values correspond to the wetting of intermediate samples due to vapor transfer.
At high suctions, water flow is enhanced by vapor transfer. This phenomenon is particularly evident near the base of the column where the soil becomes very dry and the liquid phase nearly disappears. In this regime, vapor diffusion becomes the dominant mechanism for moisture transport. Combined liquid–vapor transport (E3 test) is more efficient than liquid-dominated flow (E1 and E2 tests). For suctions higher than 1000 kPa, ku for E3 test is significantly higher than ku for E1 and E2 tests.
At intermediate suctions, between 100 and 1000 kPa, the evolution is more complex. Non-isothermal drying is quite different compared to the isothermal conditions. The applied thermal gradient appears to reduce the unsaturated hydraulic conductivity. In this suction range, vapor plays a role in the redistribution of water.

4. Discussions

4.1. Comparison of Water Content and Suction Profiles Under Isothermal (E2 Test) and Non-Isothermal (E3 Test) Conditions

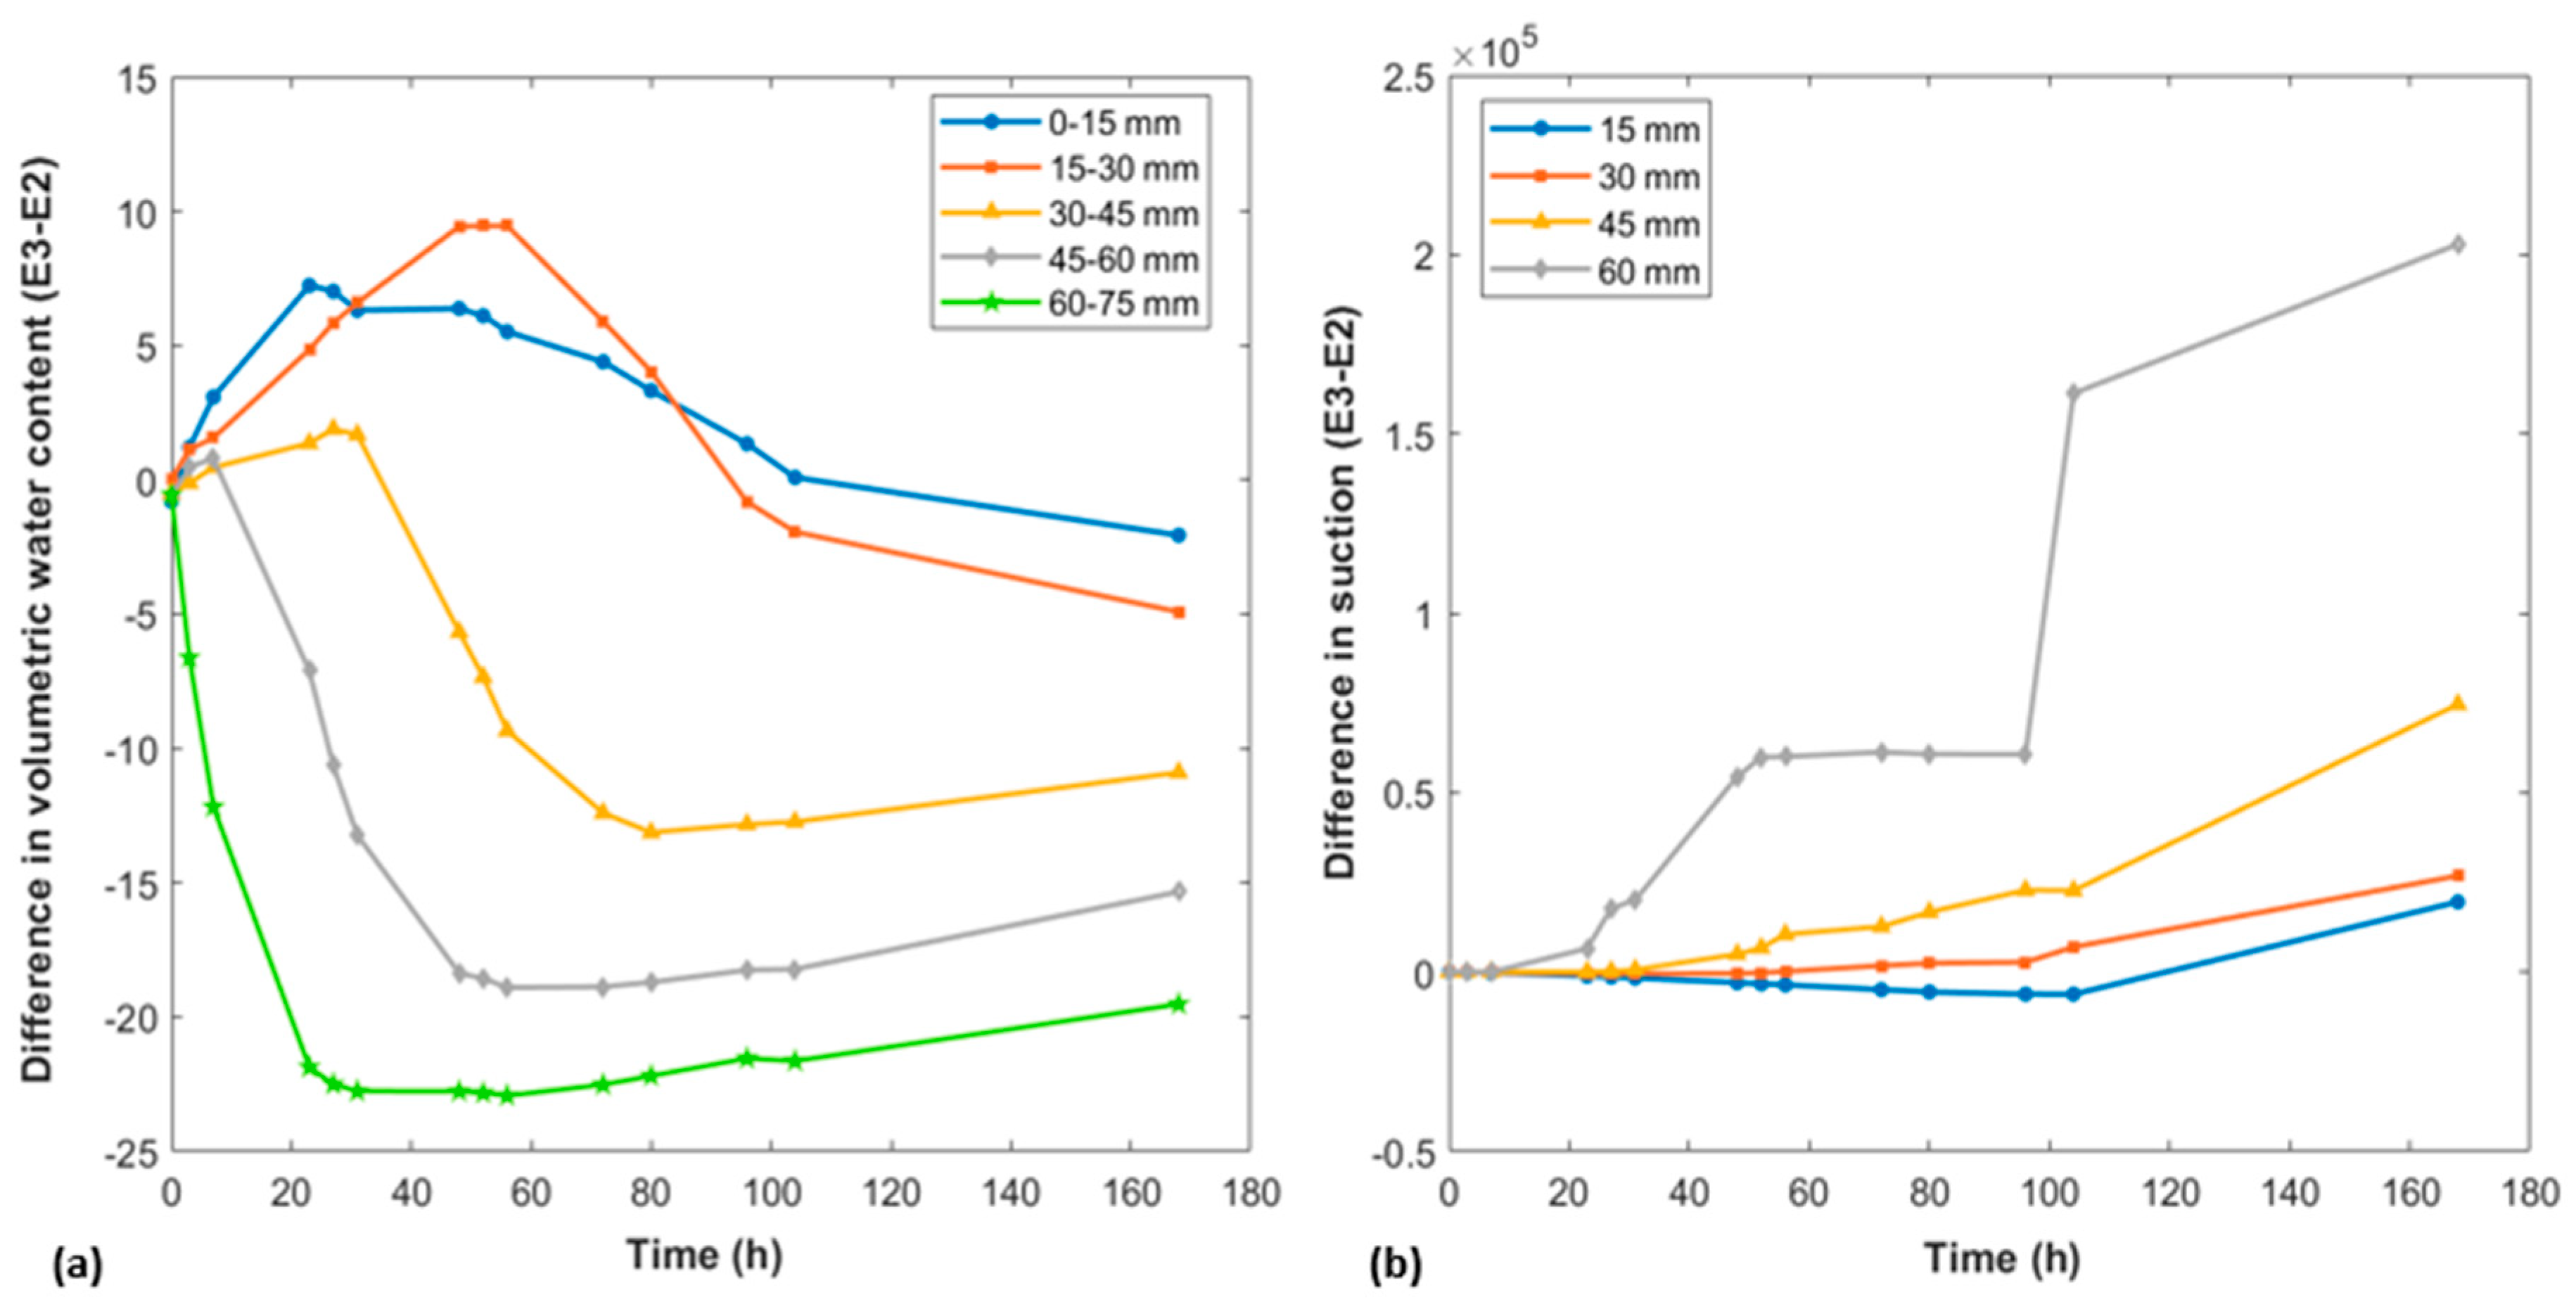
To understand the influence of thermal gradients on moisture redistribution within the soil column, the suction and water content profiles at different depths are first compared by calculating the differences in water content and suction between tests (E3−E2) over time (Figure 9). In the bottom of the columns, ∆θ60–75 and ∆θ45–60 are negative, showing that water content in test E3 decreases more rapidly than in test E2, due to the more intense evaporation induced by the heating. The consequent reduction in water content directly causes a faster increase in suction at 60 mm in depth. Moving upwards, the moisture dynamics change at the top of the column (∆θ0–15 and ∆θ15–30). The water content in test E3 remains higher than in the test E2 during the first 100 h, explained by the condensation of water vapor transported from the lower layers. This vapor accumulation, driven by the thermal gradient from the base to the top of the column, temporarily increases the water content, reducing the suction values, contrasting with test E2, where suction increases more rapidly at this zone due to faster drying. These differences in drying dynamics between E2 and E3 result in a deviation of the water retention curve, particularly in the upper zones.

4.2. Water Flow Dynamics in Isothermal (E2) and Non-Isothermal (E3) Tests

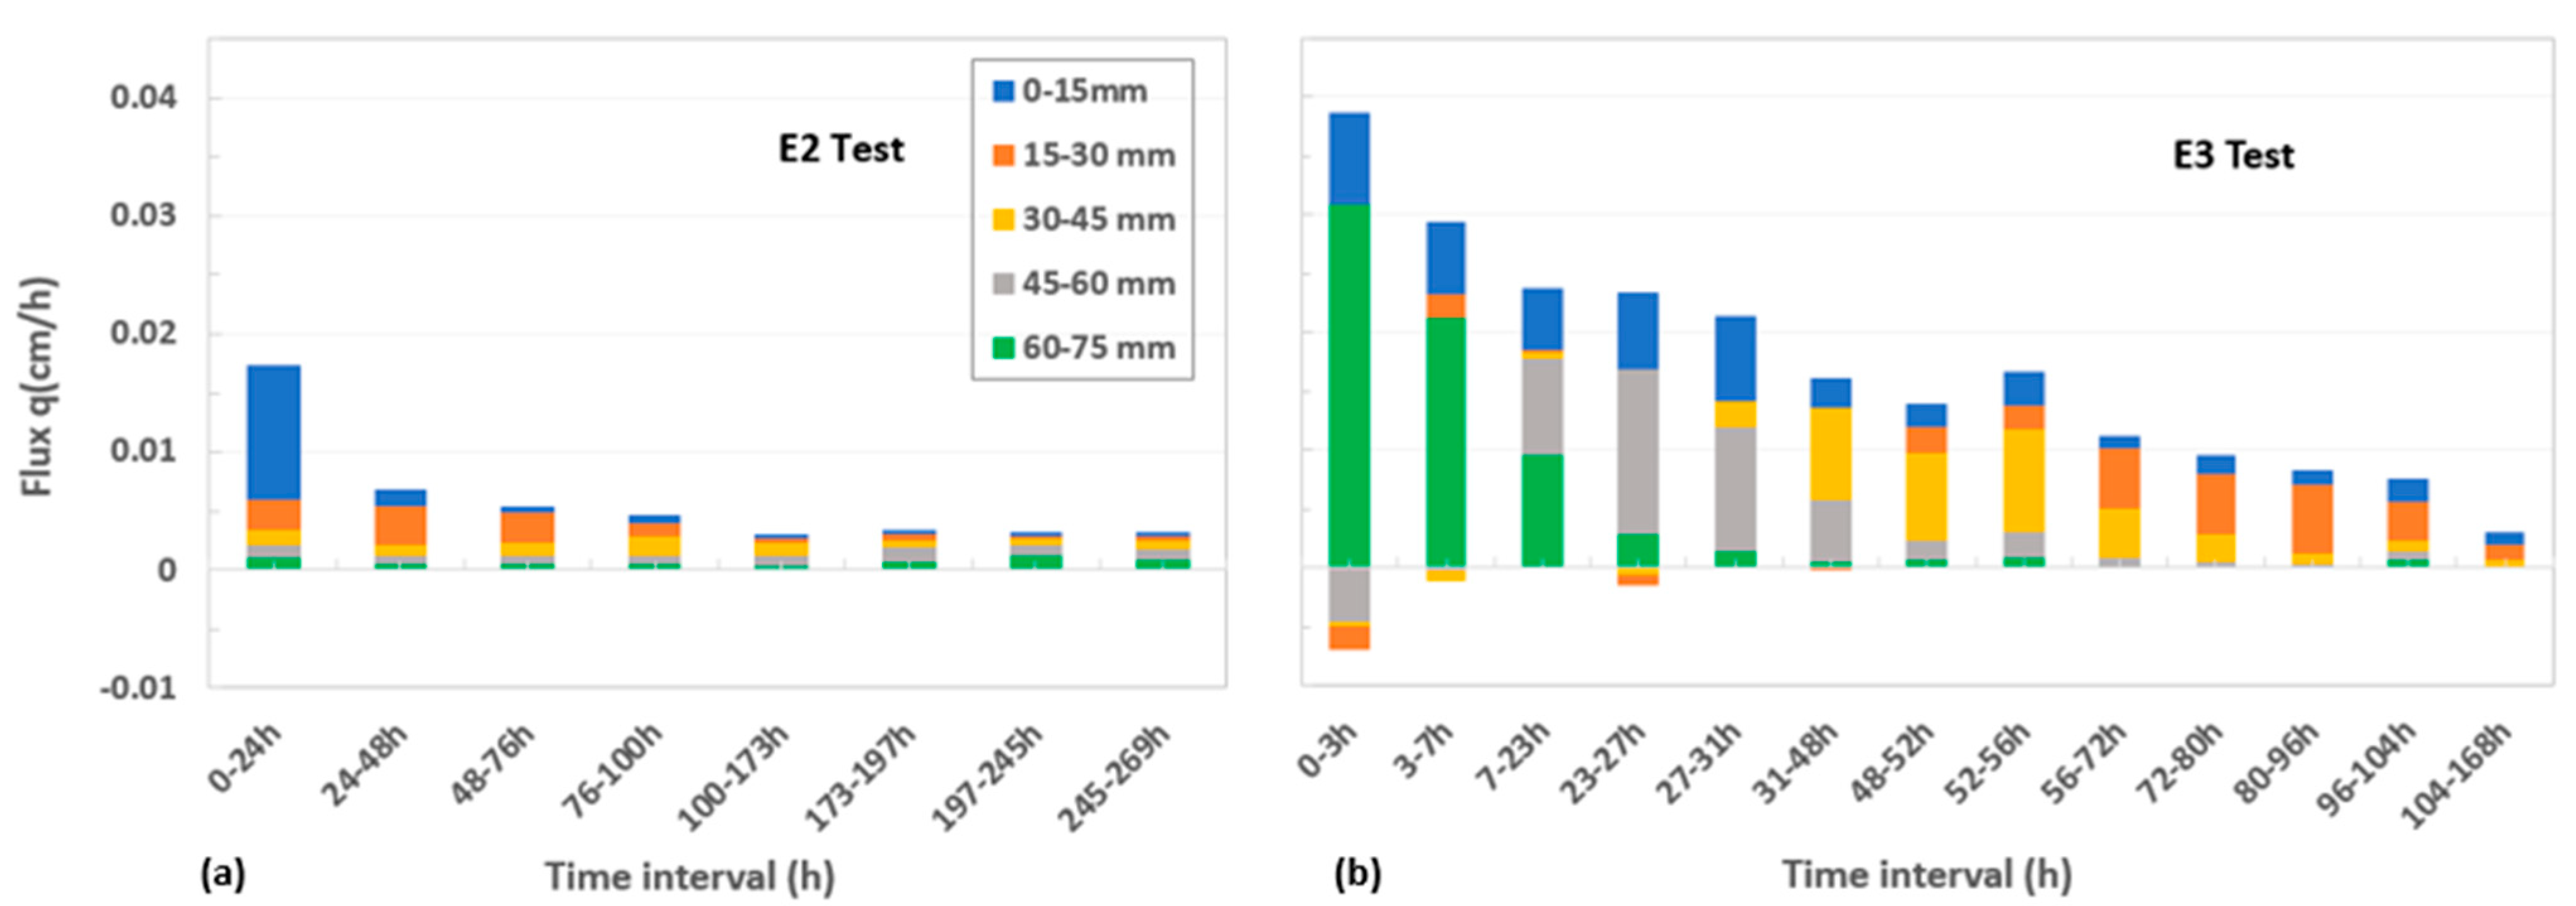
As the thermal gradients directly affect the movement of water through the soil column, it is important to examine the rate, direction, and overall flow dynamics. The water flux q was calculated directly from the change in water mass measured for a given sample in column 2 and 3 between two successive measurement intervals ∆t (h), using Equation (6):
q = m ρ . A .   t
where Δm is the change in water mass (g), ρ is the water density (g/cm3), and A is the cross-sectional area of the sample (cm2).
At 20 °C, water transfer is solely controlled by surface evaporation. The drying is progressive, starting from the top down to the base of the column. The deeper layers retain higher moisture content for a longer period and only begin to be affected after about 70 h of drying. This phenomenon varies in intensity depending on the distance from the soil–atmosphere interface (Figure 10a).
The non-isothermal test E3 allows for the observation of the effect of the vertical thermal gradient on the water flux. Temperatures increase gradually and stabilize after approximately 2 to 3 h, with an average of T60 = 30.5 °C and T15 = 20.8 °C (Figure 5c). This thermal gradient induces an energy disequilibrium within the soil, which tends to be balanced over time through an upward thermal flux. This thermal gradient does not only affect the distribution of heat, but also plays a role in the dynamics of water within the column. It leads to the appearance of a water flux (Figure 10a) from the early hours of the test, measurable in the first three intervals, while no flux is measured during the same period in the E2 test (Figure 10b). Thus, it promotes evaporation at the base of the column and the transport of water in the form of vapor to the upper layers, as mentioned by [13].
The water flux induced by temperature alters the measured suctions. At intermediate depths, the suctions decrease during the first 24 h, indicating a supply of water in liquid or vapor form at these levels. Some of this water evaporates at the soil–atmosphere interface, and the rest is temporarily trapped in the middle of the column. The central part also begins to dry out as evaporation becomes more significant and the moisture in the deeper layers decreases. At the surface, although evaporation is more intense due to direct exposure to ambient air, the drying process remains gradual. This is due to the movement of water, which partially counteracts evaporation and slows down the surface moisture loss. This phenomenon highlights the importance of the thermal gradient and evaporation processes in controlling soil moisture, as well as the complexity of the interactions between these different phenomena.

4.3. Vapor Pressure Evolution and Redistribution Mechanisms

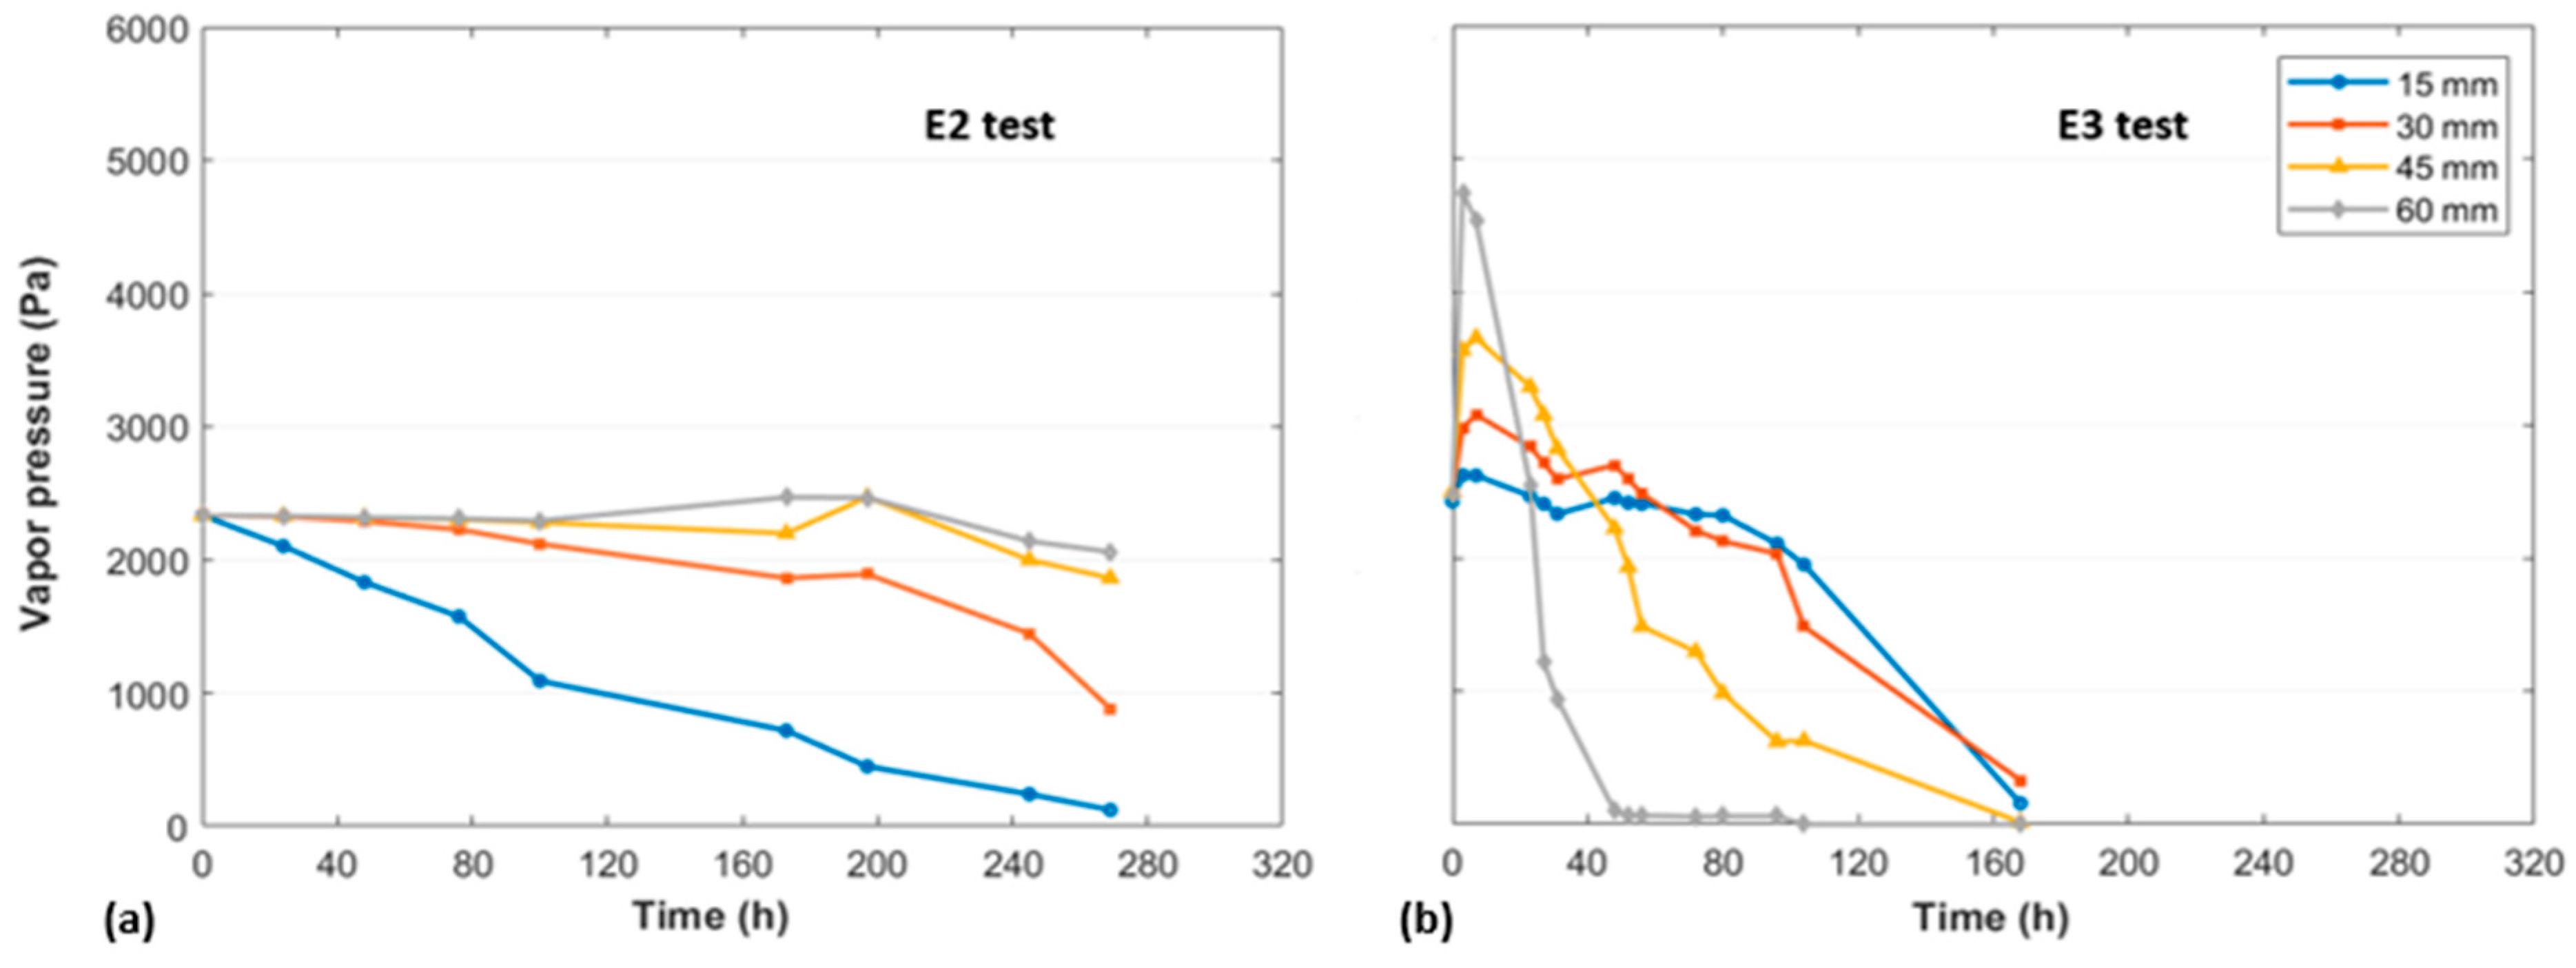
To further interpret the observed differences in water content, suctions and moisture fluxes between E2 and E3 tests, it is important to consider the impact of vapor-phase flow. This process affects both evaporation dynamics and the hydraulic properties of the soil especially under non-isothermal tests. In this context, the vapor pressure at each depth and corresponding temperature is calculated for E2 and E3 tests (Figure 11). The saturated vapor pressure Pv,sat (T) (kPa) at a given temperature (T in degrees Celsius) between 0 and 60 °C can be calculated using the Teten’s equation [50]:
P v , s a t T = 0.6108 exp ( 17.27   T T + 237.3 )
To account for the effect of capillary suction on the vapor pressure in the soil, the Kelvin equation is used (Equation (8)):
P v ( T ) = P v , s a t T exp ( Ψ   M w g R   T )
where Pv is the vapor pressure (in Pa, use Pv,sat (T) in Pa), Ψ is the suction expressed as an equivalent height of a water column (m), Mw is the molar mass of water (kg/mol), g is the gravitational acceleration (m/s2), R is the universal gas constant (J/mol.K) and T is the temperature (in K).
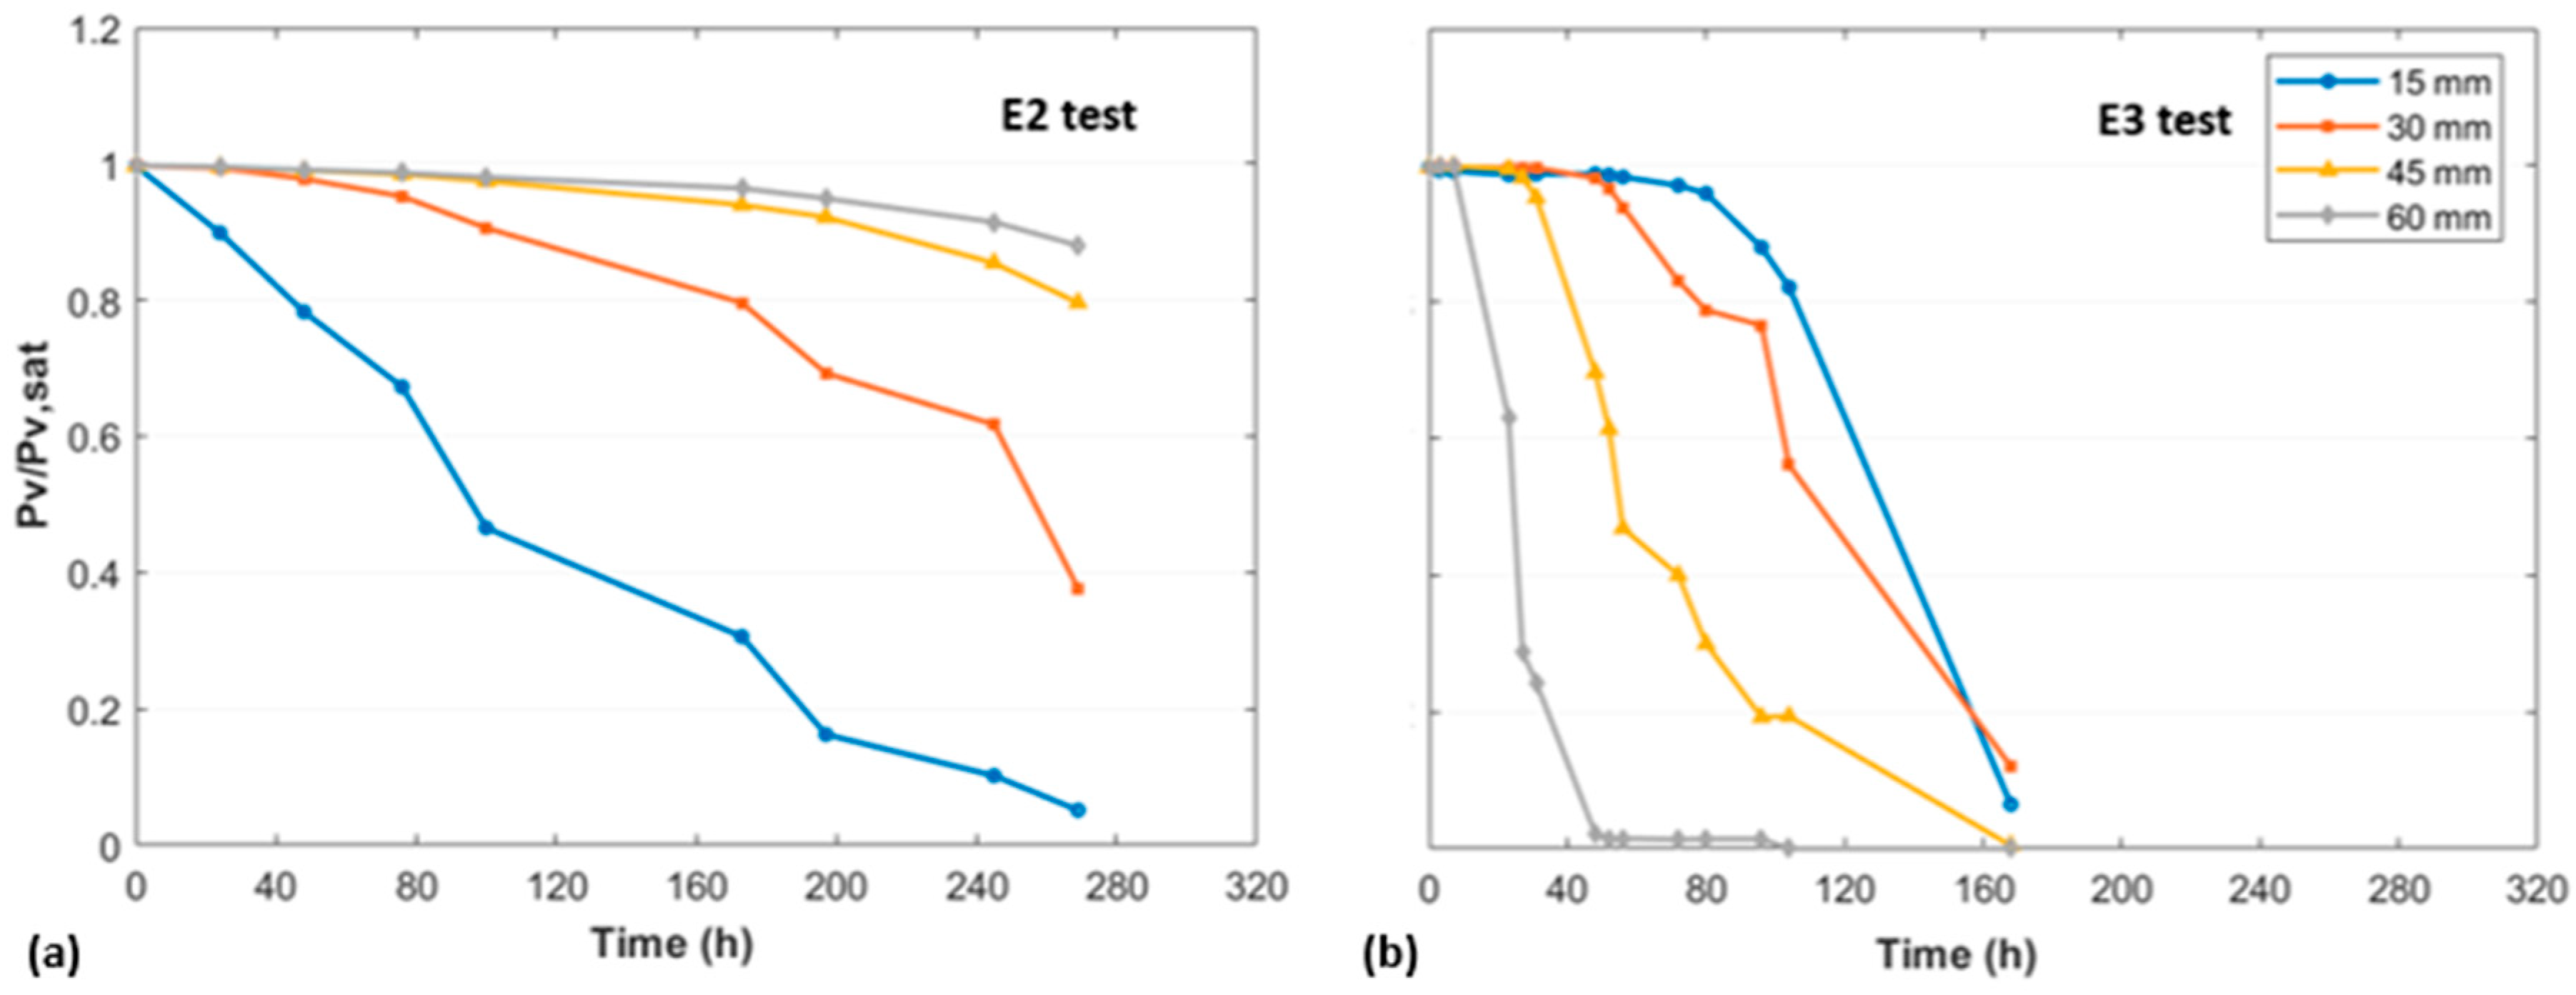
Since the equation for saturated vapor pressure (Equation (7)) is derived for the air phase, and when applied to the air within the soil, it assumes that the same relationship holds. However, this assumption may not always be valid, as the saturated vapor pressure in the soil pore spaces may differ from the saturated vapor pressure in free air. To account for this, the ratio between Pv (T) and Pv,sat (T) is calculated to more accurately reflect the conditions within the soil (Figure 12).
In Figure 12a, corresponding to isothermal test E2, the vapor pressure ratio also starts close to unity but decreases progressively across all levels. The more pronounced decrease in the upper part of the column reflects surface evaporation, which initiates the drying process. Over time, this evaporation front gradually shifts downward, explaining the delayed decrease in vapor pressure ratios at the lower levels. Similarly, the vapor pressures in Figure 11a evolve in a related manner. This behavior is typical of a drying process under isothermal conditions. Conversely, in E3 test, near the heating plate, the high temperature promotes increased evaporation of the soil’s moisture, leading to a rise in vapor pressure (Figure 11b). The evaporated moisture reaches a peak before it is transported to the upper layers. In Figure 12b, the lower parts of the column closer to the heat source initially show vapor pressure ratios close to unity, which then decrease rapidly over time. This trend reflects active evaporation. In contrast, the upper levels near the surface maintain a vapor pressure ratio around 0.99 for an extended period, which is a strong indication of condensation due to upward vapor migration.

5. Conclusions

The first goal of this paper was to present and validate a new device for non-isotherm drying test. This was achieved by using a soil column with the possibility of controlling the bottom temperature and simultaneously monitor temperature, water content, and matric suction at different elevations. Under constant temperature, the top-drying test permitted to correctly derive the soil unsaturated hydraulic properties, in comparison with a previously validated testing device. Then, the new device could be used under varying temperature drying conditions, and the results were analyzed to thoroughly examine the effects of temperature gradients on the thermo-hydraulic behavior of compacted fine soil, providing insights into soil heat exchangers and thermal management systems.
Through laboratory test under isothermal and non-isothermal conditions, it was confirmed that temperature significantly influences water redistribution within the soil. In isothermal tests, drying was primarily controlled by surface evaporation, while in the non-isothermal test, temperature differences induced vertical water flux, in liquid or vapor form, leading to a local increase in water content in the cooler zones, associated with a decrease in suction. These changes resulted in shifting the retention curve and in complex modifications in hydraulic conductivity trends, highlighting the importance of temperature-induced effects, such as enhanced evaporation and vapor flow.
Although several recent studies have addressed the thermo-hydric behavior of unsaturated soils, they mainly focused on numerical approaches or experimental tests under isothermal conditions, or non-isothermal tests but with the partial monitoring of hydraulic parameters. This work builds on these efforts by providing a significant experimental advance through the application of a controlled thermal gradient, enabling the direct observation of internal water redistributions, both liquid and vapor, and dynamic changes in hydraulic properties such as the retention curve and unsaturated hydraulic conductivity. Additionally, it allowed for the estimation of vapor pressures within the column based on local temperature and suction measurements.
These results highlighted several research avenues. The developed drying test with a controlled temperature gradient will be applied to different soil types. Studies could explore the impact of heating–cooling cycles and contribute to a better characterization of the thermo-hydrodynamic parameters related to energy storage applications.
Furthermore, the importance of vapor-phase fluxes, observed even under slight temperature variations, highlights the need to develop interpretation and modeling methods than can realistically simulate these phenomena. However, this task remains particularly challenging due to the highly complex and dynamic nature of soil’s thermo-hydric properties. Despite these difficulties, advancing such models is essential for optimizing heat storage systems, as they would provide a more accurate understanding of how thermal gradients impact long-term soil behavior in practical applications.
Overall, this study provides important insights into the thermo-hydric behavior of a compacted soil under varying temperature conditions. Since stability can significantly affect the energetic efficiency and long-term performance of the system, further investigations will focus on the mechanical properties of the soil to better understand their influence under thermo-hydric loading conditions.

Author Contributions

Conceptualization, R.E.Y., S.R.-P. and A.A.; methodology, R.E.Y., S.R.-P. and A.A.; data curation, R.E.Y.; writing—original draft preparation, R.E.Y.; writing—review and editing, R.E.Y., S.R.-P. and A.A.; visualization, R.E.Y.; supervision, S.R.-P. and A.A.; project administration, S.R.-P. and A.A. All authors have read and agreed to the published version of the manuscript.

Funding

This research received no external funding.

Data Availability Statement

The data supporting the findings of this study are available from the first author upon reasonable request.

Conflicts of Interest

The authors declare no conflicts of interest.

References

  1. Brandl, H. Energy Foundations and Other Thermo-Active Ground Structures. Géotechnique 2006, 56, 81–122. [Google Scholar] [CrossRef]
  2. Nasri, F.; Alqurashi, F.; Nciri, R.; Ali, C. Design and Simulation of a Novel Solar Air-Conditioning System Coupled with Solar Chimney. Sustain. Cities Soc. 2018, 40, 667–676. [Google Scholar] [CrossRef]
  3. Hadorn, J.-C. Guide to Seasonal Heat Storage; Public Works: Ottawa, ON, Canada, 1989. [Google Scholar]
  4. Sunku Prasad, J.; Muthukumar, P.; Desai, F.; Basu, D.N.; Rahman, M.M. A Critical Review of High-Temperature Reversible Thermochemical Energy Storage Systems. Appl. Energy 2019, 254, 113733. [Google Scholar] [CrossRef]
  5. Beier, R.A.; Holloway, W.A. Changes in the Thermal Performance of Horizontal Boreholes with Time. Appl. Therm. Eng. 2015, 78, 1–8. [Google Scholar] [CrossRef]
  6. Janiszewski, M.; Kopaly, A.; Honkonen, M.; Kukkonen, I.; Uotinen, L.; Siren, T.; Rinne, M. Feasibility of Underground Seasonal Storage of Solar Heat in Finland. In Proceedings of the International Conference on Geo-mechanics, Geo-energy and Geo-resources, Monash University, Melbourne, Australia, 28–29 September 2016; pp. 959–965. [Google Scholar]
  7. Xu, J.; Wang, R.Z.; Li, Y. A Review of Available Technologies for Seasonal Thermal Energy Storage. Sol. Energy 2014, 103, 610–638. [Google Scholar] [CrossRef]
  8. Amer, M.; Chen, M.-R.; Sajjad, U.; Ali, H.M.; Abbas, N.; Lu, M.-C.; Wang, C.-C. Experiments for Suitability of Plastic Heat Exchangers for Dehumidification Applications. Appl. Therm. Eng. 2019, 158, 113827. [Google Scholar] [CrossRef]
  9. Leong, W.H.; Tarnawski, V.R.; Aittomäki, A. Effect of Soil Type and Moisture Content on Ground Heat Pump Performance: Effet Du Type et de l’humidité Du Sol Sur La Performance Des Pompes à Chaleur à Capteurs Enterrés. Int. J. Refrig. 1998, 21, 595–606. [Google Scholar] [CrossRef]
  10. Abu-Hamdeh, N.H. SW—Soil and Water: Measurement of the Thermal Conductivity of Sandy Loam and Clay Loam Soils Using Single and Dual Probes. J. Agric. Eng. Res. 2001, 80, 209–216. [Google Scholar] [CrossRef]
  11. Abu-Hamdeh, N.H. Thermal Properties of Soils as Affected by Density and Water Content. Biosyst. Eng. 2003, 86, 97–102. [Google Scholar] [CrossRef]
  12. Boukelia, A. Physical and Numerical Modeling of Energy Geostructures. Ph.D. Thesis, University of Lorraine, Nancy, France, 2016. [Google Scholar]
  13. McCartney, J.; Coccia, C.J.R.; Alsherif, N.A.; Stewart, M.A.; Baser, T.; Traore, T.; Goode, J.C., III. Unsaturated Soil Mechanics in Geothermal Energy Applications. In Proceedings of the 6th International Conference on Unsaturated Soils, UNSAT 2014, Sydney, Australia, 2–4 July 2014; eScholarship, University of California: Berkeley, CA, USA, 2014. [Google Scholar]
  14. King, F.H. Observations and Experiments on the Fluctuations in the Level and Rate of Movement of Ground-Water on the Wisconsin Agricultural Experiment Station Farm and at Whitewater, Wisconsin; Weather Bureau: Washington, DC, USA, 1892. [Google Scholar]
  15. Gardner, R. Relation of Temperature to Moisture Tension of Soil. Soil Sci. 1955, 79, 257–266. [Google Scholar] [CrossRef]
  16. Tang, A.-M.; Cui, Y.-J. Controlling Suction by the Vapour Equilibrium Technique at Different Temperatures and Its Application in Determining the Water Retention Properties of MX80 Clay. Can. Geotech. J. 2005, 42, 287–296. [Google Scholar] [CrossRef]
  17. Uchaipichat, A.; Khalili, N. Experimental Investigation of Thermo-Hydro-Mechanical Behaviour of an Unsaturated Silt. Géotechnique 2009, 59, 339–353. [Google Scholar] [CrossRef]
  18. Romero Morales, E.E. Characterisation and Thermo-Hydro-Mechanical Behaviour of Unsaturated Boom Clay: An Experimental Study. Ph.D. Thesis, Universitat Politècnica de Catalunya, Barcelona, Spain, 1999. [Google Scholar]
  19. Romero, E.; Gens, A.; Lloret, A. Temperature Effects on the Hydraulic Behaviour of an Unsaturated Clay. In Unsaturated Soil Concepts and Their Application in Geotechnical Practice; Toll, D.G., Ed.; Springer: Dordrecht, The Netherlands, 2001; pp. 311–332. ISBN 978-90-481-5918-5. [Google Scholar]
  20. Cho, W.J.; Lee, J.O.; Chun, K.S. The Temperature Effects on Hydraulic Conductivity of Compacted Bentonite. Appl. Clay Sci. 1999, 14, 47–58. [Google Scholar] [CrossRef]
  21. Bouazza, A.; Abuel-Naga, H.M.; Gates, W.P.; Laloui, L. Temperature Effects on Volume Change and Hydraulic Properties of Geosynthetic Clay Liners. In Proceedings of the First Pan American Geosynthetics Conference & Exhibition, Cancun, Mexico, 2–5 March 2008; Industrial Fabrics Association International (IFAI): Roseville, MN, USA, 2008. [Google Scholar]
  22. Ye, W.M.; Wan, M.; Chen, B.; Chen, Y.G.; Cui, Y.J.; Wang, J. Temperature Effects on the Swelling Pressure and Saturated Hydraulic Conductivity of the Compacted GMZ01 Bentonite. Environ. Earth Sci. 2013, 68, 281–288. [Google Scholar] [CrossRef]
  23. Cui, Y.-J.; Tang, A.-M.; Loiseau, C.; Delage, P. Determining the Unsaturated Hydraulic Conductivity of a Compacted Sand–Bentonite Mixture under Constant-Volume and Free-Swell Conditions. Phys. Chem. Earth Parts A/B/C 2008, 33, S462–S471. [Google Scholar] [CrossRef]
  24. Diny, S.; Masrouri, F.; Tisot, J.-P. Détermination de La Conductivité Hydraulique d’un Limon Non Saturé. Rev. Fr. Geotech. 1993, 62, 67–74. [Google Scholar] [CrossRef]
  25. Krisdani, H.; Rahardjo, H.; Leong, E.-C. Use of Instantaneous Profile and Statistical Methods to Determine Permeability Functions of Unsaturated Soils. Can. Geotech. J. 2009, 46, 869–874. [Google Scholar] [CrossRef]
  26. Liu, X.; Xu, W.; Zhan, L.; Chen, Y. Laboratory and Numerical Study on an Enhanced Evaporation Process in a Loess Soil Column Subjected to Heating. J. Zhejiang Univ.-Sci. A 2016, 17, 553–564. [Google Scholar] [CrossRef]
  27. Lahoori, M. Thermo-Hydro-Mechanical Behavior of an Embankment to Store Thermal Energy. Ph.D. Thesis, Université de Lorraine, Nancy, France, 2020. [Google Scholar]
  28. Haghighi, A.; Medero, G.M.; Marinho, F.A.; Mercier, B.; Woodward, P.K. Temperature Effects on Suction Measurement Using the Filter Paper Technique. Geotech. Test. J. 2012, 35, 83–90. [Google Scholar] [CrossRef]
  29. Pham, T.A.; Hashemi, A.; Sutman, M.; Medero, G.M. Effect of Temperature on the Soil–Water Retention Characteristics in Unsaturated Soils: Analytical and Experimental Approaches. Soils Found. 2023, 63, 101301. [Google Scholar] [CrossRef]
  30. Yang, Y.; Yang, L.; Zhao, D.; Guo, Y.; Lin, J.; Jiang, F.; Huang, Y.; Zhang, Y. Thermal Effects on the Soil Water Retention Curves and Hydraulic Properties of Benggang Soil in Southern China. Water 2024, 16, 238. [Google Scholar] [CrossRef]
  31. Cahill, A.T.; Parlange, M.B. On Water Vapor Transport in Field Soils. Water Resour. Res. 1998, 34, 731–739. [Google Scholar] [CrossRef]
  32. Sakai, M.; Toride, N.; Šimůnek, J. Water and Vapor Movement with Condensation and Evaporation in a Sandy Column. Soil Sci. Soc. Am. J. 2009, 73, 707–717. [Google Scholar] [CrossRef]
  33. Saito, H.; Šimunek, J.; Mohanty, B.P. Numerical Analysis of Coupled Water, Vapor, and Heat Transport in the Vadose Zone. Vadose Zone J. 2006, 5, 784–800. [Google Scholar] [CrossRef]
  34. Mohamed, A.-M.; Yong, R.N.; Cheung, S.C. Temperature Dependence of Soil Water Potential. Geotech. Test. J. 1992, 15, 330–339. [Google Scholar] [CrossRef]
  35. Mohamed, A.M.; Yong, R.N.; Onofrei, C.I.; Kjartanson, B.H. Coupled Heat and Moisture Flow in Unsaturated Swelling Clay Barriers. Geotech. Test. J. 1996, 19, 155–163. [Google Scholar] [CrossRef]
  36. Kanno, T.; Kato, K.; Yamagata, J. Moisture Movement under a Temperature Gradient in Highly Compacted Bentonite. Eng. Geol. 1996, 41, 287–300. [Google Scholar] [CrossRef]
  37. Villar, M.V.; Cuevas, J.; Martin, P.L. Effects of Heat/Water Flow Interaction on Compacted Bentonite: Preliminary Results. Eng. Geol. 1996, 41, 257–267. [Google Scholar] [CrossRef]
  38. Yong, R.N.; Mohamed, A.-M.O. Evaluation of Coupled Heat and Moisture Flow Parameters in a Bentonite-Sand Buffer Material. Eng. Geol. 1996, 41, 269–286. [Google Scholar] [CrossRef]
  39. Yong, R.N.; Mohamed, A.M.O.; Shooshpasha, I.; Onofrei, C. Hydro-Thermal Performance of Unsaturated Bentonite-Sand Buffer Material. Eng. Geol. 1997, 47, 351–365. [Google Scholar] [CrossRef]
  40. Gao, Y.; Dong, S.; Wang, C.; Chen, Y.; Hu, W. Effect of Thermal Intensity and Initial Moisture Content on Heat and Moisture Transfer in Unsaturated Soil. Sustain. Cities Soc. 2020, 55, 102069. [Google Scholar] [CrossRef]
  41. NF ISO 11277/A1; Qualité Du Sol—Détermination de La Répartition Granulométrique de La Matière Minérale Des Sols—Méthode Par Tamisage et Sédimentation—Amendement 1. Association Française de Normalisation: Paris, France, 2024.
  42. EN ISO 17892-12; Reconnaissance et Essais Géotechniques. Essais de Laboratoire Sur Les Sols. Association Française de Normalisation: Paris, France, 2018.
  43. ASTM D2487-17e1; Standard Practice for Classification of Soils for Engineering Purposes (Unified Soil Classification System). Annual Book of ASTM Standards. ASTM International: West Conshohocken, PA, USA, 2020.
  44. The Institute for Roads, Streets and Infrastructures for Mobility. Guide Des Terrassements Des Remblais et Des Couches de Forme: Les Principes Généraux et Les Annexes Techniques; IDRRIM: Paris, France, 2023. [Google Scholar]
  45. Boukelia, A.; Rosin-Paumier, S.; Masrouri, F.; Le Borgne, T. Stockage de Chaleur Dans Les Sols Compactés. In Proceedings of the Journées nationales de géotechnique et de géologie de l’ingénieur, Nancy, France, 6–8 July 2016. [Google Scholar]
  46. ASTM D5298-16; Standard Test Method for Measurement of Soil Potential (Suction) Using Filter Paper. Annual Book of ASTM Standard. ASTM International: West Conshohocken, PA, USA, 2016.
  47. Amraoui, N. Étude de l’infiltration Dans Les Sols Fins Non Saturés. Ph.D. Thesis, Institut National Polytechnique de Lorraine, Nancy, France, 1996. [Google Scholar]
  48. Van Genuchten, M.T. A Closed-form Equation for Predicting the Hydraulic Conductivity of Unsaturated Soils. Soil Sci. Soc. Am. J. 1980, 44, 892–898. [Google Scholar] [CrossRef]
  49. NF X30-442; Déchets—Détermination Au Laboratoire Du Coefficient de Perméabilité à Saturation d’un Matériau—Essais de Perméabilité à l’oedomètre à Charge Hydraulique Constante/Variable. Association Française de Normalisation: Paris, France, 2008.
  50. Tetens, O. Uber Einige Meteorologische Begriffe. Z. Geophys 1930, 6, 297–309. [Google Scholar]
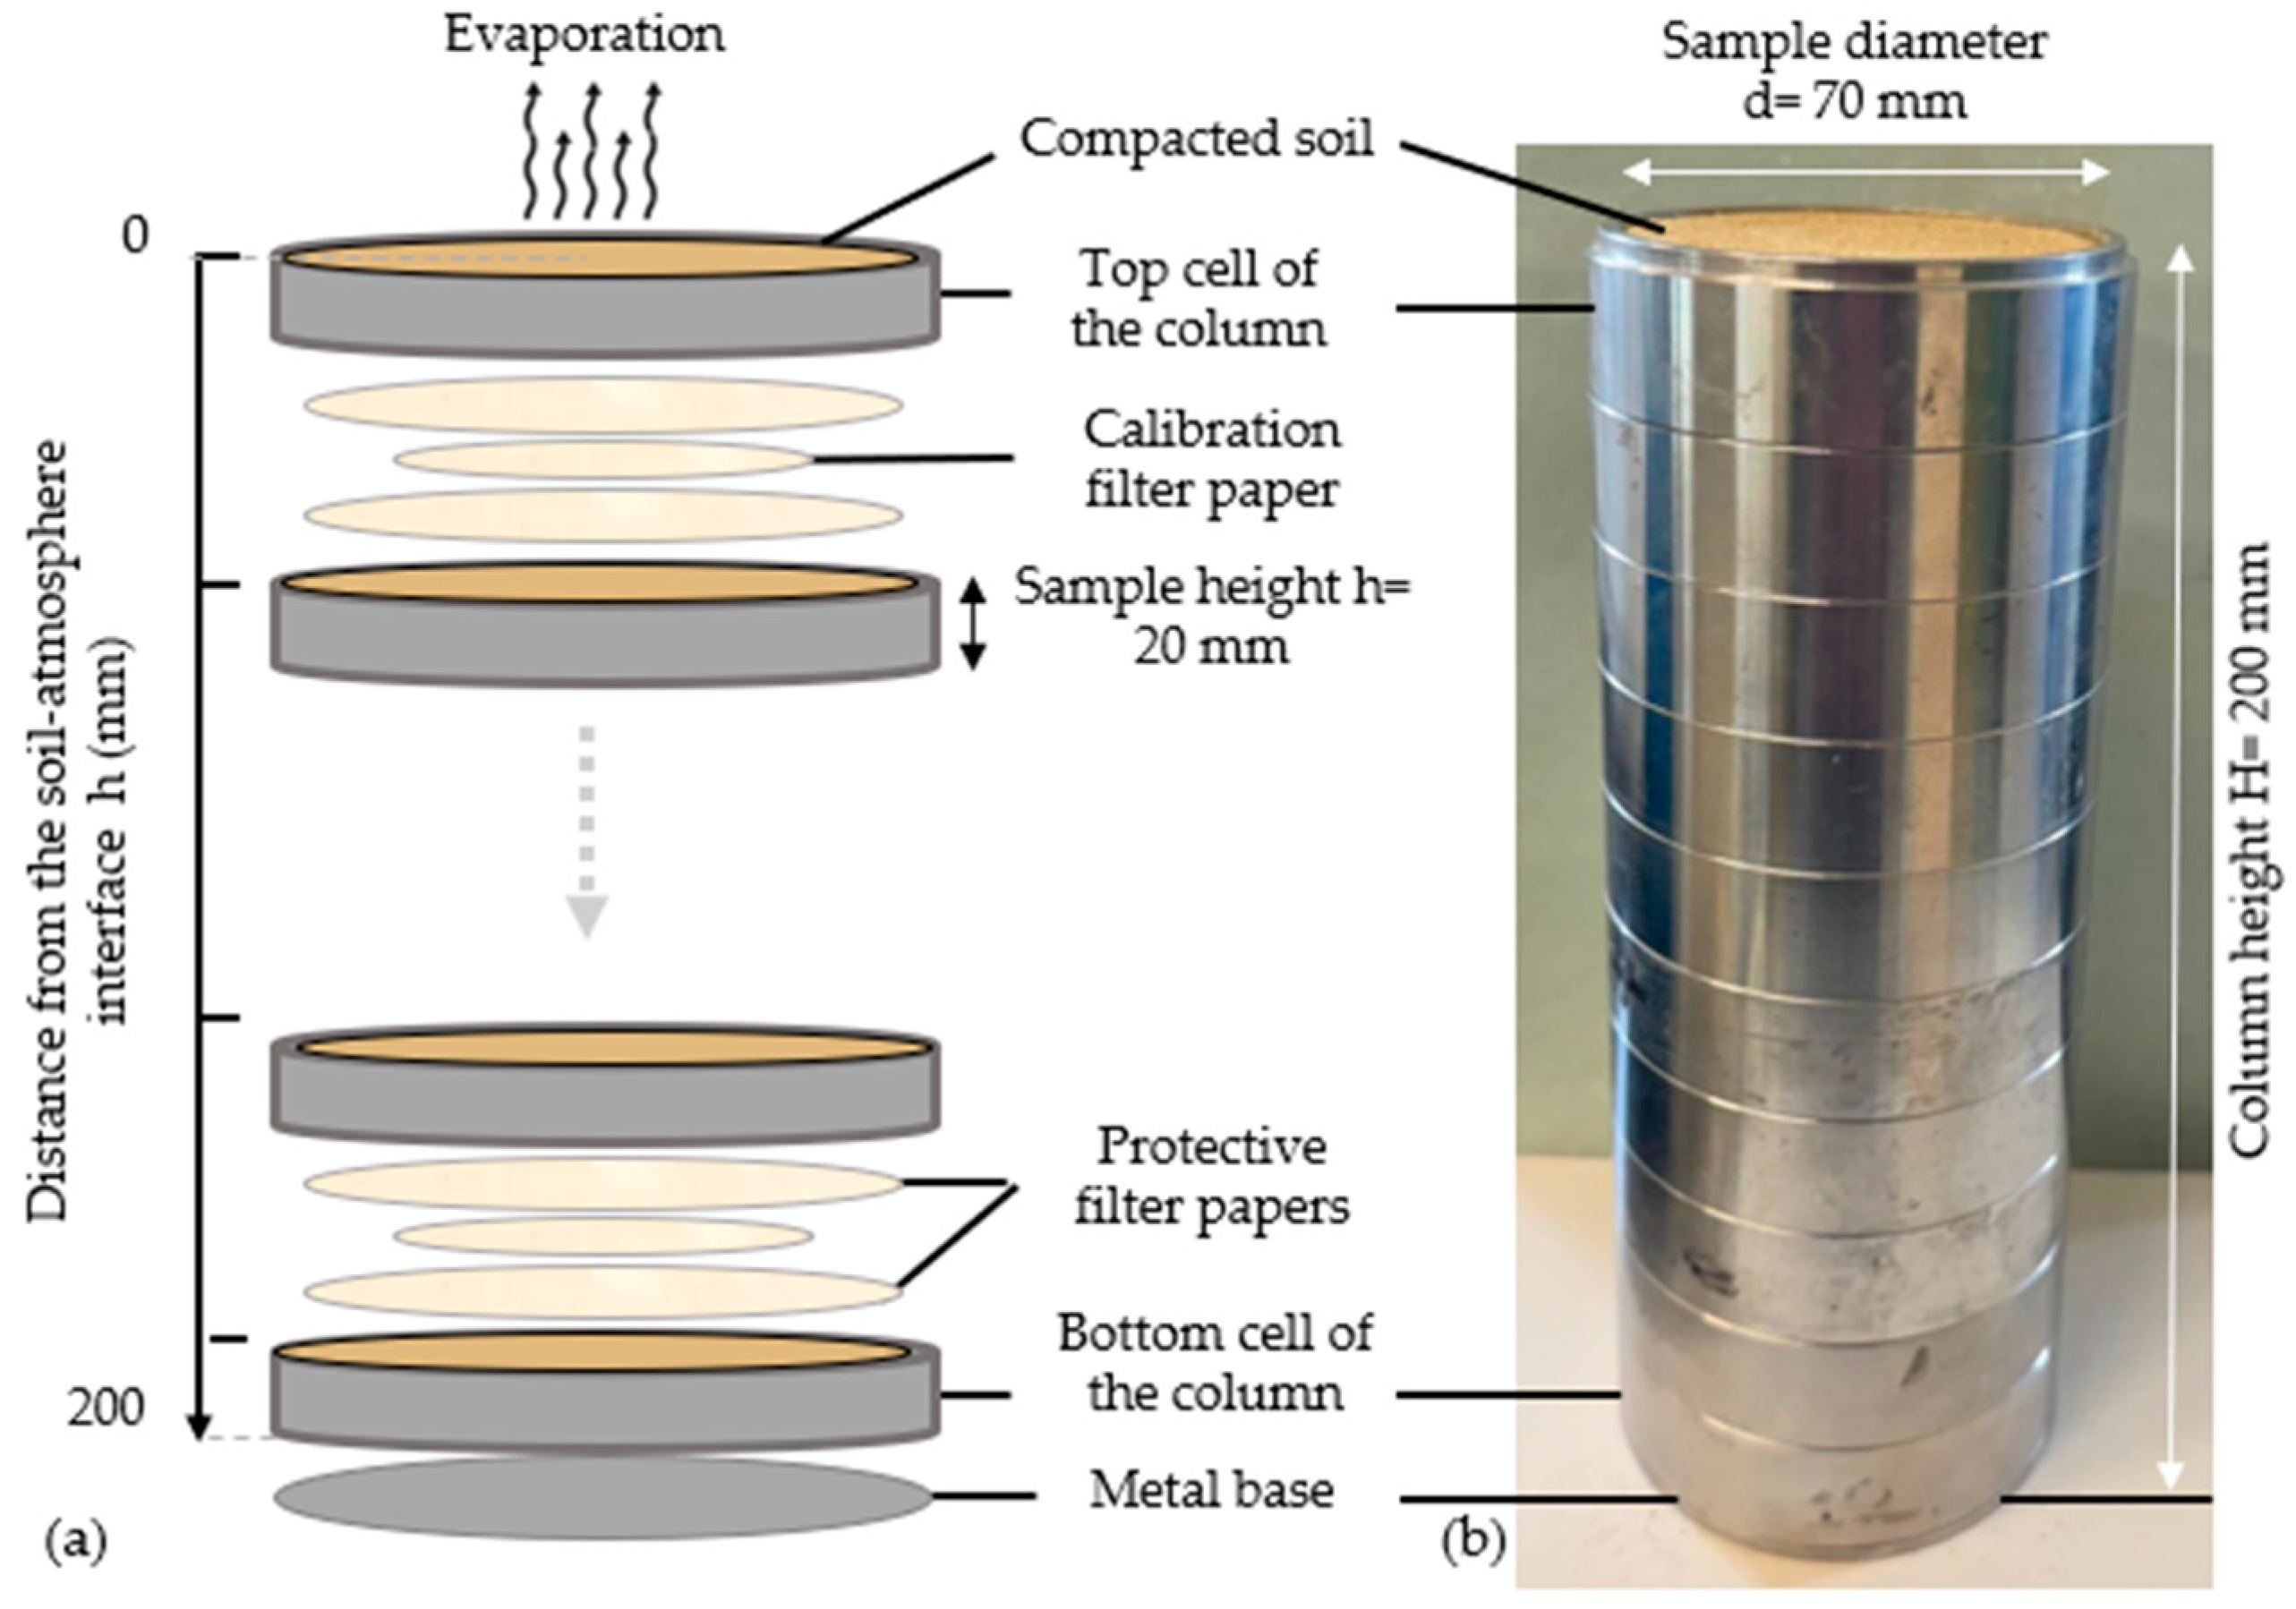
Figure 1. (a) The arrangement of the 10 soil samples and 9 calibrated filter papers in the column; (b) the experimental setup of column 1 used in the isothermal test (E1).
Geotechnics 05 00038 g001
Figure 2. (a) The design of the new plastic molds used for the isothermal (E2) and non-isothermal (E3) tests; (b) three-dimensional view; (c) experimental setup with thermal sensor insertion groove.
Geotechnics 05 00038 g002
Figure 3. Isothermal test E1 with 10 steel molds: (a) water content profiles; (b) suction profiles.
Geotechnics 05 00038 g003
Figure 4. Isothermal test E2 with five plastic molds: (a) water content profiles; (b) suction profiles.
Geotechnics 05 00038 g004
Figure 5. Non-isothermal test E3 with five plastic molds: (a) water content profiles; (b) suctions profiles; (c) temperature profiles.
Geotechnics 05 00038 g005
Figure 6. The SWRC of the sandy lean clay obtained from E1 and E2 tests under isothermal conditions fitted by van Genuchten model.
Geotechnics 05 00038 g006
Figure 7. A comparison between the SWRC obtained from isothermal (E2) and non-isothermal (E3) tests. The van Genuchten model is fitted to E2 data. The E3 data points are grouped by distance from soil–atmosphere interface.
Geotechnics 05 00038 g007
Figure 8. Unsaturated hydraulic conductivity of sandy lean clay obtained from isothermal (E1, E2) and non-isothermal (E3) tests.
Geotechnics 05 00038 g008
Figure 9. The evolution of (a) water content difference (∆θ = θE3 − θE2) and (b) suction difference (∆Ψ = ΨE3 − ΨE2) between the non-isothermal (E3) and isothermal (E2) tests at each depth.
Geotechnics 05 00038 g009
Figure 10. Evolution of water flux at different depths: (a) isothermal test (E2); (b) non-isothermal test (E3).
Geotechnics 05 00038 g010
Figure 11. Evolution of vapor pressure calculated using Equation (8) at different depths: (a) isothermal test (E2); (b) non-isothermal test (E3).
Geotechnics 05 00038 g011
Figure 12. Evolution of vapor pressure ratio (Pv/Pv,sat) calculated using Equation (8) at different depths: (a) isothermal test (E2); (b) non-isothermal test (E3).
Geotechnics 05 00038 g012
Table 1. Material characteristics [12].
Composition
Quartz81%
Calcium Carbonate5% calcite, 7% dolomite
Feldspath3%
Clay minerals5%
Particle-Size Fractions
Passing at 63 μm (%)37
Passing at 2 μm (%)20
Carbonate Content
CaCO3 (%)0.80
Optimum Proctor Normal
ρd (Mg.m−3)1.81
wOPN (%)16.3
Table 2. Key conditions for each conducted test.
TestColumn (Height × Diameter mm)DurationType of Molds UsedT °C BottomT °C
External
winitial
(%)
Other Materials Used
E1200 × 7084 daysStainless-steel20 ± 1 °C20 ± 1 °C18.5-
E275 × 36.411 daysPlastic20 ± 1 °C20 ± 1 °C16.3Thermocouples
E375 × 36.47 daysPlastic40 ± 1 °C20 ± 1 °C16.3Thermocouples
Heat plate
Sapphire disk
Table 3. Optimized constant parameters proposed by [28].
Parameterabcdfgh
value1.09·101−6.4·10−2−4.06·10−22.19·10−41.91·10−2−3.65·10−3−7.65·10−5
Disclaimer/Publisher’s Note: The statements, opinions and data contained in all publications are solely those of the individual author(s) and contributor(s) and not of MDPI and/or the editor(s). MDPI and/or the editor(s) disclaim responsibility for any injury to people or property resulting from any ideas, methods, instructions or products referred to in the content.