Article

Performance of Micropiled-Raft Foundations in Sand

Department of Building, Civil and Environmental Engineering, Gina Cody School of Engineering and Computer Science, Concordia University, Montreal, QC H3G 1M8, Canada
*
Author to whom correspondence should be addressed.
Geotechnics 2024, 4(4), 1065-1080; https://doi.org/10.3390/geotechnics4040054
Submission received: 5 April 2024 / Revised: 4 October 2024 / Accepted: 8 October 2024 / Published: 15 October 2024

Abstract

Micropiles were first used to repair the damaged structures of “Scuola Angiulli” in Naples after World War II. They are known as small versions of regular piles, with a diameter of less than 30 cm, and are made of high-strength, steel casing and/or threaded bars, produce minimal noise and vibration during installation, and use lightweight machinery. They are capable to withstand axial loads and moderate lateral loads. They are used for underpinning existing foundations and to restore historical buildings and to support moderate structures. In the literature, several reports can be found dealing with micropiles, yet little has been reported on Micropiled-Raft Foundations (MPR). This technology did not receive the recognition it deserved until the 1970s when its technical and economic benefits were noted. A series of laboratory tests and numerical modeling were developed to examine the parameters governing the performance of MPR, including the relative density of the sand, the micropile spacing, and the rigidity of the raft. The numerical model, after being validated with the present experimental results, was used to generate data for a wide range of governing parameters. The theory developed by Poulos (2001) (PDR) to predict the capacity of pile-raft foundations was adopted for the design of MPR. The PDR method is widely used by geotechnical engineers because of its simplicity.

1. Introduction

Micropiles were first introduced in the 1950s (Lizzi, 1082) [1] to repair damaged structures. Since then, their use has been extended to a variety of applications, including, but not being limited to, supporting structures with moderate loads, underpinning and restoring old buildings, and also stabilizing embankments and slopes (Bruce et al., 1995) [2].
While research on pile foundations is advancing, research on micropiles is lagging. Horikoshi et al. (2003) [3] conducted a series of static vertical and horizontal loading tests using a centrifuge system. They reported on the load–displacement relationship and the load sharing between the piles and the rafts in piled-raft foundations. They concluded that the resistance of piles in a piled-raft system increases with the increase in the confining stress, which is created by the raft.
Tsukada et al. (2006) [4] explored the mechanism which enhances the bearing capacity of shallow footing reinforced with a micropile. They reported that the relative density of the sand had a significant effect on the bearing capacity of the micropiled rafts. In 2014, Alnuaim [5] used a centrifuge machine to test the performance of micropiled rafts in sand and clay. He proposed some adjustment factors to the PDR method for micropiled rafts.
Kyung et al. (2017) [6] examined the capacity of a battered micropile to support vertical load. They reported that the ultimate load capacity of micropiled rafts was affected by both micropile spacing and the angle of inclination. In 2021, Moradi Moghadam et al. [7] performed strain-controlled tests on micropile models in sand to investigate the effects of the geometry of the MPR; among these parameters was the relative density of the sand.
The Federal Highway Administration has published a guide for micropile design and construction (FHWA, 2005) [8]. This guide classifies the micropiles into four categories based on the grouting techniques used in the construction process. The simplest type is A, in which the surrounding grout is placed under gravity pressure. For the construction of type D, which is the most advanced variant between types A, B, C, and D, packers are used to apply pressurized grouting which will penetrate the soil and provide higher skin frictions (bounding). The FHWA only deals with micropiles and micropiled rafts are not addressed.

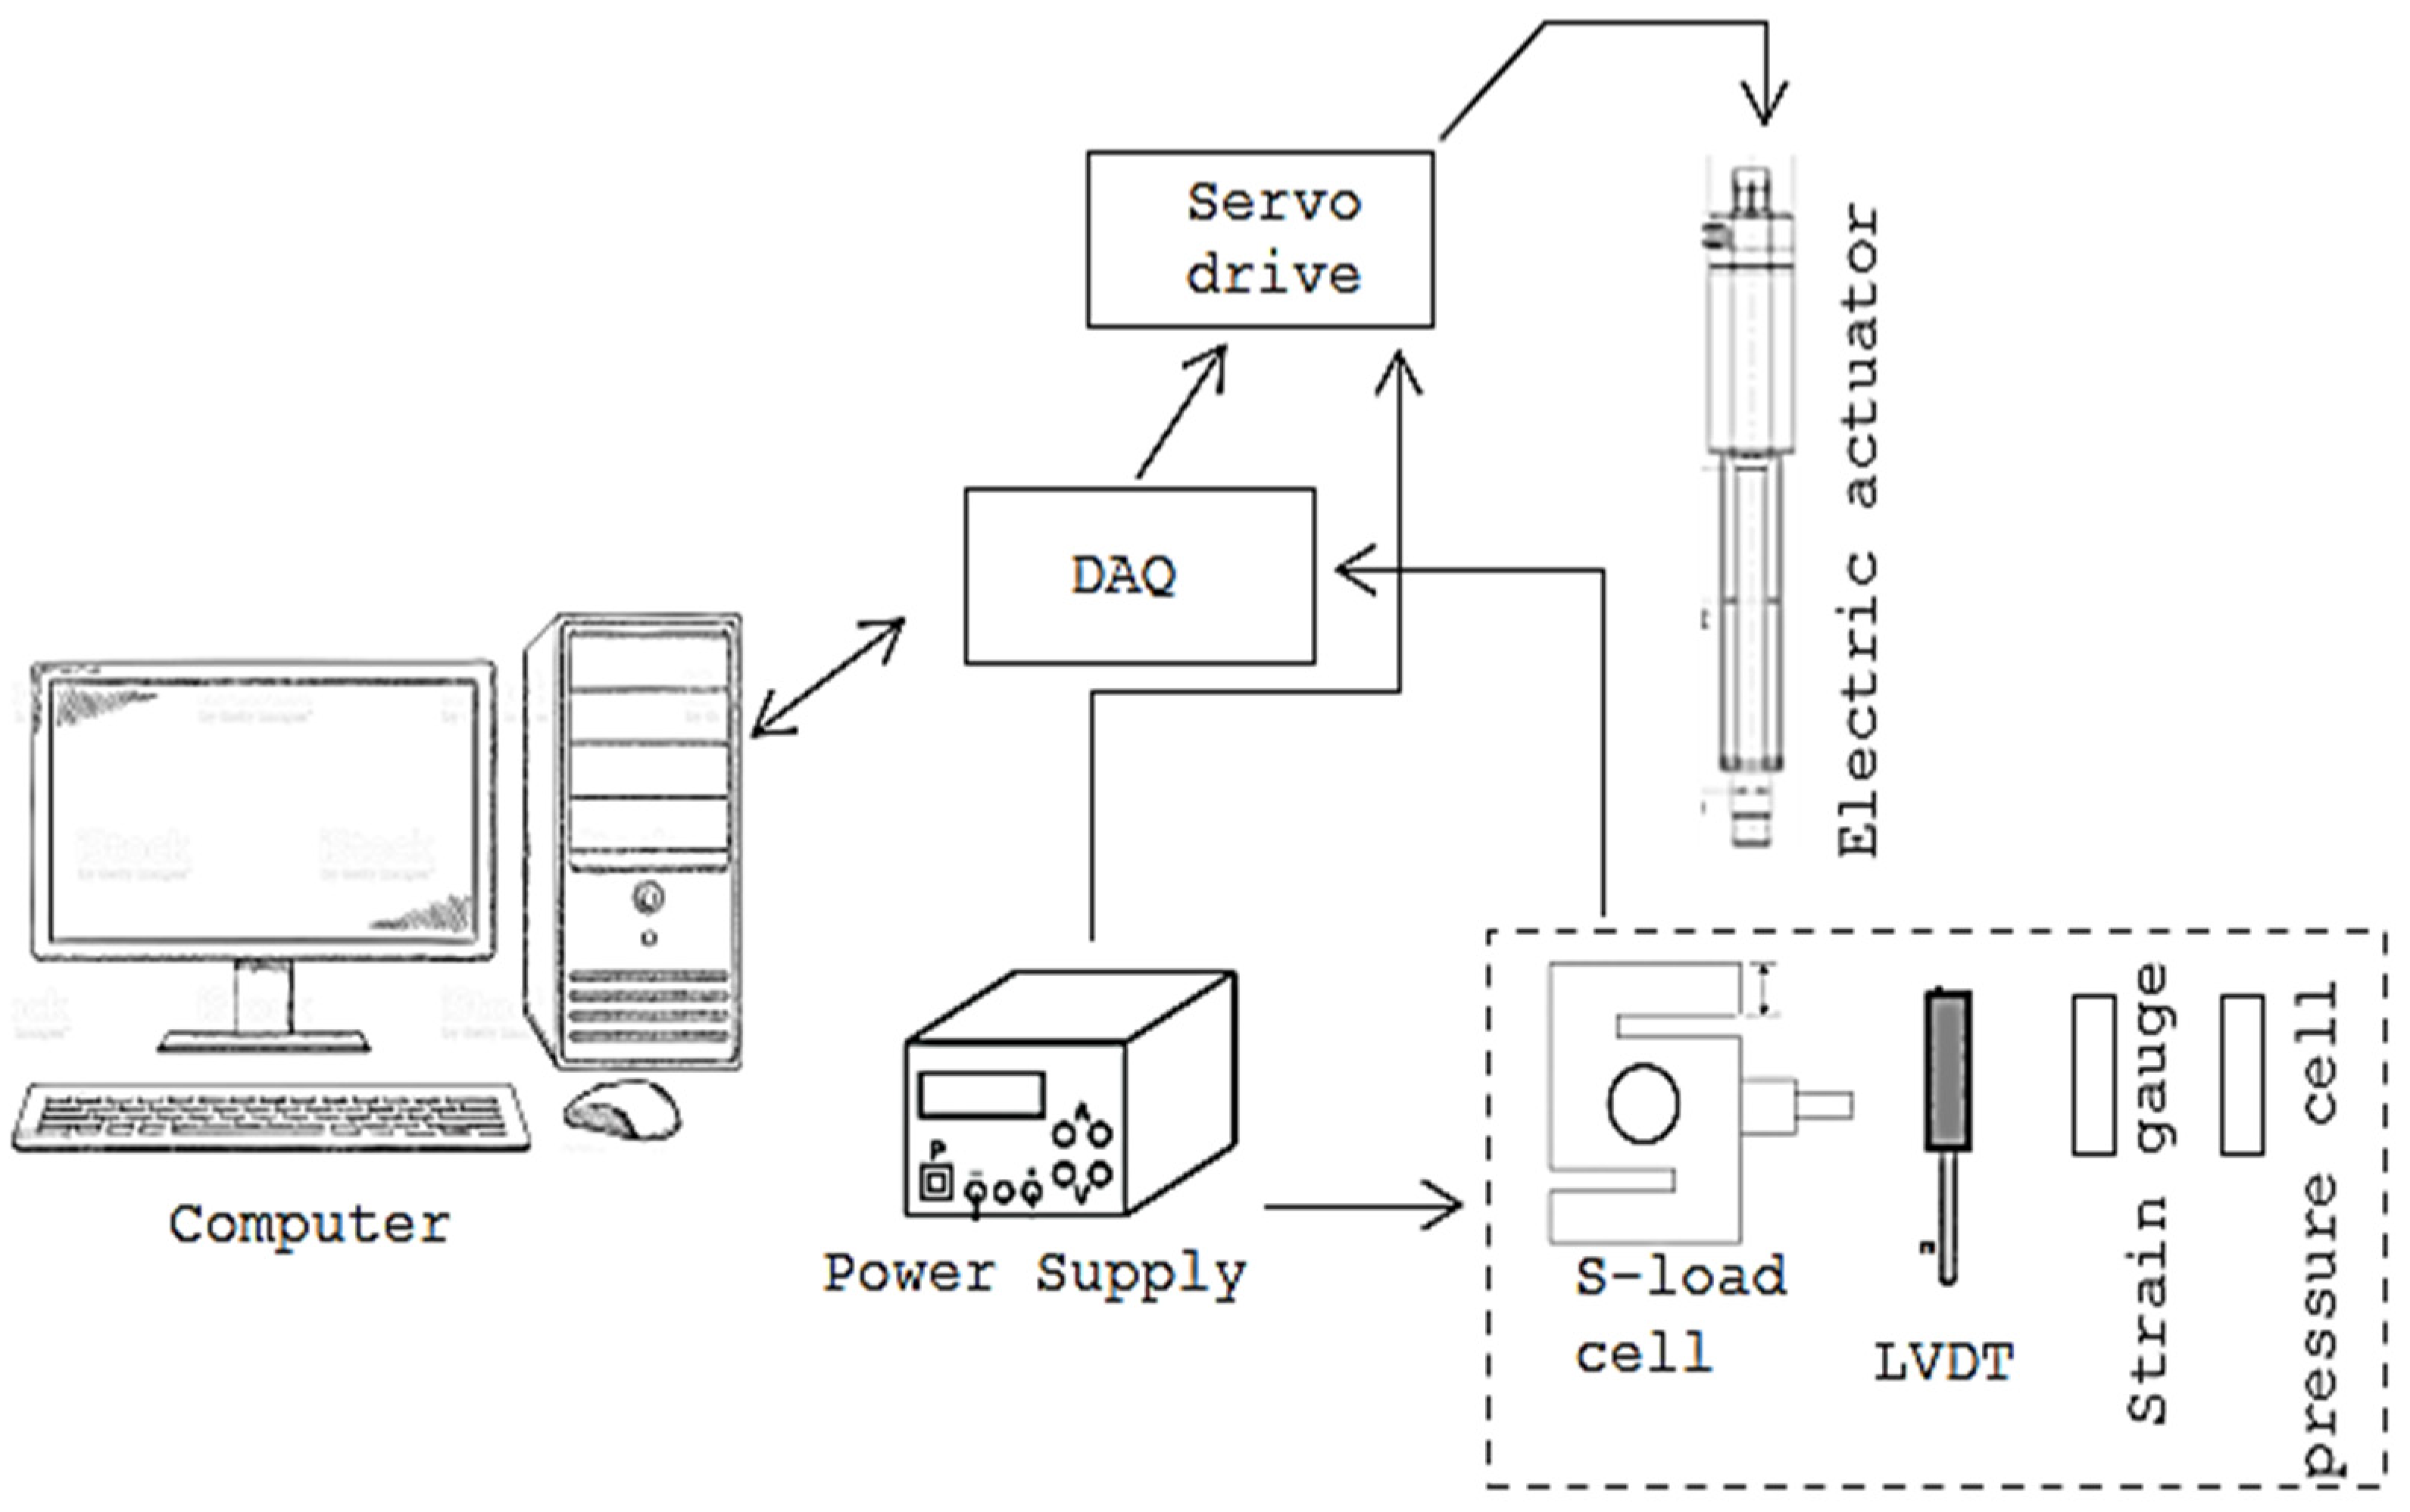
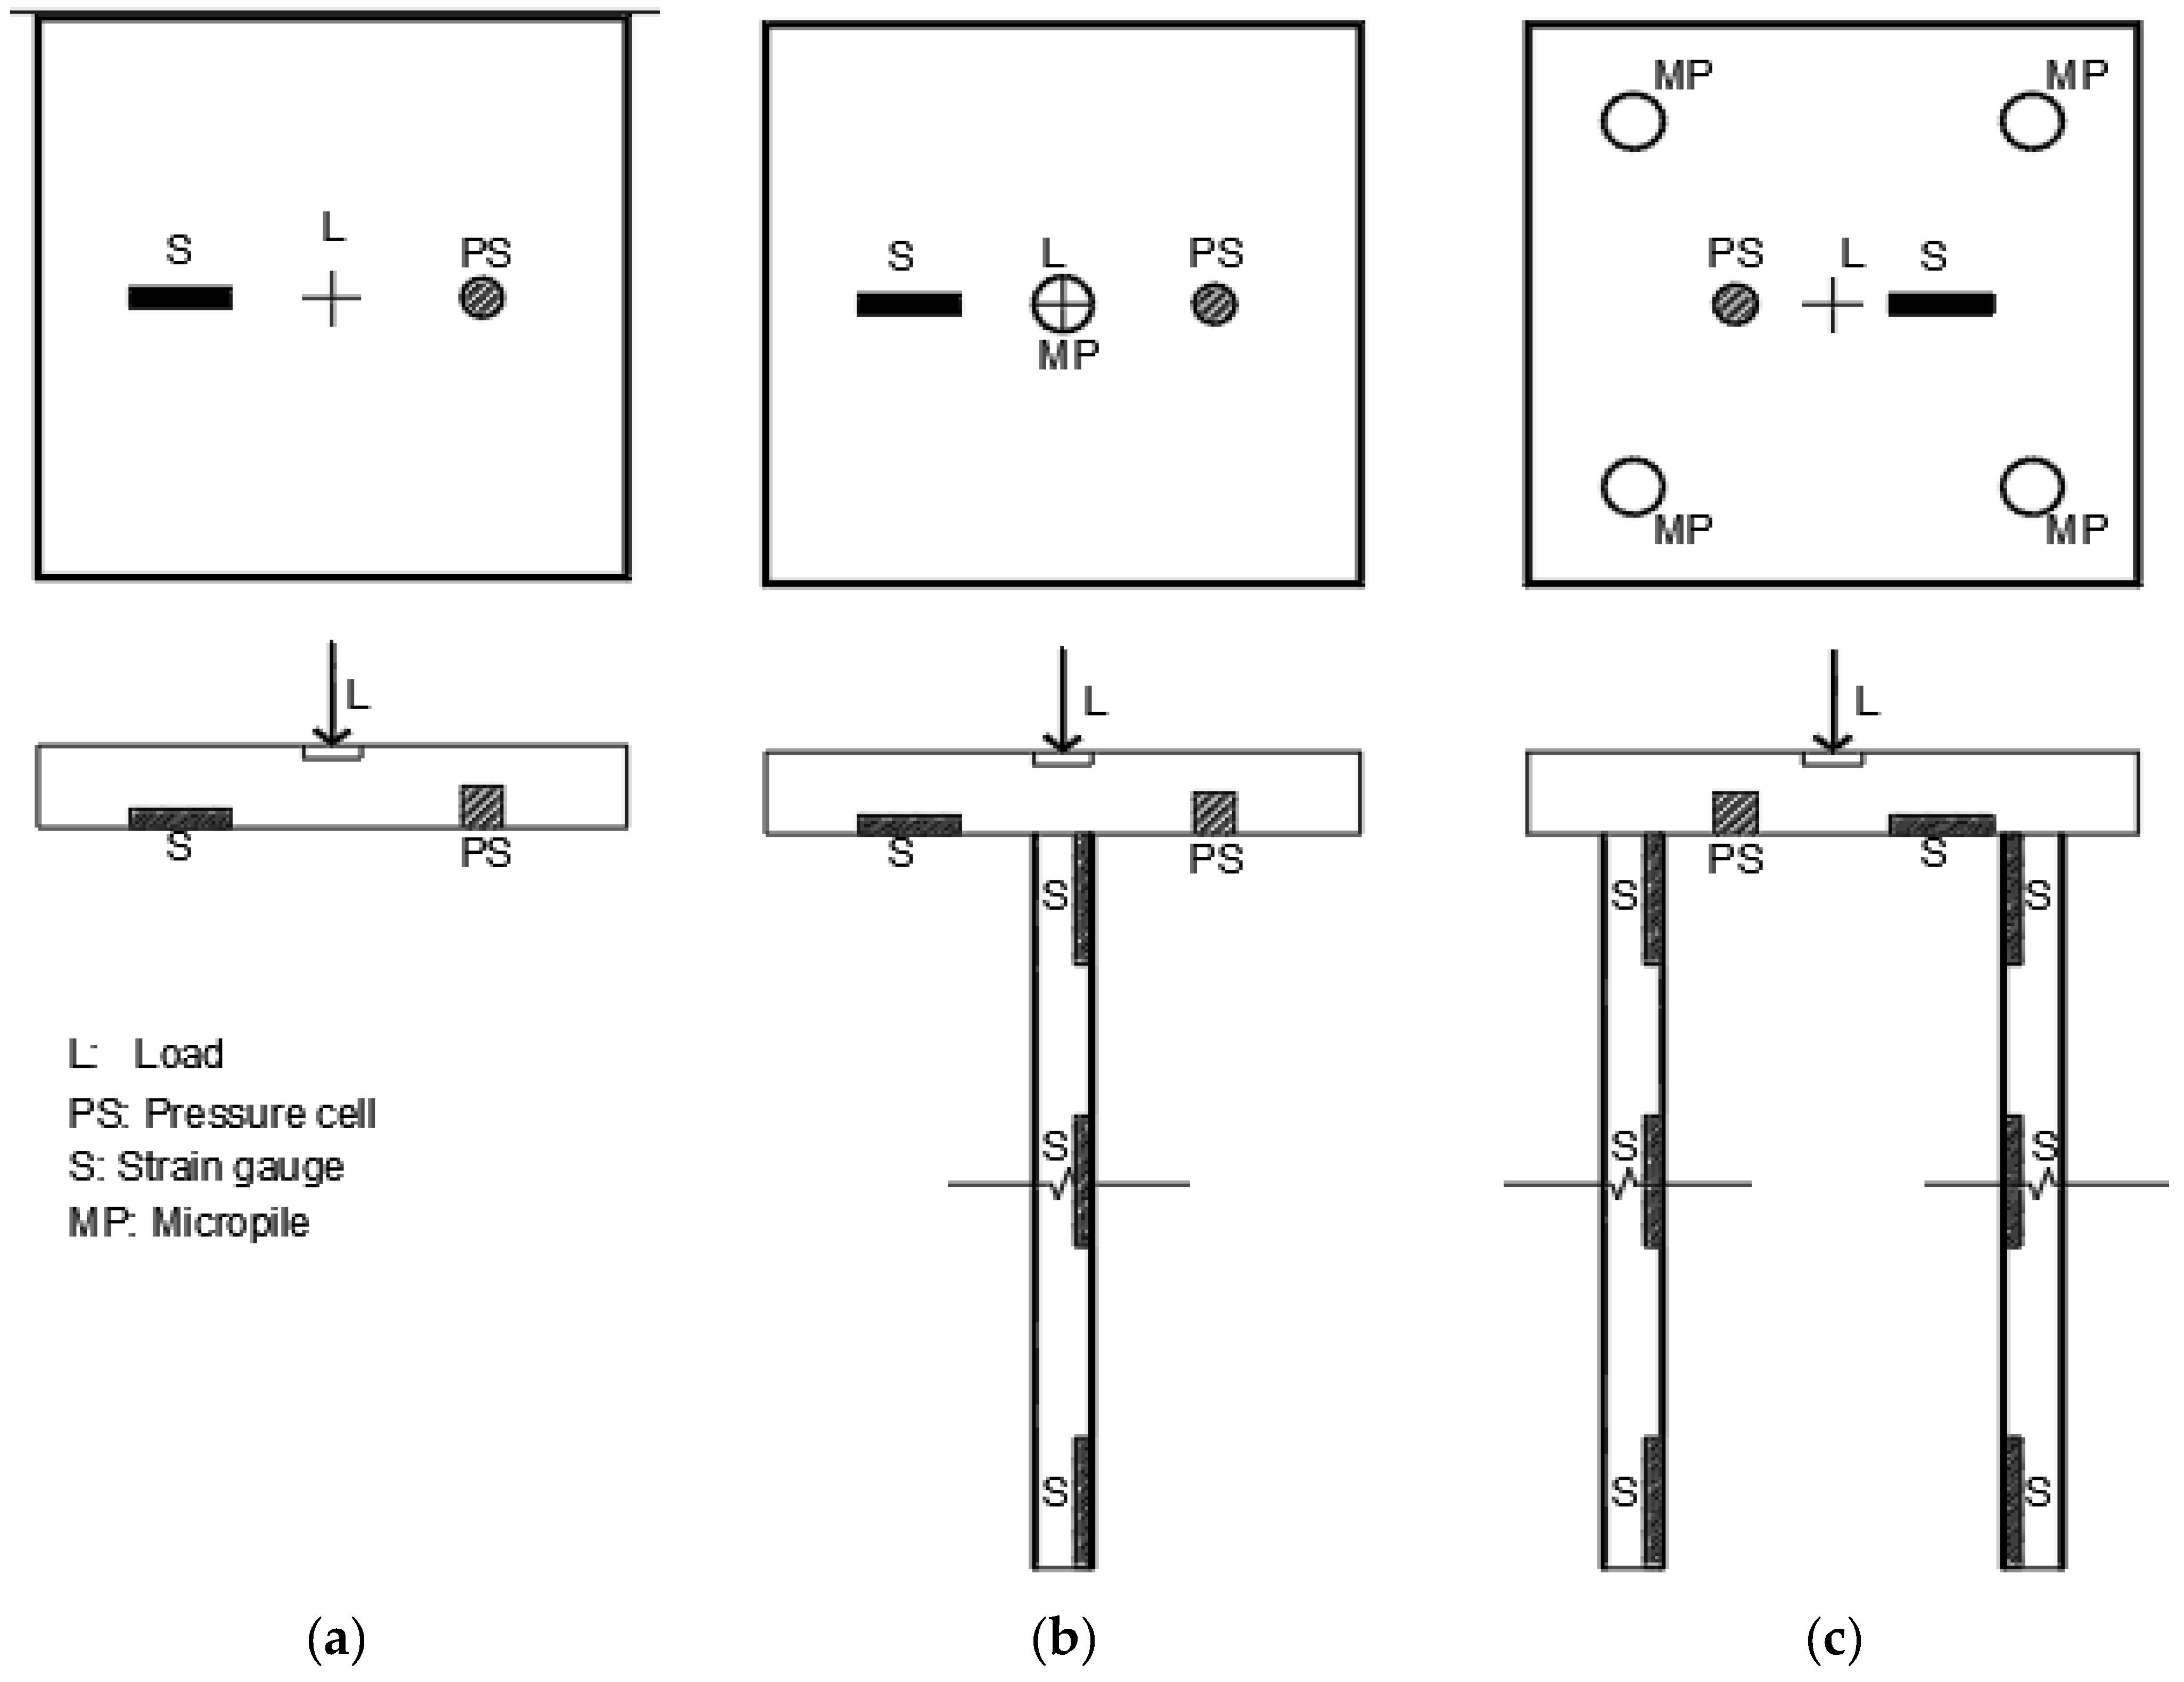
2. Experimental Investigation

A laboratory setup was developed to test an unpiled raft, a single micropile, and micropiled raft (MPR). The setup consisted of a testing tank 1 × 1 × 1.25 m in length, width, and depth, a reaction frame and loading system comprising an electric cylinder actuator having a loading capacity of 15 kN at 5-amp, 60 V, a servo drive, and a power supply. Figure 1 presents a schematic diagram of the experimental setup, and Figure 2 presents a photo of a test in progress in a micropiled-raft system.
The loading system was strain-controlled, designed to apply a constant displacement of 10 mm per minute. The load was measured using a load cell (LC103B-5K, Omega, NC, USA). The settlement was recorded using an LVDT (LD620-25, Omega, NC, USA). MPR models were equipped with a pressure sensor (AB-HP from Honeywell, Santa Clara, CA, USA) and strain gauge (SGT-1/350-TY11 from Omega, NC, USA) mounted at the bottom of the raft.
A data acquisition system (34972A, Agilent, Santa Clara, CA, USA) was used to collect the measurements of load cells, LVDTs, strain gauges, and pressure sensors. It also acted as an output remote controller for the loading system. The servo drive controls the movement of the actuator stroke in order to apply the predetermined displacement or load. In this investigation, all measuring devices were calibrated before testing and frequently during testing.
The material used in this investigation was silica sand. Laboratory tests were performed on the sand to include the specific gravity, grain size distribution, relative density, and direct shear test. Table 1 and Table 2 present a summary of the physical and mechanical properties of the sand, respectively. After several trials, the sandpaper of grid 150 was found suitable to simulate a concrete surface. Table 3 presents the properties of PVC and the concrete, which was used for the piles and the raft, following “ASTM D 638”.
The test was commenced by placing the sand in the testing tank in 15 cm thick layers. To ensure uniform density distribution throughout the tank, density cans of known weights and volumes were placed in each layer and retrieved at the end of the test to determine the unit weights of the sand. Layers were compacted with a 7.12 kg hammer lifted to a height of 200 mm and dropped onto a rigid plate, which was placed on the top of the layer under compaction. The number of drops for each layer was determined for each relative density (Alharthi, 2019) [9].
In this investigation, strain gauges were installed on the pile’s shaft (top, middle, and tip) to measure the axial force. Figure 3a–c presents the location of these gauges on the unpiled raft, single pile, and MPR system, and Table 4 presents a summary of the measured axial loads. It can be noted that the top gauge records the total shaft resistance, which increases with the increase in the relative density of the sand.

3. Test Results and Analysis

In this investigation, 21 laboratory tests were conducted on unpiled rafts, single micropiles, and micropiled-raft systems. Table 5 summarizes the testing program and the results of the present experimental investigation.

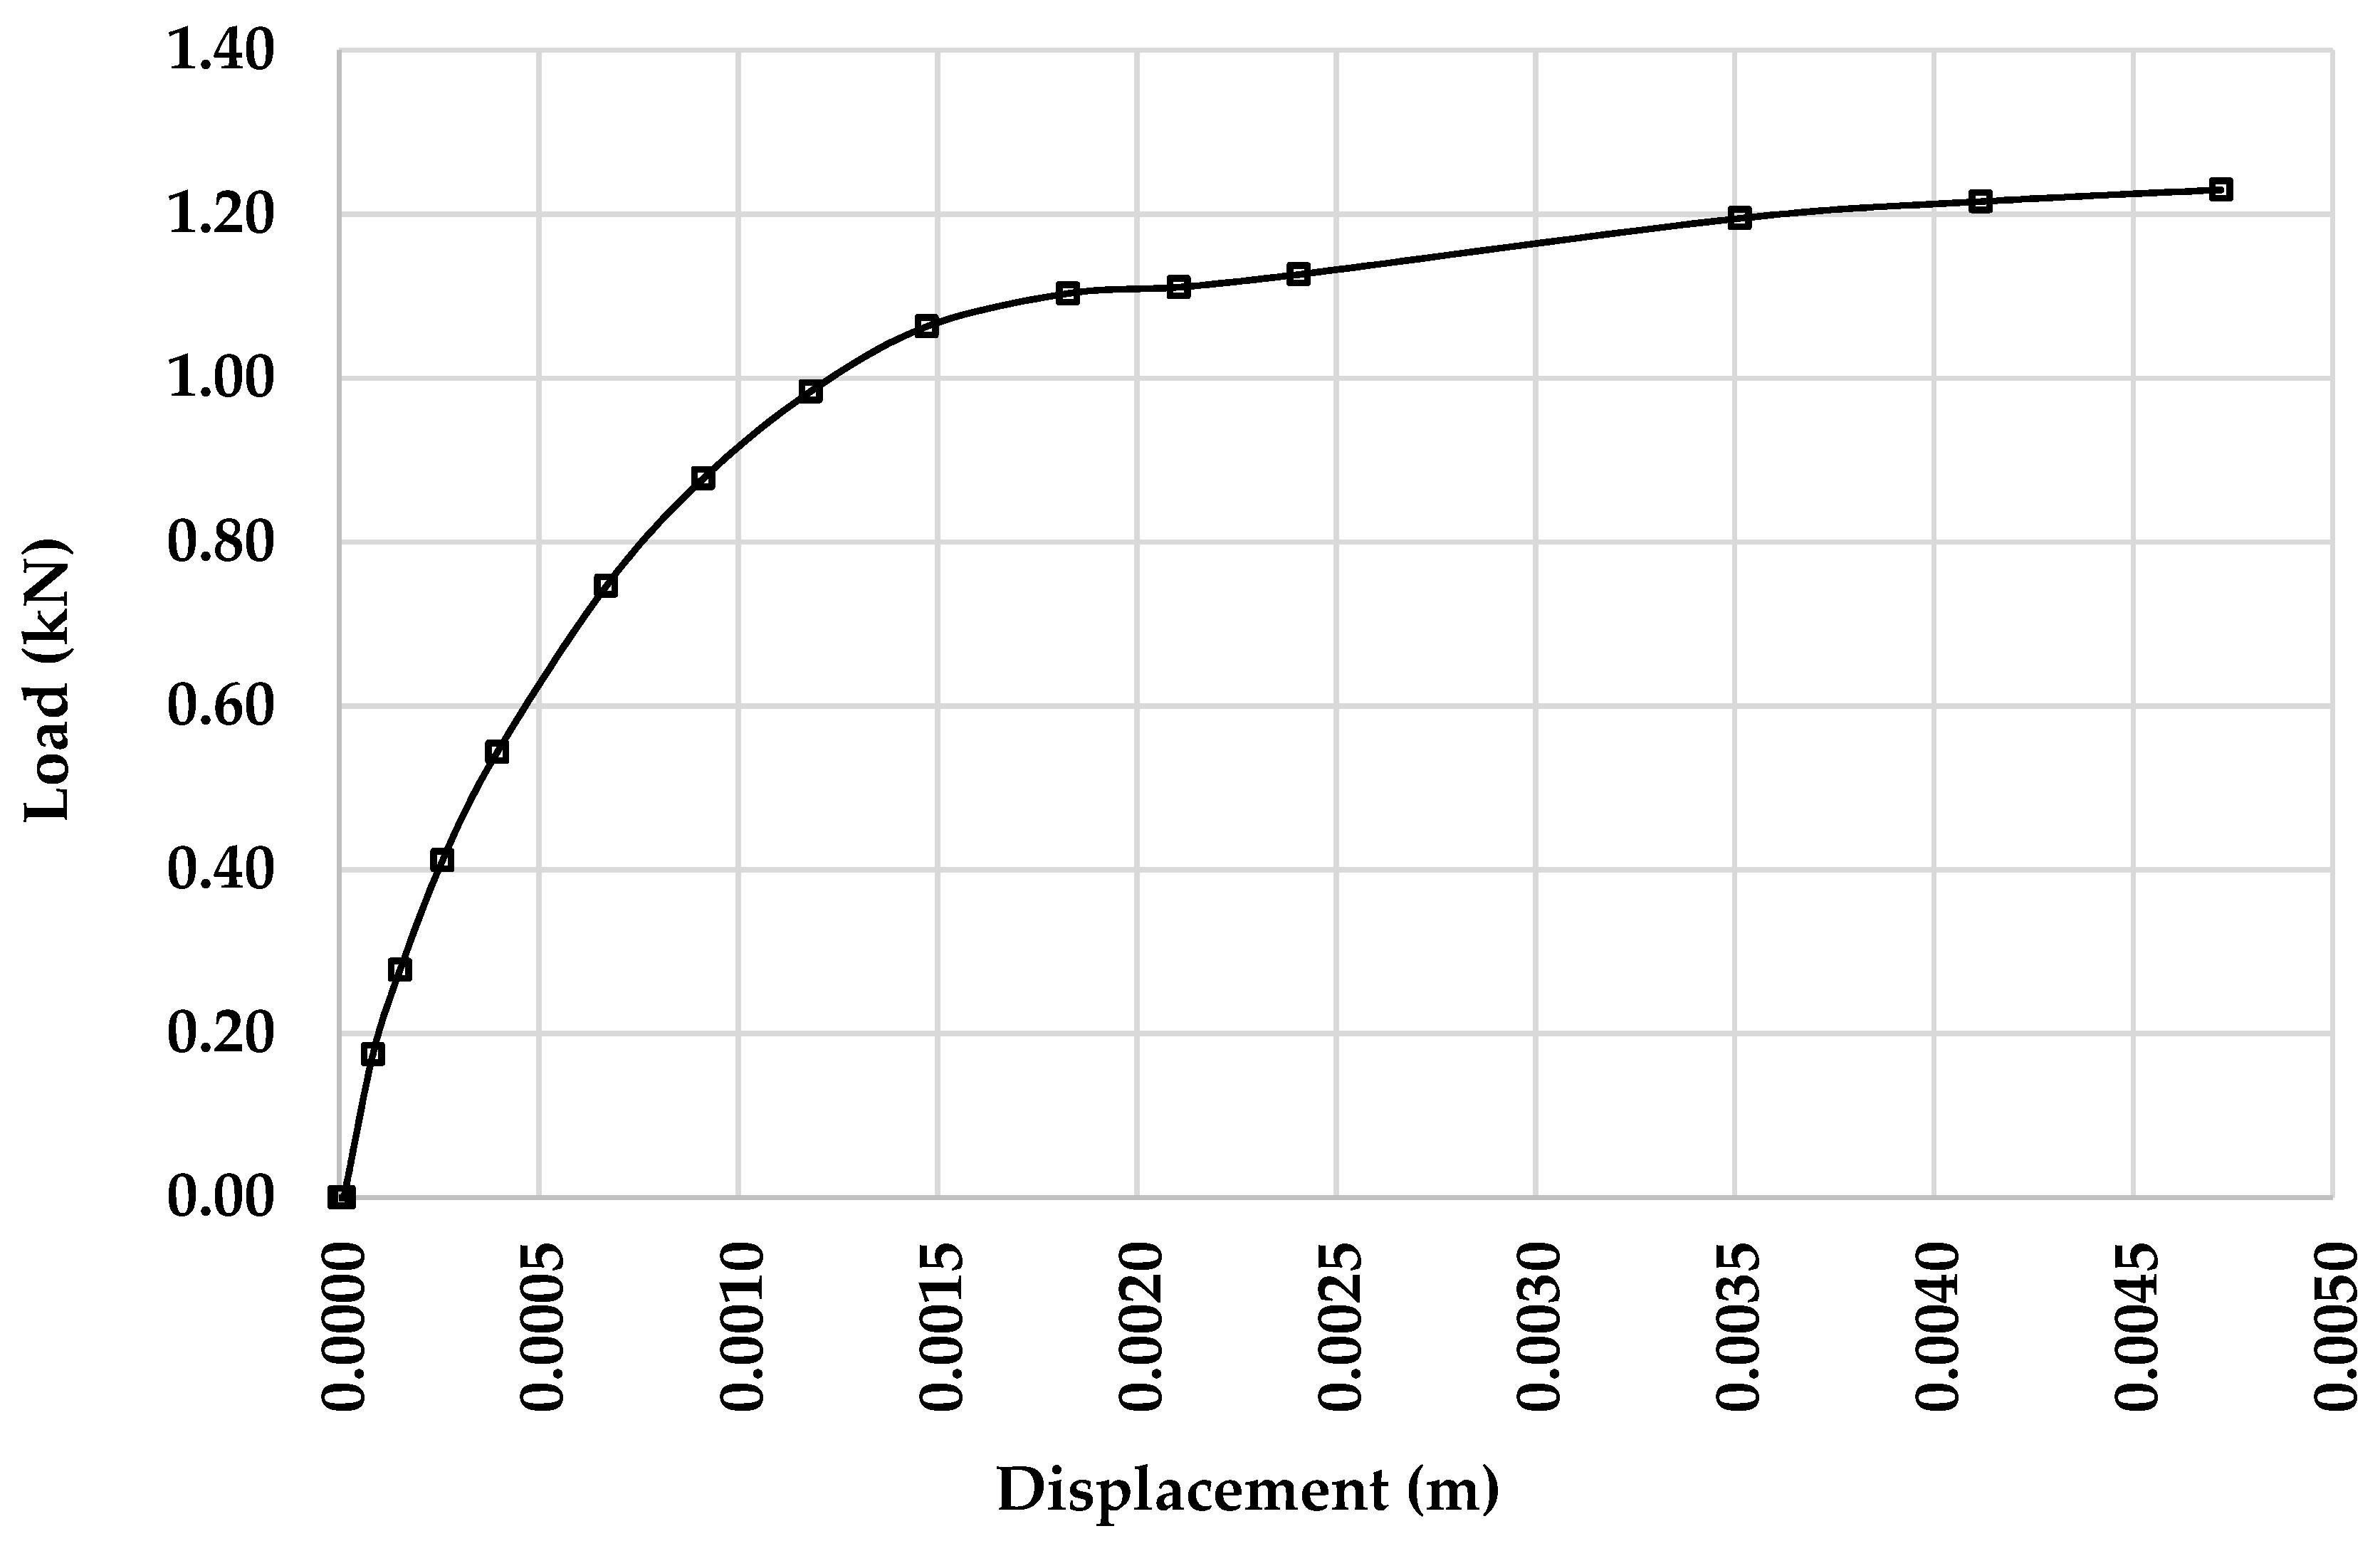
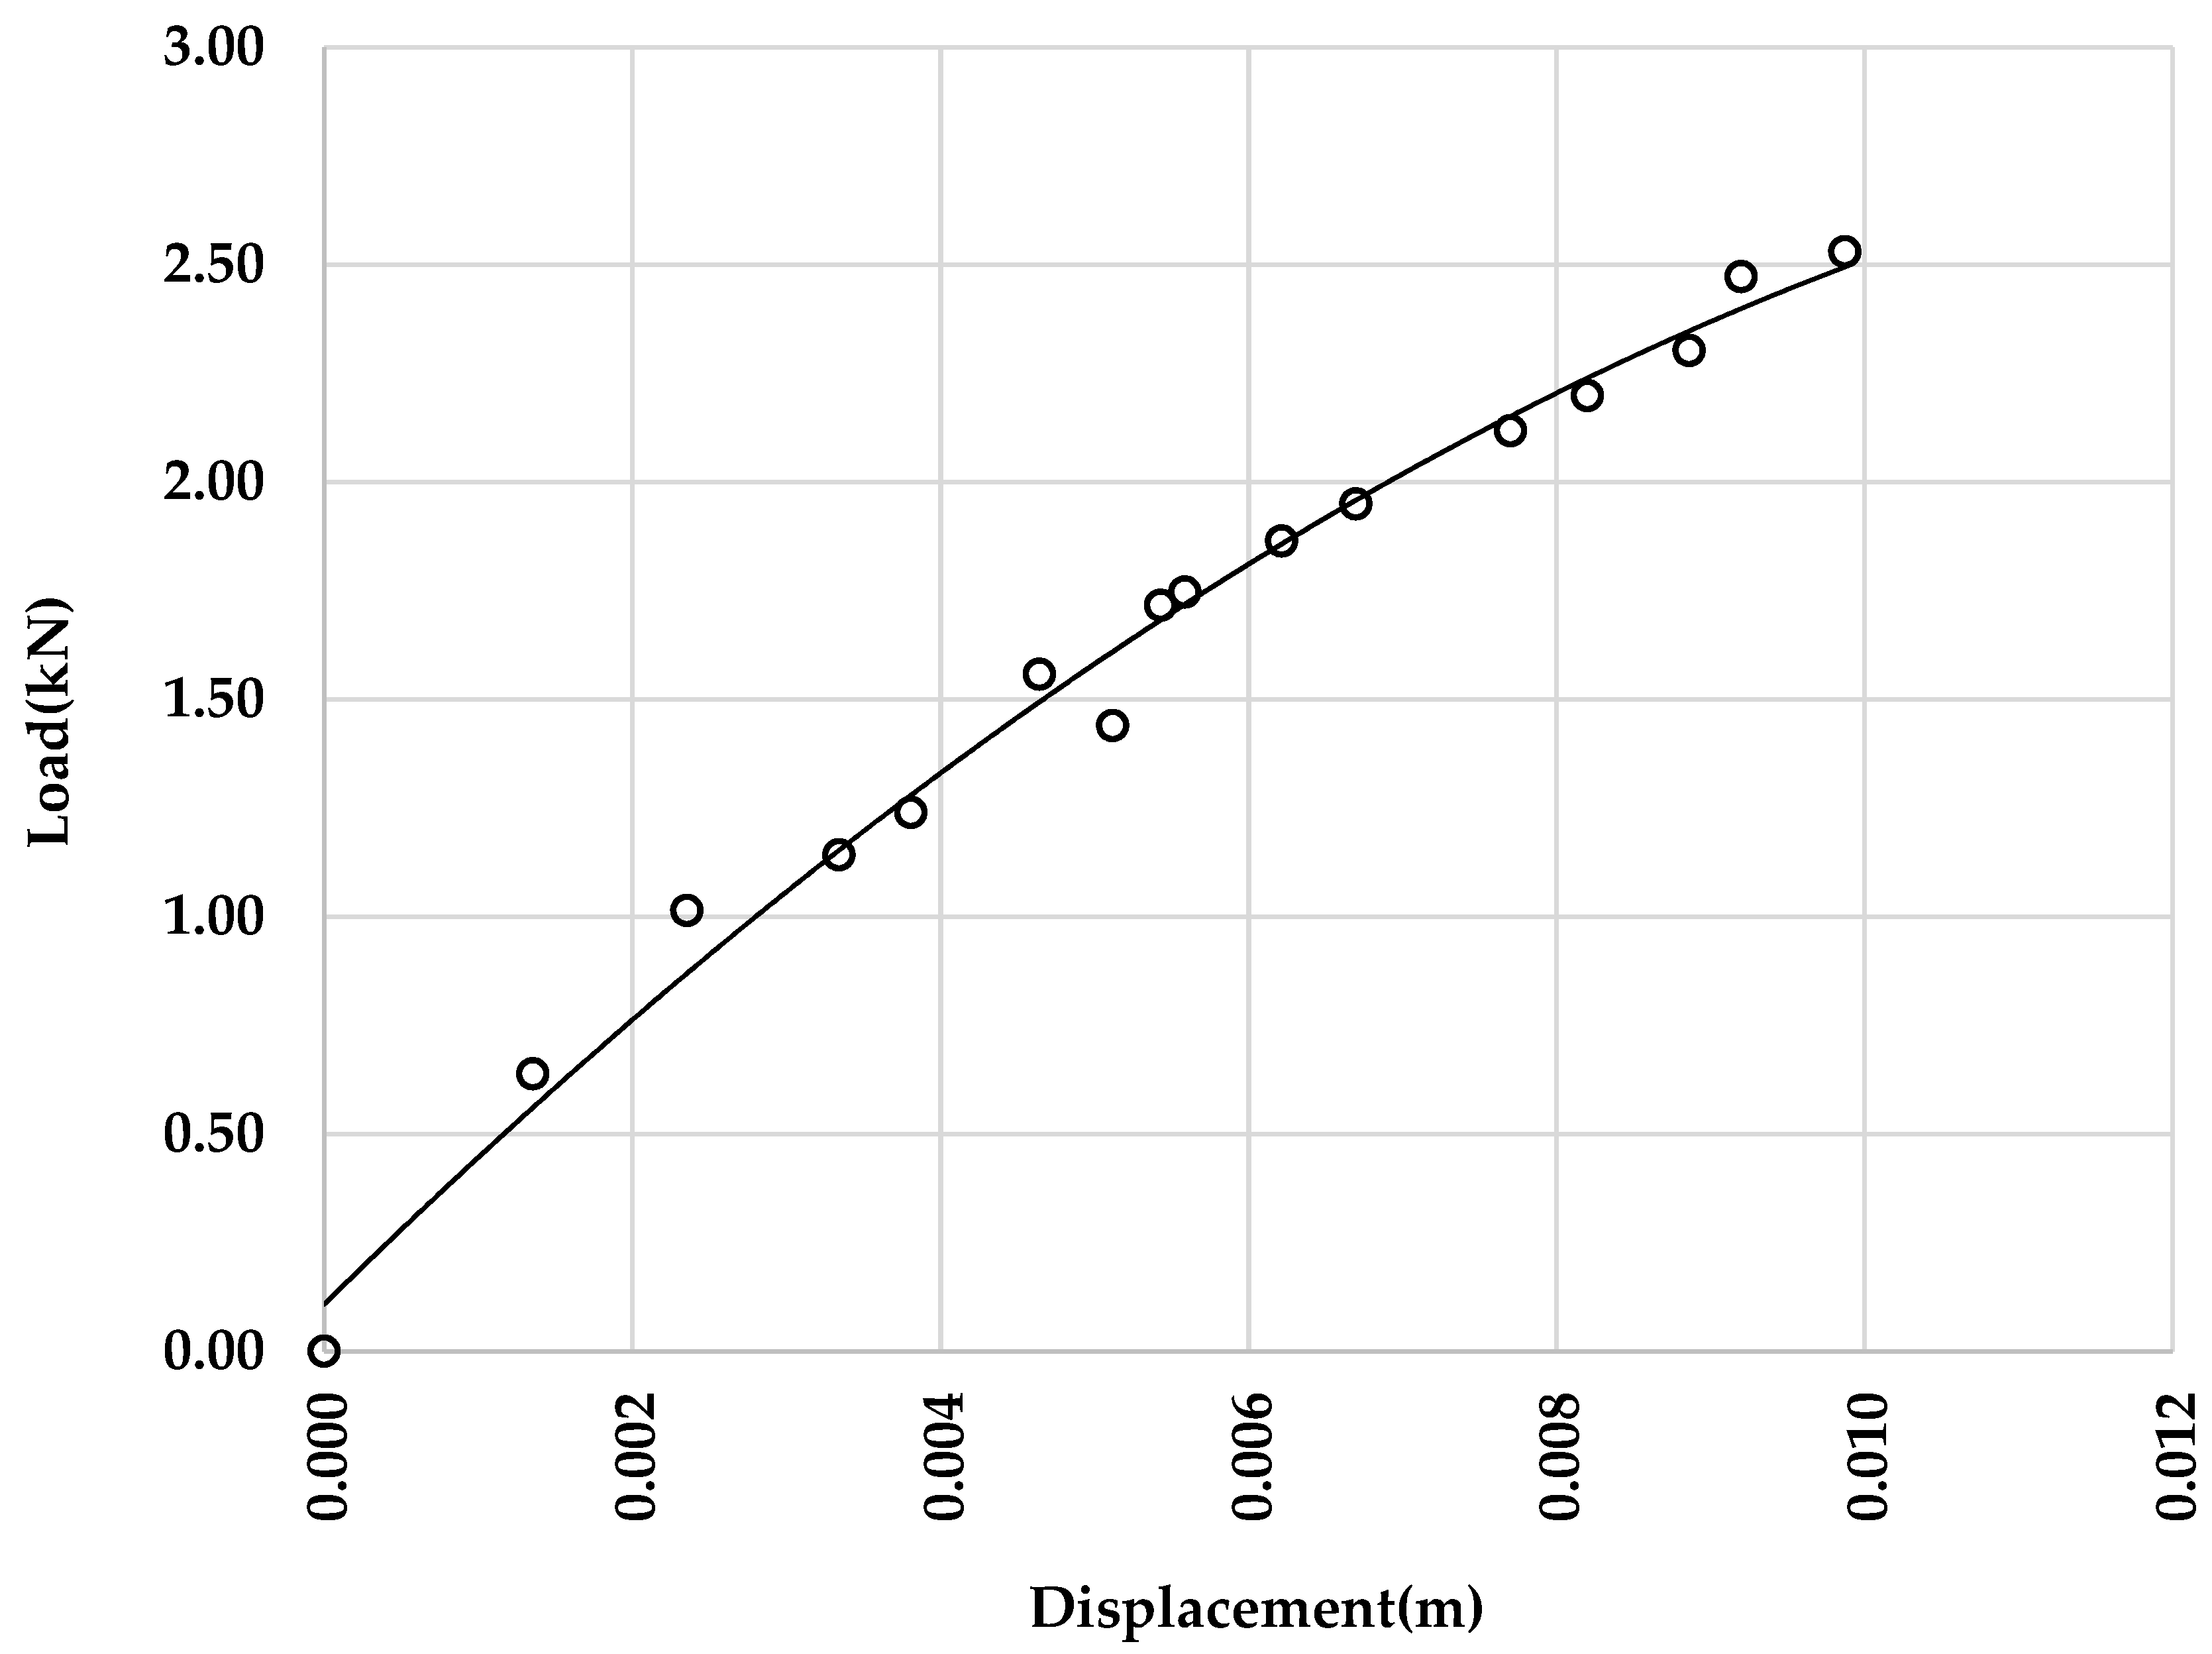
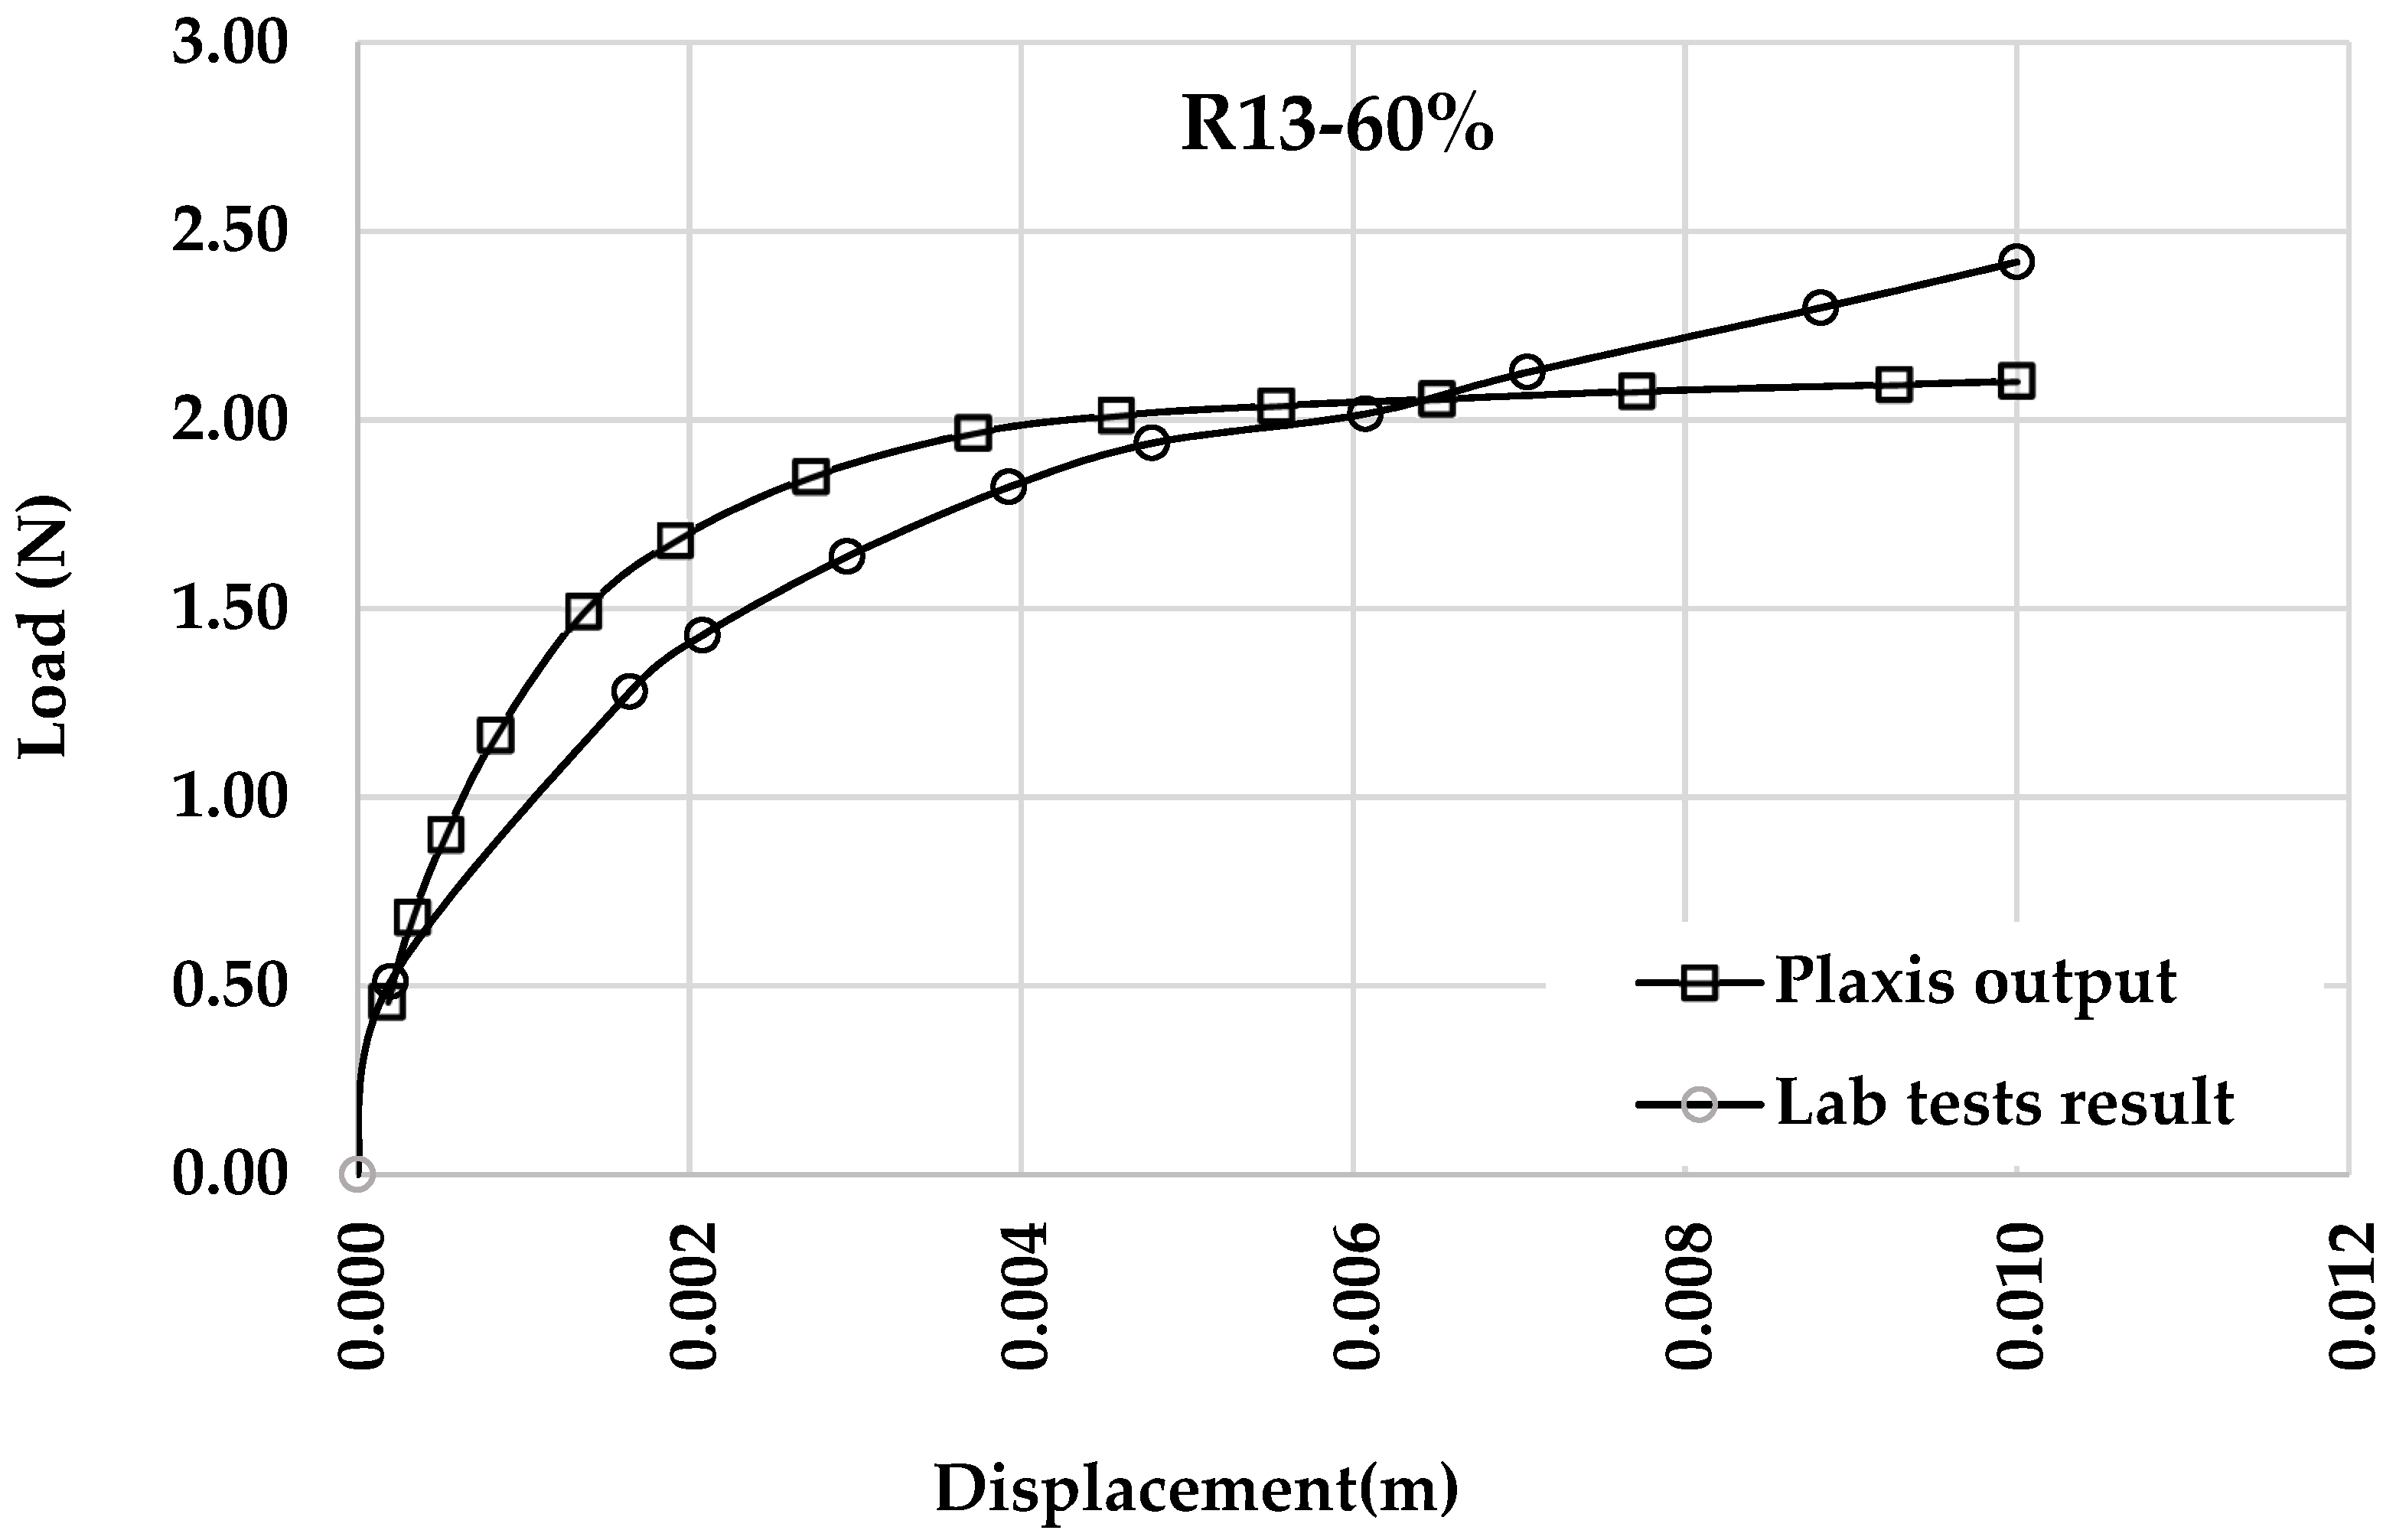
3.1. Validation of the Experimental Tests Results

The bearing capacity of the unpiled-raft foundations was compared with Terzaghi’s formula for the bearing capacity of shallow foundations, where a reasonable agreement was noted. Furthermore, the tip and the friction of a single pile were validated using the classic theory for piles in sand; once again, a good agreement was noted, which validates the test setup and test procedures of this investigation.
In this experimental investigation, a series of load tests on an unpiled raft were conducted (tests 1 to 9); the results were used as benchmarks to examine the contribution of the micropiles into the MPR system. The bearing capacity was taken at the point of maximum curvature on the load–settlement curve (Terzaghi et al., 1996) [10]. Figure 4 presents a typical load–settlement curve for this series.
A series of load tests on single micropiles driven into the sand bed (tests 10 to 12) were undertaken. The pile was driven into the sand using an electric actuator until it reached a settlement equal to 10% of the pile’s diameter (Terzaghi, et al., 1996) [10]. It was noted that about 25% of the total load was carried using the pile’s tip, while the 75% was taken by the pile’s shaft. Figure 5 presents a typical load–settlement cure for this series.
A series of load tests on a one-micropiled raft was performed in loose, medium, and dense sand (tests 13 to 15). Figure 6 presents the typical load–settlement curves for this series. It can be noted that the load taken by the raft decreased as the settlement increased. This can be explained by the fact that as the micropile sinks deeper into the sand, the shaft friction reaches full mobilization, and accordingly, the pile shares of the total load increase.
A series of load tests on a four-micropiled raft was conducted (tests 16 to 21). It was observed that, on average, when the spacing-to-diameter ratio (S/d) was 3, the pile tip carried approximately 35% of the total load on the micropile, while for S/d = 4, the pile tip carried about 25% of the total load. This can be explained by the fact that for a smaller S/d ratio, the piles may function as a group and not as four singles.
Figure 7 presents the load–settlement curves for the total load and the component of the raft and the piles. It can be noted that while the raft reaches its ultimate load faster, the piles continue to carry larger loads as the shaft resistance of the micropiles gradually reaches its full mobilization.
Figure 8 presents the load–settlement curves for the unpiled rafts, single micropiles, and the MPR system for the ratios of s/d equal 3 and 4, respectively. It can be noted that the load sharing for the micropiles decreases as the ratio of the pile spacing increases. This is due to the reduced interactions between piles for larger s/d ratios. Furthermore, the load shared by the micropiles increases with the increase in the relative density of the sand (Akinmusuru, 1980 [11]; Yamashita, et al., 2009 [12]; Alnuaim, 2014 [5]).

3.2. Numerical Modeling

A three-dimensional numerical model was developed to simulate the cases of micropiled-raft foundations (MPR) in sand, using the finite element technique and the commercial software “PLAXIS” (2021) [13].
In this investigation, the soil volume was modeled by means of 10-node tetrahedral elements. The interpolation functions, their derivatives, and the numerical integration of this type of element are described in the “PLAXIS” manual. Tetrahedral elements are capable of being unstructured and reshaped to fit the given geometry arbitrarily. The boundary conditions of the models were created automatically using PLAXIS. The bottom of the model was fixed in all directions (X, Y, and Z), whereas the sand on the vertical sides was restricted in the horizontal direction. To simulate the interaction between the structure and soil, interface elements were added. The thickness of the raft was calculated using Fraser and Wardle’s formula (1976) [14], Horikoshi and Randolph (1997) [15], and El Hammouli et al. (2021) [16].
The constitutive law of Mohr–Coulomb was used to model Linear Elastic–Perfectly Plastic, which is suitable for modeling stiff volumes such as sand, concrete, or rock formations; Hanna and Vakili (2019) [17], Alnuaim (2014) [5], and Sinha, A and Hanna, A.M. (2017) [18]. The concrete used for the piles and the raft were simulated as a linear elastic. The main parameters used in this model were as follows: Young’s modulus (E), Poisson’s ratio (ν), the cohesion (c), the friction angle (φ), and the dilatancy angle (ψ).

3.3. Validation of the Numerical Model:

The results produced using the present numerical model were validated with the experimental results of the present investigation for the case of the unpiled raft. Figure 9 presents these results in graphical form, where good agreement can be noted.

3.4. Numerical Test Program

After validating the numerical model, it was used to generate data for a wide range of parameters that govern the performance of the micropiled raft (MPR). Table 6 presents a summary of the testing program.

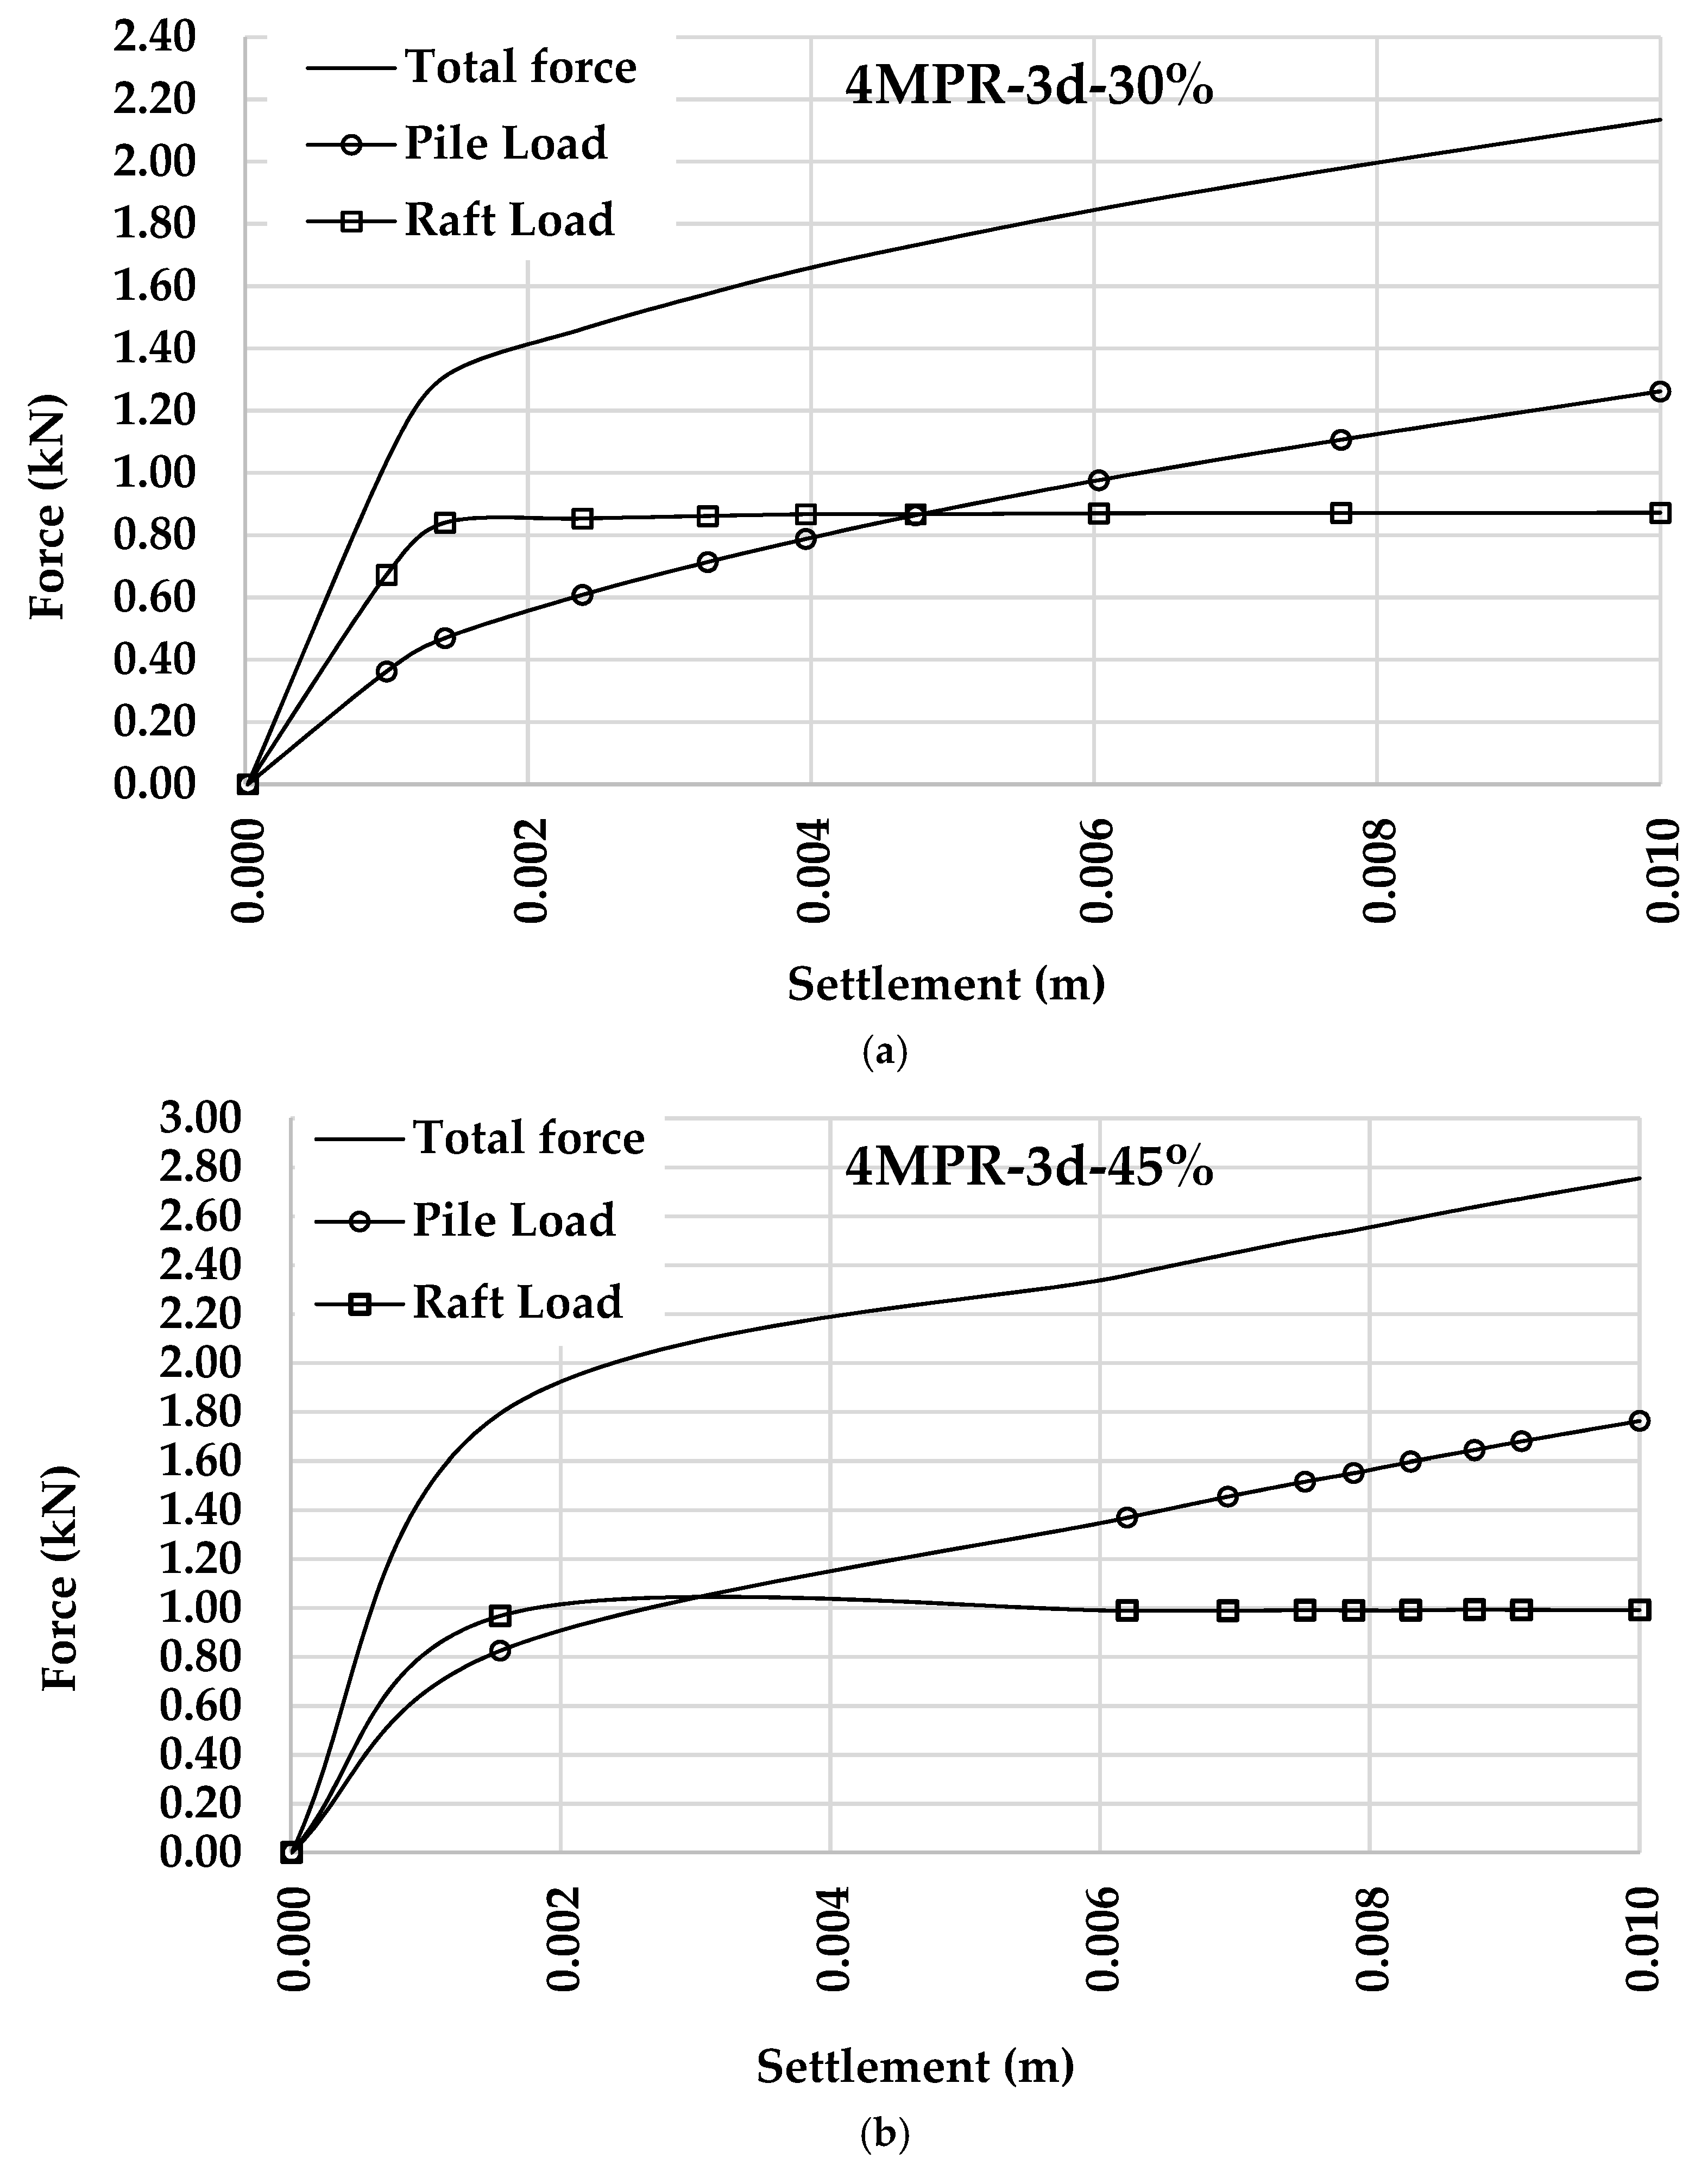
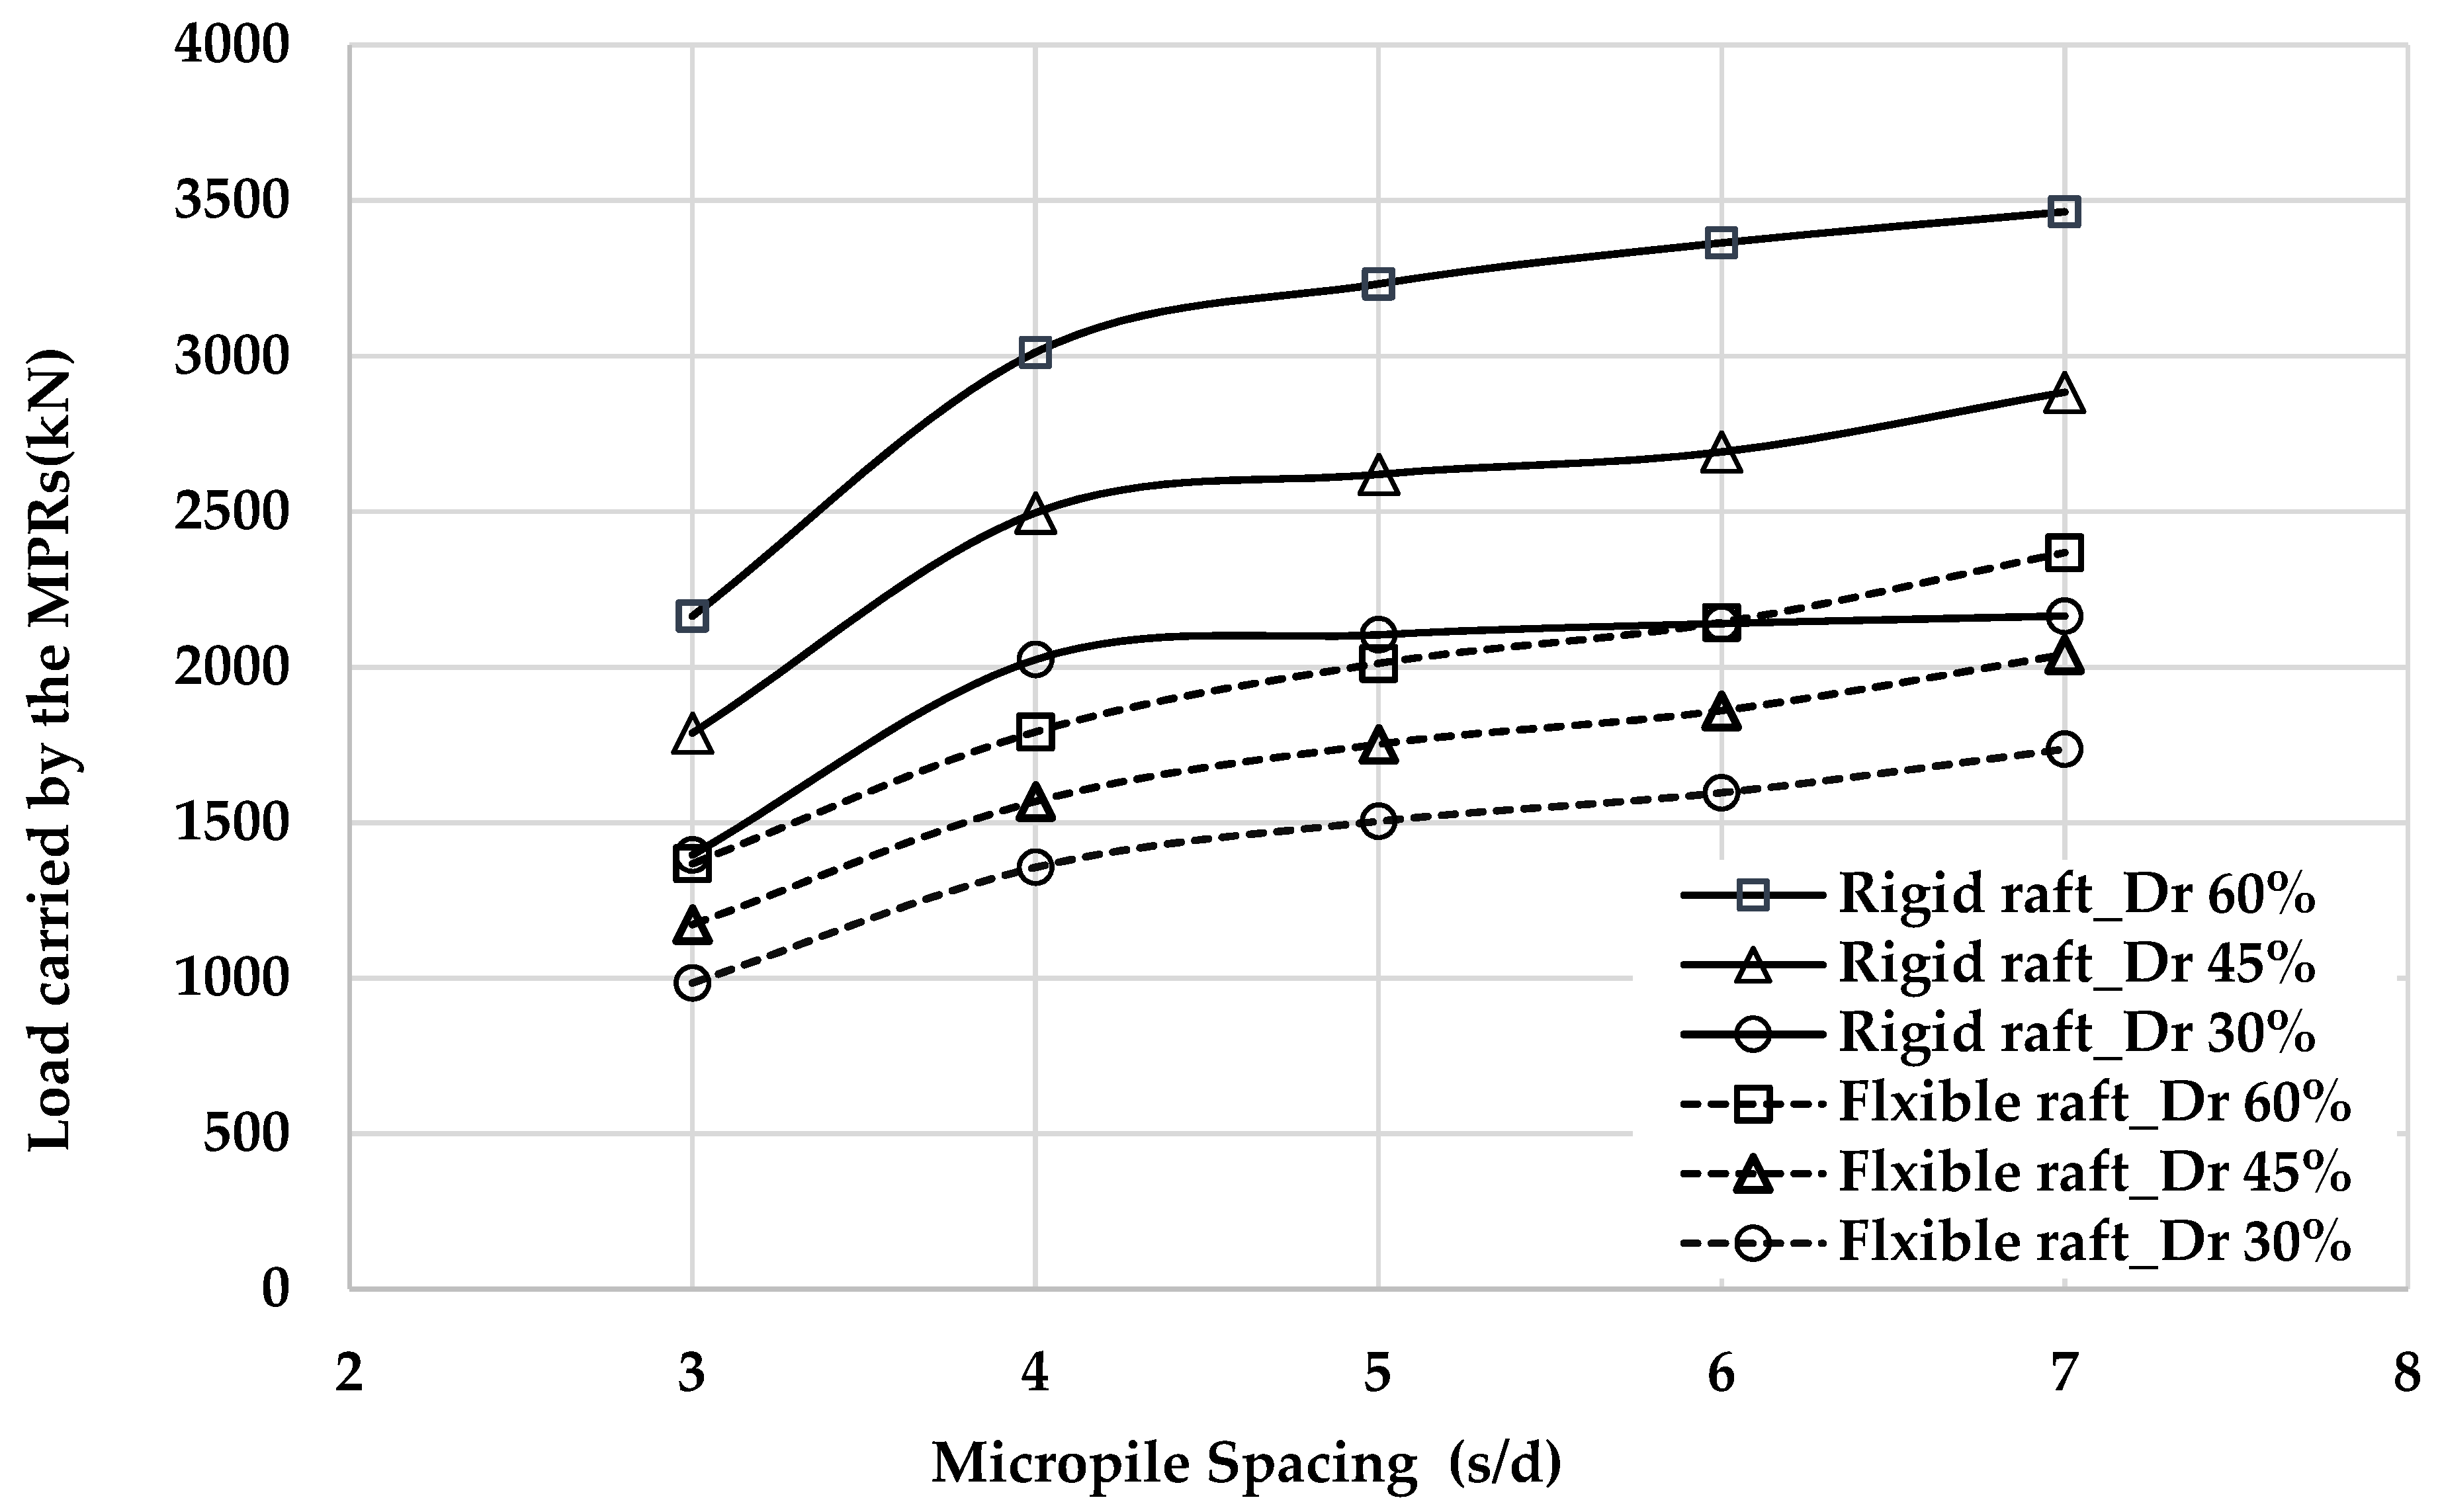
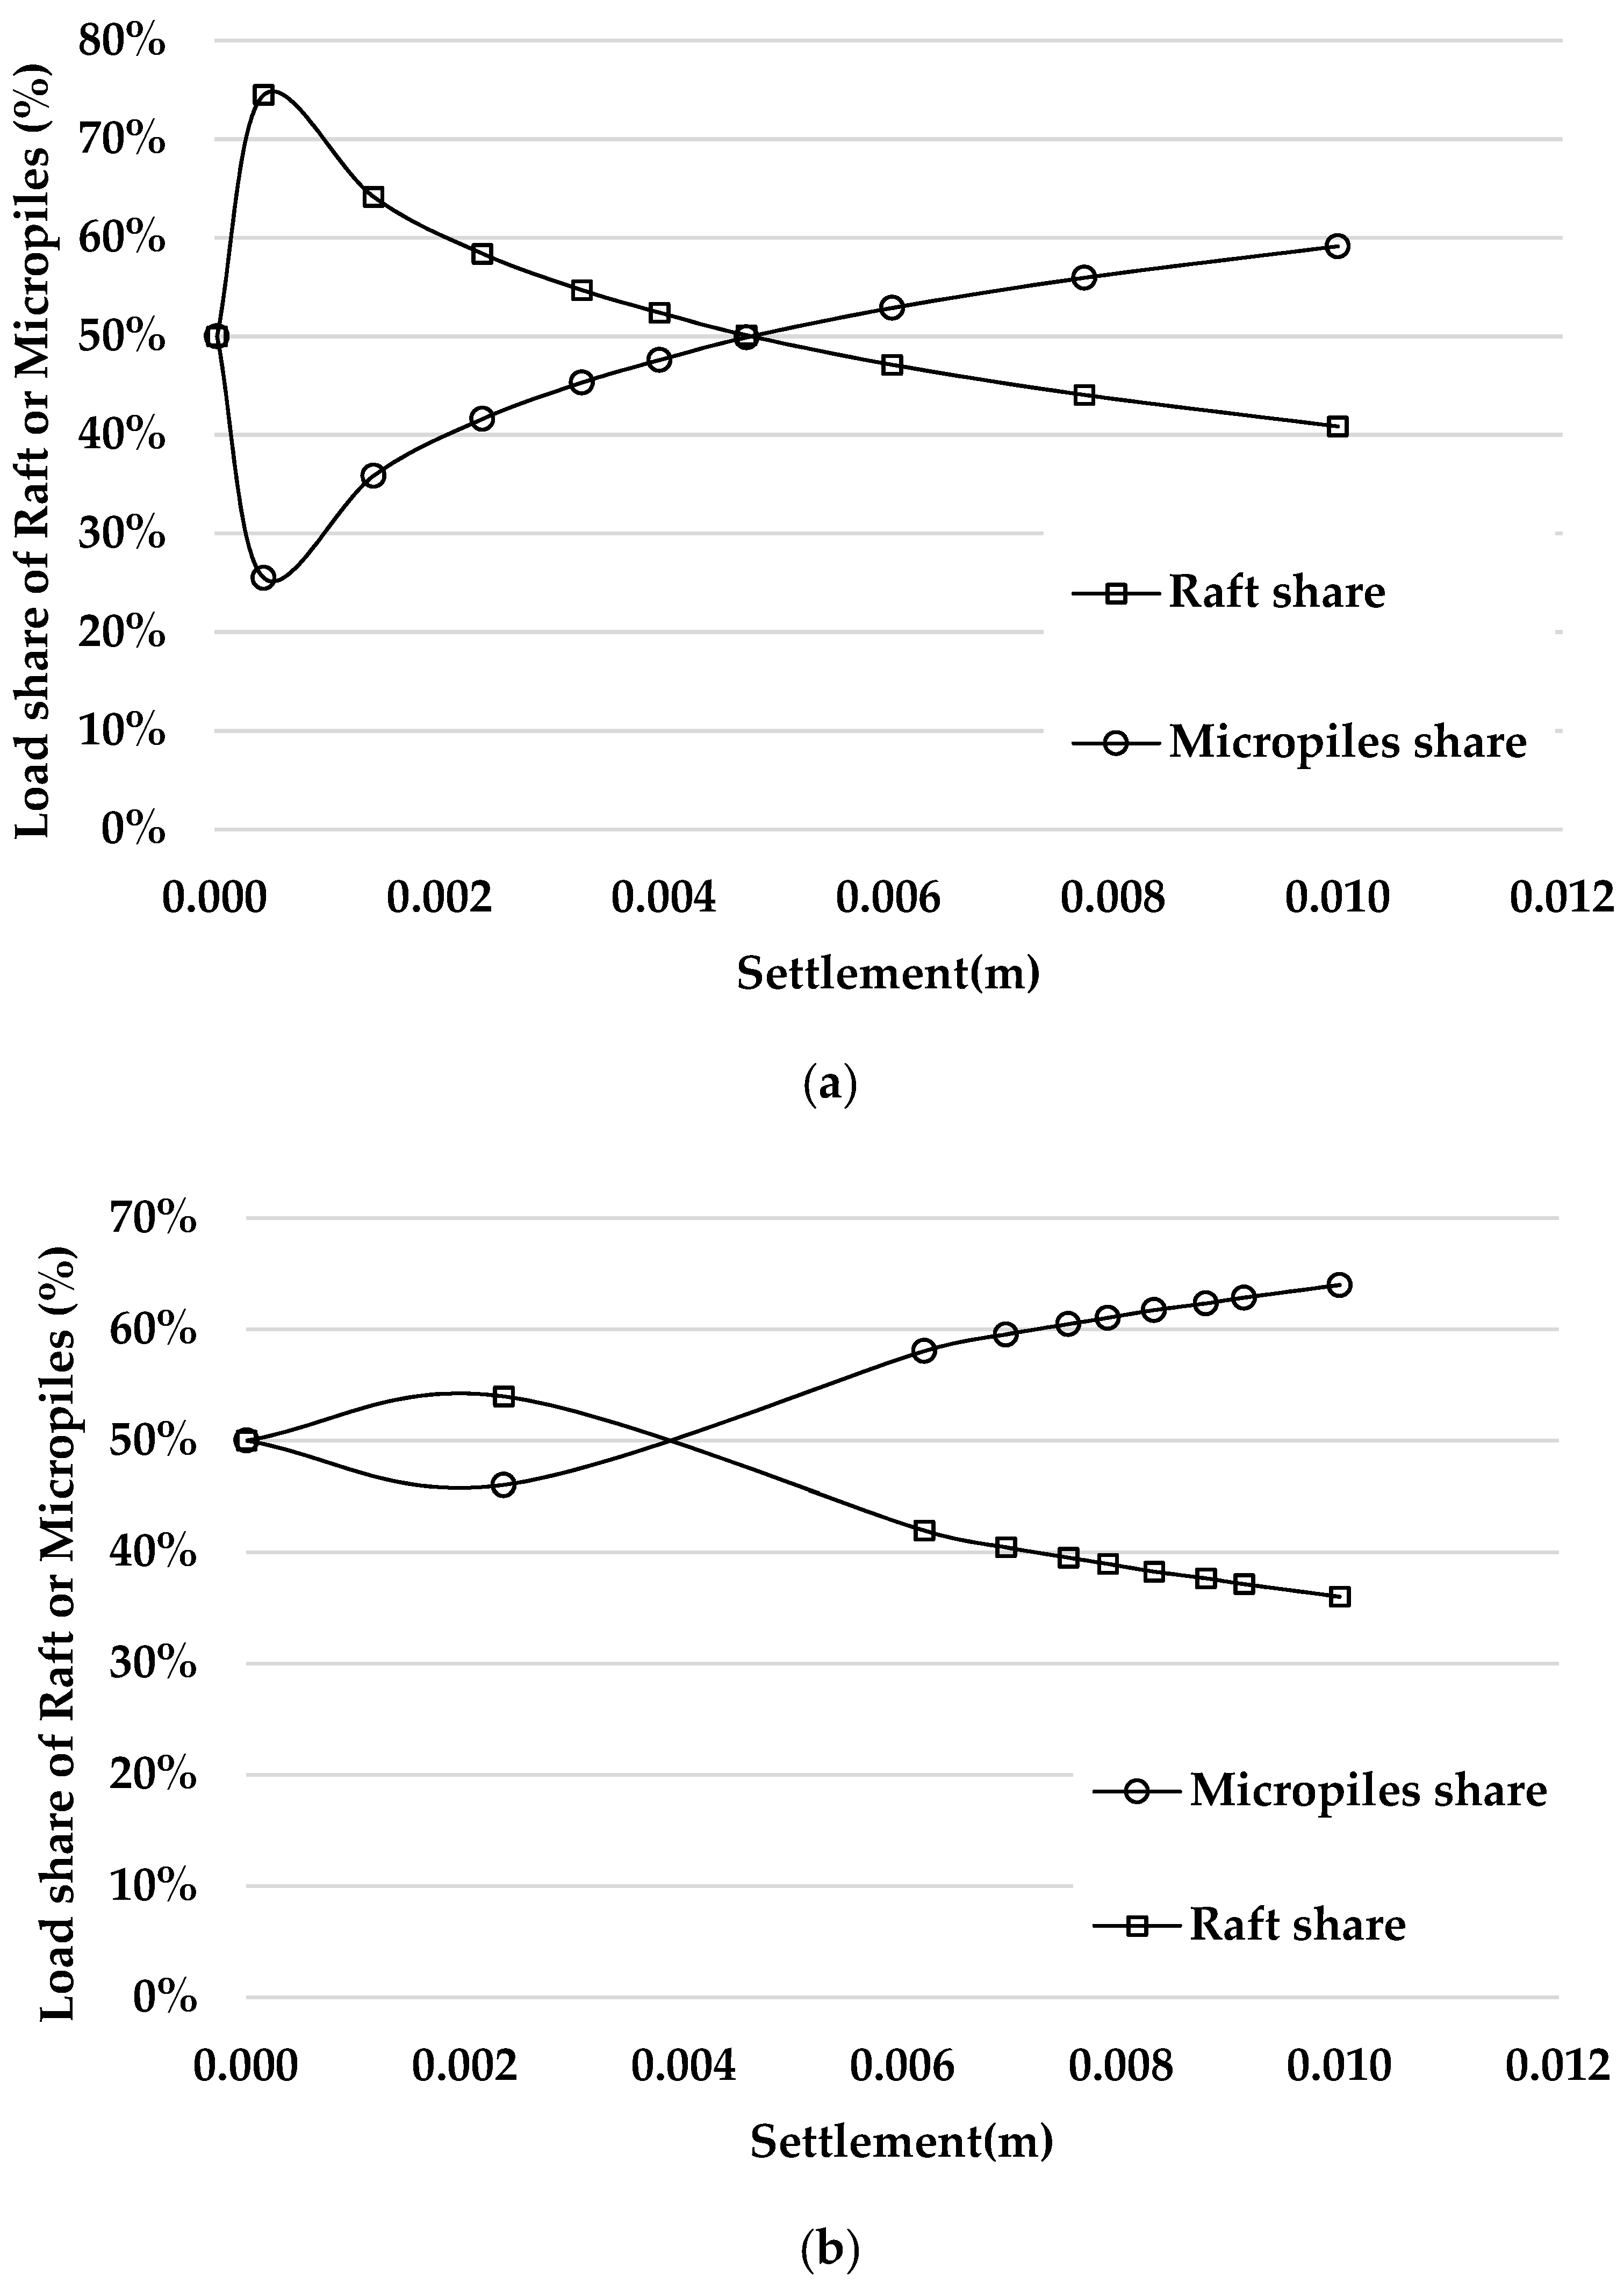
3.5. Test Results and Anaylsis
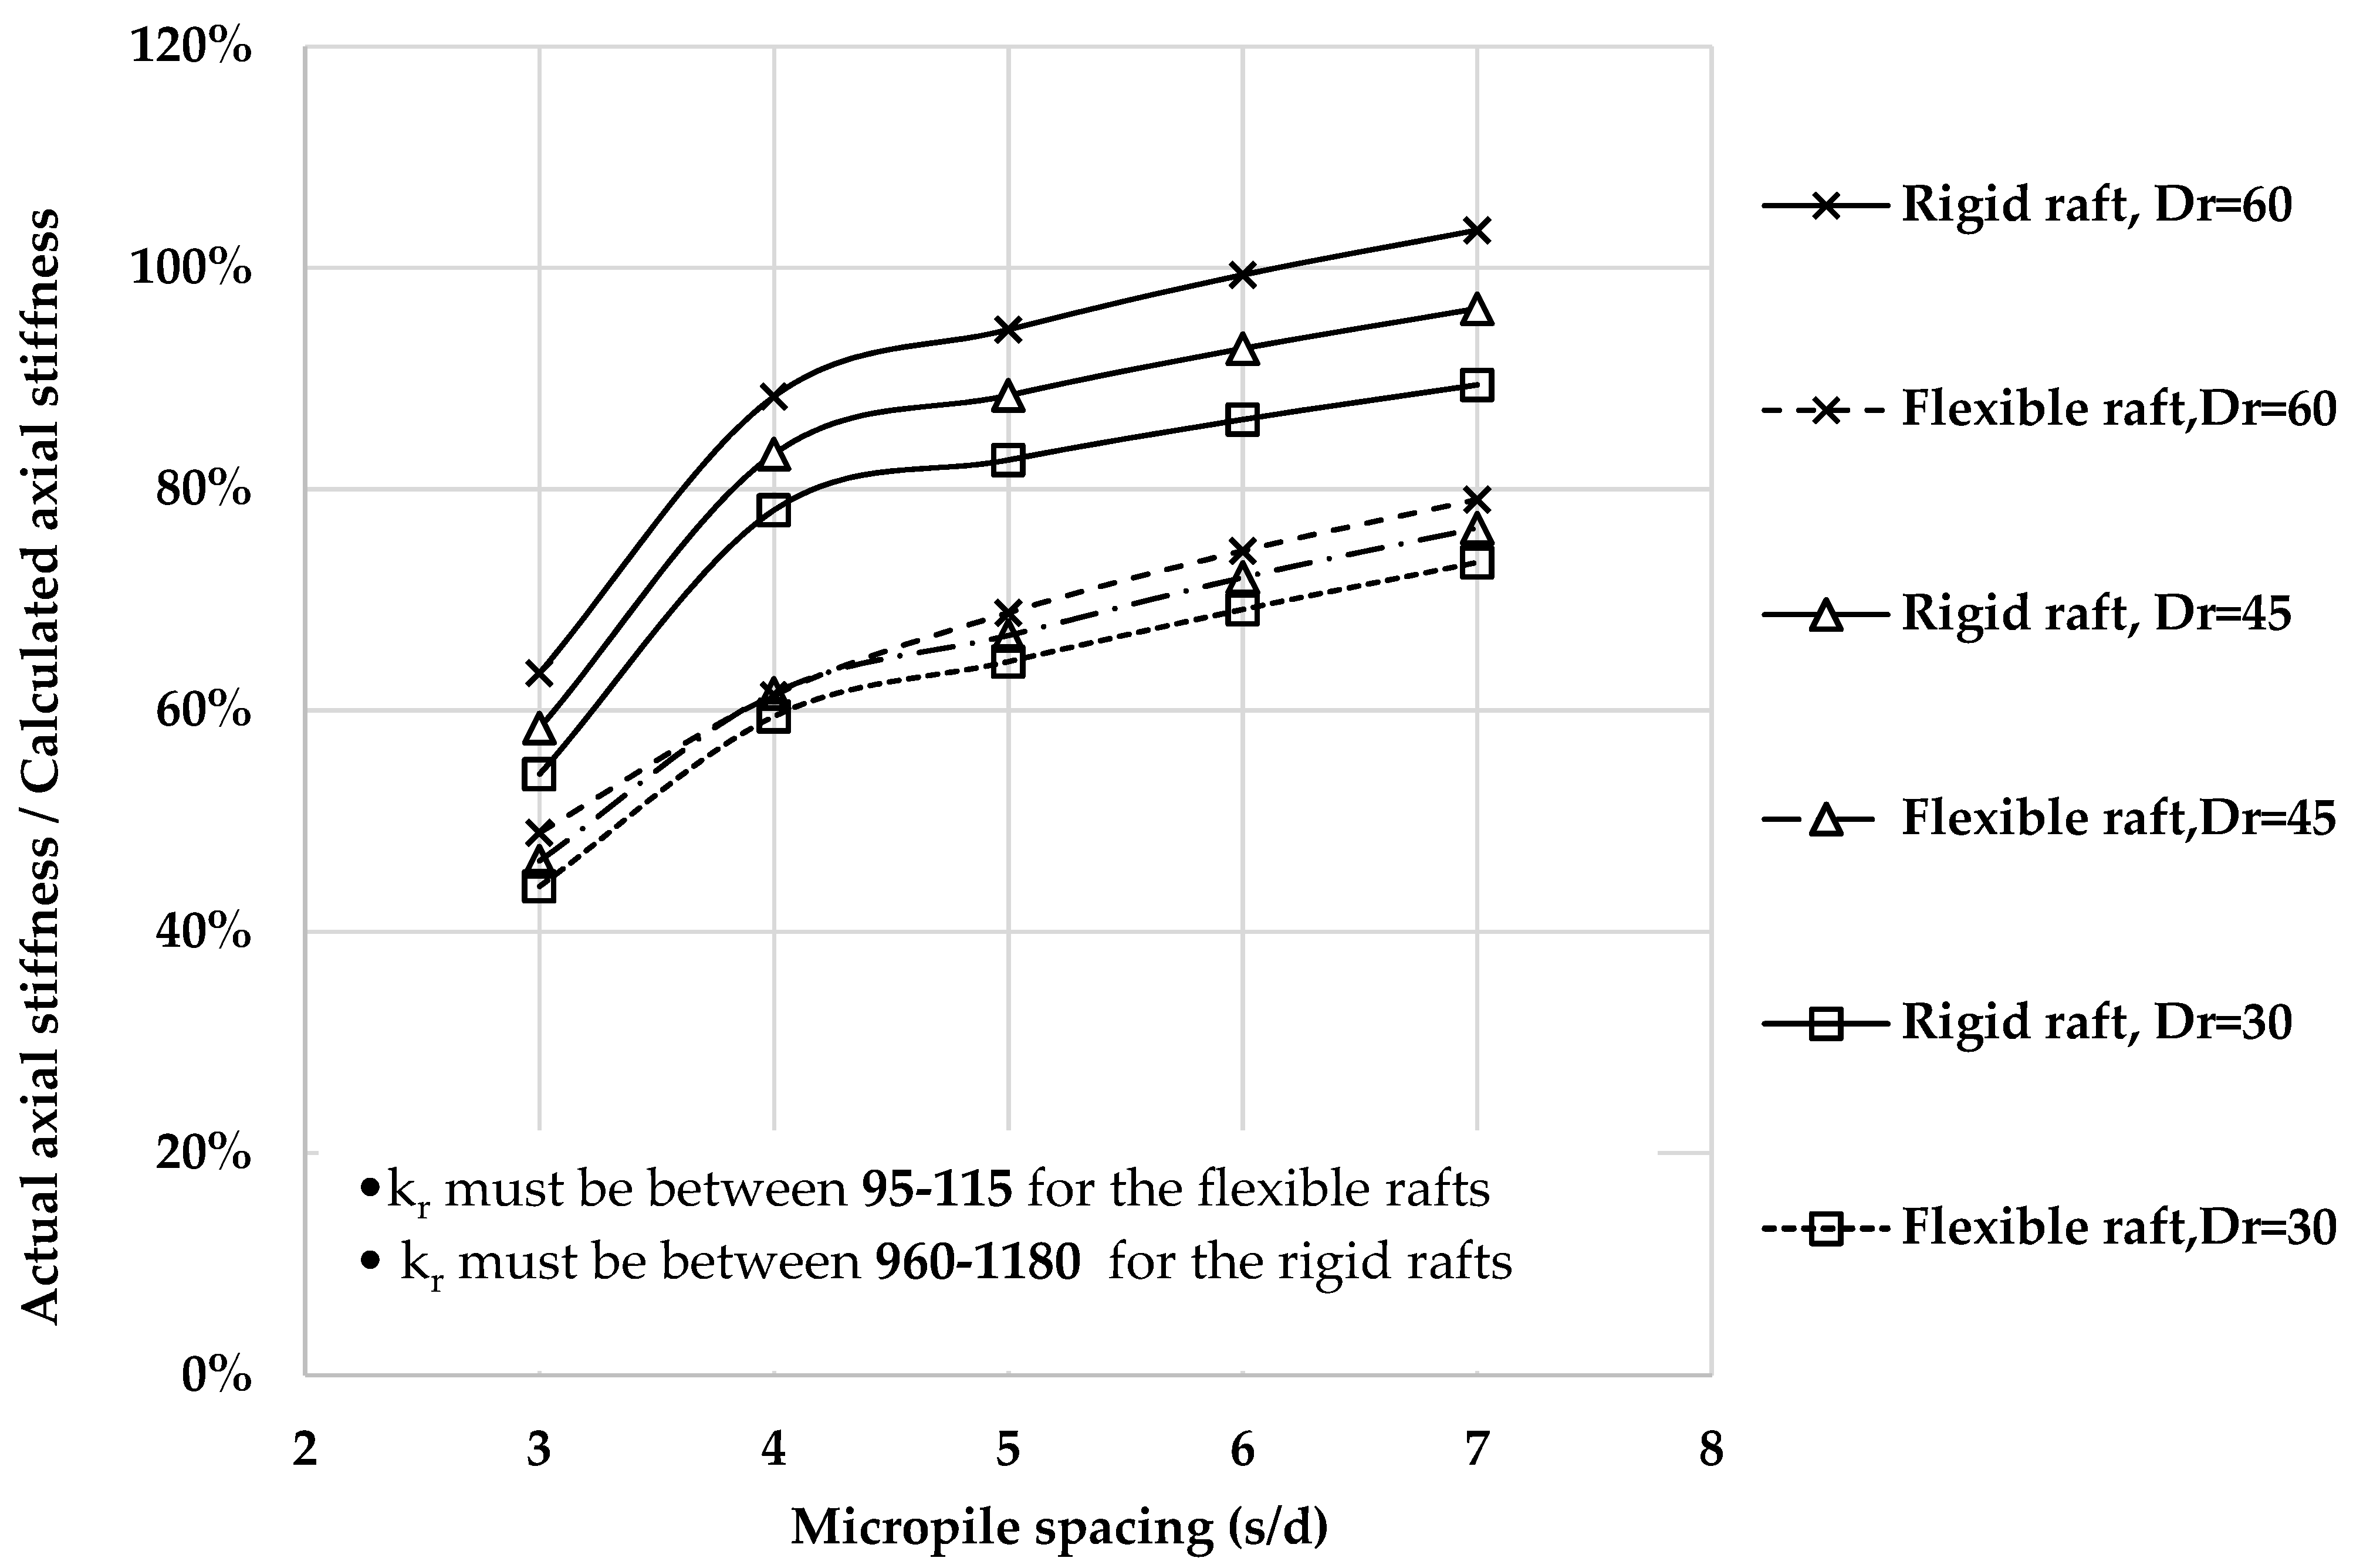
In general, and based on the present experimental and numerical investigations, the capacity of the MPR increases with the increase in the relative density of sand, experiencing less settlements. Furthermore, the MPR in dense sand experiences relatively higher skin friction, and the contact pressure on the raft is relatively smaller due to the small settlement of MPR.
Figure 10 presents the MPR capacity versus the piles’ spacing for rigid and semi-flexible rafts. It can be noted that MPRs with rigid rafts showed very little sensitivity to the pile’s spacing, and a higher capacity as the piles’ spacing increases. However, for larger spacing, rafts experience a bending moment. Furthermore, rigid rafts utilize piles equally, which increases the capacity of the MPR and reduces settlement. While for the flexible raft the MPR capacity is significantly less, the rafts experience a bending moment and the piles do not carry equal loads. It should be reported herein that for the design of a pile foundation the raft must be rigid in order distribute the load equally on all piles. However, in cases of underpinning, MPR often uses flexible rafts due to a lack of space.
The bearing capacity of rigid rafts exceeds that of semi-flexible rafts. This is due to the fact that for flexible rafts, some piles are over-loaded and reach their ultimate capacity, while others carry less. Horikoshi and Randolph, 1997 [15], reported that for piles in rigid rafts, the pressure at the center of the footing is the highest and reaches zero at the edges. Therefore, the inclusion of micropiles enhances the pressure distribution profile of the MPR, as they create rigid supporting points underneath the raft.
Figure 11a,b presents the load shared by the raft and the micropiles. It can be noted that the raft initiates the support to the system; then, due to the increase in the settlement, the tip and the shaft’s resistance of the piles are mobilized and provides superior support to the system, while no further increase in the load is taken by the cap.

3.6. Design of MPR

The test results of the present numerical model were used to evaluate the method proposed by Poulos, Davis, and Randolph [19] for the design of a conventional piled-raft system under vertical loads. The method is based on the evaluation of the axial stiffness of the system, which is used to predict the load–settlement behavior of piled-raft foundations, provided that the soil remains in the elastic zone.
In this investigation, the stiffness of the MPR system was calculated from the load–settlement curves. The linear part of the curves identifies the elastic zone and the slope of the curves was used to calculate the axial stiffness of the MPR system. Figure 12 presents the ratio of the actual to anticipated axial stiffness (by PDR). It can be noted that the PDR method overestimates the axial stiffness of the MPR. A correction factor (ψ) was introduced based on the best curve fitting technique to adopt the axial stiffness values calculated using the PDR method. This correction can be computed using the formula given below, which is a function of the raft and soil stiffness as well as the micropile spacing ratio. The coefficients and the constant values are given according to the type of load, raft rigidity, and relative density of the sand.
K p r = ( ψ ) K p g + ( 1 2 a r p ) K r 1 ( a r p 2 ( K r / K p g ) )
where
Kpr = stiffness of piled raft;
Kpg = stiffness of the pile group;
Kr = stiffness of the raft alone;
arp = raft − pile interaction factor.
ψ = a + b · ln β + c l n ( D r )
β = s/d, 30 ≤ Dr ≤ 60, and Dr, b, and c are given as follows:
Coefficient\Raft Stiffness95 < Kr < 115960 < Kr < 1180
a−0.07−0.41
b0.270.42
c0.040.13

4. Conclusions

Experimental and numerical investigations were conducted to examine the performance of a micropiled raft in sand. The following was concluded:
  • MPRs with rigid rafts support more load than those with semi-flexible rafts at any given settlement.
  • The capacity of the MPR increases with the increase in the piles spacing for semi-rigid rafts; however, for rigid rafts, the increase is insignificant.
  • The load shared by the micropiles decreases with the increase in the pile’s spacing ratio. This is due to the reduced interactions between piles. Furthermore, it increases with the increase in sand relative density.
  • The settlement of MPR decreases with the increase in the relative density of the sand.
  • The recommended skin friction values by FHWA were in reasonable agreement with the results of the present investigation; however, this agreement was noted only for large settlements.
  • The PDR method overestimates the axial stiffness for the MPRs that are subjected to vertical loads, which was higher for MPRs with semi-flexible rafts.
  • A correction factor was introduced to adopt the PDR of Poulos, Davis, and Randolph (PDR, 2001) as a method for the design of MPR.

Author Contributions

Conceptualization, A.H. and F.N.; methodology, A.H. and F.N.; software, A.H. and F.N.; validation, A.H. and F.N.; formal analysis, A.H. and F.N.; investigation, A.H. and F.N.; resources, A.H. and F.N.; data curation, A.H. and F.N.; writing—original draft preparation, A.H. and F.N.; writing—review and editing, A.H. and F.N.; visualization, A.H. and F.N.; supervision; project administration, A.H.; funding acquisition, A.H. All authors have read and agreed to the published version of the manuscript.

Funding

This research was funded by NSERC, Canada.

Institutional Review Board Statement

Not applicable.

Data Availability Statement

All data and materials are available on request from the corresponding authors.

Acknowledgments

The authors acknowledge the financial support received from the “Natural Science and Engineering Research Council of Canada” (NSERC) and Concordia University.

Conflicts of Interest

The authors declare no conflict of interest.

References

  1. Lizzi, F. The Static Restoration of Monuments: Basic Criteria-Case Histories, Strengthening of Buildings Damaged by Earthquakes; Sagep: Genova, Italy, 1982. [Google Scholar]
  2. Bruce, D.A.; DiMillio, A.F.; Juran, I. Introduction to Micropiles: An International Perspective. In Proceedings of the Conference of the Geotechnical Engineering Division of the ASCE in Conjunction with the ASCE Convention, San Diego, CA, USA, 22–26 October 1995; pp. 1–26. [Google Scholar]
  3. Horikoshi, K.; Matsumoto, T.; Hashizume, Y.; Watanabe, T.; Fukuyama, H. Performance of piled raft foundations subjected to static horizontal loads. Int. J. Phys. Model. Geotech. 2003, 3, 37–50. [Google Scholar] [CrossRef]
  4. Tsukada, Y.; Miura, K.; Tsubokawa, Y.; Otani, Y.; You, G.L. Mechanism of Bearing Capacity of Spread Footings Reinforced with Micropiles. Soils Found. 2006, 46, 367–376. [Google Scholar] [CrossRef]
  5. Alnuaim, A.M.; EI Naggar, M.H.; El Naggar, H. Performance of micropiled raft in sand subjected to vertical concentrated load: Centrifuge modeling. Can. Geotech. J. 2014, 52, 33–45. [Google Scholar] [CrossRef]
  6. Kyung, D.; Kim, D.; Kim, G.; Lee, J. Vertical load-carrying behavior and design models for micropiles considering foundation configuration conditions. Can. Geotech. J. 2017, 54, 234–247. [Google Scholar] [CrossRef]
  7. Moghaddam, H.M.; Keramati, M.; Amin, R.; Reza, N. Experimental Evaluation of the Effects of Structural Parameters, Installation Methods, and Soil Density on the Micropile Bearing Capacity. Int. J. Civ. Eng. 2021, 19, 1313–1325. [Google Scholar] [CrossRef]
  8. FHWA. Micropile Design and Construction; National Highway Institute: Washington, DC, USA, 2005. [Google Scholar]
  9. Alharthi, Y.; Hanna, A. Shaft Resistance of Driven Piles in Overconsolidated Cohesionless Soils. In Proceedings of the 2nd GeoMEast International Congress and Exhibition on Sustainable Civil Infrastructures, Giza, Egypt, 23–28 November 2018; pp. 232–246. [Google Scholar] [CrossRef]
  10. Terzaghi, K.; Peck, R.B.; Mesri, G. Soil Mechanics in Engineering Practice, 1st ed.; John Wiley & Sons: New York, NY, USA, 1996. [Google Scholar]
  11. Akinmusuru, J.O. Interaction of piles and cap in piled footings. J. Geotech. Eng. Div. 1980, 106, 1263–1268. [Google Scholar] [CrossRef]
  12. Yamashita, K.; Yamada, T.; Hamada, J. Recent case histories on monitoring settlement and load sharing of piled rafts in Japan. In Proceedings of the 5th International Geotechnical Seminar on Deep Foundations on Bored and Auger Piles BAPV, University Main Hall, Ghent, Belgium, 7–11 September 2008. [Google Scholar]
  13. Plaxis. PLAXIS 3D 2021; Reference Manual; Bentley: Delft, The Netherlands, 2021. [Google Scholar]
  14. Fraser, R.A.; Wardle, L.J. Discussion: Numerical analysis of rectangular rafts on layered foundations. Géotechnique 1976, 28, 211–212. [Google Scholar] [CrossRef]
  15. Horikoshi, K.; Randolph, M.F. On the definition of raft—Soil stiffness ratio for rectangular rafts. Géotechnique 1997, 47, 1055–1061. [Google Scholar] [CrossRef]
  16. El Hammouli, S.; Hanna, A.; Lin, L.; Khalifa, M. Role of Cap Thickness in Pile-Cap Foundation. Int. J. Civ. Infrastruct. 2021, 4, 100–108. [Google Scholar] [CrossRef]
  17. Hanna, A.M.; Vakili, R. Load Sharing Mechanism of Non-displacement Piled-raft Foundation in Sand. J. Ground Improv. 2021, 174, 105–115. [Google Scholar] [CrossRef]
  18. Sinha, A.; Hanna, A.M. 3D Numerical Model for Piled-Raft Foundation. ASCE Int. J. Geomech. 2017, 17, 04016055. [Google Scholar] [CrossRef]
  19. Poulos, H.G. Piled raft foundations: Design and applications. Geotechnique 2011, 51, 95–113. [Google Scholar] [CrossRef]
Figure 1. Schematic diagram of the test setup.
Geotechnics 04 00054 g001
Figure 2. Test in progress of four micropiled-raft system.
Geotechnics 04 00054 g002
Figure 3. Instrumentations installed on the experimental models. (a) Unpiled rafts. (b) One-micropiled raft. (c) Four-micropiled-raft system.
Geotechnics 04 00054 g003
Figure 4. Test results: load–settlement curve for unpiled-raft (Dr = 45%).
Geotechnics 04 00054 g004
Figure 5. Test results: load–settlement curve for single pile (Dr = 60%).
Geotechnics 04 00054 g005
Figure 6. Test results: load–settlement curve for single-pile raft. (a) Dr = 30%. (b) Dr = 45%. (c) Dr = 60%.
Geotechnics 04 00054 g006
Figure 7. Test results: load–settlement curve for 4-micropiled raft. (a) (s/d = 3, Dr = 30%). (b) (s/d = 3, Dr = 45%).
Geotechnics 04 00054 g007
Figure 8. Test results: load–settlement curves for unpiled raft, single micropile, and MPR for s/d = 3.
Geotechnics 04 00054 g008
Figure 9. Comparison between experimental and numerical test results (unpiled raft 13 × 13 cm)—Dr = 60%.
Geotechnics 04 00054 g009
Figure 10. Load versus pile spacing for MPR with rigid and semi-flexible raft.
Geotechnics 04 00054 g010
Figure 11. Load sharing for micropiles and raft: (a) s/d = 3, Dr = 30%; (b) s/d = 3 Dr = 45%.
Geotechnics 04 00054 g011
Figure 12. Ratio of the actual to anticipated stiffness of the MPRs.
Geotechnics 04 00054 g012
Table 1. Physical properties of silica sand.
Soil PropertySilica 40-10
D10 (mm)0.148
D30 (mm)0.210
D50 (mm)0.256
D60 (mm)0.280
Cu1.76
CC1.00
Soil Classification (USCS)SP
Maximum Dry Unit Weight (KN/m3)17.32
Minimum Dry Unit Weight (kN/m3)14.05
Minimum Void Ratio0.51
Maximum Void Ratio0.82
Specific Gravity (Gs)2.60
Table 2. Mechanical properties of silica sand.
Relative Density (Dr)Void RatioAngle of Shearing Resistance (Degrees)
300.7131.05
450.6733.88
600.6536.4
Table 3. Properties of PVC and concrete.
ParameterPVC ModelsPrototype Models (Concrete)
Unit weight (kN/m3)14.524.8
Modulus of elasticity, E (MPa)3 × 10330 × 103
Poisson ratio (ν)0.30.2
Table 4. Experimental test results: axial load measured at the pile’s shaft.
Settlement (mm)Model Measured Axial Load (kN)
Top Middle Tip
5MPR with s/d = 3; Dr = 300.1380.0670.045
7.50.1670.0850.052
100.1910.0990.057
5MPR with s/d = 3, Dr = 450.1880.0990.058
7.50.2320.1200.072
100.2690.1400.089
5MPR with s/d = 3, Dr = 600.3000.1530.107
7.50.3710.1970.124
100.4310.2280.138
5MPR with s/d = 4, Dr = 300.1500.0770.036
7.50.1950.0960.043
100.2260.1130.056
5MPR with s/d = 4, Dr = 450.1750.0910.044
7.50.2160.1060.050
100.2520.1260.063
5MPR with s/d = 4, Dr = 600.2750.1350.058
7.50.3410.1710.085
100.3910.1950.102
Table 5. Experimental program and test results.
Test Code NameRelative Density of the SandRaft Size (cm)No of PilesMP (Length/Dia)MP SpacingBC (kN)Stiffness (MN/m)PDR (MN/m)Stiffness (MN/m)
13013 × 13 × 3.8---1.001.57--
24513 × 13 × 3.8---1.402.10--
36013 × 13 × 3.8---2.002.94--
4309.5 × 9.5 × 3.8---0.600.70--
5459.5 × 9.5 × 3.8---0.851.00--
6609.5 × 9.5 × 3.8---1.151.20--
73012.5 × 12.5 × 3.8---0.650.90--
84512.5 × 12.5 × 3.8---1.102.00--
96012.5 × 12.5 × 3.8---1.402.40--
1030-180/2.54-0.521.95--
1145-180/2.54-0.712.32--
1260-180/2.54-1.062.68--
133013 × 13 × 3.8180/2.54-1.753.00-0.60
144513 × 13 × 3.8180/2.54-2.003.50-0.75
156013 × 13 × 3.8180/2.54-2.254.00-1.00
16309.5 × 9.5 × 3.8450/1.583 d1.403.403.600.85
17459.5 × 9.5 × 3.8450/1.583 d1.803.704.021.00
18609.5 × 9.5 × 3.8450/1.583 d2.504.904.411.20
193012.5 × 12.5 × 3.8450/1.584 d1.703.503.651.39
204512.5 × 12.5 × 3.8450/1.584 d2.003.754.041.40
216012.5 × 12.5 × 3.8450/1.584 d2.605.004.421.56
Table 6. Test results: numerical modeling.
Test CodeRelative Density
Dr
Raft SizeNo of PilesMicropiles (L/d)Micropiles Spacing Ratio
S/d
Raft Thickness
(m)(m)Semi-FlexibleRigid
(m)(m)
130%4.2 × 4.21610/0.1530.10
245%4.2 × 4.21610/0.1530.10
360%4.2 × 4.21610/0.1530.10
430%4.2 × 4.2 unpiled0.10
545%4.2 × 4.2 unpiled0.10
660%4.2 × 4.2 unpiled0.10
730%4.2 × 4.21610/0.153 0.3
845%4.2 × 4.21610/0.153 0.3
960%4.2 × 4.21610/0.153 0.3
1030%4.2 × 4.2 unpiled 0.3
1145%4.2 × 4.2 unpiled 0.3
1260%4.2 × 4.2 unpiled 0.3
1330%4.2 × 4.21610/0.1540.15
1445%4.2 × 4.21610/0.1540.15
1560%4.2 × 4.21610/0.1540.15
1630%4.2 × 4.2 unpiled0.15
1745%4.2 × 4.2 unpiled0.15
1860%4.2 × 4.2 unpiled0.15
1930%4.2 × 4.21610/0.154 0.35
2045%4.2 × 4.21610/0.154 0.35
2160%4.2 × 4.21610/0.154 0.35
2230%4.2 × 4.2 unpiled 0.35
2345%4.2 × 4.2 unpiled 0.35
2460%4.2 × 4.2 unpiled 0.35
2530%4.2 × 4.21610/0.1550.20
2645%4.2 × 4.21610/0.1550.20
2760%4.2 × 4.21610/0.1550.20
2830%4.2 × 4.2 unpiled0.20
2945%4.2 × 4.2 unpiled0.20
3060%4.2 × 4.2 unpiled0.20
3130%4.2 × 4.21610/0.155 0.45
3245%4.2 × 4.21610/0.155 0.45
3360%4.2 × 4.21610/0.155 0.45
3430%4.2 × 4.2 unpiled 0.45
3545%4.2 × 4.2 unpiled 0.45
3660%4.2 × 4.2 unpiled 0.45
3730%4.2 × 4.21610/0.1560.25
3845%4.2 × 4.21610/0.1560.25
3960%4.2 × 4.21610/0.1560.25
4030%4.2 × 4.2 unpiled0.25
4145%4.2 × 4.2 unpiled0.25
4260%4.2 × 4.2 unpiled0.25
4330%4.2 × 4.21610/0.156 0.55
4445%4.2 × 4.21610/0.156 0.55
4560%4.2 × 4.21610/0.156 0.55
4630%4.2 × 4.2 unpiled 0.55
4745%4.2 × 4.2 unpiled 0.55
4860%4.2 × 4.2 unpiled 0.55
4930%4.2 × 4.21610/0.1570.30
5045%4.2 × 4.21610/0.1570.30
5160%4.2 × 4.21610/0.1570.30
5230%4.2 × 4.2 unpiled 0.30
5345%4.2 × 4.2 unpiled 0.30
5460%4.2 × 4.2 unpiled 0.30
5530%4.2 × 4.21610/0.157 0.65
5645%4.2 × 4.21610/0.157 0.65
5760%4.2 × 4.21610/0.157 0.65
5830%4.2 × 4.2 unpiled 0.65
5945%4.2 × 4.2 unpiled 0.65
6060%4.2 × 4.2 unpiled 0.65
Disclaimer/Publisher’s Note: The statements, opinions and data contained in all publications are solely those of the individual author(s) and contributor(s) and not of MDPI and/or the editor(s). MDPI and/or the editor(s) disclaim responsibility for any injury to people or property resulting from any ideas, methods, instructions or products referred to in the content.

