Article

Derivation of Contour Plots for the Characterization of the Behaviour of Sand under Undrained Loading

Institute for Geotechnical Engineering, Leibniz University Hannover, 30167 Hannover, Germany
*
Author to whom correspondence should be addressed.
Geotechnics 2024, 4(2), 530-548; https://doi.org/10.3390/geotechnics4020029
Submission received: 4 April 2024 / Revised: 10 May 2024 / Accepted: 23 May 2024 / Published: 4 June 2024

Abstract

:
The soil response under the inherent cyclic loading conditions when dealing with offshore foundations can be considered by using contour plots. These plots are derived from several cyclic laboratory tests and characterize the general cyclic soil behaviour. In the design process with explicit numerical methods, such plots are needed in order to assess the soil behaviour under arbitrary loading conditions and hence estimate the cyclic foundation response. In the paper, excess pore pressure contour plots for a poorly graded medium sand are derived from numerous constant volume (CV) cyclic direct simple shear (DSS) tests and a new approach for parametrization of the plots is presented. Subsequently, the data are assessed regarding scaling for other sand soils, i.e., construction of contour plots with only a small number of test results by using the general trends observed.

1. Introduction

The soil response under cyclic loading is very complex and depends non-linearly on the stress conditions. In order to use the results of numerous cyclic laboratory tests in a convenient way, they need to be presented in an appropriate form. A possible way is to summarize the behaviour in a graphical representation, which is often referred to as contour plots. Andersen (1976) [1] started to derive contour plots for two-way loading for the design of offshore platforms in clay and for the back-calculation of field tests. He and his co-workers used these plots to consider the effect of cyclic loading and the influence on the soil elements’ behaviour in an explicit way for offshore foundations ([2,3]). Their general approach was mainly developed for gravity foundations in clayey material. Over the years, these contour plots have been enhanced and incorporate several cyclic status variables such as cyclic shear strength, cyclic shear modulus, permanent shear strain, excess pore pressure and damping for different loading conditions.
The representation of the cyclic soil response applies to a certain soil with a given relative density (in case of non-cohesive material). In addition, the cyclic soil behaviour depends on the overall stress conditions, i.e., mean and cyclic stress amplitudes. Since the stress states occurring in different laboratory test devices (e.g., triaxial tests, direct simple shear tests) in general differ, at least slightly different contour plots result from different tests.
Here, only direct simple shear (DSS) conditions with the excess pore pressure under undrained conditions as the cyclic variable will be investigated. For these boundary conditions, contour plots can subsequently be used as input to finite element models predicting the load-bearing behaviour of foundation structures under undrained or partially drained cyclic loading (e.g., [4,5,6]). With such models, the post-cyclic capacity of the foundation structure or an equivalent number of cycles for a pre-defined storm load consisting of several load packages with different mean loads and cyclic amplitudes can be estimated. However, a generic approach for parametrization of contour plots is still missing. Moreover, a thorough analysis of behavioural patterns which eventually enables an optimization of a cyclic test programme for a certain soil is desirable.
In the paper at hand, the results of constant-volume (CV), load-controlled cyclic direct simple shear tests with varying stress conditions for a reference sand are presented. The determination of parametrized contour plots is investigated, focusing on excess pore pressure as a relevant cyclic soil state parameter. Since numerous tests are generally needed in order to derive the cyclic soil response for an unknown material, a scaling approach is presented and discussed, which allows a first estimation of a complete set of contour plots by only a few cyclic tests.

2. State of the Art Regarding Contour Plots for Excess Pore Pressures

The cyclic soil response under undrained conditions has been studied by many researchers ([7,8,9,10,11,12]). Excess pore pressures are induced by cyclic shearing, since the water in the pores hinders the compaction the soil would exhibit under non-saturated conditions. One of the earliest investigations regarding cyclic soil behaviour has been carried out by Lee and Seed (1967) [13] with load-controlled cyclic triaxial tests. Later, based on the results of DeAlba et al. (1975) [14], Seed et al. (1975) [10] normalized the excess pore pressure curve over the number of cycles by the number of cycles to liquefaction and found that it had roughly the same shape for different shear stress amplitudes. The overall cyclic soil behaviour depends on several factors, such as stress history (preconditioning), confining pressure, load type, soil type, fines content, grain size distribution and—as already mentioned above—even the choice of the cyclic soil test type affects the results.
In offshore practice, the cyclic direct simple shear (DSS) test is quite common and often used. Normally, an undrained test with a saturated sample is to be used for the derivation of contour plots for excess pore pressures. However, cyclic constant-volume (CV) tests with dry or unsaturated soil samples can also be used, which offers immense time savings. The CV condition is ensured by controlling the vertical stress acting on the sample such that no volume strain occurs. The decrease in vertical stress determined on a dry sample can be interpreted approximately as the increase in excess pore water pressure of a fully saturated sample in a true undrained test ([15,16,17]). Also, the regulation ASTM D8296-19 [18] assumes that the soil reaction under constant-volume conditions is equal to truly undrained conditions.
Figure 1 schematically shows the increase in excess pore pressure in a cyclic DSS test for a harmonic cyclic shear stress load. A complete cycle is given when the initial value is reached for the second time. Both the cyclic load and the cyclic response can be divided into mean and cyclic components. However, with respect to the response, the accumulated permanent values are of greatest interest for the design. The permanent excess pore pressure is defined as the excess pore pressure at the end of a complete cycle and can be calculated as the average of the adjacent peak-to-peak values.
The excess pore pressure ratio R u from Figure 1 is calculated by normalizing the excess pore pressure u by the initial effective vertical stress σ v , 0 for one-dimensional boundary conditions or the effective octahedral stress σ o c t , 0 (mean principal stress) for three-dimensional boundary conditions:
R u = u σ v , 0   or   R u = u σ o c t , 0
The accumulation depends on the acting cyclic stress level, which is described by the cyclic stress ratio (CSR). The CSR is defined with the cyclic amplitude of the stress τ c y c for direct simple shear conditions (Equation (2)). Equation (3) shows the definition of the mean stress ratio (MSR), for which the mean shear stress τ m e a n is used. τ m e a n = 0 stands for two-way loading, as depicted in Figure 1b. Values τ m e a n > 0 shift the shear stresses towards higher maximum values, since τ m a x = τ m e a n + τ c y c . Also, the load type ratio LTR, which is the quotient from mean and cyclic load component (LTR = MSR/CSR), can be used to characterize cyclic loading conditions.
C S R = τ c y c σ v , 0
M S R = τ m e a n σ v , 0
Contour plots are derived from a number of discrete cyclic tests with different loading conditions (i.e., τ c y c , τ m e a n , σ v , 0 or CSR, MSR). Plots are usually based on some kind of regression analysis in order to account for unavoidable scatter of the test results, making it much easier to assess the cyclic response of a specific soil by looking at the trend of the isocurve, the distances between the isocurves, the maximum CSR value as well as the asymptotic CSR value.
For a complete and accurate generation of contour plots for a certain soil, many tests are needed. Some authors recommend to use site-specific calibration of existing data with a small number of cyclic laboratory tests (scaling approach). Such a scaling approach is explained, for instance, in [19]. Andersen et al. (2023) [20] outlined how preliminary contour plots can be determined from an existing data base by using conventional soil parameters as input. For sand soils, the required input parameters are relative density (or alternatively the water content), the fines content and the overconsolidation ratio.
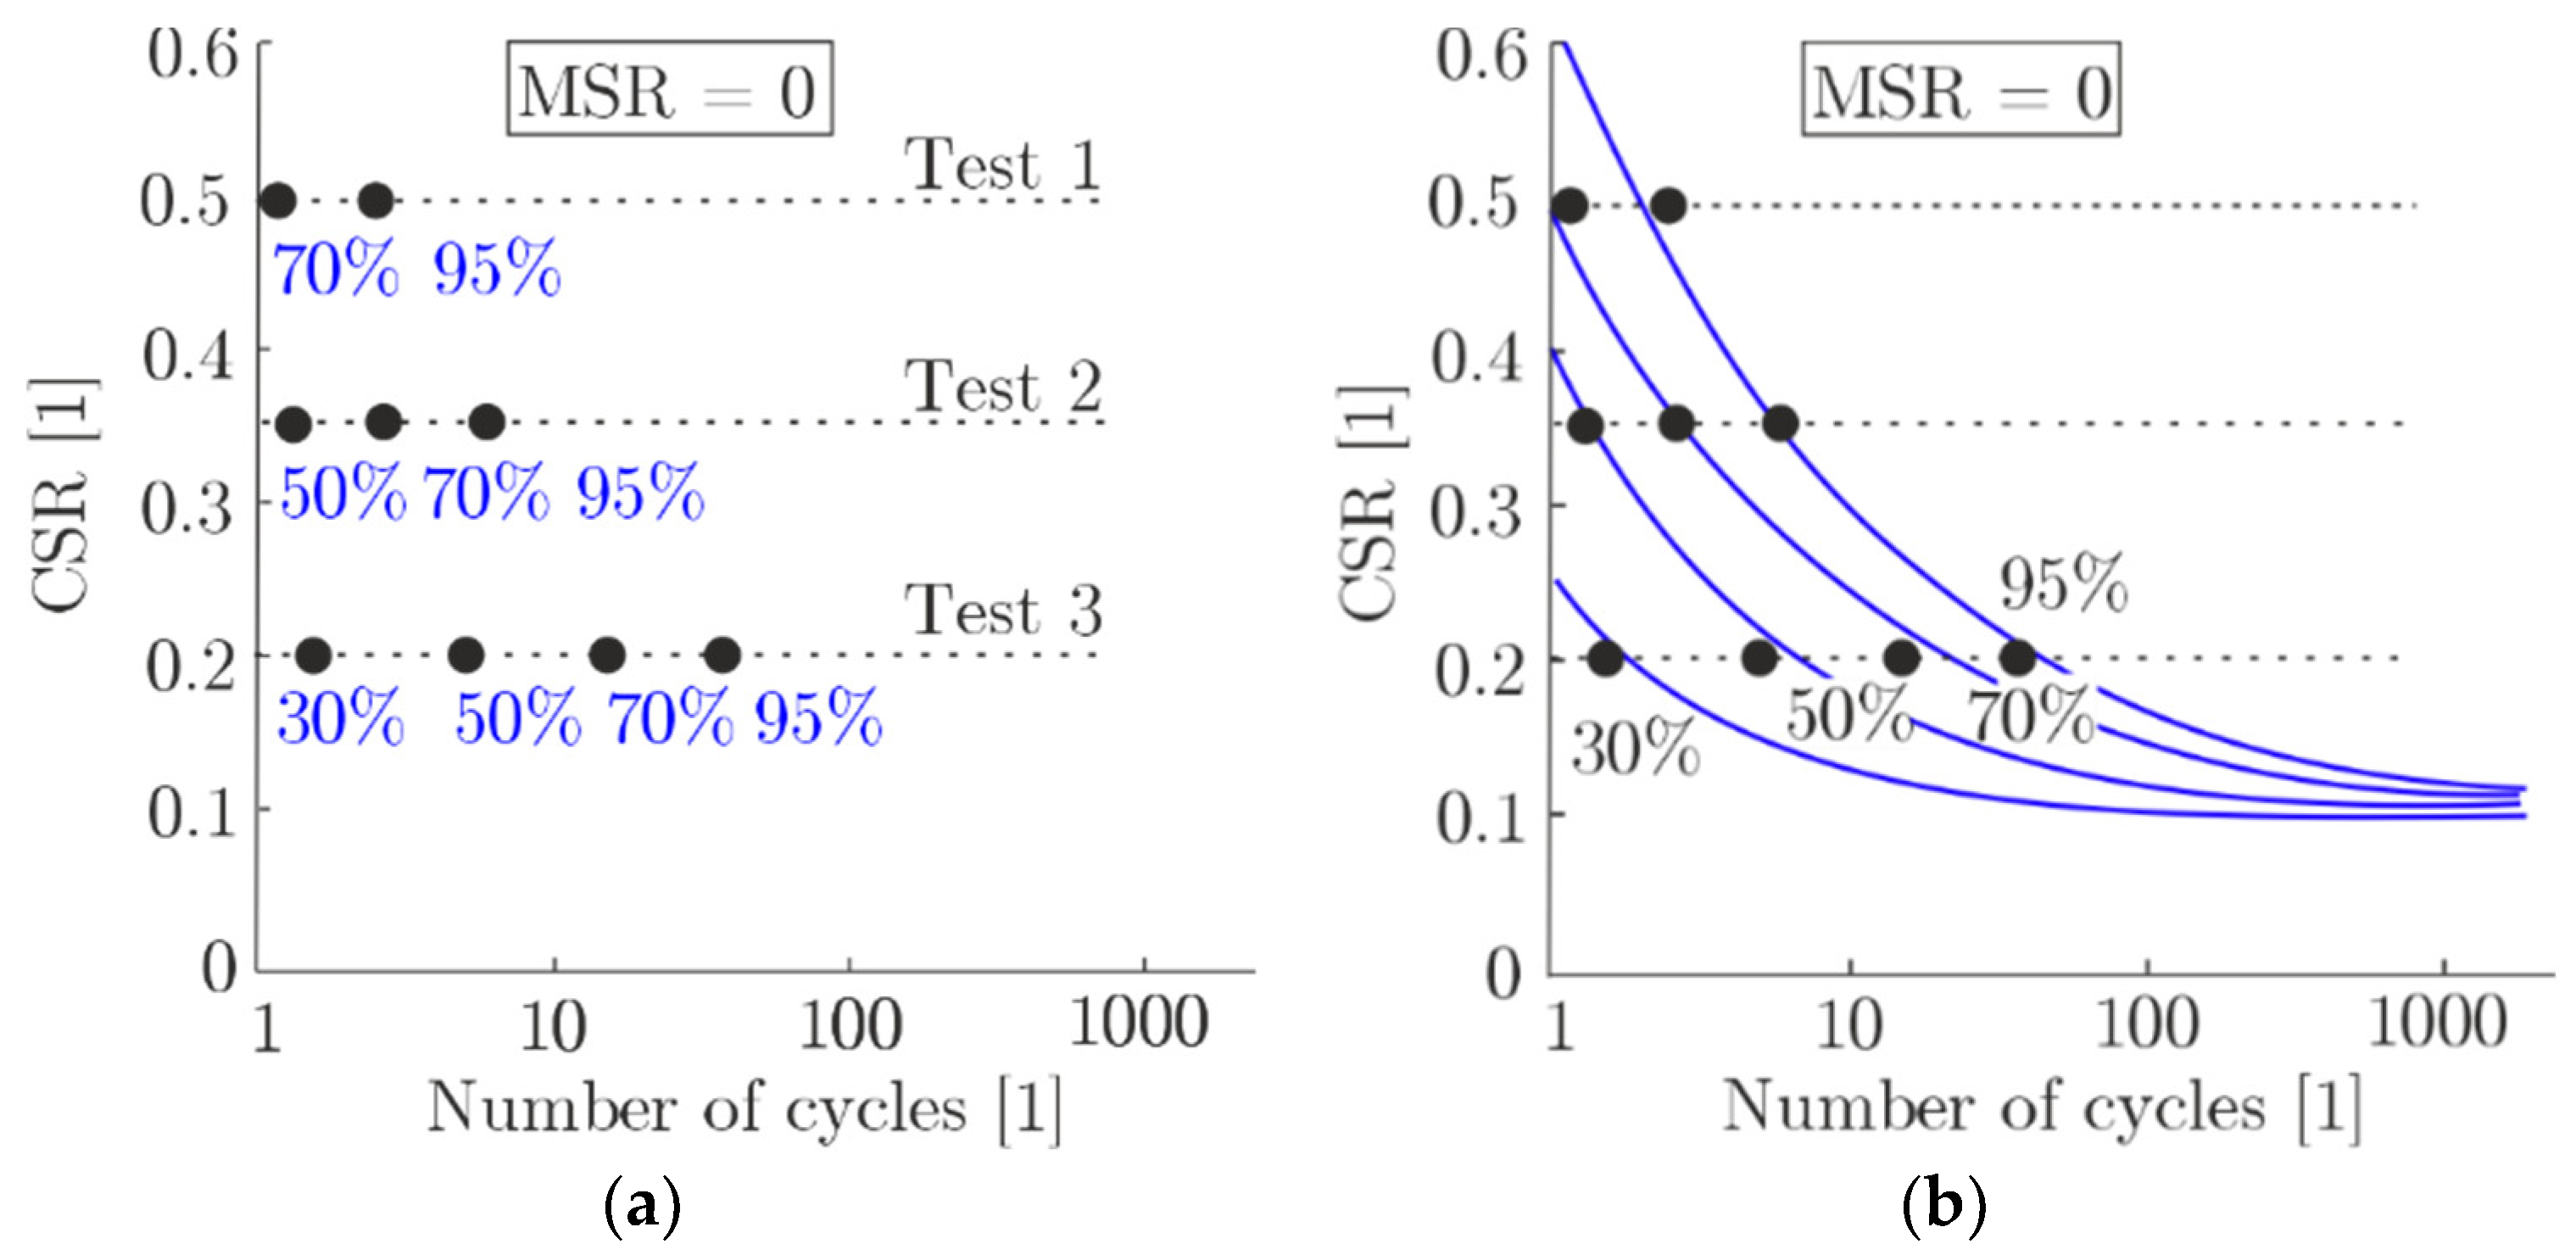
Contour plots are a graphical depiction of the relation of the considered cyclic response value (e.g., cyclic shear strain γ c y c , mean shear strain γ m e a n or—as considered here—excess pore pressure ratio R u ) and the values of CSR, MSR and N. A possible way is to plot CSR-N curves for different R u values as shown in Figure 2. Each contour plot applies to a given MSR value, i.e., full representation of the complete soil response requires a set of contour plots for different MSR values.
Figure 2 shows schematically how a contour plot for u or R u , respectively, is derived. For each cyclic test conducted, the results for R u values after distinct cycle numbers are recorded in a CSR-N diagram (Figure 2a). From that, isocurves ( R u = c o n s t ) are derived by graphical or analytical regression (Figure 2b). From several contour plots for different MSRs, a three-dimensional representation can finally be derived. As schematically depicted in Figure 2, the excess pore pressure ratio increases with increasing cyclic stress ratio and number of cycles. Example contour plots can also be found in Blaker and Andersen (2019) [21] and Andersen (2015) [19]. They performed, among others, cyclic tests on dense to very dense silica sand.

3. Cyclic Laboratory Test Results for a Poorly Graded Medium Sand

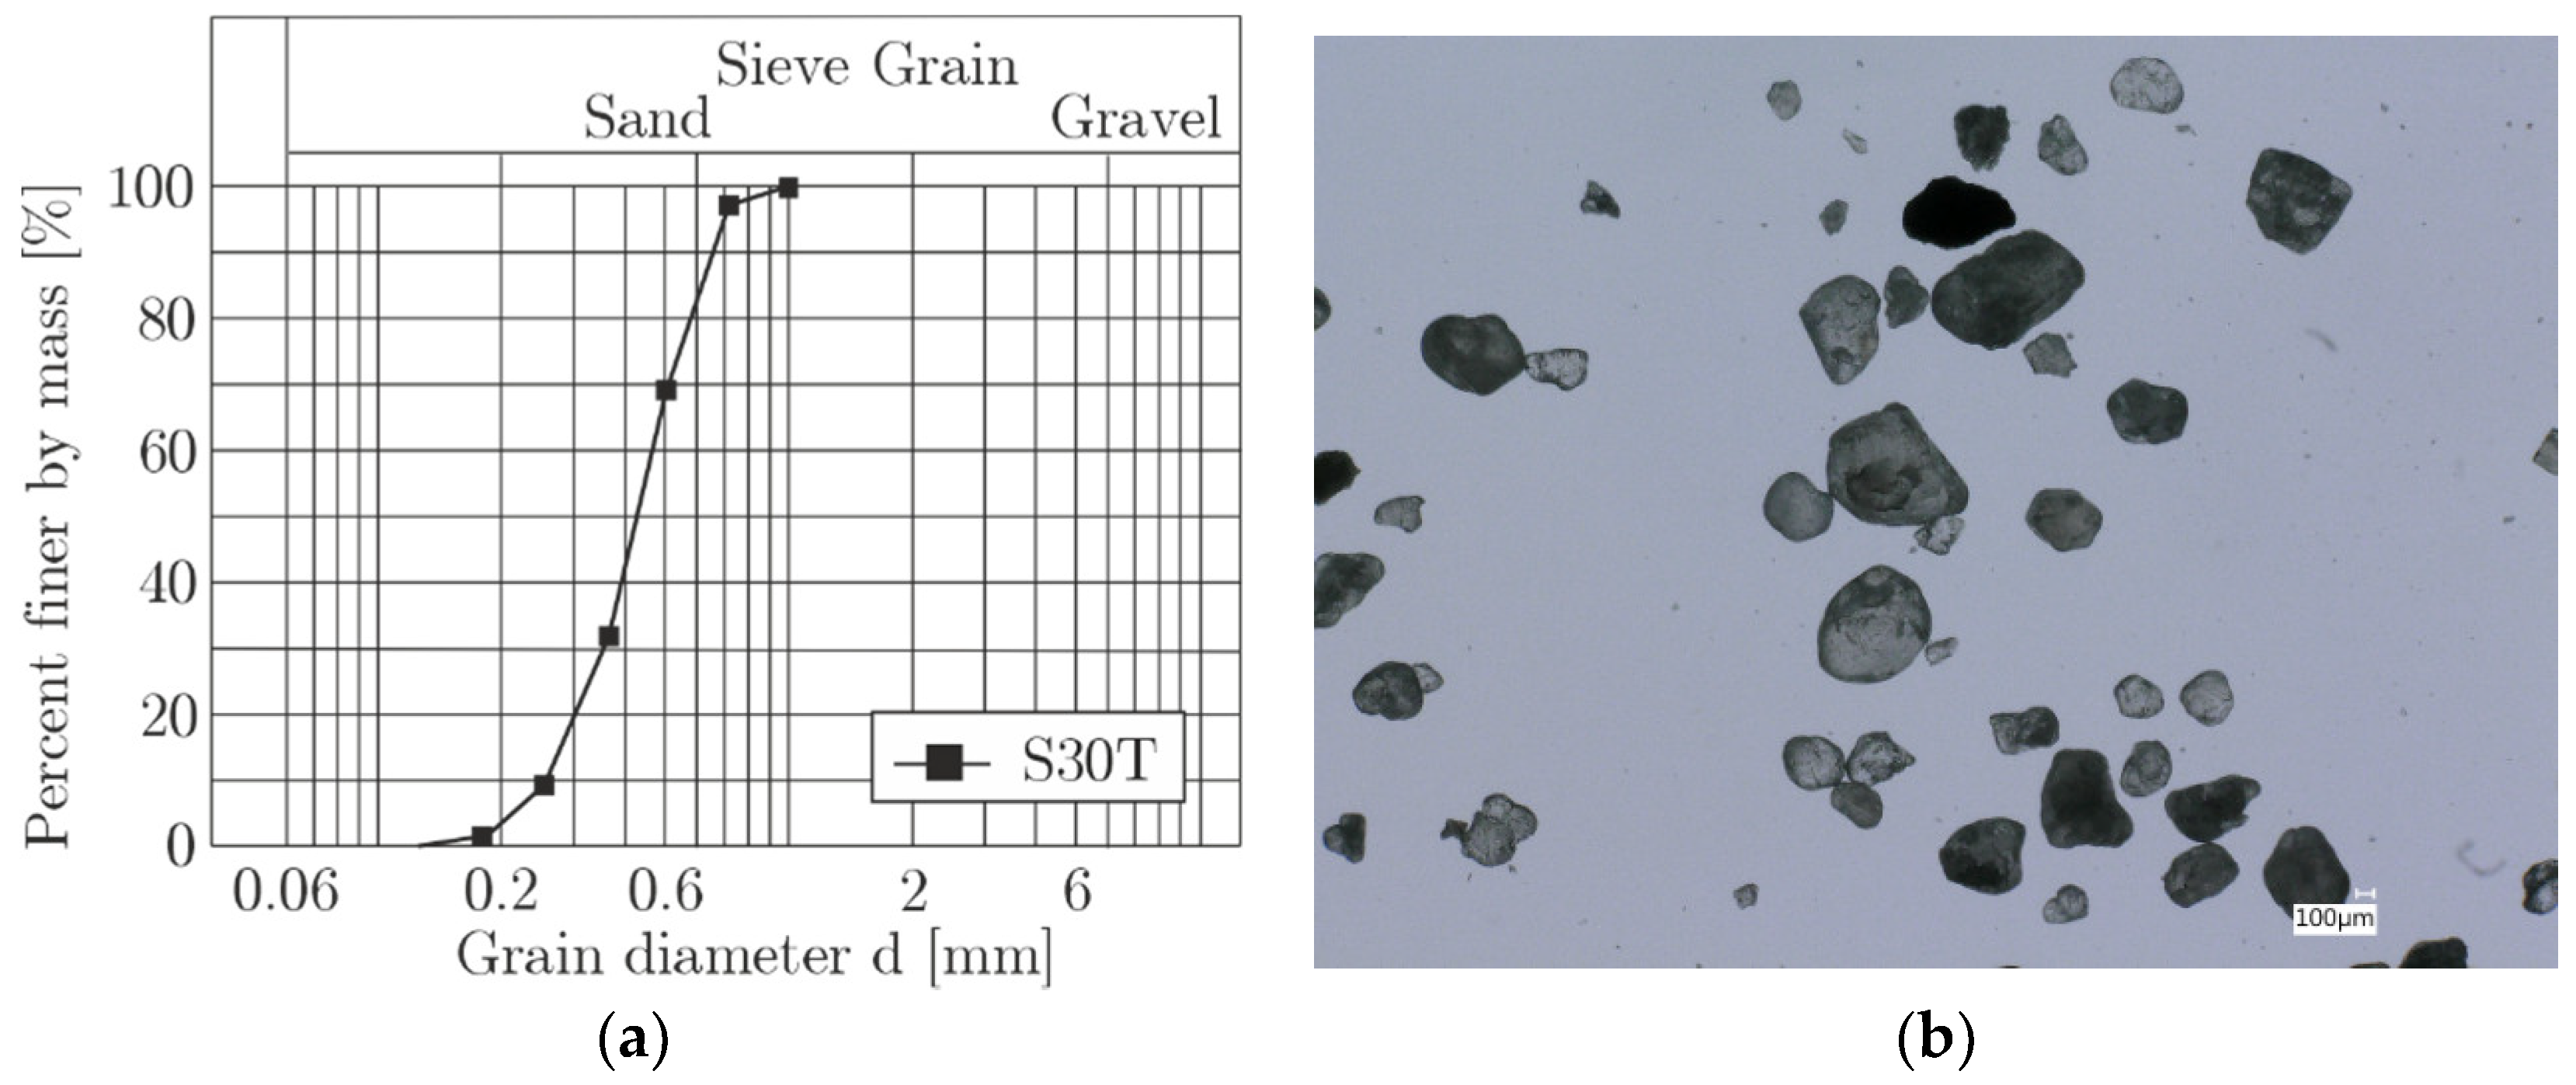
Various laboratory tests were carried out on a non-cohesive soil termed S30T. The grain size distribution of this reference soil is shown in Figure 3a. The soil is a medium quartz sand with about 15% coarse sand particles. The coefficient of uniformity is C U = 2.0. The shape of the sand particles is predominately subangular (Figure 3b). The material was prepared to the desired compaction state by a dry tamping procedure, which proved to be a reliable way to achieve the desired state. Most of the tests were performed at a relative density D r of 0.85, which was chosen as typical for North Sea conditions.
The cyclic direct simple shear tests were conducted with an electro-mechanical dynamic/cyclic simple shear apparatus manufactured by GDS Instruments, UK. The diameter and the height of the samples were about 70 mm and 20 mm, respectively. The tests were carried out with dry material under constant-volume (CV) conditions. The vertical load was applied in the first step and maintained for 10 min. The following cyclic phase consisted of at least 1000 cycles. For tests in which MSR was different from zero, the mean shear stress was always applied under constant-normal load (CNL), i.e., drained conditions, which means that only axial strain (equal to volumetric strain), but no decrease in vertical stress occurred. This represents the behaviour of a sandy material around an offshore structure during a typical storm event, where the storm builds up relatively slowly and hence the mean load can be assumed to create a drained soil response. All cyclic direct simple shear tests have been performed with a frequency of 0.1 Hz. However, in the preliminary test series, also frequencies of up to 2 Hz have been applied and almost no influence of the frequency has been observed (cf. also [22]).
It should be noted that the cyclic response is in general affected by any kind of preconditioning of the sample. This can be a prior increased vertical stress to generate an overconsolidation (pre-loading) or the application of small shear loads prior to the main test (pre-shearing). When using preconditioning, smaller excess pore pressures and larger cyclic shear strengths are to be expected. However, in the tests reported here, no preconditioning was carried out in order to gain one dataset for virgin soil state.
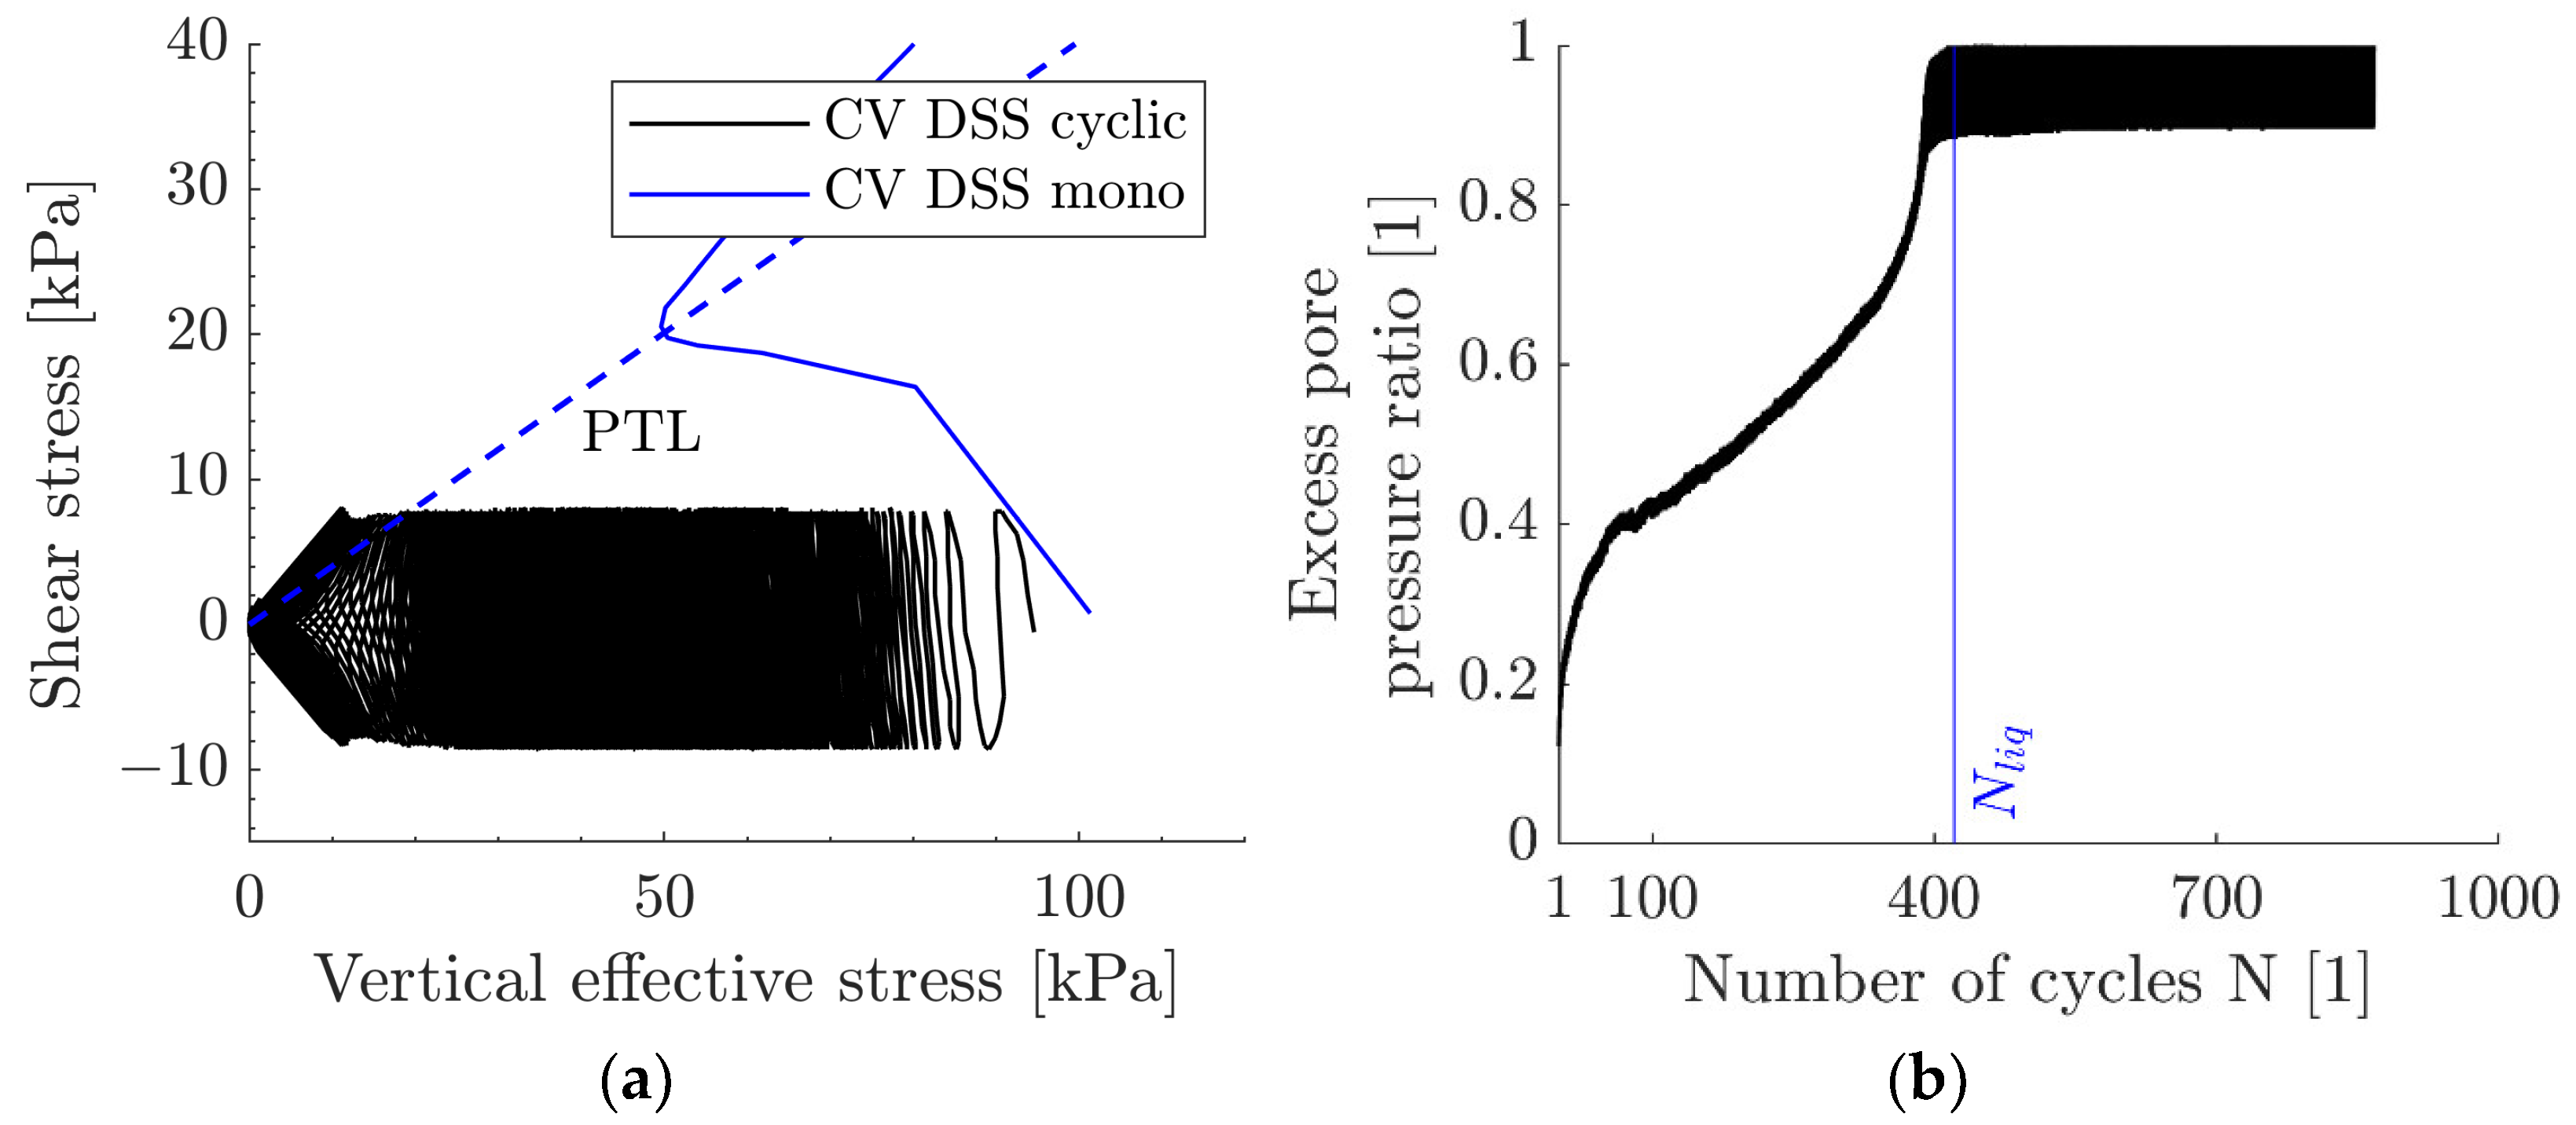
Figure 4a shows example results of a monotonic and a cyclic constant-volume DSS test, in which the decrease in vertical stress is interpreted as an increase in excess pore pressure. The constant-volume phase starts at a vertical consolidation stress of 95 kPa with a mean shear stress of 0 kPa. The cyclic stress ratio (CSR) was chosen to be 0.084 leading to a loading between −8 kPa and 8 kPa. The effective vertical stress decreases due to an increase in excess pore pressure or, more accurately, the contractant behaviour of the soil during shearing leads to a decrease in vertical stress to keep the constant-volume boundary condition. The change in soil behaviour at the phase-transformation line (PTL), i.e., the point where dilation of the investigated dense sample begins, is depicted in the τ σ v plane in Figure 4a. At the crossing point of the PTL, the soil response changes and a butterfly loop starts to occur. There is a continuous transition between dilatancy and contractance (for this dense sand state). This is accompanied by the fast generation of large shear strains. The increase in normalized excess pore pressure is depicted in Figure 4b, from which a number of cycles to liquefaction of 421 is obtained. However, it should be noted that full liquefaction is not possible for all load conditions. For loading conditions with a mean shear stress significantly greater than zero, the stress path cannot reach zero effective stress by simultaneously keeping the stress-controlled boundary conditions. For these cases, a different failure mechanism takes place, to be recognized by a strong shear strain increase (Studer et al., 2007 [23]). Here, liquefaction was assumed when either R u = 1 was reached or the double shear strain amplitude exceeded the value of 5%.
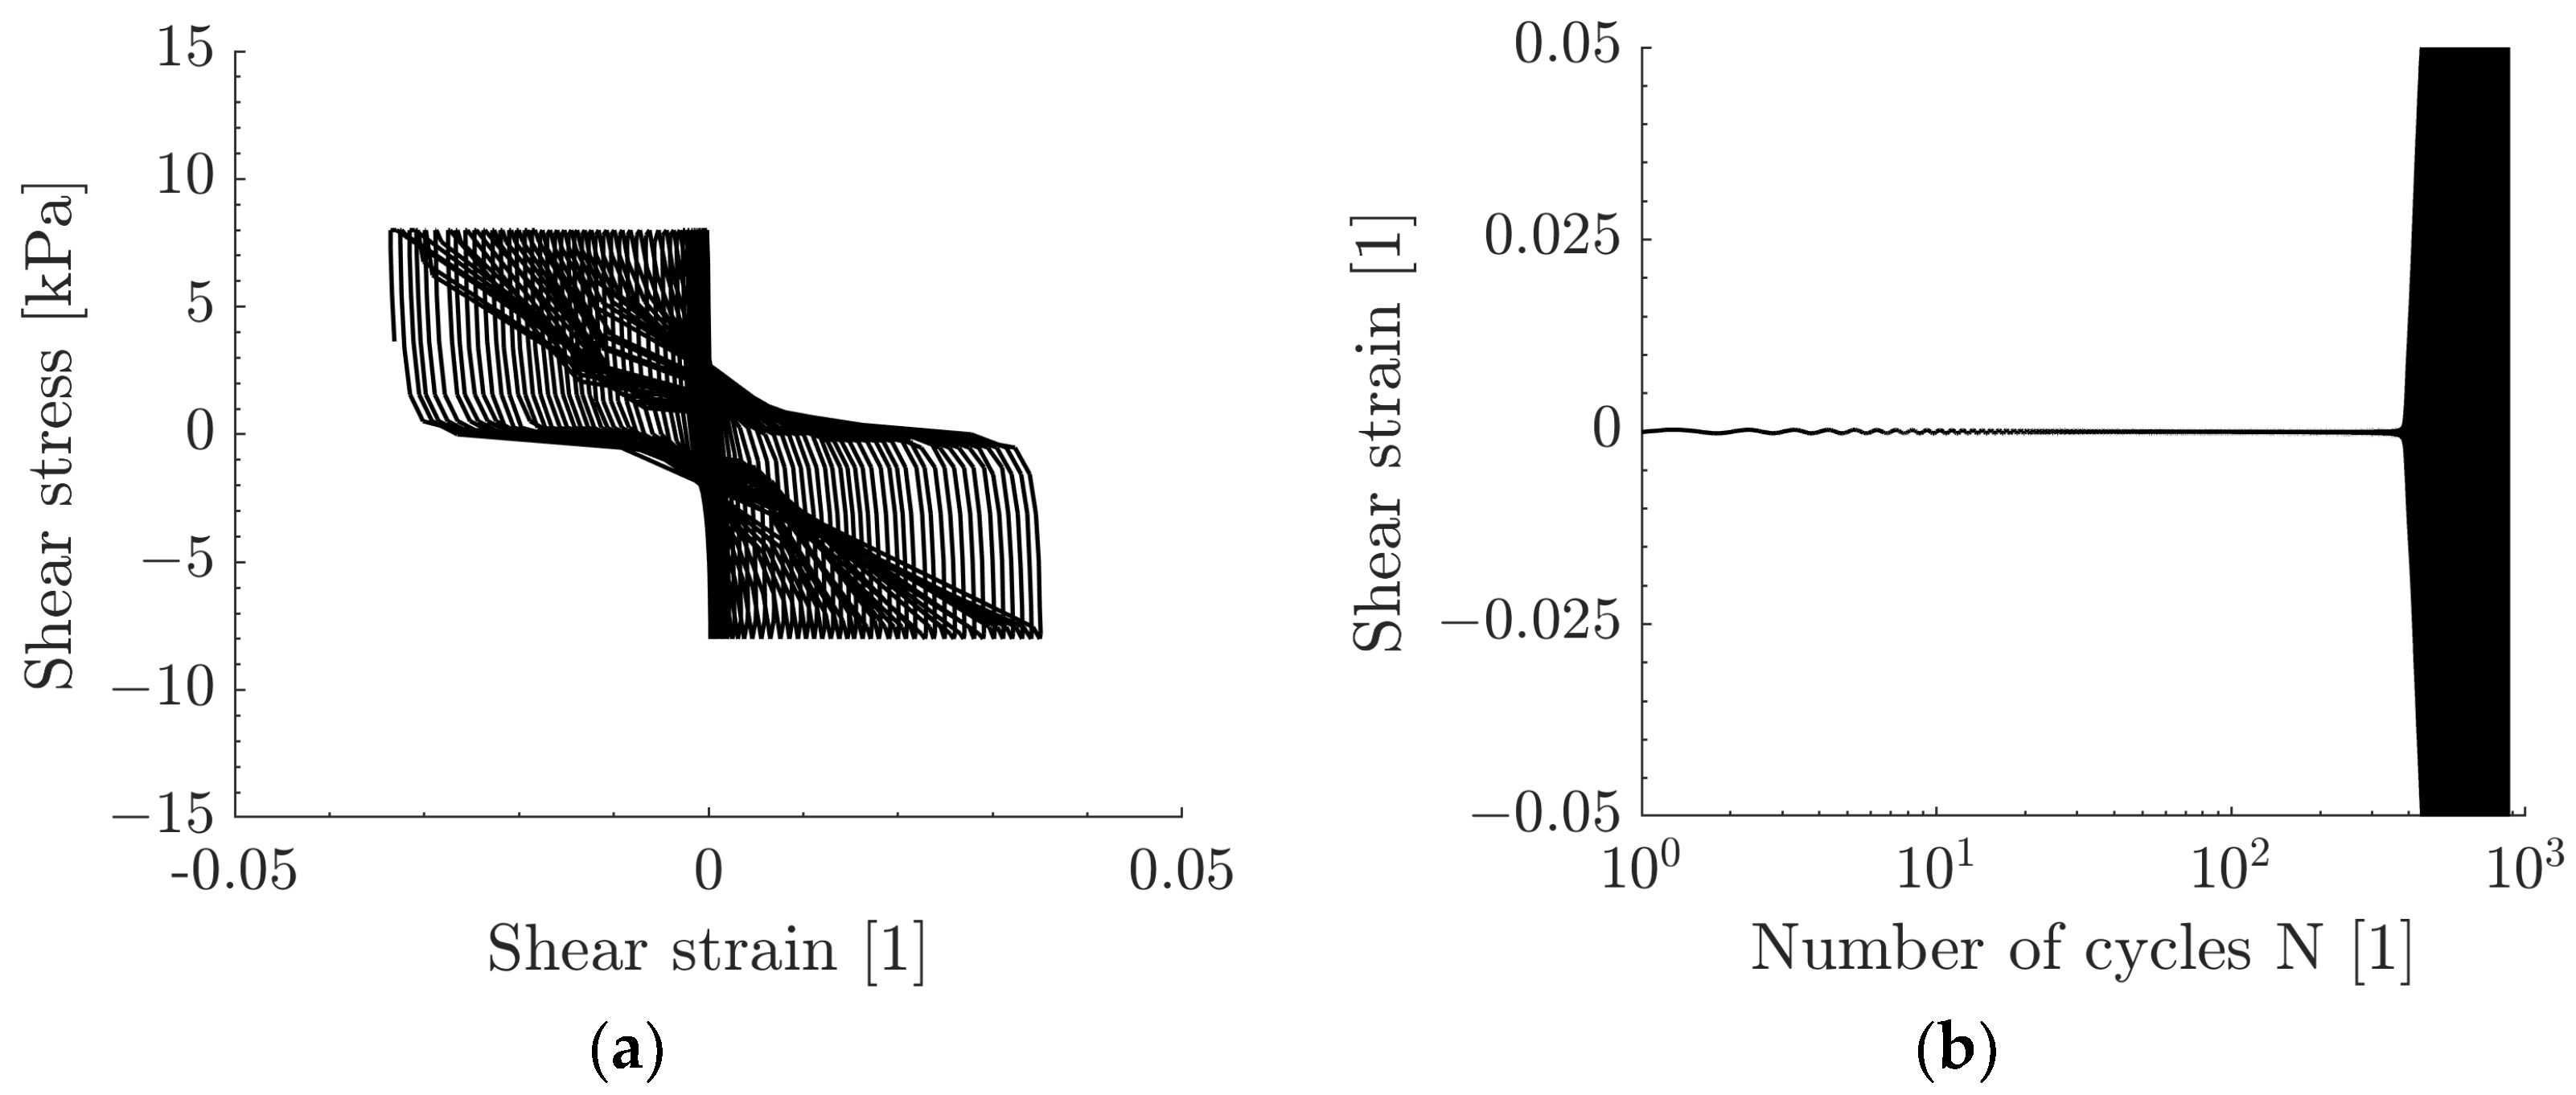
For the same test as presented in Figure 4, Figure 5a shows the increase in shear strain and the stress path in τ γ plane. Here, a mean shear strain of zero is observed. For non-symmetrical load scenarios (MSR > 0), this value would increase over the numbers of applied cycles. The dilative response at large strains with the characteristic S-shape of the τ γ curve can be seen. Figure 5b shows the increase in shear strain over the number of cycles. A large increase in shear strain is observed approximately after 400 cycles when full liquefaction of the sample is approached.
In the main test programme with a relative density D r of 0.85 of the sand, both MSR and CSR values were varied between 0 and 0.25. Only for MSR = 0, higher CSR values of a maximum of 0.32 were also investigated. In total, almost 100 combinations of CSR and MSR values were investigated. The initial effective vertical stress σ v , 0 in most of the tests was 100 kPa. Additional preliminary tests with differing initial stresses showed no significant deviations in the cyclic results.
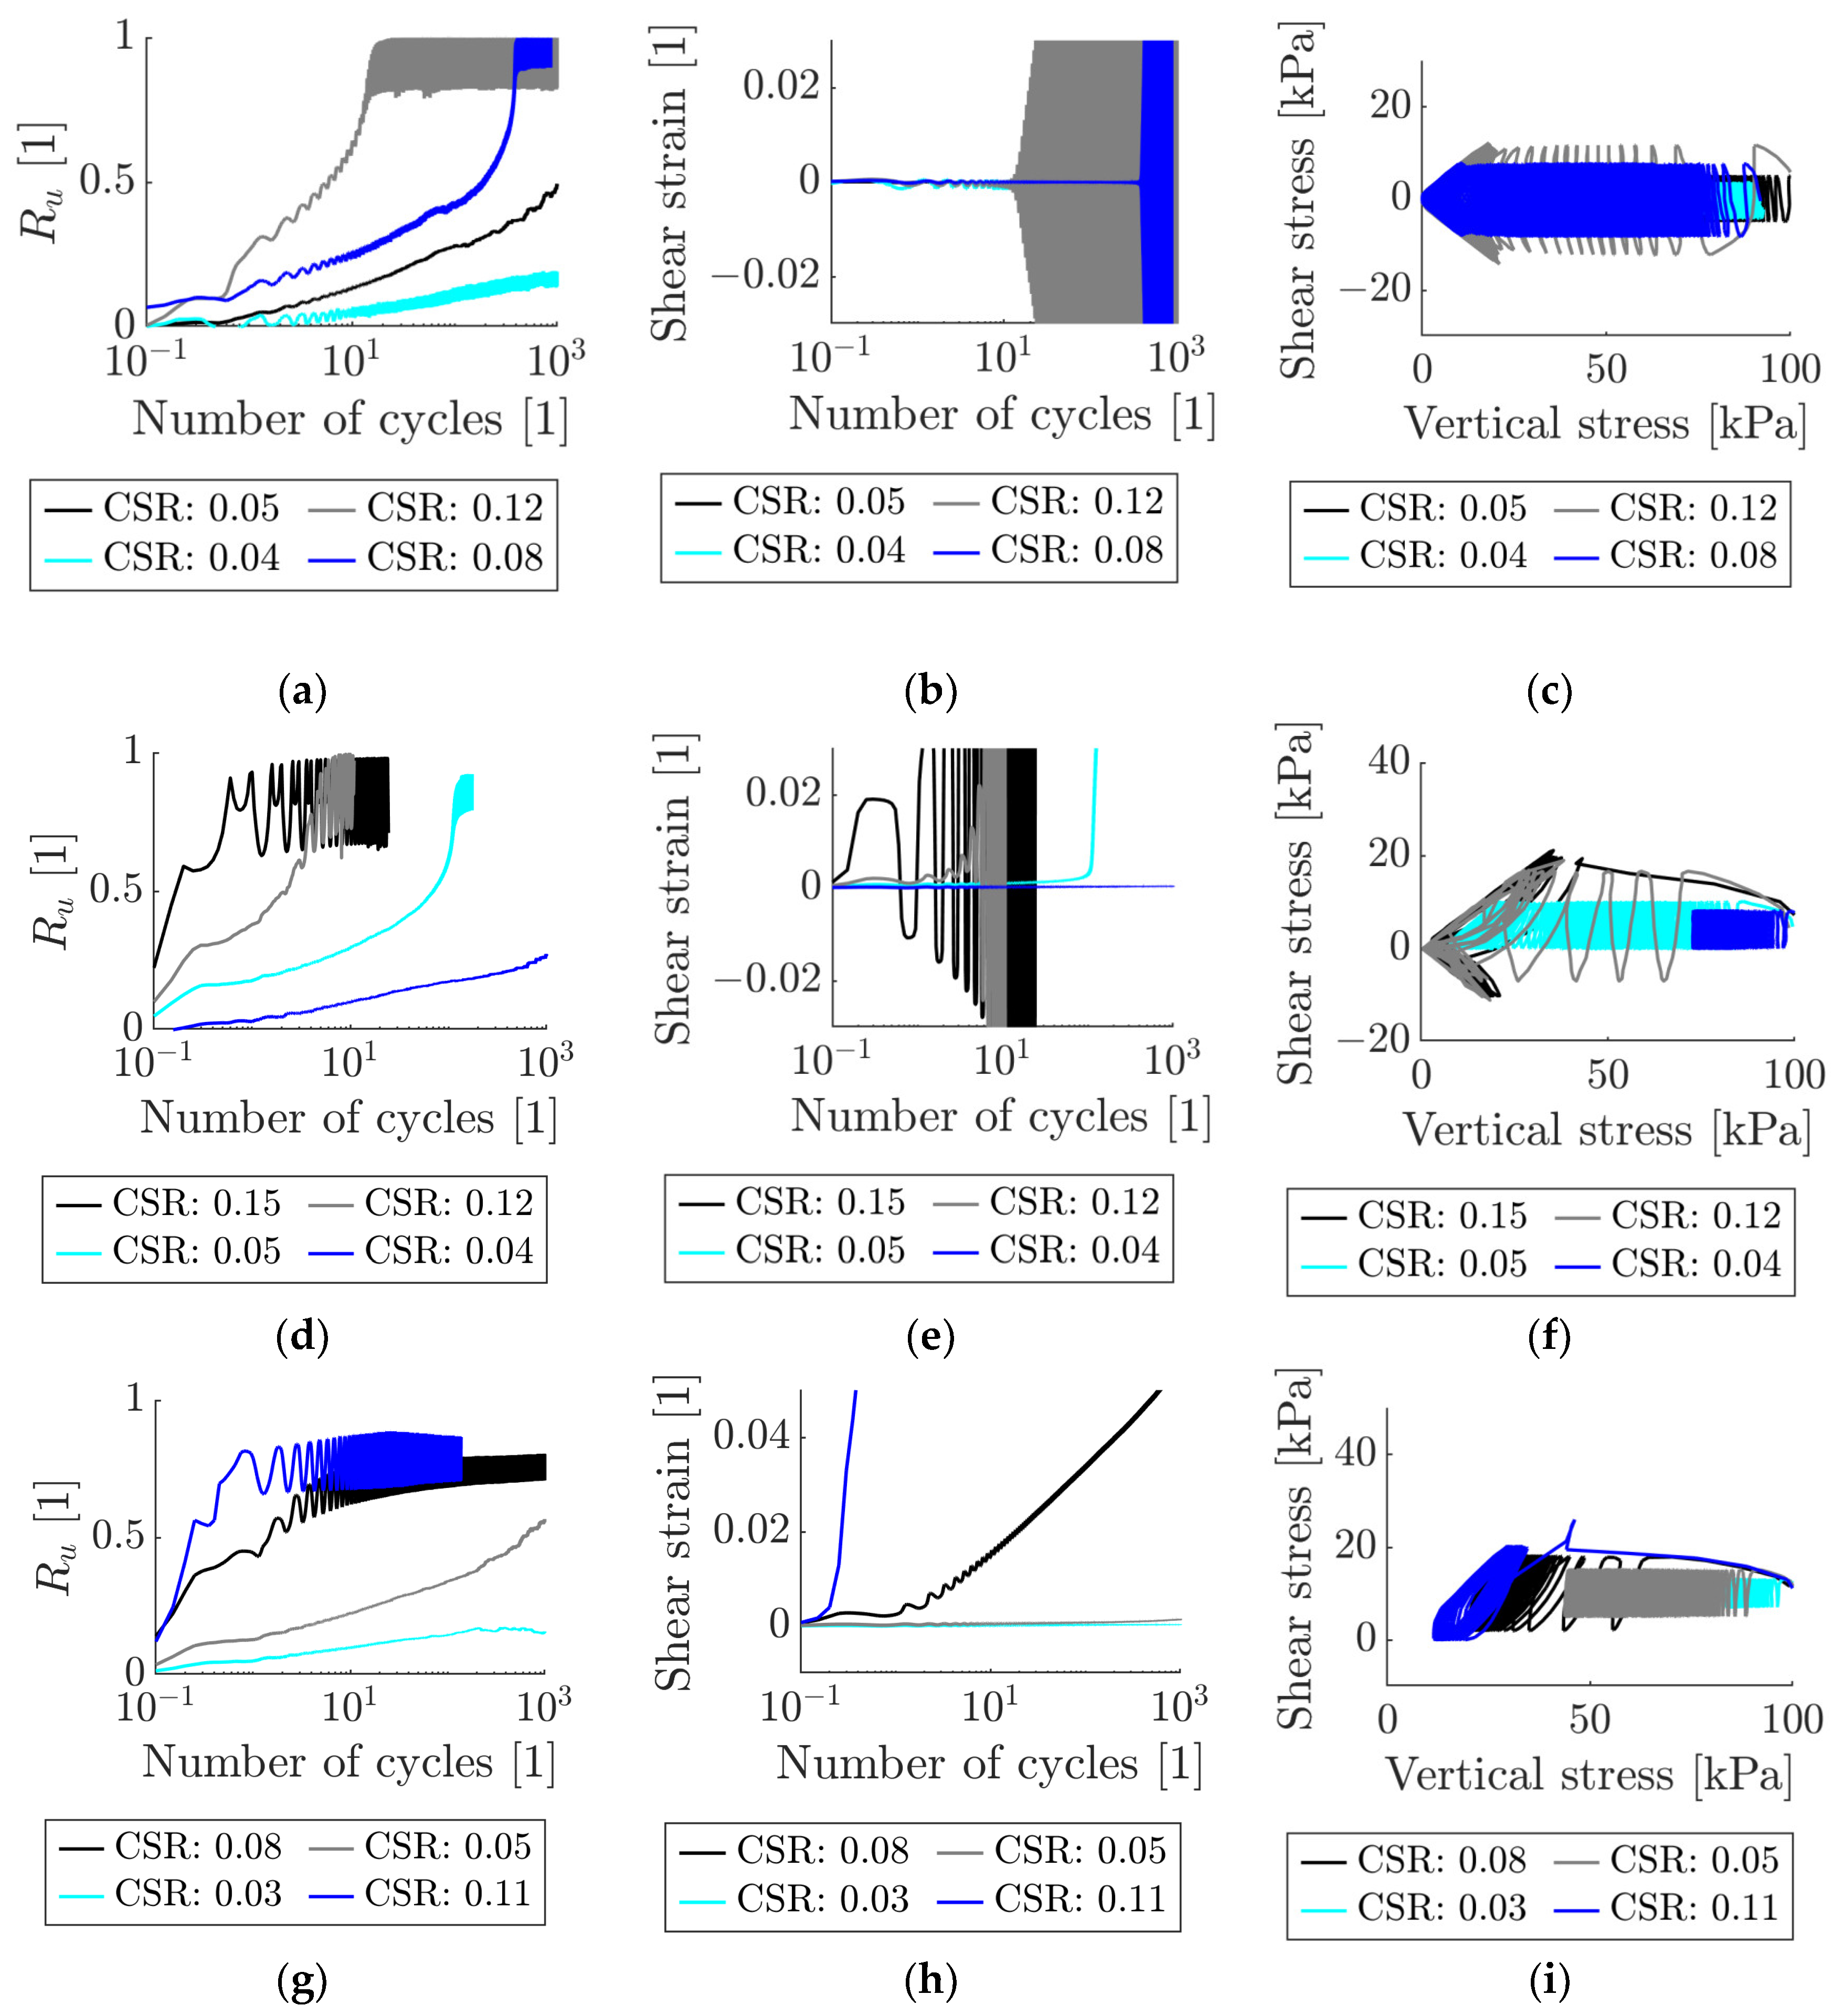
To give an overview, Figure 6 shows the excess pore pressure build-up measured with the S30T sand in a dense state ( D r = 0.85 ) for selected CSR and MSR values. Figure 6a–c show test results with an MSR = 0, the second row (d–f) with an MSR = 0.05 and the third row (g–i) with an MSR = 0.10. Besides the excess pore pressure ratio, the development of shear strain over number of cycles and of the shear stress over the vertical stress is depicted. For an increased CSR value, an increased accumulation is observed. Since the excess pore pressure correlates with the build-up of shear strain, the shear strain also increases significantly when large excess pore pressures occur.
As already mentioned, the relative density significantly affects the cyclic soil response. Figure 7 shows excess pore pressure developments obtained from additional tests with relative densities of D r = 0.40 (a), D r = 0.50 (b) and D r = 0.60 (c) for MSR = 0. For a smaller relative density, the liquefaction is achieved after a smaller number of cycles. However, the build-up trend over the number of cycles is very similar for all relative densities. The shear strain accumulation and the development of vertical stress are not depicted but also show similar behaviour compared to Figure 6b,c.
It should be noted that all presented results were gained from tests which were performed two or three times in order to have redundancy in the results. Some scatter in the measured results was present, but the results of repeated tests usually deviated only marginally. In the derivation of contour plots, mean values of test results with the same conditions were used. The observed scatter is mainly attributed to unavoidable differences in the preparation of the samples to the desired compaction state made by dry tamping and the deliberate relinquishment of a pre-cycling stage.

4. Contour Plots for Reference Sand

Numerous cyclic DSS tests have been conducted and an excerpt of the results in the form of graphs has been presented in the preceding section. In order to apply these results in numerical simulation models, a mathematical description is necessary, which yields Ru values for arbitrary CSR and MSR. The mathematical framework should be versatile and suitable to describe the general cyclic soil behaviour, and the parameters must be derived by regression analysis.

4.1. Existing Approaches

A general requirement for the mathematical equations to be applied is that for small number of cycles, a high rate of excess pore pressure development must be described and for larger number of cycles, the rate must decrease (cf. Figure 2). The power law function given in Equation (4) is often used in the literature and practice (see e.g., [24,25,26]):
C S R R u = a ¯ · N b ¯ + c ¯
For each R u value and a given MSR, a set of regression parameters, a ¯ , b ¯ and c ¯ , has to be determined. Zorzi et al. (2019) [24] kept the parameter b ¯ constant at −0.35, similar to Boukpeti et al. (2014) [25] for carbonate silt sediments. Both author groups fitted shear strain plots instead of excess pore pressure ratios. Zografou et al. (2019) [26] used the equation with values for b ¯ from 0.00 to −0.35 and c ¯ from 0.25 to 0.61. However, they dealt with kaolin clay.
A different approach was presented by Ronold (1993) [27] (also in a compacted form in the DNVGL-RP-C212 regulation [28]). The values a ~ and b ~ in Equation (5) are empirical regression parameters, which have to be determined dependent on R u and MSR:
C S R R u = 0.0001 · R u ( a ~ · N + b ~ )
Equation (6) uses a regression for the trend of excess pore pressure over the CSR for N = 1 and adds the degradation over the number of cycles with the second term. This equation can sometimes be seen in practical applications.
C S R N = 1 = t a n h ( d ^ · R u e ^ )     C S R R u = a ^ · C S R b ^ N = 1 ( 1 + 10 N ) c ^
Here, the five parameters a ^ , b ^ , c ^ , d ^ and e ^ have to be determined for varying R u and MSR values.
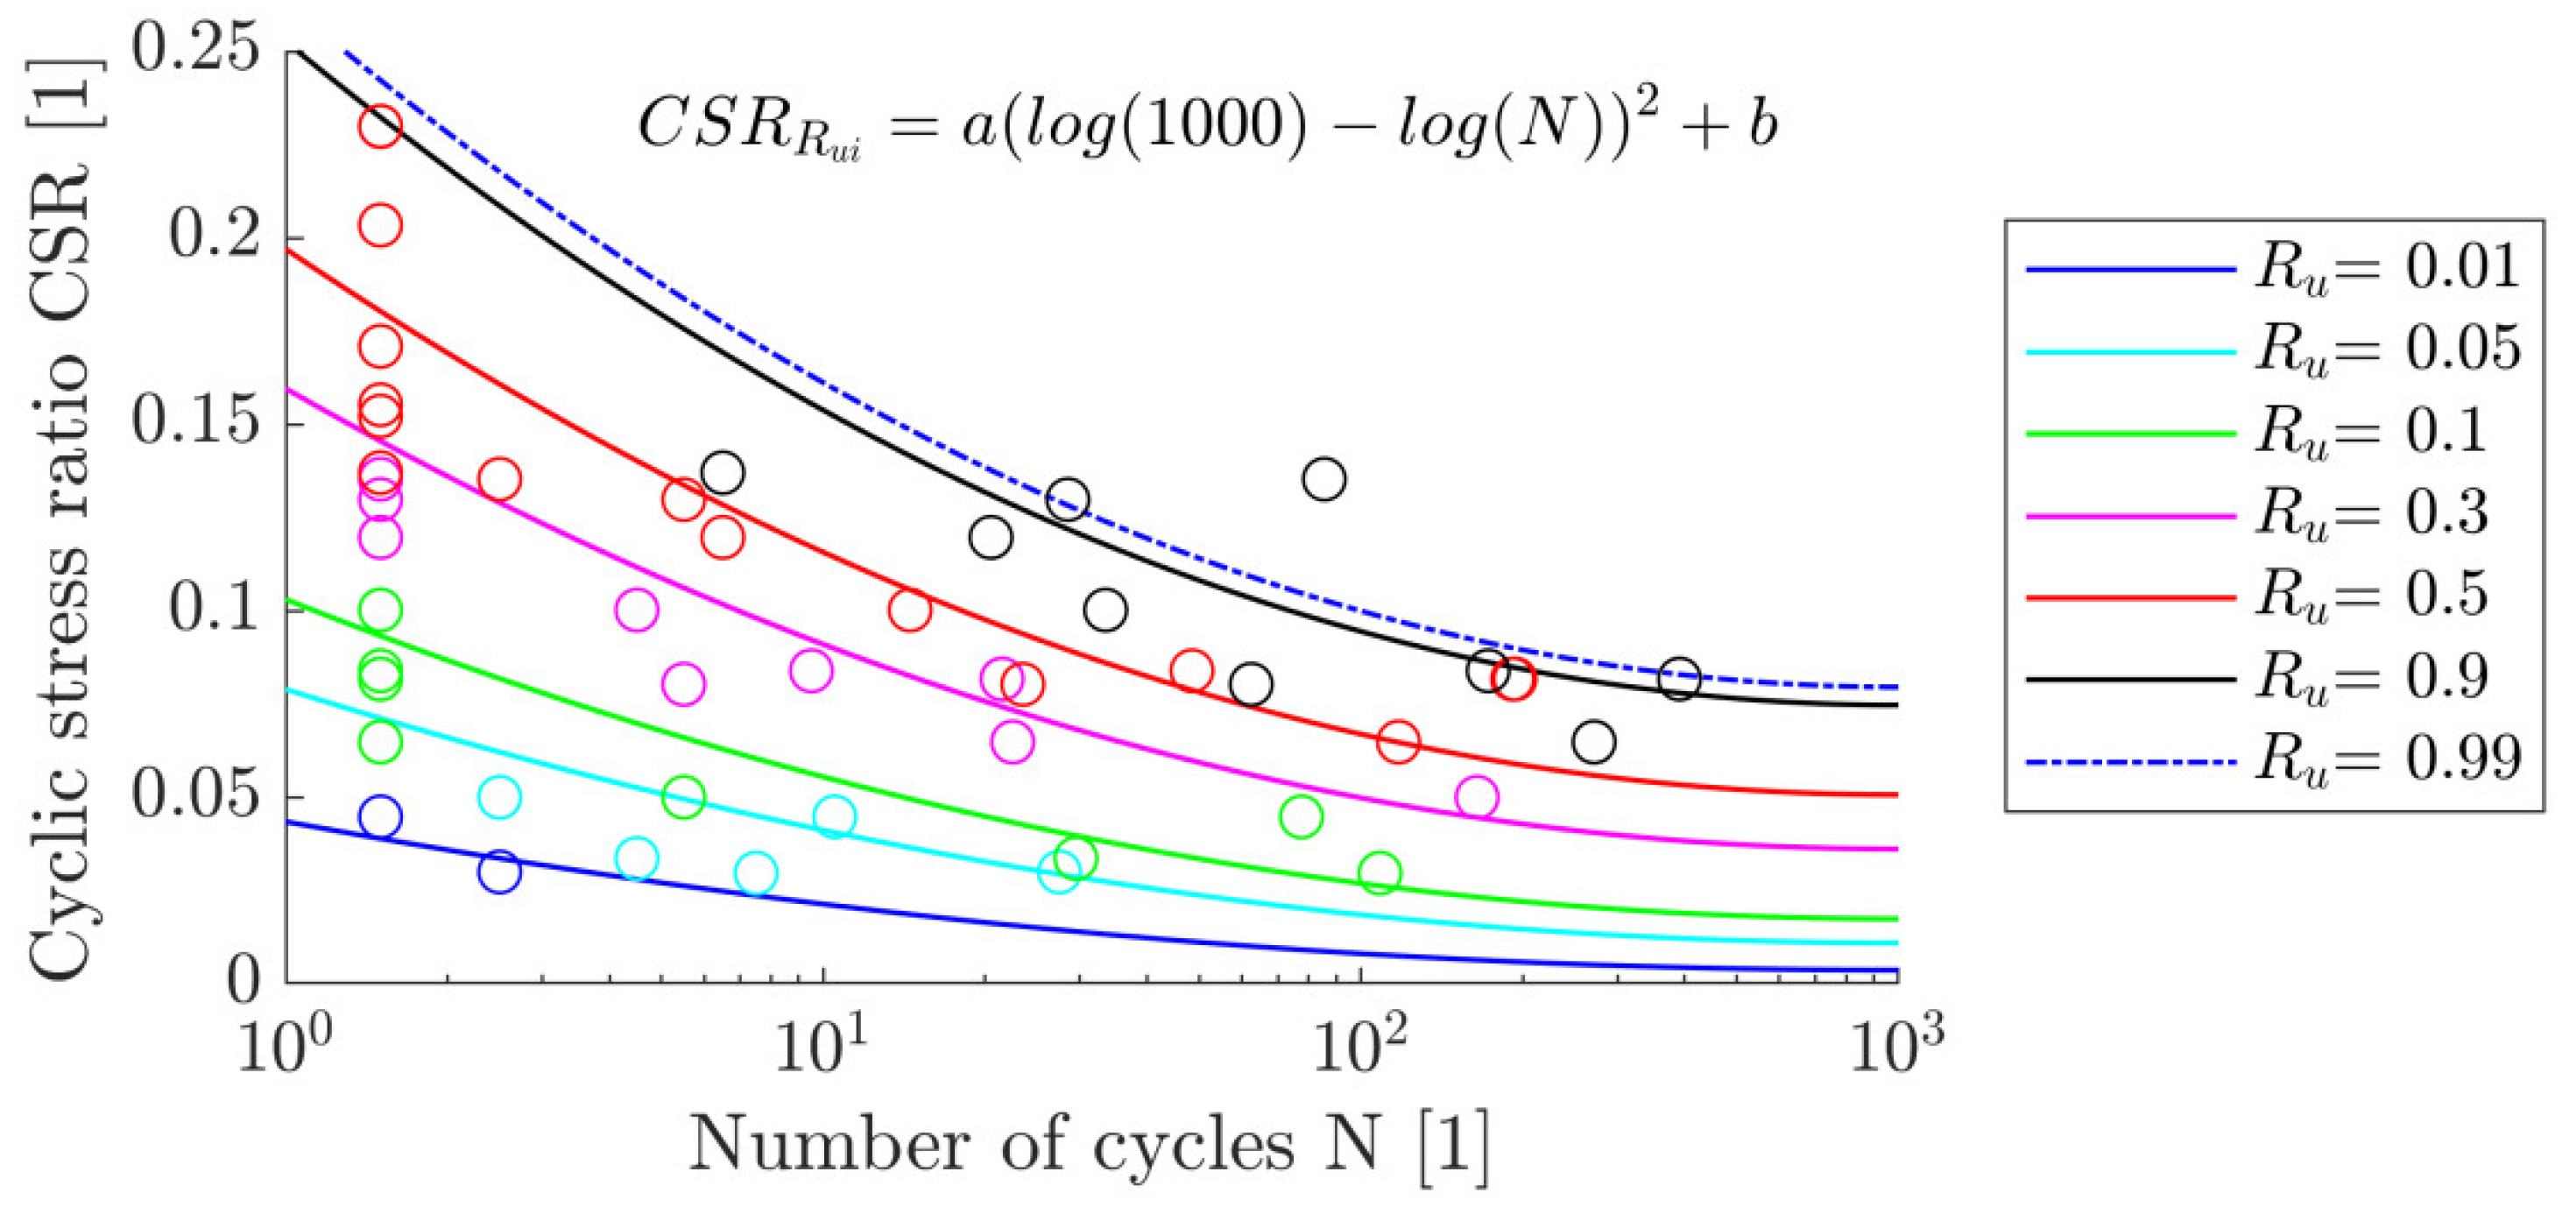
In order to check the suitability, the approaches according to Equations (4)–(6) were applied to the test results gained for the reference soil ( D r = 0.85 ) and MSR = 0. The parameters of the approaches were determined by regression analyses. Figure 8 shows the results by comparing the test results (circle symbols) with the derived regression curves for seven distinct R u values (mean excess pore pressure ratio).
Figure 8a shows the regression based on Equation (4). The regression works well for predefined ranges of the regression parameters ( 0 a 1 ; 0.5 b 0.2 ; 0 c 0.5 ) and the asymptotic CSR value can actively be controlled. Figure 8b shows the approach in accordance with the DNV regulation (Equation (5)). This regression seems to be quite good, but is not easy to control regarding the physical meaning of regression parameters. Figure 8c shows the fitting of the values with Equation (6). Equation (6) cannot be fitted to the measured data in a straightforward manner since the regression curve for N = 1 is first needed. It does not give a large decrease over the number of cycles which may become difficult for a larger degradation within the first cycles. The asymptotic value cannot be fitted separately. Furthermore, the curves are not parallel for 1000 cycles and may intersect for larger numbers of cycles.
Evidently, all presented approaches can be generally used for the aspired parametrization. However, the fitting of the parameters is hard to control.

4.2. New Approach

A new equation was developed which focuses on practical applicability with only a few fitting parameters and in which the parameters’ control characteristic features are in the contour plot. Equation (7) shows the developed approach. The equation assumes a quadratic dependence of the CSR value belonging to a certain R u from the logarithm of the number of cycles. Its applicability is limited to a maximum of 1000 cycles, which considers that more than 1000 cycles are seldom relevant:
C S R R u = a · ( log 1000 l o g ( N ) ) 2 + b
The approach needs two regression parameters, a and b , dependent on the considered R u value for each MSR. The asymptotic CSR value equals the b value within the equation.
The dependence of the regression parameters on the normalized excess pore pressure was fitted by means of a hyperbolic tangent function (Equation (8)). This mathematical equation was derived from an extensive preliminary study and proved to be the most suitable and generally applicable solution.
a = t a n h ( a 1 · R u a 2 )     b = t a n h ( b 1 · R u b 2 )
Thereby, the mathematical approach requires four input parameters, namely, a 1 , b 1 , a 2 and b 2 for each MSR.
Figure 9 elucidates the dependence of the parameters a and b on R u and the determination of the regression parameters. Evidently, a reasonable fitting is possible. It should be noted that this hyperbolic tangent relation between the regression parameters and the excess pore pressure ratio R u was also used in the regression analyses for the other investigated approaches.
Figure 10 shows the contour plots for MSR = 0 determined with the new approach in comparison to the laboratory test results. The new approach fits the test data quite well. The regression parameters can be fitted easily, whereby the shape of the contour lines and also the asymptotic value can be directly controlled. The number of fitting parameters is furthermore reasonable.
In Table 1, the regression parameters determined for MSR values between 0 and 0.25 are presented. Figure 11 depicts the applied curves considering the mentioned parameters and the laboratory tests for selected R u values and MSR values of 0, 0.05, 0.10 and 0.15. Only the results of the DSS tests for N = 1, 10, 100 and 1000 are depicted for a clearer presentation.
According to Figure 11, there exists a CSR value below which almost no excess pore pressure develops. A larger MSR leads to a smaller bearable CSR value for the same number of cycles. For different MSR values, isocurves of larger excess pore pressure are more affected than the isocurves of smaller values. This agrees with the literature data.
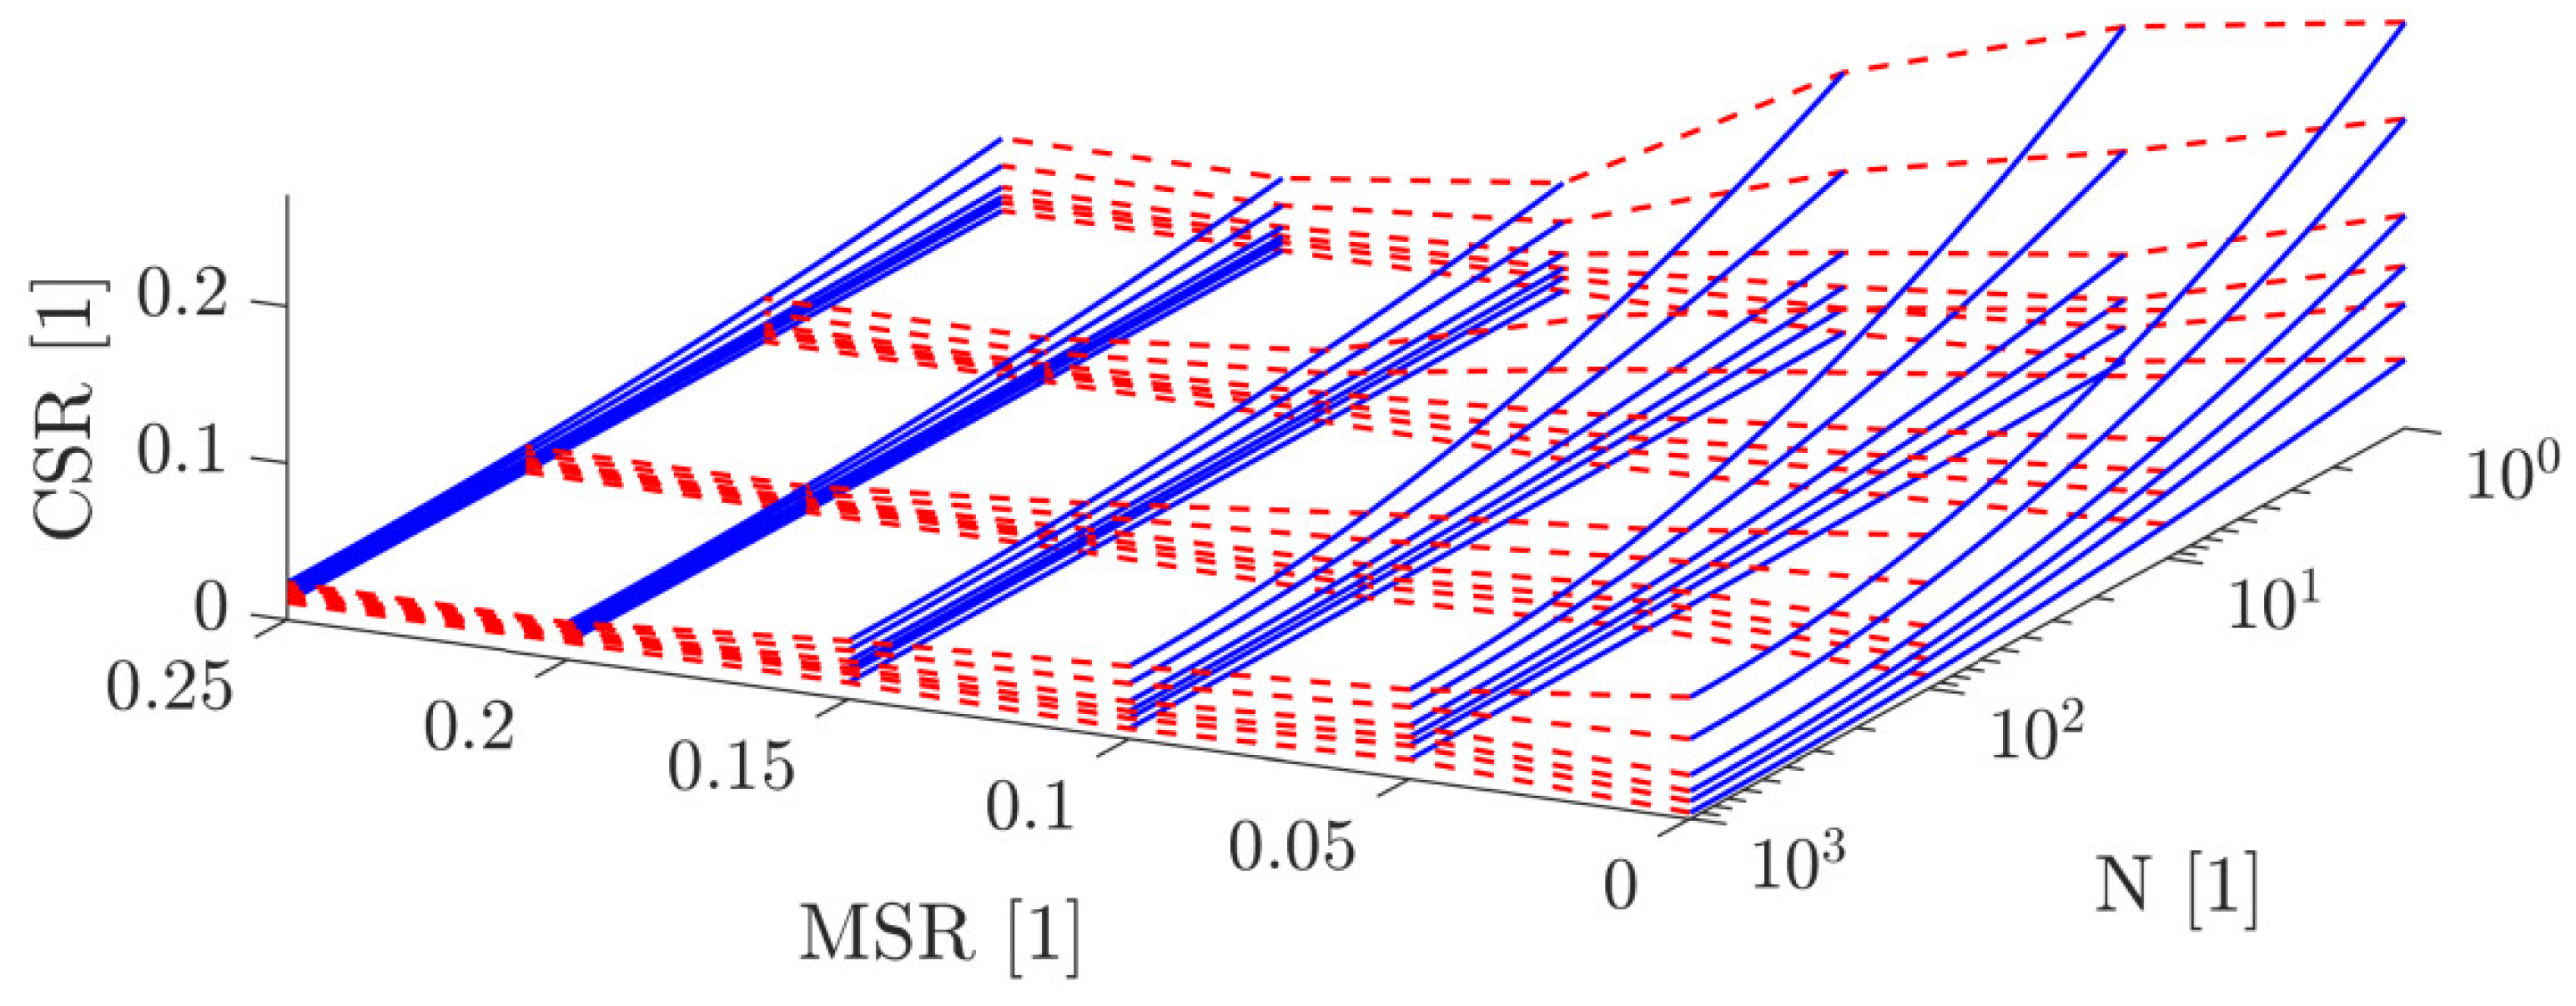
The final three-dimensional excess pore pressure ratio contour plot as obtained from the newly proposed mathematical approach is depicted in Figure 12 with CSR and MSR over number of cycles for excess pore pressure ratios R u of 0.01, 0.05, 0.10, 0.20, 0.50 and 0.95. The blue lines represent the lines from the two-dimensional representations in Figure 11. In the CSR-MSR plane for N = 1, the results of monotonic tests can be seen. It should be noted again that the mean stress was applied in a drained manner, i.e., only tests with MSR = 0 are performed fully undrained without a drained mean shear phase.
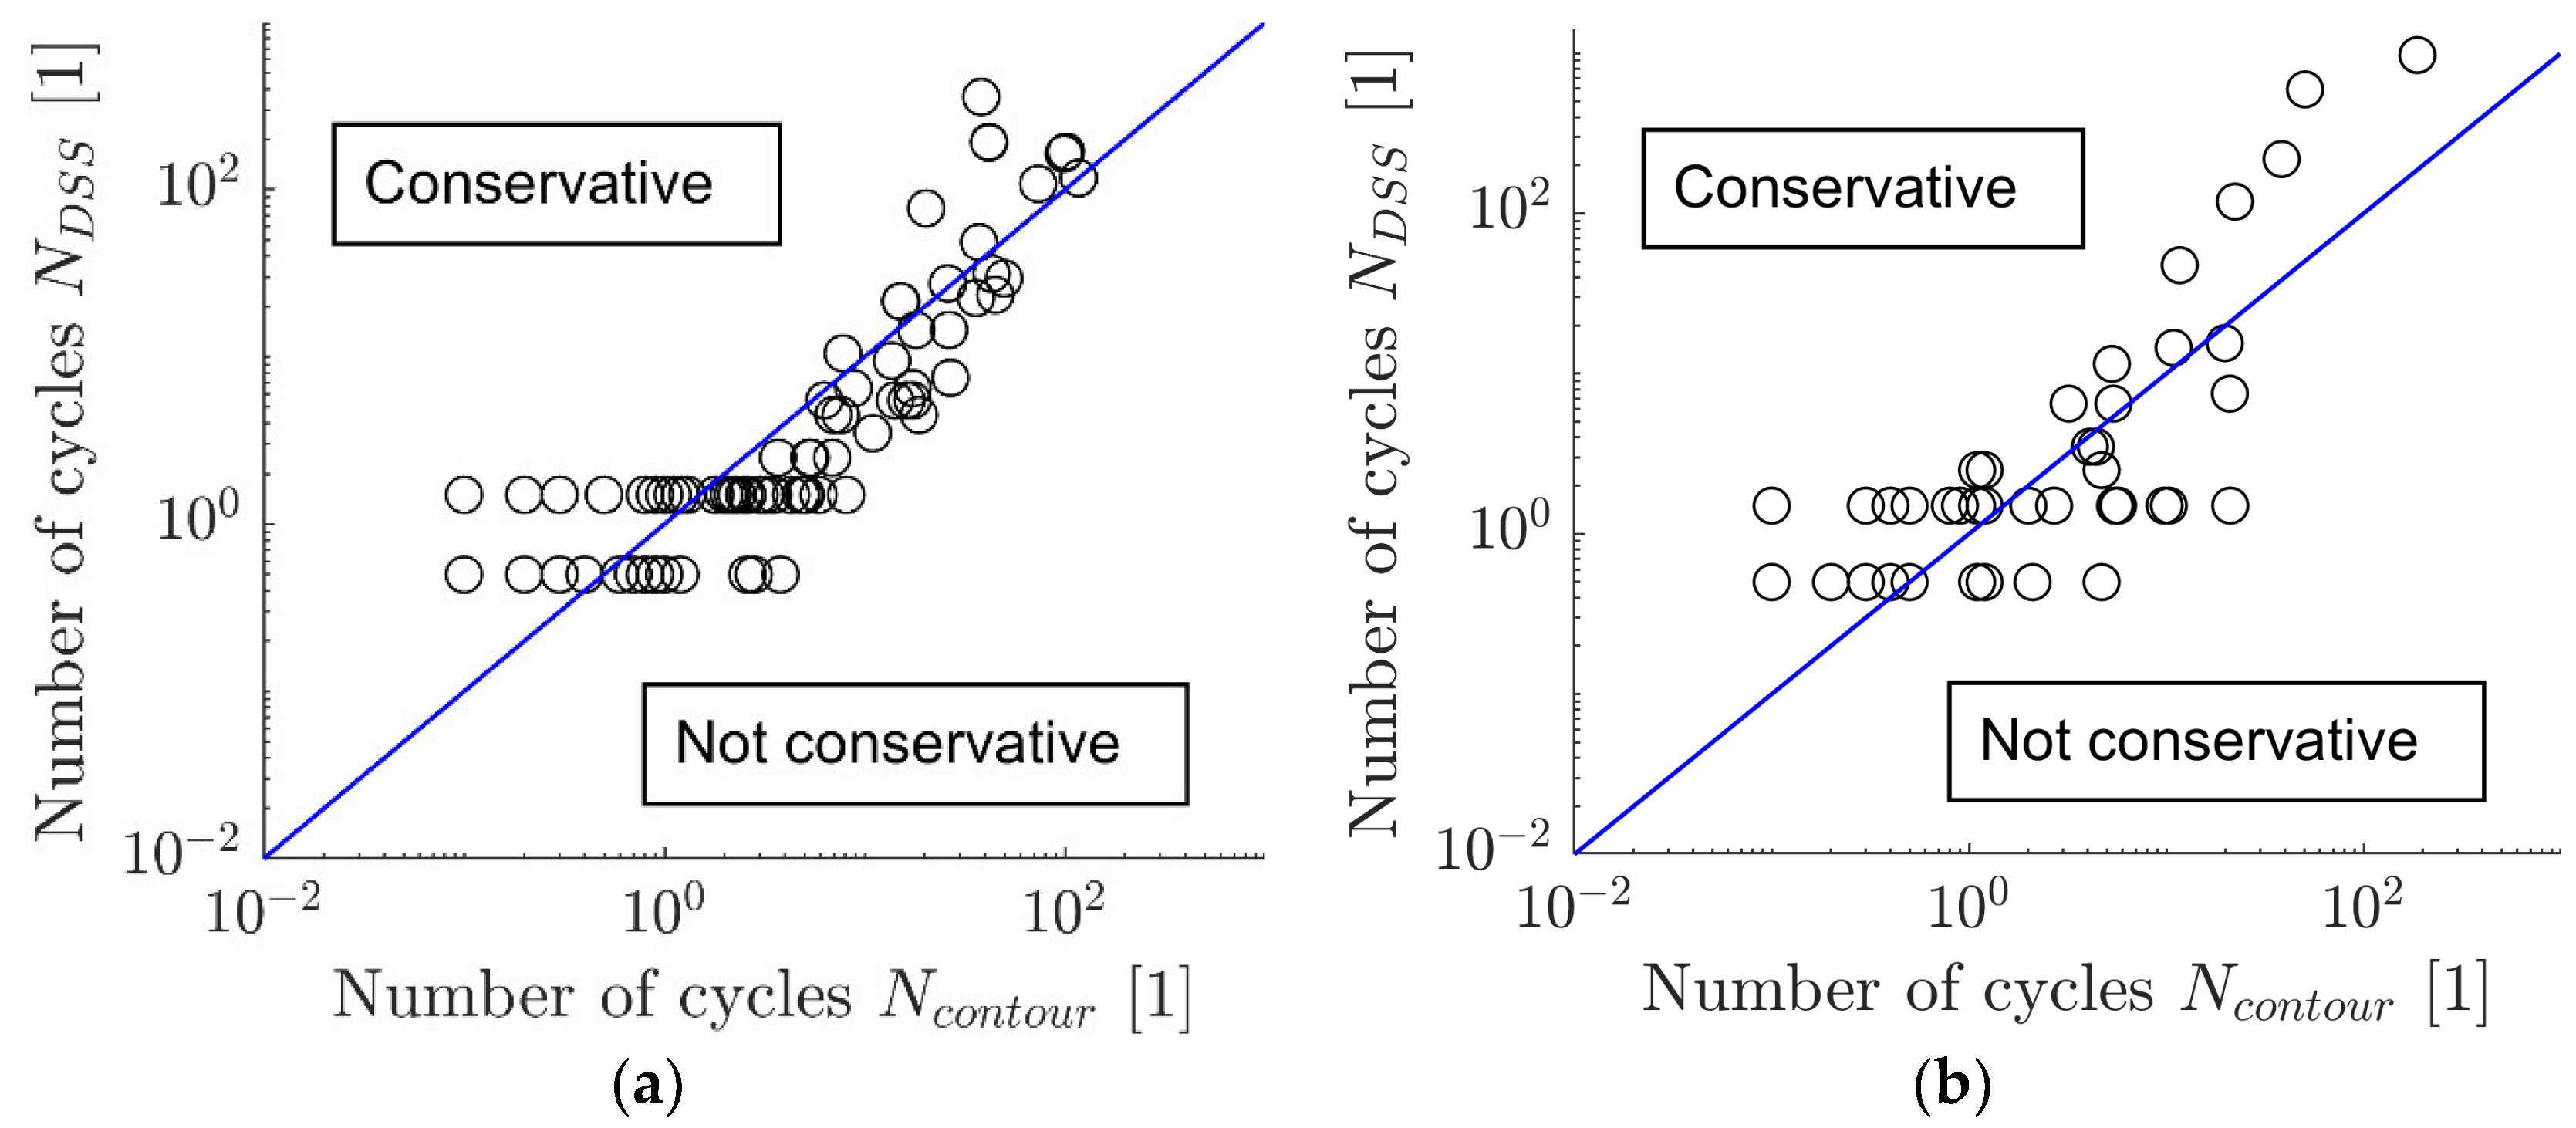
The quality of fit obtained by the regression can be assessed by comparing the calculated numbers of cycles from the mathematical equations and the measured values from laboratory test results for different excess pore pressure ratios. Figure 13 compares the measured laboratory data and the derived values for MSR = 0 and MSR = 0.10 in terms of the excess pore pressure ratios of R u 0.05, 0.10, 0.15, 0.20, 0.30, 0.50 and 0.95. Hence, for the two MSR values, the number of cycles for these R u values was calculated and compared with the related measured value. Overall, a fairly accurate and overall conservative prediction is evident for both MSR values. To quantify the fitting, the coefficient of determination R 2 was calculated to 0.49 and 0.89 for MSR = 0 and MSR = 0.10, respectively. Due to the complexity and inherent variability within the physical tests, the fitting accuracy is deemed reasonable.

5. Construction of Contour Plots with Minimum Test Results

The derivation of a full set of contour plots for a certain soil requires numerous cyclic laboratory tests which limits practical applicability. Therefore, approaches which scale the general trends of cyclic soil behaviour and with that enable the estimation of contour plots by conducting only a few tests are highly desirable. Scaling means in this context that a specific value in the liquefaction curve (i.e., the curve for R u = 1 ) is derived and used to vertically stretch (or shrink) existing contour plots.
Here, the assumption proposed by Andersen (2015) [19] is applied, which states that the value of C S R ( N l i q = 10 ) is characteristic for the cyclic behaviour of a sandy soil and can be used as a reference value in a scaling approach. N l i q denotes the number of load cycles leading to liquefaction, i.e., to R u = 1 . It is assumed that if the CSR values belonging to liquefaction are normalized by the characteristic value C S R ( N l i q = 10 ) , approximately the same curve applies to different soils.
Figure 14 compares the normalized curve proposed in [19] with the curve resulting from this investigation, i.e., from the new regression approach presented in Section 4 applied to the DSS test results for the reference soil with a relative density of D r = 0.85 . Both curves are not identical, but quite similar, which corroborates the assumption made. The suggested trend line according to Andersen (2015) [19] was obtained from DSS tests with MSR = 0 for vertical stresses between 85 kPa and 710 kPa.
In order to further verify this approach, CSR- N l i q plots from literature publications were digitized and the results in terms of the normalized C S R l i q values are also presented in Figure 14. The related references can be found in Table A1 in Appendix A. The fines content of the investigated sand soils was in all cases smaller than 10%. In Figure 14, only test results with sands of high relative density, i.e., around D r = 0.85 as in our tests with the reference soil, are depicted. It should also be noted that in the evaluated publications different apparatuses (DSS, triaxial and torsional simple shear), loading conditions, soil preparations, consolidation characteristics and sand types (particle shape and grain size distribution) were used. Moreover, differing definitions of liquefaction failure were used. Therefore, the comparability of these results is limited. Anyway, the general trend of the curves given is qualitatively confirmed by the test results from the literature.
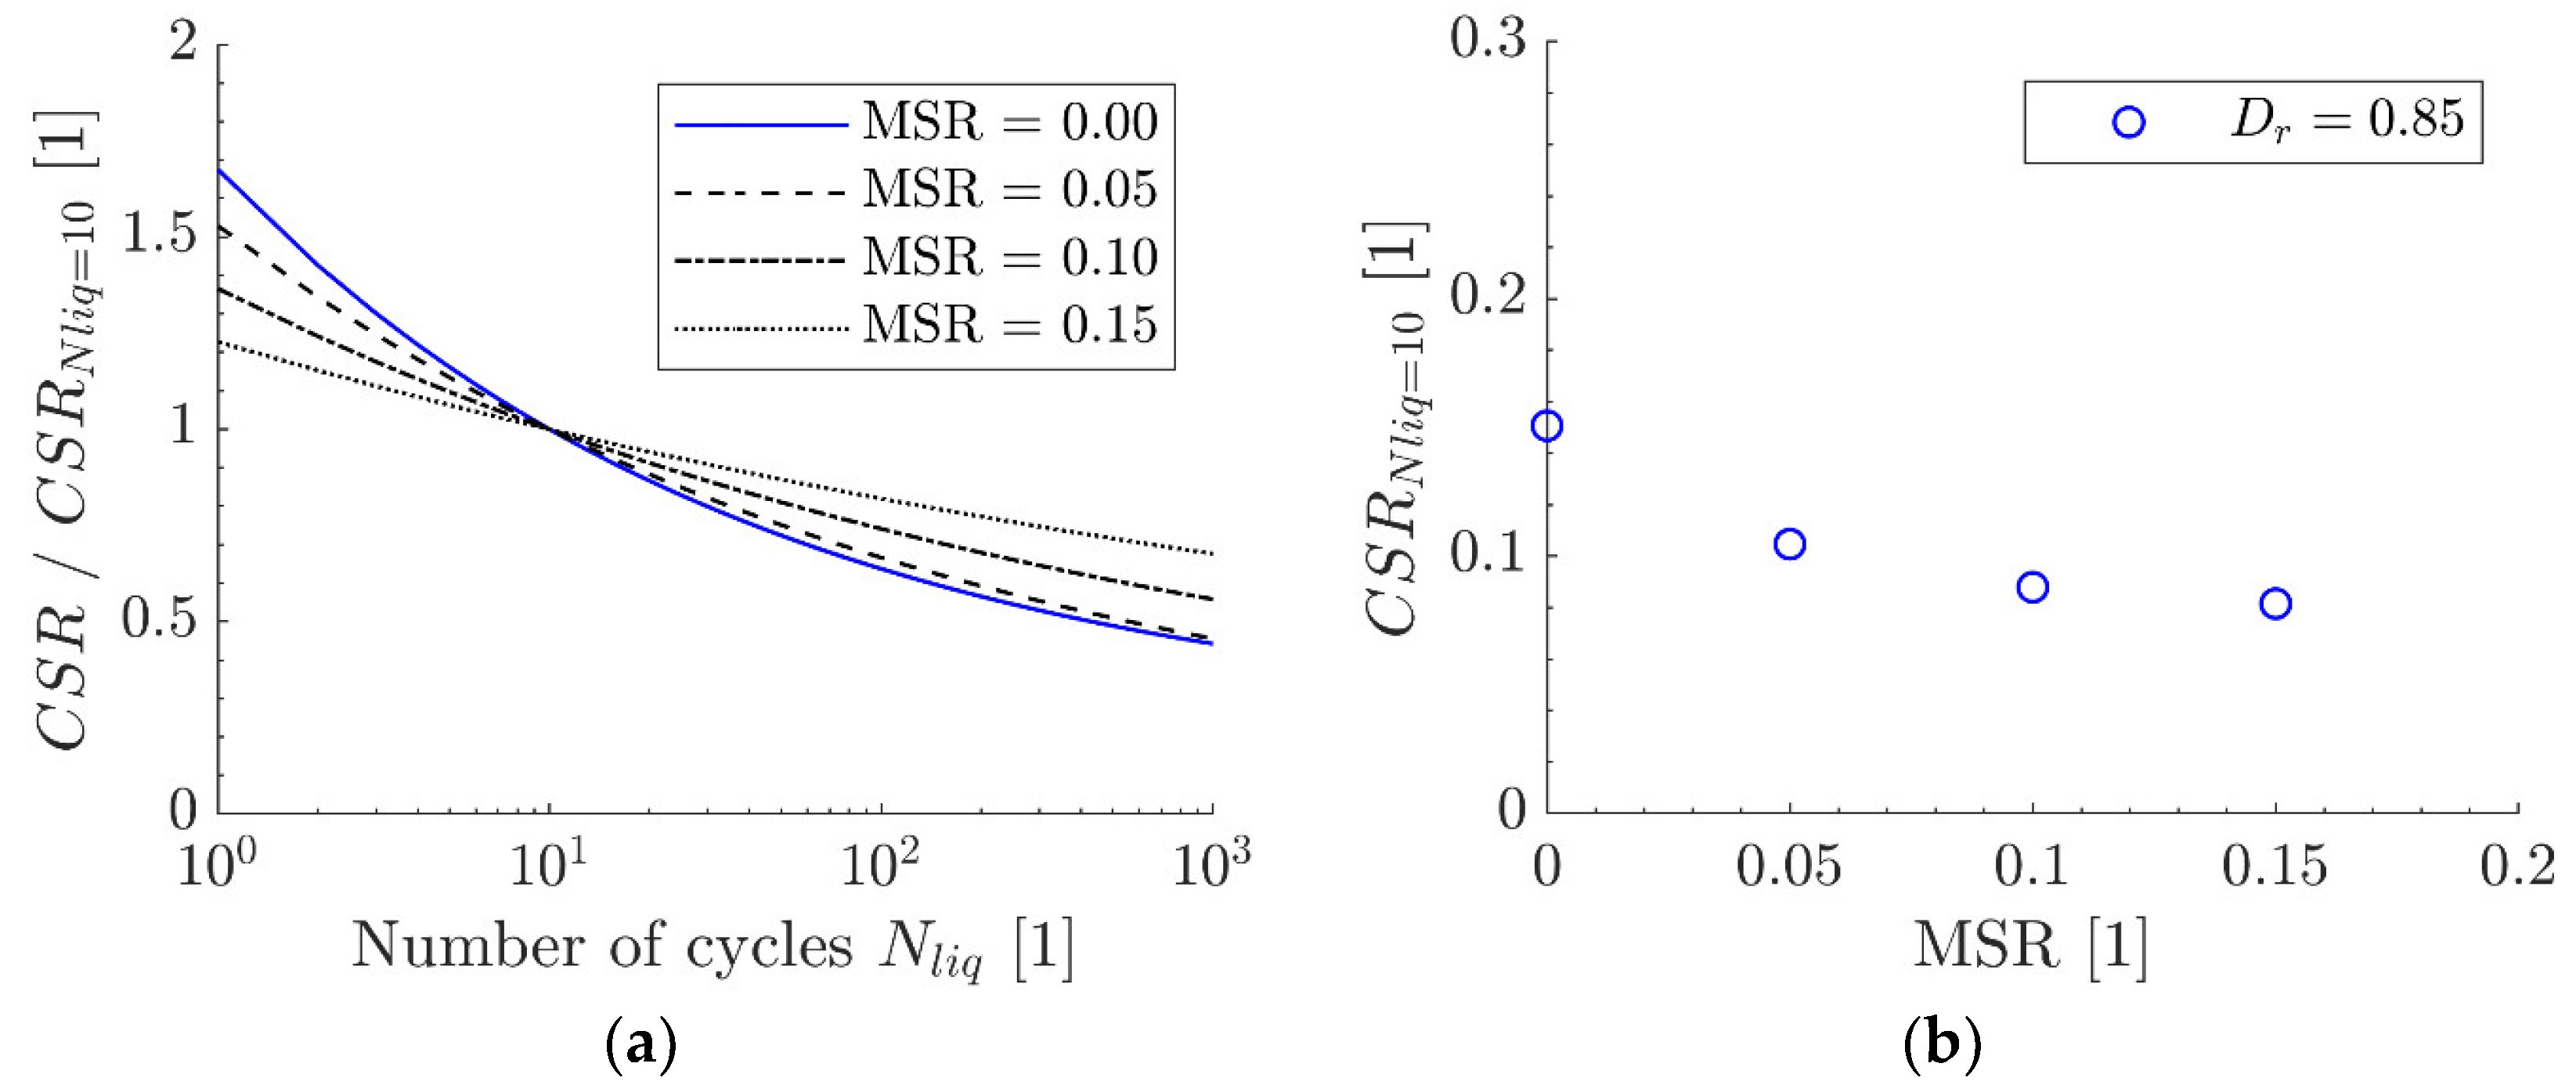
With the contour plot approach presented in Section 4, the derivation of normalized CSR- N l i q plots for mean stress ratios MSR > 0 is also possible. Figure 15a shows the normalized plots for MSR = 0, 0.05, 0.10 and 0.15 resulting from the regression approach. Evidently, the MSR value significantly affects the course of the normalized curve and must therefore be considered in a scaling approach. Figure 15b gives the characteristic values C S R N l i q = 10 for the evaluated MSR values. The figure shows—as to be expected—that the greater the MSR value is, the smaller the CSR value leading to liquefaction after 10 cycles is.
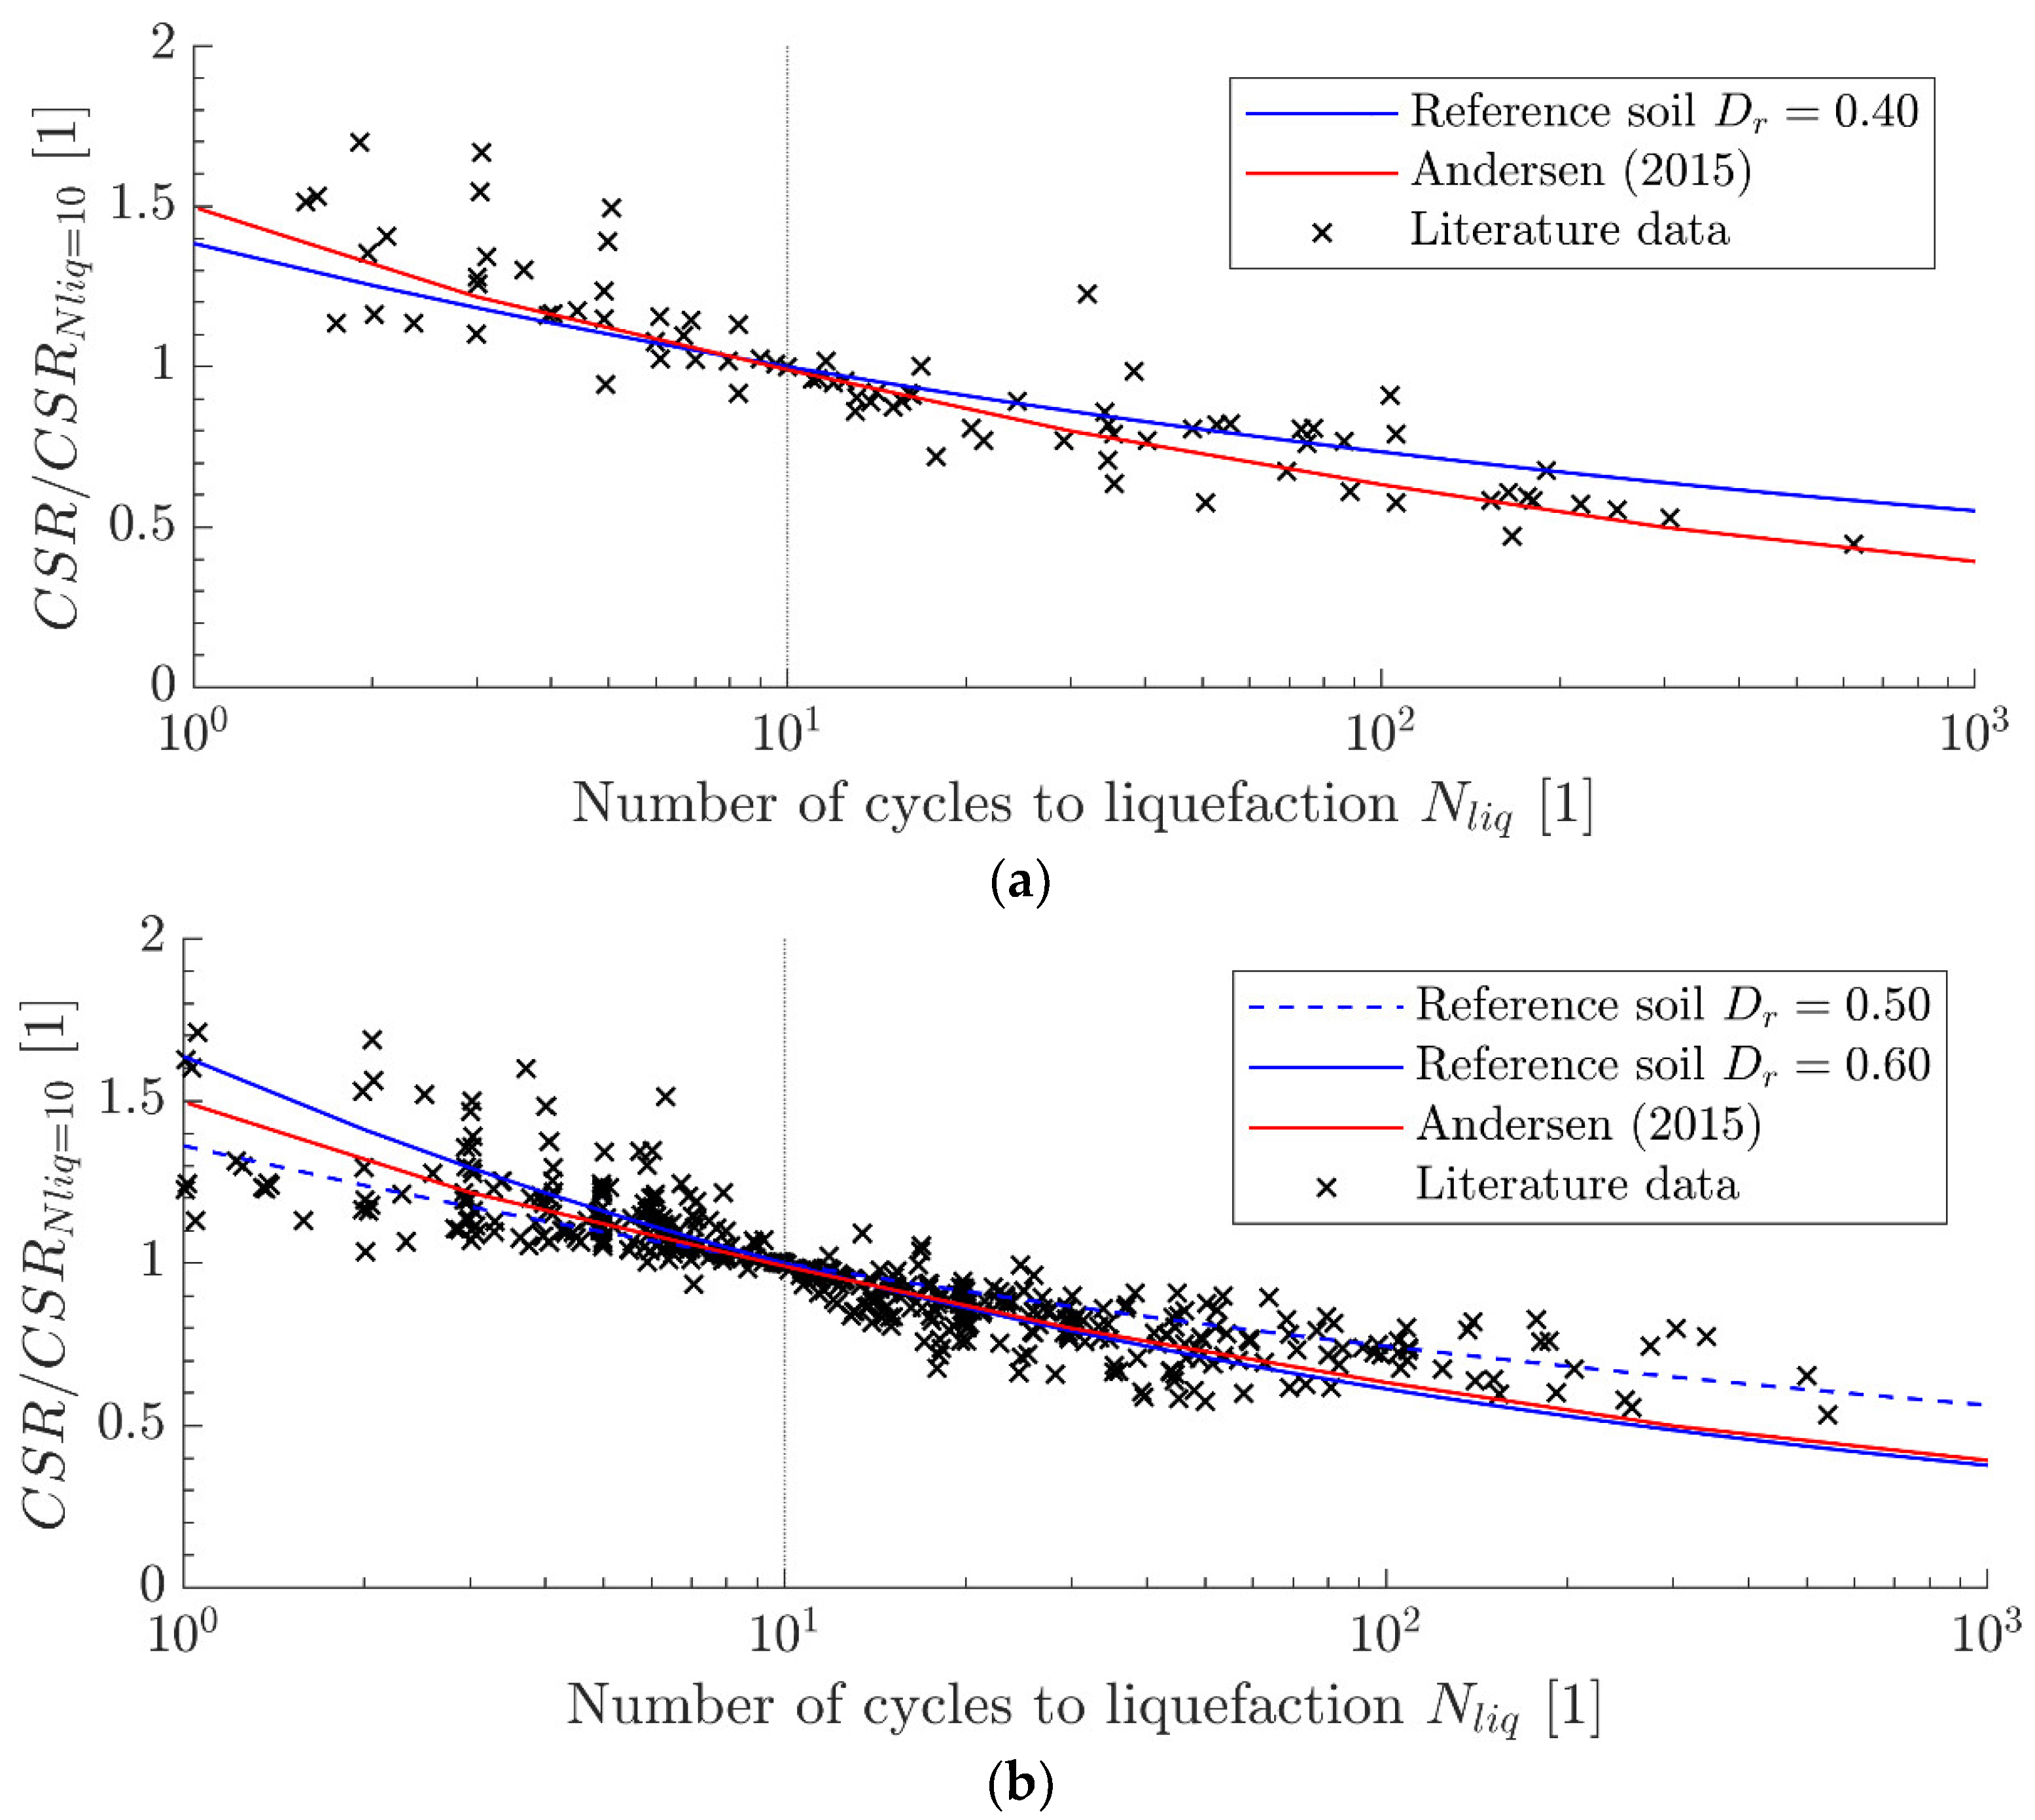
The test results and evaluations presented so far apply to dense sand with a relative density of D r = 0.85. Additionally, similar DSS test programmes with relative densities of the sand of D r = 0.4, 0.5 and 0.6 have been conducted (see Section 3) and the contour plot approach has been applied. Figure 16 presents the normalized CSR-Nliq curves gained. The upper graph is valid for D r = 0.40 and the lower graph for D r = 0.50 to 0.60, i.e., on average to D r = 0.65. In both graphs, the curve of Andersen (2015) [19] is also depicted and points derived from the literature data (cf. Table A1 in Appendix A) for the respective relative density range are shown.
The test results for the reference sand indicate that the normalized CSR-Nliq curve slightly depends on the relative density of the sand. This is also qualitatively confirmed by the literature data. The Andersen approach seems to best represent the reference sand with D r 0.65 . However, at least for a rough approximation, the Andersen curve might be used for all considered relative densities.
Figure 17 finally compares the characteristic values C S R N l i q = 10 for different D r values and MSR = 0 determined with the DSS tests presented here with a curve presented by Andersen (2015) [19] for a normally consolidated sand soil with a fines content less than 5%. Evidently, the reference sand S30T can sustain a considerably smaller cyclic shear stress than the soil investigated by Andersen. Also, the strong increase in C S R N l i q = 10 for relative densities greater than 0.8 predicted by Andersen was not observed in the tests with S30T sand. This may be partly attributed to the round particles of the analyzed reference sand in comparison to the angular Baskarp sand (cf. [21]). It can also be supposed that the relinquishment of pre-cycling in advance to the start of the undrained (or CV) test phase significantly contributed to the differences in the results. However, the reasons for the deviations are yet unclear and require further research.

6. Discussion and Conclusions

By means of numerous cyclic DSS tests under constant-volume condition with varying cyclic stress conditions (CSR, MSR), contour plots for excess pore pressure have been derived for a reference sand (uniform medium sand S30T). Different approaches for the parametrization of the observed cyclic soil behaviour have been applied and compared. A new approach is proposed, which enables a good representation of the test results for a certain MSR with four parameters to be determined by regression analyses. With that, a comprehensive description of the behaviour of the sand in CV cyclic DSS tests is available. It should, however, be noted that pre-conditioning of the sand samples, as sometimes done in practice, was not conducted. A pre-conditioning by over-consolidation or pre-shearing usually leads to smaller excess pore pressures and also to less scatter in the test results. However, since no definition exists how exactly to perform these test stages, pre-conditioning was not considered in the tests presented here. Therefore, the database describes the upper bound of the S30T soil’s sensitivity to cyclic loading.
The new mathematical approach was applied here for the parametrization of contour plots for excess pore pressures. However, it was proven that the approach is generally also applicable for contour plots for cyclic or mean shear strains.
For an approximate derivation of a full set of contour plots, scaling approaches can be used. Andersen (2015) [19] proposed to derive the cyclic soil behaviour for MSR = 0 based on the CSR value at which liquefaction occurs after 10 cycles. This approach was checked and essentially confirmed both with the results from the cyclic tests with the reference soil and with numerous test data from the literature. Additionally, a scaling approach for tests with MSR > 0 was derived from the tests with the reference sand. In the end, liquefaction curves (i.e., CSR-N curves for R u = 1 ) for different MSR values can be derived by conducting only a few cyclic DSS tests, from which the CSR value corresponding to liquefaction after 10 cycles for MSR = 0 is determined. The complete contour plots, i.e., CSR-N curves for varying R u values, can then be derived by vertically scaling existing contour plots from the literature.
The parametrized contour plots can be used for the determination of equivalent load cycle numbers for cyclic loads consisting of several cyclic load bins with varying CSR values or be implemented into numerical explicit design procedures for the estimation of excess pore pressure accumulation around cyclically loaded foundations.

Author Contributions

Conceptualization, methodology, validation: J.-E.S. and M.A.; formal analysis, investigation, writing of draft: J.-E.S.; writing—review and editing, supervision: M.A. All authors have read and agreed to the published version of the manuscript.

Funding

The investigations reported were funded by the Deutsche Forschungsgemeinschaft (DFG, German Research Foundation)-SFB1463—434502799.

Data Availability Statement

The datasets of the laboratory tests are not readily available because the data are part of an ongoing study. Requests to access the datasets should be directed to the co-author ([email protected]).

Acknowledgments

The financial support by the Deutsche Forschungsgemeinschaft (DFG, German Research Foundation) is gratefully acknowledged.

Conflicts of Interest

The authors have no relevant financial or non-financial interests to disclose.

Appendix A. List of References Evaluated with Respect to Normalized CSR-Nliq Curves

Table A1. References with results of undrained DSS tests with sands.
PublicationStress [kPa]Relative Density [1]
Ahn and Park (2013) [29]100, 2000.40, 0.53, 0.67, 0.77, 0.80
Carraro et al. (2003) [30]1000.40, 0.67, 0.77, 0.82
Chien et al. (2002) [31]-0.40, 0.58, 0.77
De Alba et al. (1976) [32]550.54, 0.68, 0.82
Enomoto (2019) [33]250.44
Evans and Zhou (1995) [34]1000.40, 0.60, 0.84
Finn et al. (1976) [35]-0.45
Ghionna and Porcino (2006) [36]-0.35, 0.40
Hosono and Yoshimine (2004) [37]-0.40, 0.62
Hyodo et al. (1991) [38]1000.50, 0.70
Hyodo et al. (1994) [39]100, 2000.35, 0.66
Hyodo et al. (1996) [40]100, 300, 5000.80
Hyodo et al. (2002) [41]50000.80
Ishihara and Li (1972) [42]-0.65
Ishihara and Takatsu (1979) [43]200.55
Ishihara et al. (1980) [44]980.554, 0.68, 0.85 0.94
Ishihara and Yamazaki (1980) [45]2000.49
Ishihara et al. (1985) [46]2000.50, 0.79, 092
Ishihara (1985) [47]980.55, 0.65, 0.88
Ishihara (1993) [48]-0.50, 0.60
Kokusho (2016) [49]980.55
Konstadinou and Georgiannou (2014) [50]120, 3200.25
Nemat-Nasser and Shokooh (1979) [51]95, 196, 490, 7840.37, 0.50, 0.68, 0.82
Pan and Yang (2017) [52]1000.28
Polito (1999) [7]1000.43, 0.58, 0.65, 0.81
Salem et al. (2013) [53]50, 100, 2000.40, 0.80
Shahnazari et al. (2016) [54]60, 100, 260, 3000.65
Sze and Yang (2014) [55]100, 5000.20, 0.35
Tatsuoka et al. (1986) [56]1000.50, 0.60, 0.70, 0.80, 0.90
Tatsuoka and Silver (1981) [57]1000.50, 0.80
Tokimatsu and Hosaka (1986) [58]980.57 0.83
Vaid and Chern (1983) [59]2000.45, 0.55, 0.65
Wijewickreme et al. (2005) [60]100, 2000.40
Wu et al. (2004) [61]40, 80, 1800.35, 0.45, 0.60, 0.80
Xenaki and Athanasopoulos (2003) [62]105, 1960.92
Yang and Sze (2011) [63]100, 3000.20, 0.50
Yoshimi et al. (1989) [64]780.54, 0.64, 0.78, 0.84
Yoshimi et al. (1994) [65]55, 980.60, 0.87

References

  1. Andersen, K.H. Behaviour of clay subjected to undrained cyclic loading. In Behaviour of Off-Shore Structures; Norwegian Geotechnical Institute: Oslo, Norway, 1976. [Google Scholar]
  2. Andersen, K.H.; Lauritzsen, R.; Dyvik, R.; Aas, P.M. Cyclic bearing capacity analysis for gravity platforms. In Proceedings of the International Conference on Behaviour of Offshore Structures, BOSS’88, Trondheim, Norway, 21–25 June 1988. [Google Scholar]
  3. Andersen, K.H.; Høeg, K. Deformations of Soils and Displacements of Structures subjected to Combined Static and Cyclic Loads; Norgesgeotekniske Institutt: Oslo, Norway, 1992. [Google Scholar]
  4. Achmus, M.; Saathoff, J.-E.; Thieken, K. Numerical method for evaluation of excess pore pressure build-up at cyclically loaded offshore foundations. In Numerical Methods in Geotechnical Engineering IX; CRC Press: Boca Raton, FL, USA, 2018; pp. 1461–1468. [Google Scholar] [CrossRef]
  5. Saathoff, J.-E.; Achmus, M. Practical approach for the evaluation of cyclically induced excess pore pressure around offshore foundations in sand. In Proceedings of the 4th International Symposium on Frontiers in Offshore Geotechnics, Austin, TX, USA, 28–31 August 2020. [Google Scholar]
  6. Saathoff, J.-E.; Achmus, M. Estimation of capacity decrease due to accumulated excess pore pressures around cyclically loaded offshore foundations in sand. Ocean. Eng. 2024, 294, 116743. [Google Scholar] [CrossRef]
  7. Polito, C.P. The Effects of Non-Plastic and Plastic Fines on the Liquefaction of Sandy Soils; Virginia Polytechnic Institute and State University: Blacksburg, VA, USA, 1999; Available online: http://hdl.handle.net/10919/30243 (accessed on 10 January 2023).
  8. Vucetic, M.; Dobry, R. Pore Pressure Buildup and Liquefaction at Level Sandy Sites during Earthquakes; Rensselaer Polytechnic Institute: Troy, NY, USA, 1986. [Google Scholar]
  9. Dobry, R.; Ladd, R.S.; Yokel, F.Y.; Chung, R.M.; Powell, D. Prediction of Pore Water Pressure Buildup and Liquefaction of Sands during Earthquakes by the Cyclic Strain Method; U.S. Department of Commerce, National Bureau of Standards: Gaithersburg, MD, USA, 1982. [Google Scholar] [CrossRef]
  10. Seed, H.B.; Martin, P.P.; Lysmer, J. The Generation and Dissipation of Pore Water Pressures during Soil Liquefaction; College of Engineering, University of California: Davis, CA, USA, 1975. [Google Scholar]
  11. Seed, H.B.; Lee, K.L. Liquefaction of saturated sands during cyclic loading. J. Soil Mech. Found. Div. 1966, 92, 105–134. [Google Scholar] [CrossRef]
  12. Silver, M.L.; Chan, C.K.; Ladd, R.S.; Lee, K.L.; Tiedemann, D.A.; Townsend, F.C.; Valera, J.E.; Wilson, J.H. Cyclic triaxial strength of standard test sand. J. Geotech. Eng. Div. 1976, 102, 511–523. [Google Scholar] [CrossRef]
  13. Lee, K.L.; Seed, H.B. Cyclic stress conditions causing liquefaction of sand. J. Soil Mech. Found. Div. 1967, 93, 47–70. [Google Scholar] [CrossRef]
  14. De Alba, P.; Chan, C.K.; Seed, H. Determination of Soil Liquefaction Characteristics by Large-Scale Laboratory Tests; Shannon & Wilson, Inc.: Seattle, WA, USA, 1975. [Google Scholar]
  15. Airey, D.W.; Wood, D.M. Pore pressures in simple shear. Soils Found. 1986, 26, 91–96. [Google Scholar] [CrossRef]
  16. Finn, W.D.L.; Vaid, Y.P. Liquefaction potential from drained constant volume cyclic simple shear tests. In Proceedings of the 6th World Conference on Earthquake Engineering, New Delhi, India, 10–14 January 1977. [Google Scholar]
  17. Feda, J. Constant volume shear tests of saturated sand. Arch. Hydrotech. 1971, 18, 349–367. [Google Scholar]
  18. ASTM D8296-19; Standard Test Method for Consolidated Undrained Cyclic Direct Simple Shear Test Under Constant Volume with Load Control or Displacement Control. ASTM: West Conshohocken, PA, USA, 2019. Available online: https://www.astm.org/d8296-19.html (accessed on 10 May 2023).
  19. Andersen, K.H. Cyclic soil parameters for offshore foundation design. In Frontiers in Offshore Geotechnics III, ISFOG’2015; The 3rd McClelland Lecture; Meyer, V., Ed.; Taylor & Francis Group: London, UK, 2015; pp. 5–82. [Google Scholar]
  20. Andersen, K.H.; Engin, H.K.; D’Ignazio, M.; Yang, S. Determination of cyclic soil parameters for offshore foundation design from an existing data base. Ocean. Eng. 2023, 267, 113180. [Google Scholar] [CrossRef]
  21. Blaker, O.; Andersen, K.H. Cyclic properties of dense to very dense silica sand. Soils Found. 2019, 59, 982–1000. [Google Scholar] [CrossRef]
  22. Youd, T.L. Compaction of sands by repeated shear straining. J. Soil Mech. Found. Div. 1972, 98, 709–725. [Google Scholar] [CrossRef]
  23. Studer, J.A.; Laue, J.; Koller, M. Bodendynamik—Grundlagen, Kennziffern, Probleme und Lösungsansätze; Springer: Berlin/Heidelberg, Germany, 2007. [Google Scholar] [CrossRef]
  24. Zorzi, G.; Kirsch, F.; Richter, T.; Ostergaard, M.U.; Sorensen, S.P.H. Validation of explicit method to predict accumulation of strain during single and multistage cyclic loading. In Proceedings of the XVII European Conference on Soil Mechanics and Geotechnical Engineering, Reykjavík, Iceland, 1–6 September 2019. [Google Scholar] [CrossRef]
  25. Boukpeti, N.; Lehane, B.; Carraro, J.A.H. Strain accumulation procedure during staged cyclic loading of carbonate sediments. In Proceedings of the ASME 2014 33rd International Conference on Ocean, Offshore and Arctic Engineering, San Francisco, CA, USA, 7–12 June 2014. [Google Scholar] [CrossRef]
  26. Zografou, D.; Gourvenec, S.; O’Loughlin, C.D. Response of normally consolidated kaolin clay under irregular cyclic loading and comparison with predictions from the accumulation procedure. Géotechnique 2019, 69, 106–121. [Google Scholar] [CrossRef]
  27. Ronold, K.O. Reliability of Marine Clay Foundations in Cyclic Loading. Ph.D. Thesis, Stanford University, Department of Civil Engineering, Stanford, CA, USA, 1993. [Google Scholar] [CrossRef]
  28. DNV-RP-C212; Offshore Soil Mechanics and Geotechnical Engineering. Det Norske Veritas: Oslo, Norway, 2019.
  29. Ahn, J.K.; Park, D. Accumulated Stress Based model for prediction of residual pore pressure. In Proceedings of the 18th International Conference on Soil Mechanics and Geotechnical Engineering, Paris, France, 2–6 September 2013; pp. 1567–1570. [Google Scholar]
  30. Carraro, J.A.H.; Bandini, P.; Salgado, R. Liquefaction resistance of clean and nonplastic silty sands based on cone penetration resistance. J. Geotech. Geoenviron. Eng. 2003, 129, 965–976. [Google Scholar] [CrossRef]
  31. Chien, L.K.; Oh, Y.N.; Chang, C.H. Effects of fines content on liquefaction strength and dynamic settlement of reclaimed soil. Can. Geotech. J. 2002, 39, 254–265. [Google Scholar] [CrossRef]
  32. De Alba, P.A.; Chan, C.K.; Seed, H.B. Sand liquefaction in large-scale simple shear tests. J. Geotech. Eng. Div. 1976, 102, 909–927. [Google Scholar] [CrossRef]
  33. Enomoto, T. Liquefaction and post-liquefaction properties of sand-silt mixtures and undisturbed silty sands. Soils Found. 2019, 59, 2311–2323. [Google Scholar] [CrossRef]
  34. Evans, M.D.; Zhou, S. Liquefaction behavior of sand-gravel composites. J. Geotech. Eng. 1995, 121, 287–298. [Google Scholar] [CrossRef]
  35. Finn, W.D.L.; Martin, G.R.; Byrne, P.M. Seismic response and liquefaction of sands. J. Geotech. Eng. Div. 1976, 102, 841–856. [Google Scholar] [CrossRef]
  36. Ghionna, V.N.; Porcino, D. Liquefaction resistance of undisturbed and reconstituted samples of a natural coarse sand from undrained cyclic triaxial tests. J. Geotech. Geoenviron. Eng. 2006, 132, 194–202. [Google Scholar] [CrossRef]
  37. Hosono, Y.; Yoshimine, M. Liquefaction of Sand in Simple Shear Condition; Taylor & Francis: London, UK, 2004; pp. 129–136. [Google Scholar]
  38. Hyodo, M.; Murata, H.; Yasufuku, N.; Fujii, T. Undrained cyclic shear strength and residual shear strain of saturated sand by cyclic triaxial tests. Soils Found. 1991, 31, 60–76. [Google Scholar] [CrossRef]
  39. Hyodo, M.; Yamamoto, Y.; Sugiyama, M. Undrained cyclic shear behaviour of normally consolidated clay subjected to initial static shear stress. Soils Found. 1994, 34, 1–11. [Google Scholar] [CrossRef]
  40. Hyodo, M.; Aramaki, N.; Itoh, M.; Hyde, A.F. Cyclic strength and deformation of crushable carbonate sand. Soil Dyn. Earthq. Eng. 1996, 15, 331–336. [Google Scholar] [CrossRef]
  41. Hyodo, M.; Hyde, A.F.; Aramaki, N.; Nakata, Y. Undrained monotonic and cyclic shear behaviour of sand under low and high confining stresses. Soils Found. 2002, 42, 63–76. [Google Scholar] [CrossRef]
  42. Ishihara, K.; Li, S. Liquefaction of saturated sand in triaxial torsion shear test. Soils Found. 1972, 12, 19–39. [Google Scholar] [CrossRef]
  43. Ishihara, K.; Takatsu, H. Effects of overconsolidation and K0, conditions on the liquefaction characteristics of sands. Soils Found. 1979, 19, 59–68. [Google Scholar] [CrossRef]
  44. Ishihara, K.; Troncoso, J.; Kawase, Y.; Takahashi, Y. Cyclic strength characteristics of tailings materials. Soils Found. 1980, 20, 127–142. [Google Scholar] [CrossRef]
  45. Ishihara, K.; Yamazaki, F. Cyclic simple shear tests on saturated sand in multi-directional loading. Soils Found. 1980, 20, 45–59. [Google Scholar] [CrossRef]
  46. Ishihara, K.; Yamazaki, A.; Haga, K. Liquefaction of k0-consolidated sand under cyclic rotation of principal stress direction with lateral constraint. Soils Found. 1985, 25, 63–74. [Google Scholar] [CrossRef]
  47. Ishihara, K. Stability of natural deposits during earthquakes. In Proceedings of the 11th International Conference on Soil Mechanics and Foundation Engineering, San Francisco, CA, USA, 12–16 August 1985. [Google Scholar]
  48. Ishihara, K. Liquefaction and flow failure during earthquakes. Géotechnique 1993, 43, 351–451. [Google Scholar] [CrossRef]
  49. Kokusho, T. Major advances in liquefaction research by laboratory tests compared with in situ behavior. Soil Dyn. Earthq. Eng. 2016, 91, 3–22. [Google Scholar] [CrossRef]
  50. Konstadinou, M.; Georgiannou, V. Prediction of pore water pressure generation leading to liquefaction under torsional cyclic loading. Soils Found. 2014, 54, 993–1005. [Google Scholar] [CrossRef]
  51. Nemat-Nasser, S.; Shokooh, A. A unified approach to densification and liquefaction of cohesionless sand in cyclic shearing. Can. Geotech. J. 1979, 16, 659–678. [Google Scholar] [CrossRef]
  52. Pan, K.; Yang, Z.X. Effects of initial static shear on cyclic resistance and pore pressure generation of saturated sand. Acta Geotech. 2017, 13, 473–487. [Google Scholar] [CrossRef]
  53. Salem, M.; Elmamlouk, H.; Agaiby, S. Static and cyclic behavior of north coast calcareous sand in Egypt. Soil Dyn. Earthq. Eng. 2013, 55, 83–91. [Google Scholar] [CrossRef]
  54. Shahnazari, H.; Jafarian, Y.; Tutunchian, M.A.; Rezvani, R. Probabilistic assessment of liquefaction occurrence in calcareous fill materials of kawaihae harbor, hawaii. Int. J. Geomech. 2016, 16, 05016001. [Google Scholar] [CrossRef]
  55. Sze, H.Y.; Yang, J. Failure modes of sand in undrained cyclic loading: Impact of sample preparation. J. Geotech. Geoenviron. Eng. 2014, 140, 152–169. [Google Scholar] [CrossRef]
  56. Tatsuoka, F.; Ochi, K.; Fujii, S.; Okamoto, M. Cyclic undrained triaxial and torsional shear strength of sands for different sample preparation methods. Soils Found. 1986, 26, 23–41. [Google Scholar] [CrossRef]
  57. Tatsuoka, F.; Silver, M.L. Undrained stress-strain behavior of sand under irregular loading. Soils Found. 1981, 21, 51–66. [Google Scholar] [CrossRef]
  58. Tokimatsu, K.; Hosaka, Y. Effects of sample disturbance on dynamic properties of sand. Soils Found. 1986, 26, 53–64. [Google Scholar] [CrossRef]
  59. Vaid, Y.P.; Chern, J.C. Effect of static shear on resistance to liquefaction. Soils Found. 1983, 23, 47–60. [Google Scholar] [CrossRef]
  60. Wijewickreme, D.; Sanin, M.V.; Greenaway, G.R. Cyclic shear response of fine-grained mine tailings. Can. Geotech. J. 2005, 42, 1408–1421. [Google Scholar] [CrossRef]
  61. Wu, J.; Kammerer, A.; Riemer, M.F.; Seed, R.B.; Pestana, J.M. Laboratory study of liquefaction triggering criteria. In Proceedings of the 13th World Conference on Earthquake Engineering, Vancouver, BC, Canada, 1–6 August 2004. [Google Scholar]
  62. Xenaki, V.; Athanasopoulos, G. Liquefaction resistance of sand–silt mixtures: An experimental investigation of the effect of fines. Soil Dyn. Earthq. Eng. 2003, 23, 1–12. [Google Scholar] [CrossRef]
  63. Yang, J.; Sze, H.Y. Cyclic behaviour and resistance of saturated sand under non-symmetrical loading conditions. Géotechnique 2011, 61, 59–73. [Google Scholar] [CrossRef]
  64. Yoshimi, Y.; Tokimatsu, K.; Hosaka, Y. Evaluation of liquefaction resistance of clean sands based on high-quality undisturbed samples. Soils Found. 1989, 29, 93–104. [Google Scholar] [CrossRef]
  65. Yoshimi, Y.; Tokimatsu, J.; Ohara, A.N. In situ liquefaction resistance of clean sands over a wide density range. Géotechnique 1994, 44, 479–494. [Google Scholar] [CrossRef]
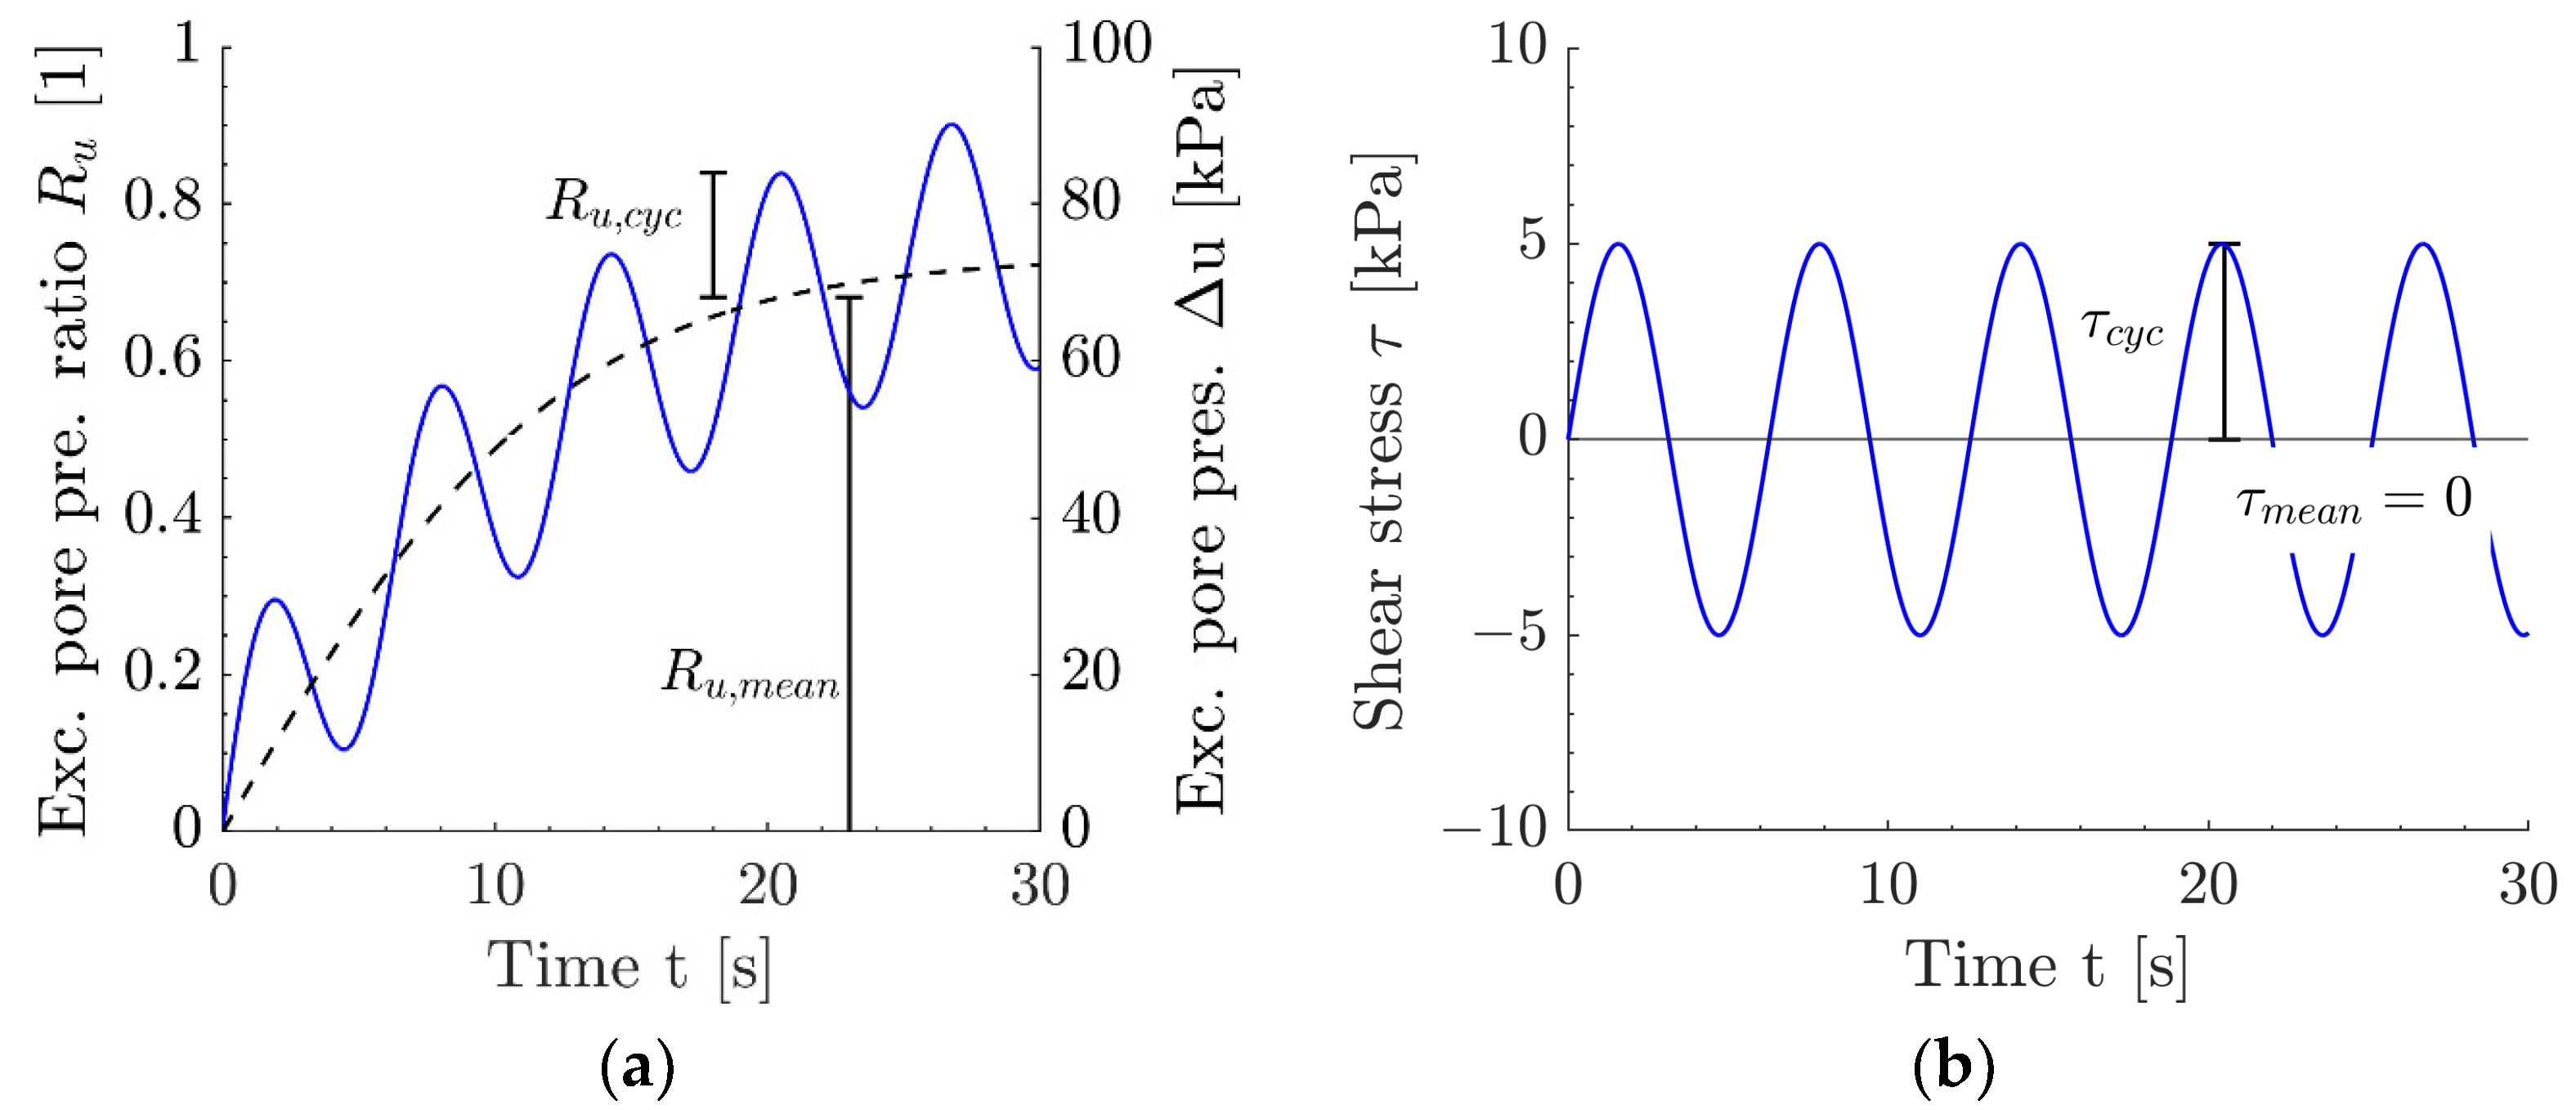
Figure 1. Definitions in cyclic element tests (example with σ 0 = 100 kPa, τ m e a n = 0 and τ c y c = 5 kPa): (a) excess pore pressure over time, (b) shear stress over time.
Geotechnics 04 00029 g001
Figure 2. Explanation of the way to derive contour plots for excess pore pressure ratio from a series of cyclic laboratory tests by regression analysis (following Andersen (2015) [19]): (a) test results, (b) derivation of regression curves.
Geotechnics 04 00029 g002
Figure 3. Grain size distribution (a) and microscopic image of particles (b) of reference soil S30T.
Geotechnics 04 00029 g003
Figure 4. Vertical effective stress against shear stress (a) and excess pore pressure over number of applied cycles (b) for a load-controlled constant-volume cyclic direct simple shear test for a relative density of 85% and a CSR of 0.084 (MSR = 0).
Geotechnics 04 00029 g004
Figure 5. Shear stress over shear strain for the first 500 cycles (a) and shear strain over number of cycles (b) for D r = 0.85, CSR = 0.084 and MSR = 0.
Geotechnics 04 00029 g005
Figure 6. Cyclic response of S30T sand showing excess pore pressure ratio (a,d,g), cyclic shear strain (b,e,h) over number of cycles and the shear stress over the vertical stress (c,f,i) with MSR = 0 (ac), MSR = 0.05 (df) and MSR = 0.10 (gi) for different CSR values and a relative density of 85%.
Geotechnics 04 00029 g006
Figure 7. Excess pore pressure ratio over number of cycles for S30T sand with different relative densities ( D r = 0.40 (a), D r = 0.50 (b) and D r = 0.60 (c)) for MSR = 0.
Geotechnics 04 00029 g007
Figure 8. Contour plots of the reference soil S30T with D r = 0.85 based on Equations (4)–(6) for MSR = 0: (a) Equation (4), (b) Equation (5), (c) Equation (6). Circles show DSS test results.
Geotechnics 04 00029 g008
Figure 9. Regression of fitting parameter over normalized excess pore pressure ratio for parameters a (a) and b (b) of Equation (7) for MSR = 0. Circles show values from distinct test results, blue lines show the fitting functions.
Geotechnics 04 00029 g009
Figure 10. Contour plot of the reference soil S30T with D r = 0.85 based on Equation (7) for MSR = 0. Circles show DSS test results.
Geotechnics 04 00029 g010
Figure 11. Excess pore pressure ratio contour plots of S30T sand at D r = 0.85 for MSR = 0.00 (a), MSR = 0.05 (b), MSR = 0.10 (c) and MSR = 0.15 (d). Circles show DSS test results.
Geotechnics 04 00029 g011
Figure 12. Excess pore pressure ratio R u (from bottom to top: 0.01, 0.05, 0.10, 0.20, 0.50, 0.95) for S30T sand at D r = 0.85 over CSR, MSR and number of cycles N. Blue lines: CSR (N) for constant MSR, red dashed lines: CSR (MSR) for constant N.
Geotechnics 04 00029 g012
Figure 13. Fitting accuracy of excess pore pressure ratio for measured and estimated number of cycles for MSR = 0 (a) and MSR = 0.10 (b) with R2 = 0.49 and R2 = 0.89, respectively.
Geotechnics 04 00029 g013
Figure 14. Normalized liquefaction curves proposed from Andersen (2015) [19] and derived from the tests with D r = 0.85 in comparison with results from literature.
Geotechnics 04 00029 g014
Figure 15. Comparison of number of cycles to liquefaction for different MSR values (a) and CSRNliq=10 over MSR for reference boundary conditions (b) for a relative density of 85%.
Geotechnics 04 00029 g015
Figure 16. Normalized liquefaction curves proposed from Andersen (2015) [19] and derived from the tests with D r = 0.40 (a) and D r = 0.50 and 0.60 (b) in comparison with the literature results.
Geotechnics 04 00029 g016
Figure 17. Cyclic stress ratio for 10 cycles to liquefaction under symmetrical two-way cyclic loading as a function of relative density for S30T sand under DSS conditions with a vertical stress of 100 kPa and for Baskarp sand according to Andersen (2015) [19].
Geotechnics 04 00029 g017
Table 1. Regression parameters for the reference soil S30T at a relative density of 0.85.
MSR
[1]
a 1
[1]
a 2
[1]
b 1
[1]
b 2
[1]
0.000.02050.33280.08040.6601
0.050.02010.78230.05800.3353
0.100.01500.80000.04760.4265
0.150.00500.90000.03780.2744
>0.250.00410.90000.02370.1624
Disclaimer/Publisher’s Note: The statements, opinions and data contained in all publications are solely those of the individual author(s) and contributor(s) and not of MDPI and/or the editor(s). MDPI and/or the editor(s) disclaim responsibility for any injury to people or property resulting from any ideas, methods, instructions or products referred to in the content.