1. Introduction
New buildings generally are a stimulus and symbol for the rebirth of cities hit by major earthquakes. The city of L’Aquila and its territory were hit by an earthquake, with the main shock occurring on 6 April 2009, at 03:32 local time (ML = 5.8; MW = 6.3). The seismic sequence generated extensive damage to the city centre and the villages along the Aterno River Valley: 308 casualties, 1600 people injured, and 40,000 homes destroyed. Many deaths occurred in both vulnerable masonry houses and outdated concrete buildings. However, the collapses can also be attributed to site effects, resonance effects, and earthquake directivity effects.
Detailed reports were also produced by the Geo-Engineering for Extreme Events Reconnaissance (GEER) project on the seismological and geotechnical aspects of the earthquake [
1,
2].
In addition to the reconstruction of civil buildings and the preservation of cultural heritage, new works were also planned. Therefore, the old Belvedere bridge, designed with two spans and a single central pillar, was dismantled to be replaced by a new one.
For new constructions, it is crucial to understand the expected ground motions at the site, which, in turn, generate the structural dynamic response. For the site to be investigated, the local subsurface conditions must be studied, especially for a large and statically and dynamically demanding project [
3,
4]. Moreover, the local conditions are more complicated when there have been superficial modifications (i.e., civil works) by humans over a long period of time. The scientific literature clearly demonstrates that basin effects, topographic effects, and local effects can be responsible for ground motion characteristics and amplifications [
5,
6,
7,
8]. In fact, both the superficial and deep morphology of the study site show important human modifications, such as retaining walls, and areas of landfill and slope reprofiling. In fact, this area is very ancient and located at the point where the city of L’Aquila probably arose, i.e., near the fountains of the “99 Cannelle”, a source of water.
In this study, an evaluation of the one-dimensional (1D) and two-dimensional (2D) seismic responses in the bridge construction section was performed. The foundation section crosses an incision that is part of the erosion-type morphology configured at the highest elevations of the terrace of L’Aquila.
Figure 1a shows the urban layout of the historic city centre and the study area in the western part.
Figure 1b shows the buried morphology and the incision of the study area.
The first part of this paper describes the geological context of the southwestern portion of the city, located on the “L’Aquila Breccias” terrace. Based on all the available information, a geotechnical model was defined to perform numerical site response analyses. On the basis of this, a 1D model was formulated, the vertical of which is positioned in the centre of the section, i.e., at the most depressed point of the incision, and a 2D model was created based on the entire section A–A’. In particular, in order to reduce the computational burden of the 2D analyses, an expedient was used on the seismic input. All results are given in terms of transfer functions for the 1D and 2D simulations and compared with empirical functions [
9,
10], allowing the proposed model to be validated and the site effects on the study area to be studied. Finally, comparisons are presented in terms of synthetic parameters of seismic motion, amplification factors, and elastic response spectra.
2. Geotechnical Investigation and Modelling
This section briefly reports the geological considerations that support the geotechnical model that was adopted for this study. The model is supported by direct investigation and reconstructions based on direct experiences at the study site.
2.1. Geological Setting
The geological structure and the evolutionary context of the L’Aquila Basin have been thoroughly described and studied, especially following the earthquake of 2009.
The study area is characterised by intense extensional tectonics, with predominantly S-tilted normal faults with NWSE or W–E trends. These geodynamics conditioned the evolution of the intramontane basins of the Central Apennines and their infill deposits [
8], such as the Intramountain Plain of L’Aquila (LAIP) [
11,
12], from the upper Pliocene through to the Quaternary.
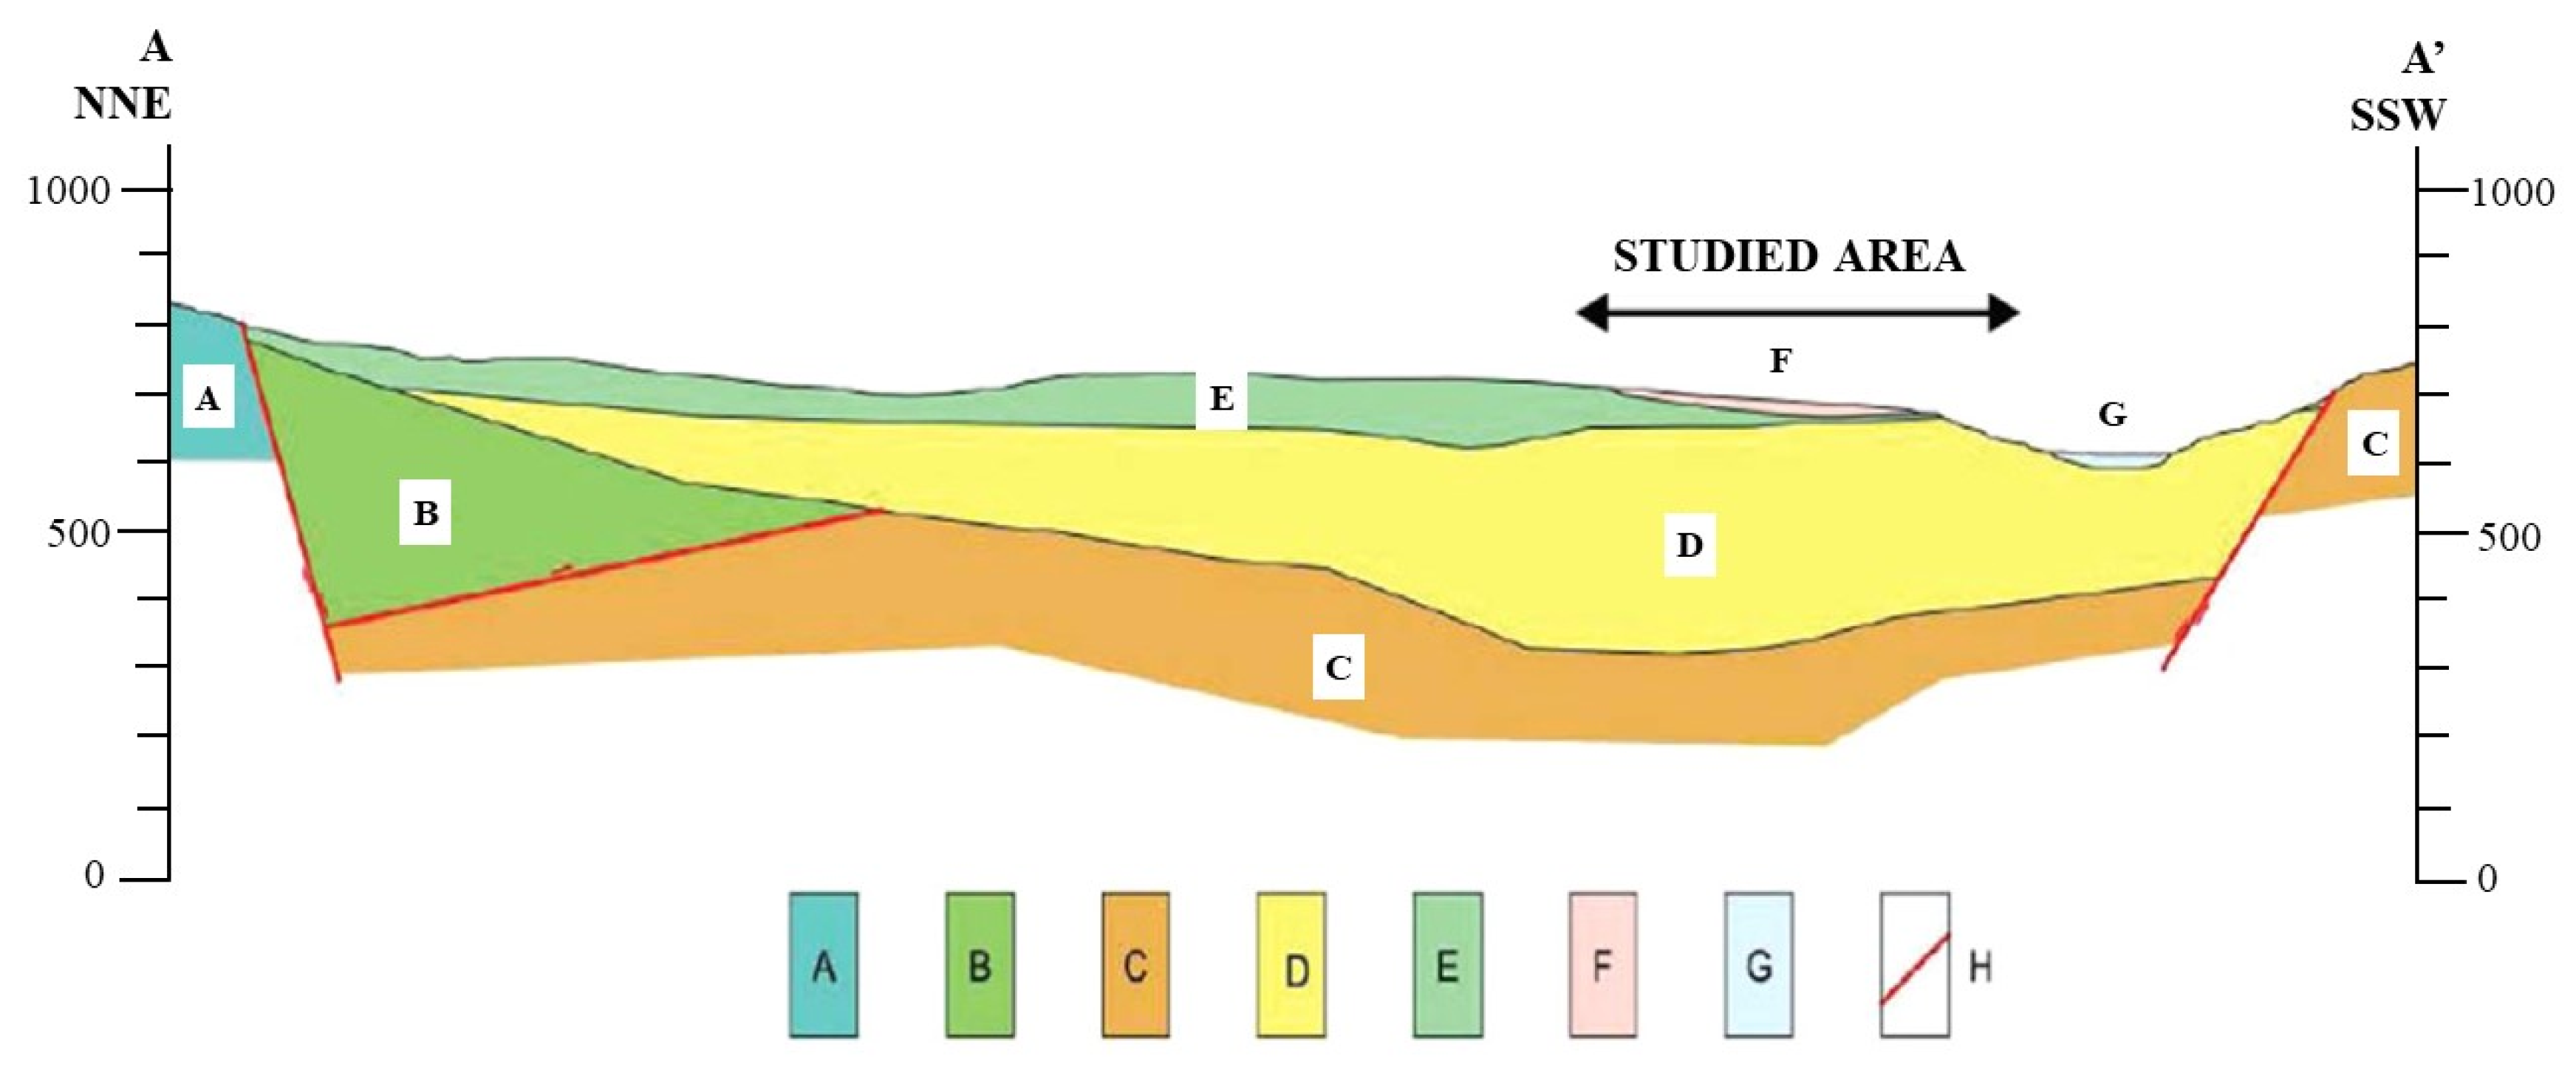
The schematisation of the geological reference model, containing the complex relationship of the intramontane basin units and the buried fault system, is shown in
Figure 2, detailing the section passing through the city and near the study site.
The centre of the city of L’Aquila is located on a terraced relief with an altitude ranging from 670 m a.s.l. to 720 m a.s.l. The superficial morphology was carved out by several minor fluvial incisions, on which, today, the main streets of the city are set.
These incision are normally depressed by 10–20 m, with widths rarely exceeding fifty metres and, in correspondence with their confluence with the alluvial plain of the Aterno River, they give rise to large fans of inactive droppings, evidence of their origin in a different climate regime from the current one.
From top to bottom, the geometric and geological layout can generally be represented as follows: (i) 70–100 m thick calcareous breccias (L’Aquila Breccias: “E” of
Figure 2) and (ii) 250–270 m thick homogeneous continental deposits, mostly lacustrine sediments (“D” of
Figure 2). Recent deep wells bored into L’Aquila Hill evidenced this sequence formed by clayey silt and sand sediments laid upon the carbonate bedrock (“A”, “B”, and “C” of
Figure 2) [
13,
14,
15,
16]. The L’Aquila Breccias are an aggregate of fine-to-coarse limestone fragments of varying sizes (from a few cm to 1 m), in which a sandy or silty carbonate matrix can be found. Moreover, the variable degrees of cementation, linked to the chaotic history of deposit formation and deep-water circulation, produce non-homogeneous mechanical properties. In fact, the formation/sedimentation of the L’Aquila Breccias is attributable to recurrent episodes of rock avalanches and debris flows starting from the Gran Sasso Mountains that enclose the L’Aquila Basin on the north–northwest side. The terrace relief of the city is the extreme part in the entire system with regard to these mega movements. The complexity of this formation is characterised by an interlayer of calcareous or marly silt horizons, with thicknesses of several metres.
The superficial portion of the L’Aquila Breccias and, especially, the incisions carved in its morphology, are sometimes occupied by a fine-grained reddish deposit fill (“F” in
Figure 2). This formation has a typical red colour, is derived from the karst dissolution of the L’Aquila Breccias, and has a maximum thickness of 20 m.
2.2. Site Investigations and Geotechnical Model
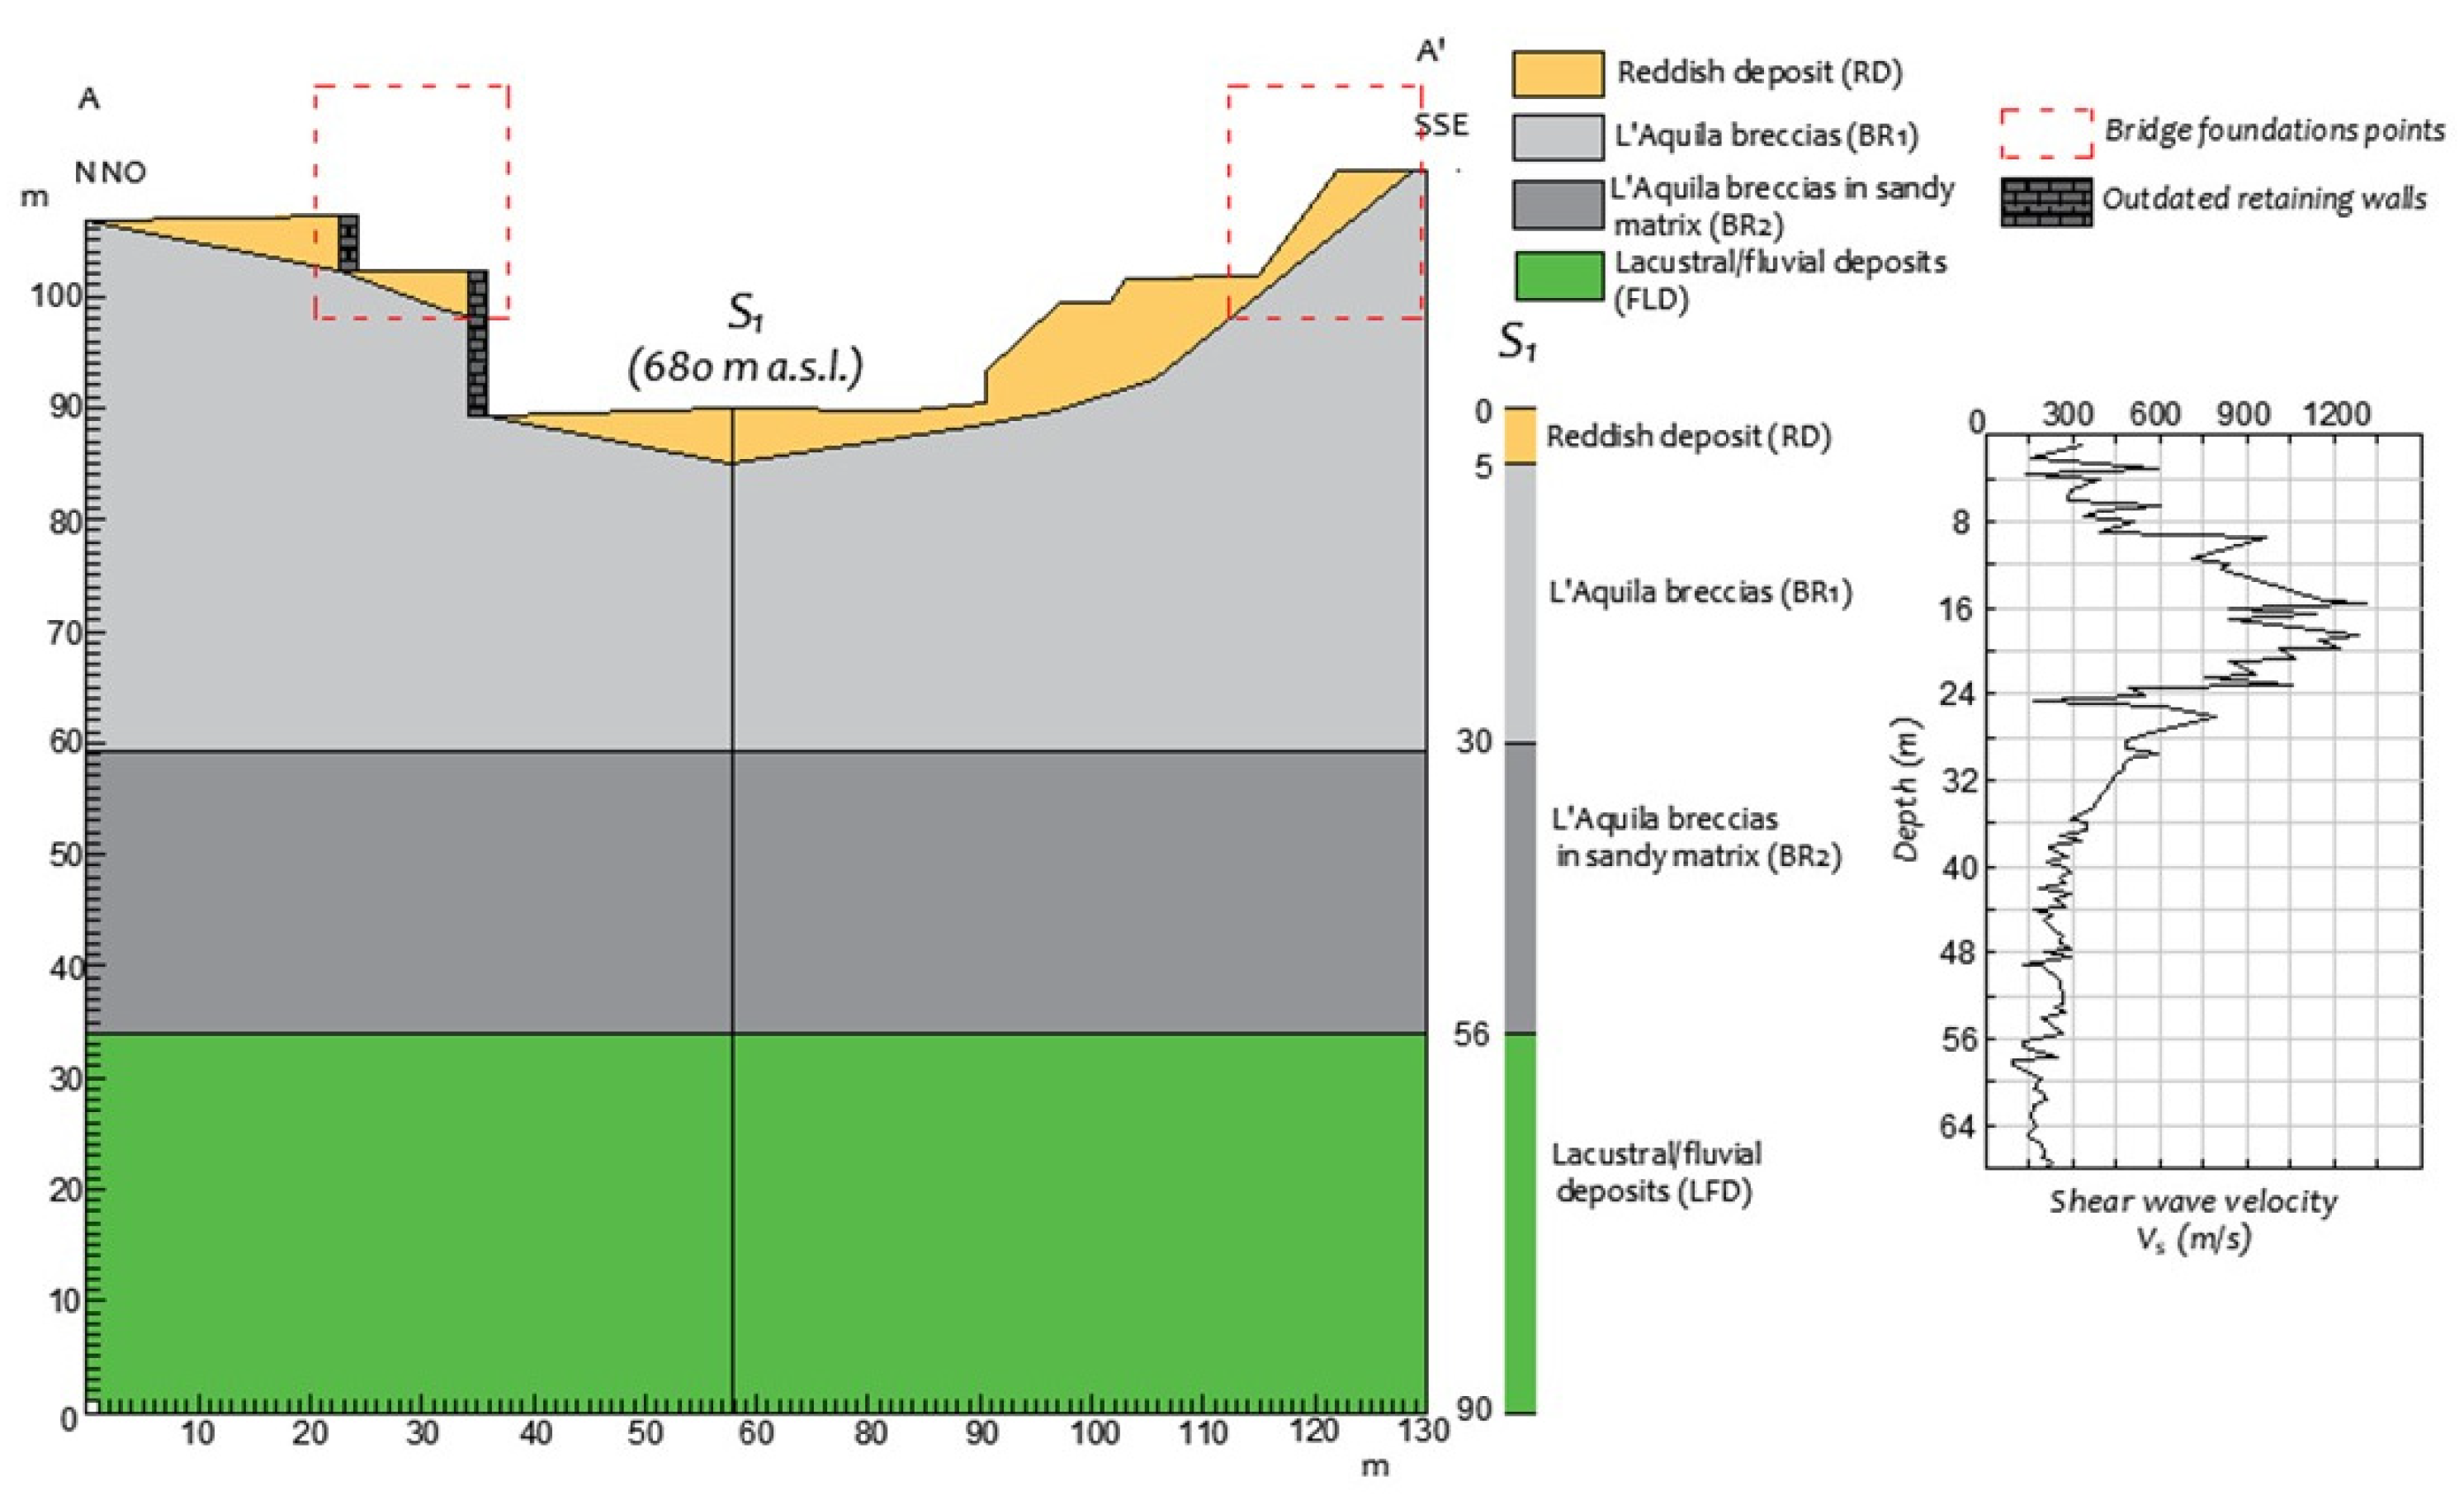
The studied section is located in the southwest part of L’Aquila city centre, within the ancient medieval walls. It is located in an incision of the L’Aquila Breccias, of which a fine-scale geometric and geotechnical subsurface model was developed through deep boreholes (S1 = 90 m) and deep shear wave measurements (66 m) from a seismic dilatometer (SDMT), as shown in
Figure 3 that were carried out as part of the investigation of the city centre subsoil [
17]. The procedure for obtaining measurements of the shear wave velocity (V
S) via SDMT in backfilled boreholes in non-penetrable soils was used [
18].
Based on the geometric reconstruction and all the available information, a subsoil model for numerical seismic response analyses was developed. The area is characterised by an inversion of V
S. with depth at the transition from the L’Aquila Breccias to the lacustrine deposit. This model is similar to other subsoil models proposed for a different site in the city centre that involved analyses and evaluation from the top of L’Aquila Hill [
13,
14,
15,
16]. It should be noted that, for the specific case under investigation, the first important inversion of V
S can be seen within the L’Aquila Breccias, at a depth of 30 m.
It should be noted that there is variability in the soil profile beyond the depth of 30 m and a need for special care throughout the seismic site investigation process. In these particular formations, where the variability in the mechanical and seismic properties is important, the selection of in situ testing techniques to control the test procedure and the interpretation of the test results are crucial.
For the study area, the simplified scheme of the subsurface model is composed, from top to bottom, of the following stratifications: (i) reddish deposits (RDs) about 5 m thick and with a VS of 300 m/s; (ii) the L’Aquila Breccias (BR1), about 25 m thick and with a VS of 600–1000 m/s; (iii) the L’Aquila Breccias in a sandy matrix (BR2), about 25 m thick and with a VS of 280 m/s; (iv) lacustral/fluvial deposits (LFDs) about 200 m thick and with a VS of 400–600–800 m/s; and (iv) carbonate substratum (BC), considered to have a VS of 1200 m/s in the simulation of the seismic bedrock. The depth of the bedrock is about 250 m.
The model considers the surface morphology of the section that has been profoundly altered by man-made constructions over time. In fact, the bottom support of the old bridge towards the NNO was realised through the construction of two retaining walls, one of which was large, while the one, towards the SSE, was realised through the regularisation of the topographical profile (see
Figure 3). The retaining walls were modelled with elastic behaviours and a V
S of 1500 m/s. The retaining walls, given their size and perpendicular position relative to the section, were understood as slabs in the surface portion and modelled in the mesh as alternating columns of elements with different stiffnesses.
Table 1 shows the soil parameters for the geotechnical units (GUs) used for the 1D and 2D numerical analyses. The parameter list includes the unit weight g, shear wave velocity V
S, the Poisson coefficient
c, and references to the stiffness decay G/G0 and damping ratio D curves.
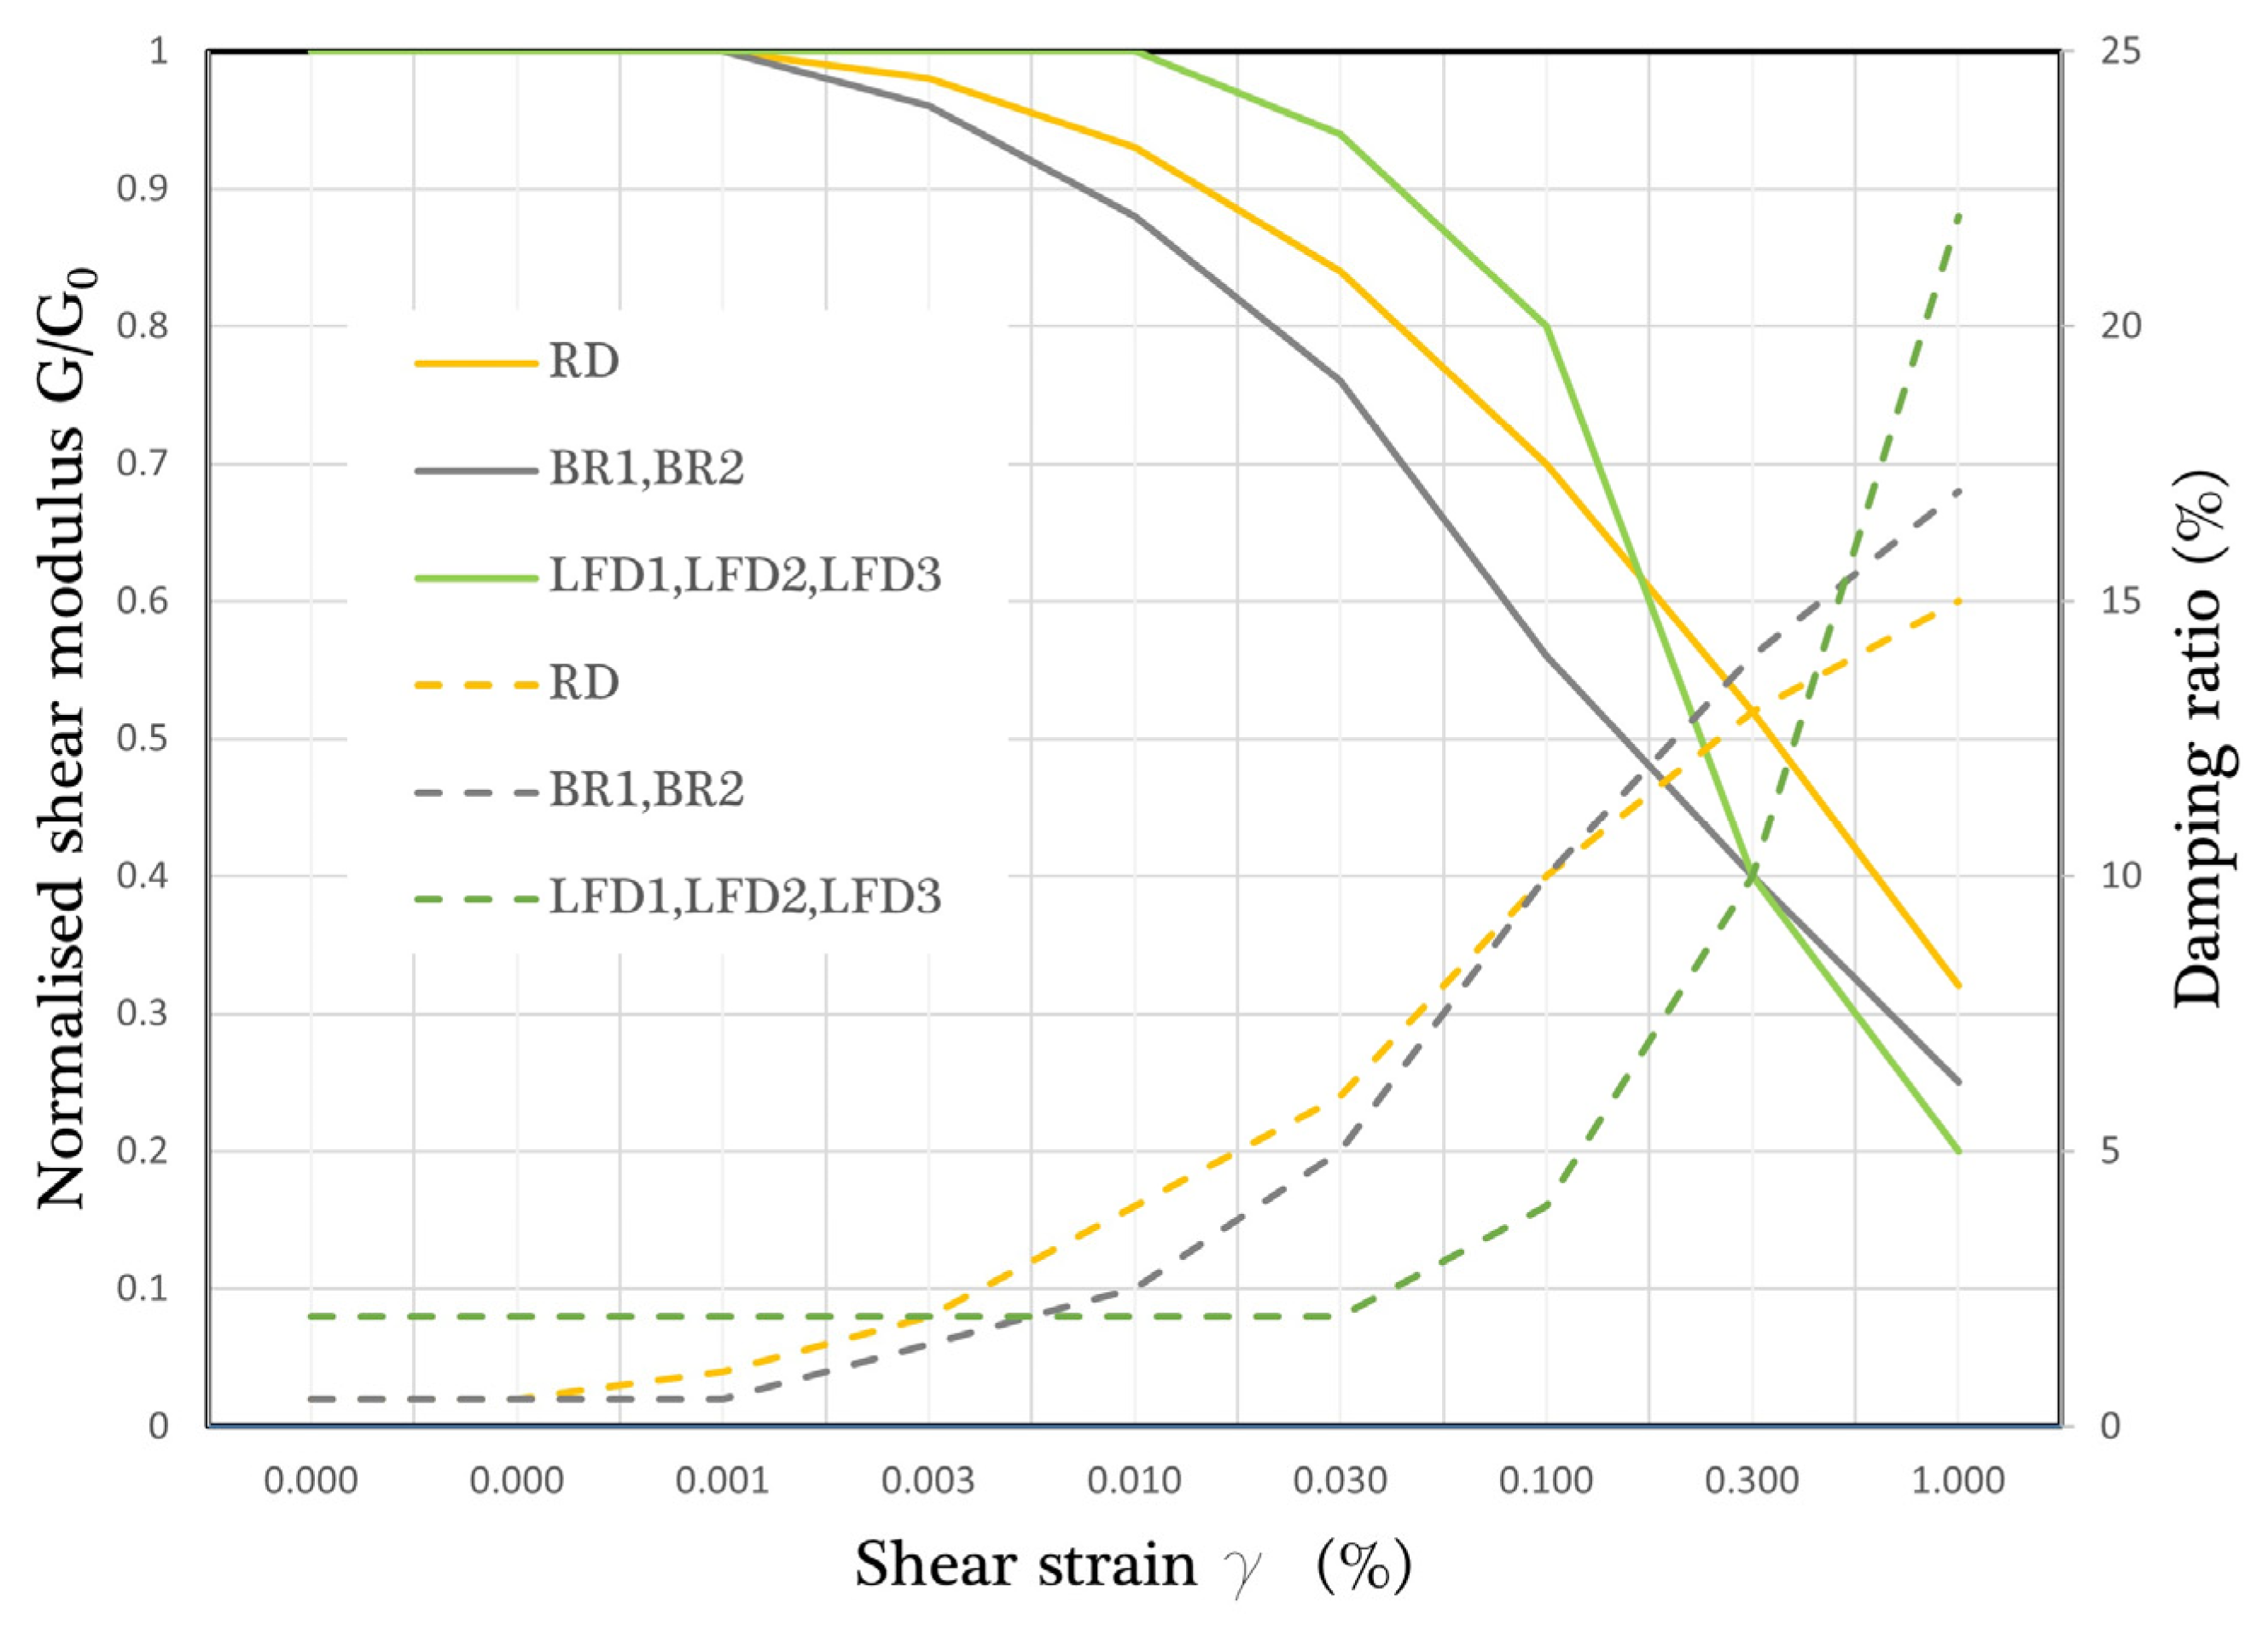
Figure 4 shows the curves of normalised shear modulus G/G0 and damping ratio D versus shear strain c, with reference to (i) the resonant column/torsional shear test results obtained at the SDMT-VDB site in [
19] into the RD of the southern part of the city of L’Aquila (the sample was taken at a depth of 3.50–4.00 m); (ii) the gravel reference curve used during the seismic microzonation studies [
11] evaluated in [
20] for the two L’Aquila Breccia units (BR
1 and BR
2); and (iii) the resonant column/torsional shear test performed for the C.A.S.E. Project [
21] (the sample was taken at a depth of 50 m into fluvio-lacustrine deposits in the peripheral basin of Roio Piano, L’Aquila) for LFD units.
In addition, the bedrock BC was modelled with an elastic behaviour and an initial critical damping ratio D0 equal to 0.5%.
3. 1D and 2D Conceptual Modelling
The geotechnical and geophysical data were used to perform a subsoil model for 1D and 2D analyses. As described below, the input for the 1D model is a set of seven natural accelerograms selected via spectral compatibility (I1D).
The 1D analyses were used to (i) calculate the transfer function (TF) and compare it to that of the empirical data and (ii) extract seismic motions at the base of the L’Aquila Breccias (
O*1D), i.e., on the roof of the LFD, and use them as input motions for the 2D analyses (
I*2D). Solution (ii) was adopted to reduce the 2D section domain and reduce both the time and the computational burden. In order to validate this proposed conceptual modelling, the 1D and 2D transfer functions (
TF1D and
TF2D) to the ground surface at the chosen control points were compared. In particular, the comparison was performed with reference to the fundamental frequency of the entire deposit up to the BC. This frequency was deduced from the empirical data derived from the studied area and was estimated to be between 0.7 and 1.0 Hz [
8,
9]. Therefore, the seismic motions derived from the 1D modelling and extracted at the contact between LFD
1 and BR
2, when used as baseline inputs to the 2D model, retained their low-frequency content (0.7–1.0 Hz). The input at the base of the 2D domain was applied within the modelled LFD layer with elastic behaviours.
Figure 5 shows a schematisation of what has just been described.
By using the computer codes STRATA [
22] and QUAD4M [
23], numerical analyses of seismic site responses were carried out. Each code is based on 1D and 2D linear equivalent models. STRATA makes an iteration of the 1D analysis in order to follow the variation in normalised shear modulus G/G0 and damping ratio D values with the shear strain. It assumes one-dimensional soil deposit conditions, such as the simplification of horizontal soil layers of infinite extent in the lateral sense. QUAD4M is a dynamic, equivalent, linear, two-dimensional computer program. A finite element procedure. In the numerical code, the geometry of the model is improved via a mesh of a finite number of elements with triangular and/or quadrilateral shapes that are interconnected at their common nodes. The QUAD4M code solves the elasto-dynamic computation of volume wave transfer using a step-by-step integration of the accelerogram in the time domain. The seismic waves are minimised, induced by artificial reflection, at the domain boundaries. The underlying half-space can be modelled as elastic to represent the response of an infinite field condition.
The 1D seismic response analyses were conducted with reference to the diagram in
Figure 5, and the inputs (
I1D) were filtered at a maximum frequency of 25 Hz. Output motions (
O*1D) were filtered at a maximum frequency of 10 Hz and used as inputs for the 2D model (
I*2D).
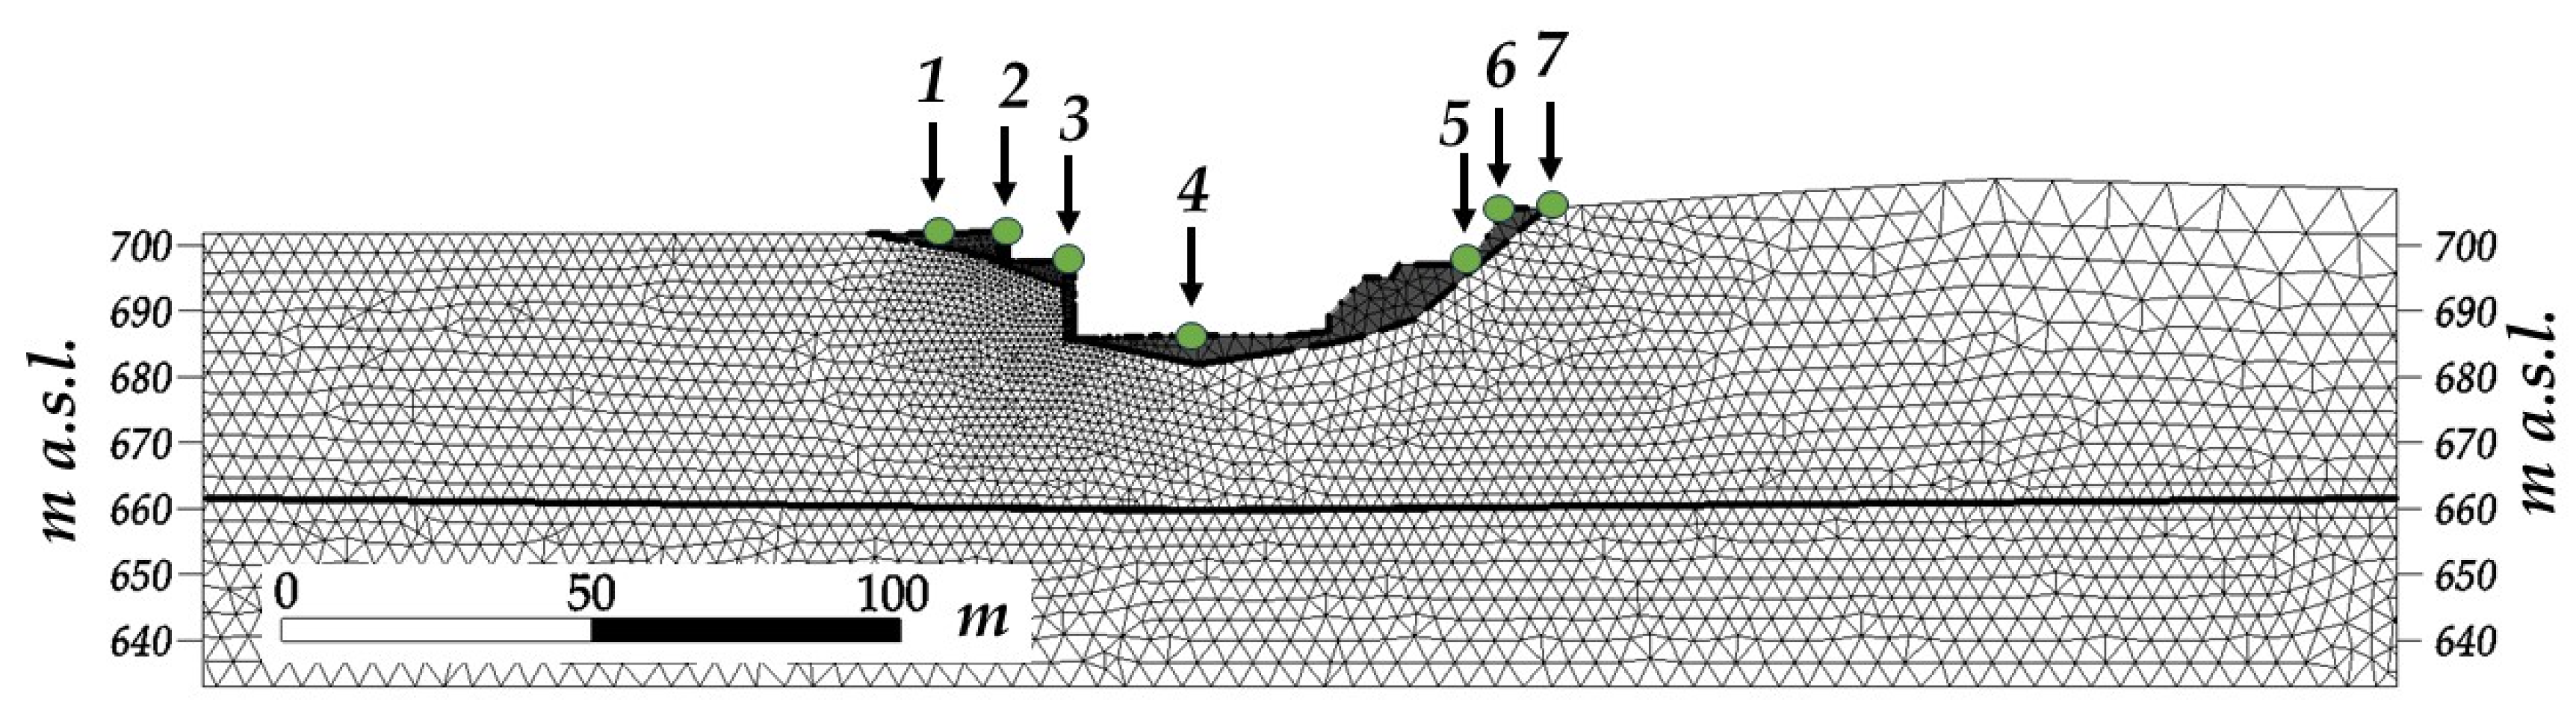
Figure 6 shows the mesh with control points for the results for the 2D ground response analyses of cross-section A–A’.
As explained above, the lateral boundaries were modelled to be perfectly reflective. For numerical reasons, the mesh was extended 400 m in two directions, to minimise the influence of reflected waves. The domain was meshed by means of triangular elements. The size was established based on the vs. of each GU, to perform accurate wave propagation up to a maximum frequency of 10 Hz. The code automatically selects two control frequencies following a full Rayleigh damping formulation based on viscous damping. In QUAD4M computation, to reduce the computational time, the maximum element size,
Lmax, was estimated via the relationship:
Lmax represents the wavelength obtained using the ratio between the lowest value of vs. in the model and the frequency of 10 Hz. This is a good ‘‘compromise’’ between the computational cost and the frequency range of interest for engineering. The model results are given in a geometrical cross-section that is 100 m in length and 70 m thick, with 9280 triangular elements and 4850 nodes.
The output nodes to check the results were chosen at the lateral support areas of the bridge, 1, 2, 3, 5, 6, and 7. At the centre of the section, node 4 is the position for the deep borehole and 1D modelling.
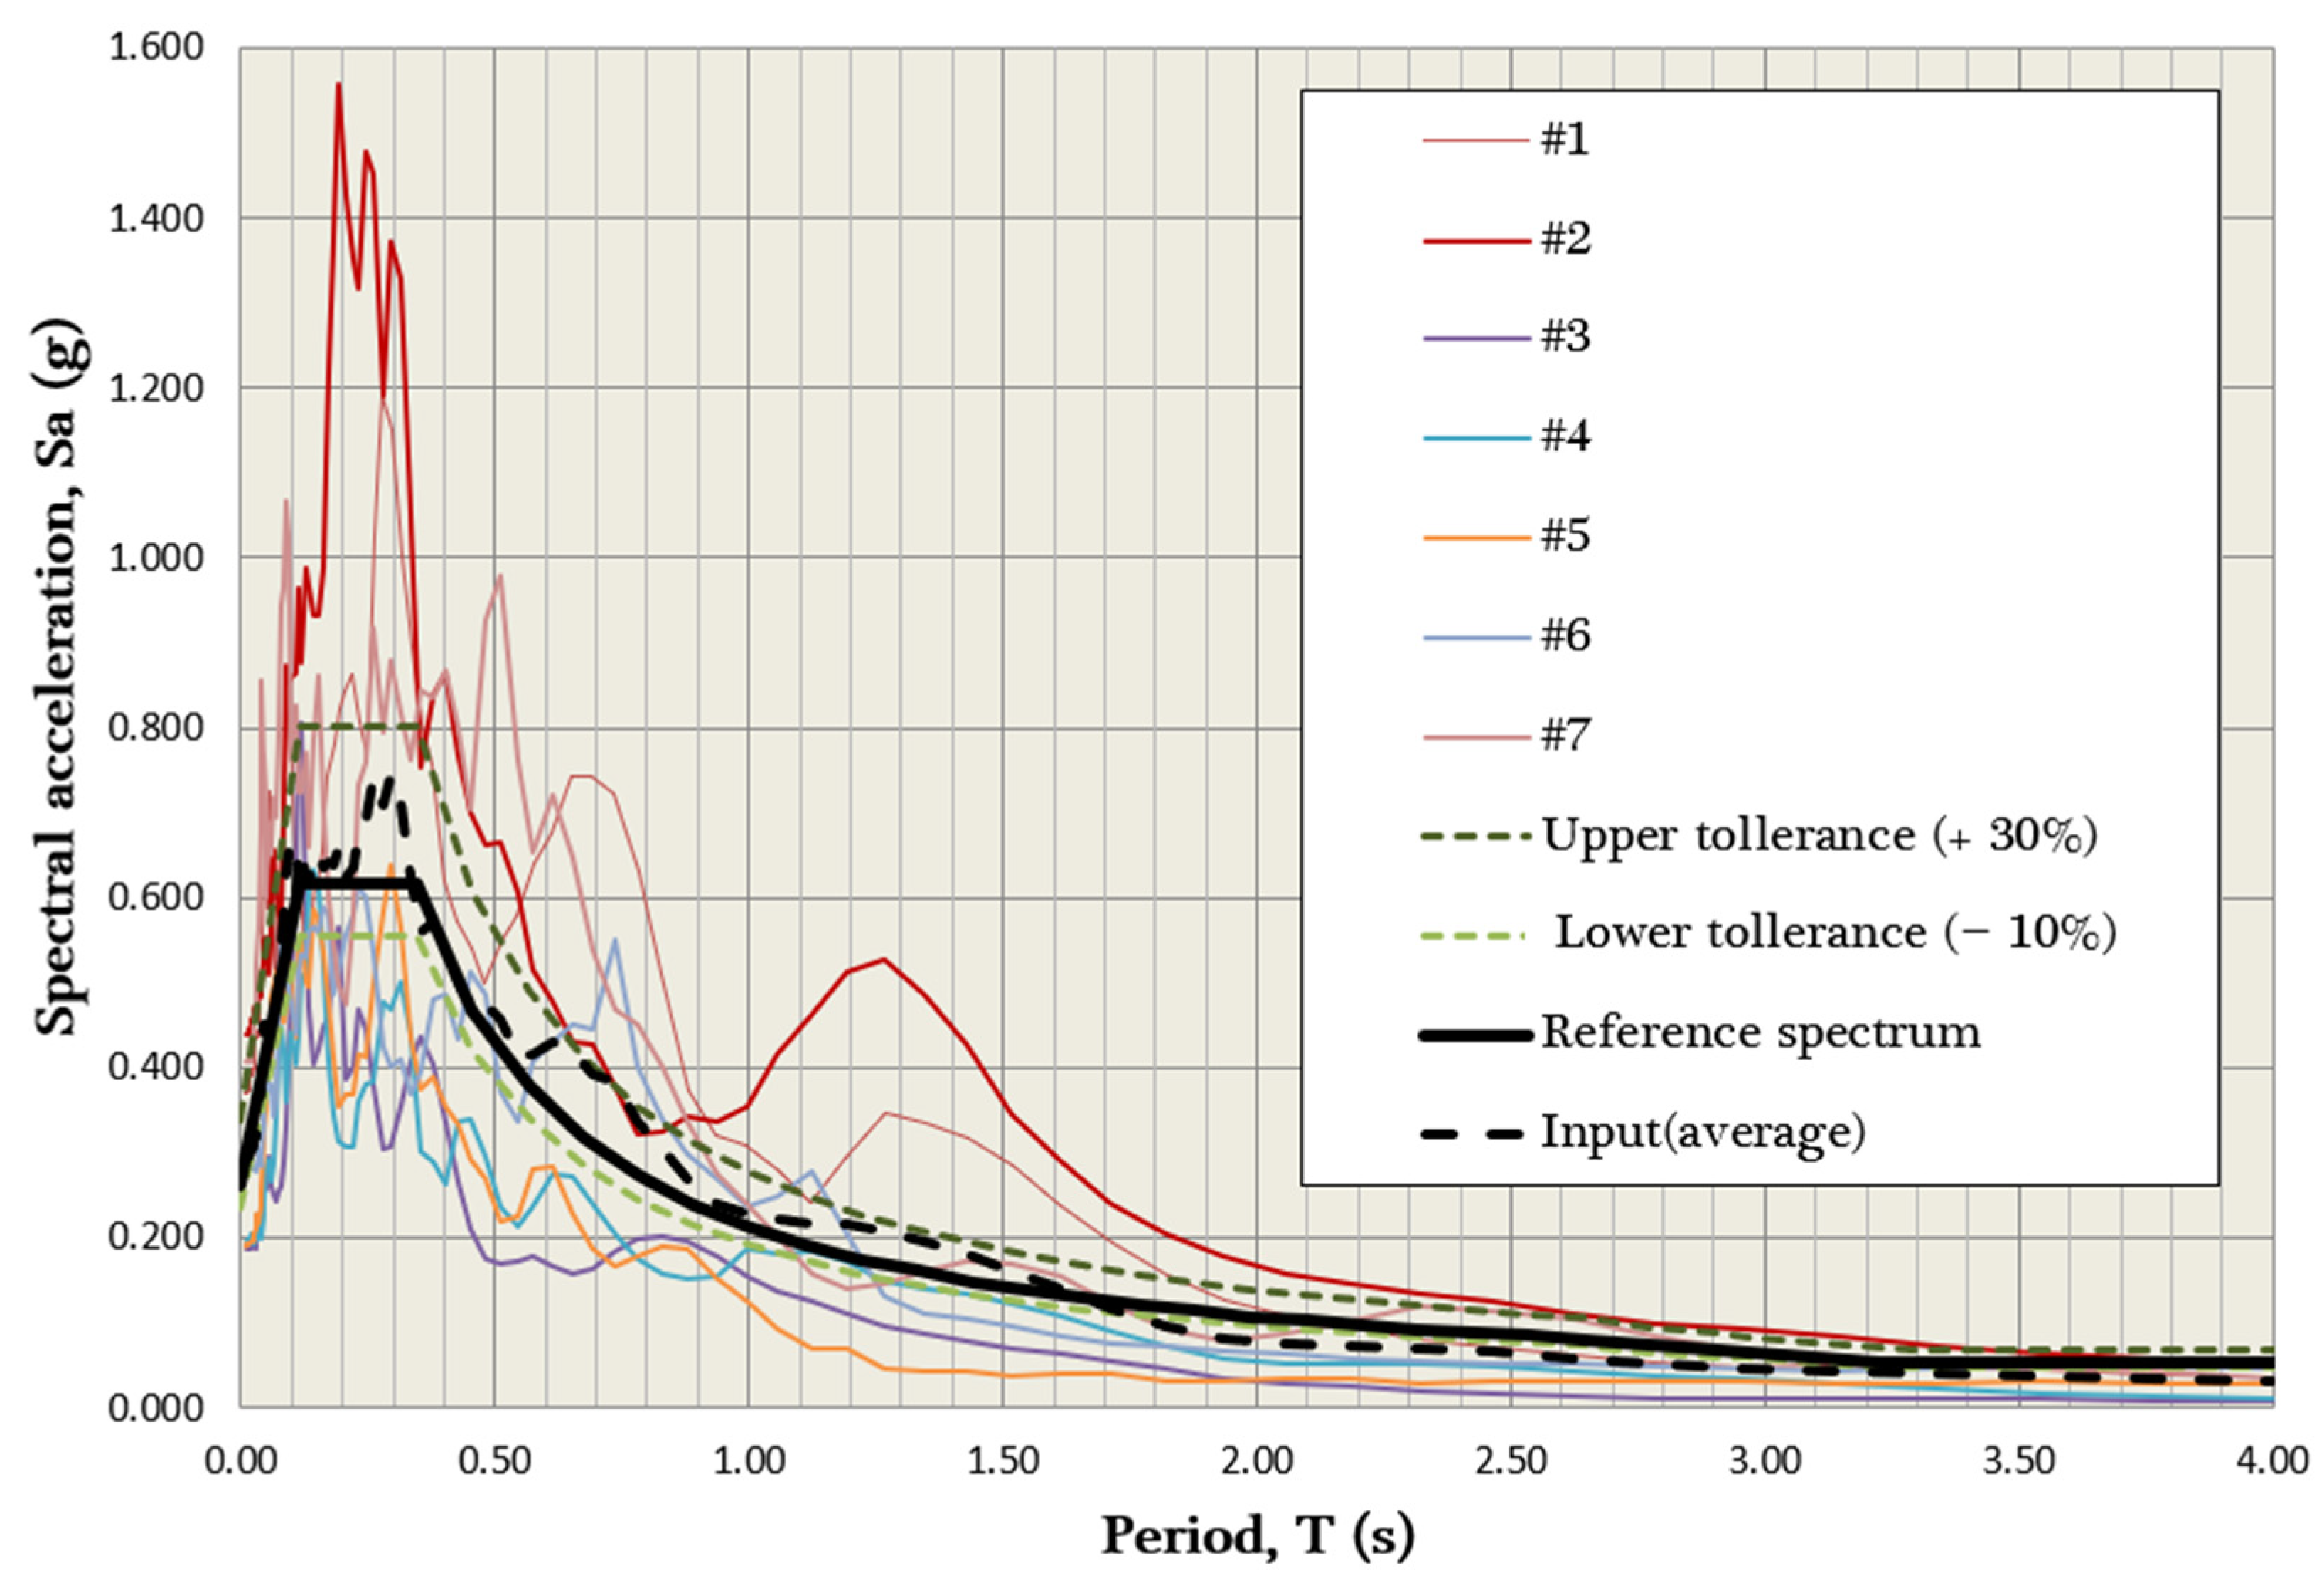
4. Input Motions
The selection of natural accelerograms, i.e., effectively recorded accelerograms, is generally highly recommended and should include a site-specific input motion. For the study site, the input motions consist of seven unscaled horizontal natural records selected from the ITACA archive [
24]. The average of the selected spectra respects the compatibility with the Uniform Hazard Spectrum (characterised by a return period T
R = 475 years) at rock conditions referred to as subsoil class A, in the 0.1–1.5 s period range for the city of L’Aquila (Lat. 42.1256317, Lon. 13.6362715), as proposed by the Italian Building Code (IBC) [
24].
Table 2 lists the accelerograms used as input motions, and each record is described using the following information: location of events, date, moment magnitude, earthquake epicentre distance, recording station identified by name and code, corresponding subsoil classification according to [
25], and the horizontal component selected.
Figure 7 shows the corresponding 5% damped response spectra with a comparison between the average input spectrum and the reference shape of IBC [
25]. The tolerances chosen for the average spectrum were +30% for the upper one and −10% for the lower one, with respect to the reference spectrum.
5. Results
The first comparison in
Figure 8 shows the average TF, computed via considering 1D and 2D linear equivalent approaches, using the accelerograms as input motions, as described in
Section 3 and shown in
Figure 5. The 1D and 2D transfer functions, in reference to point control number 7 (where the deep borehole is located, as shown in
Figure 6), are similar. In particular, a low-frequency resonance of the basin was identified via both the 1D and 2D analyses and is in good agreement with the deep rock fundamental frequency of 0.7–1.0 Hz. The “trick” described in
Figure 5 ensures that low frequencies are retained during 2D modelling, and this supports its reliability.
On the contrary, 2D modelling produced different results, as expected, from the 1D results that overestimated the amplification at a secondary natural frequency between 4 and 6 Hz. In fact, the one-dimensional soil deposit conditions, and the simplification of horizontal soil layers in the lateral sense, produce amplifications at the highest frequencies.
However, this is an effect of the degree of G and the increase in D due to non-linearity reached in the simulation in the RD and BR2. In addition, the 2D effects due to the presence of the entire valley concentrated all the energy at the fundamental frequency of 0.7–0.1 Hz (linked to the contrast with the deeper basin).
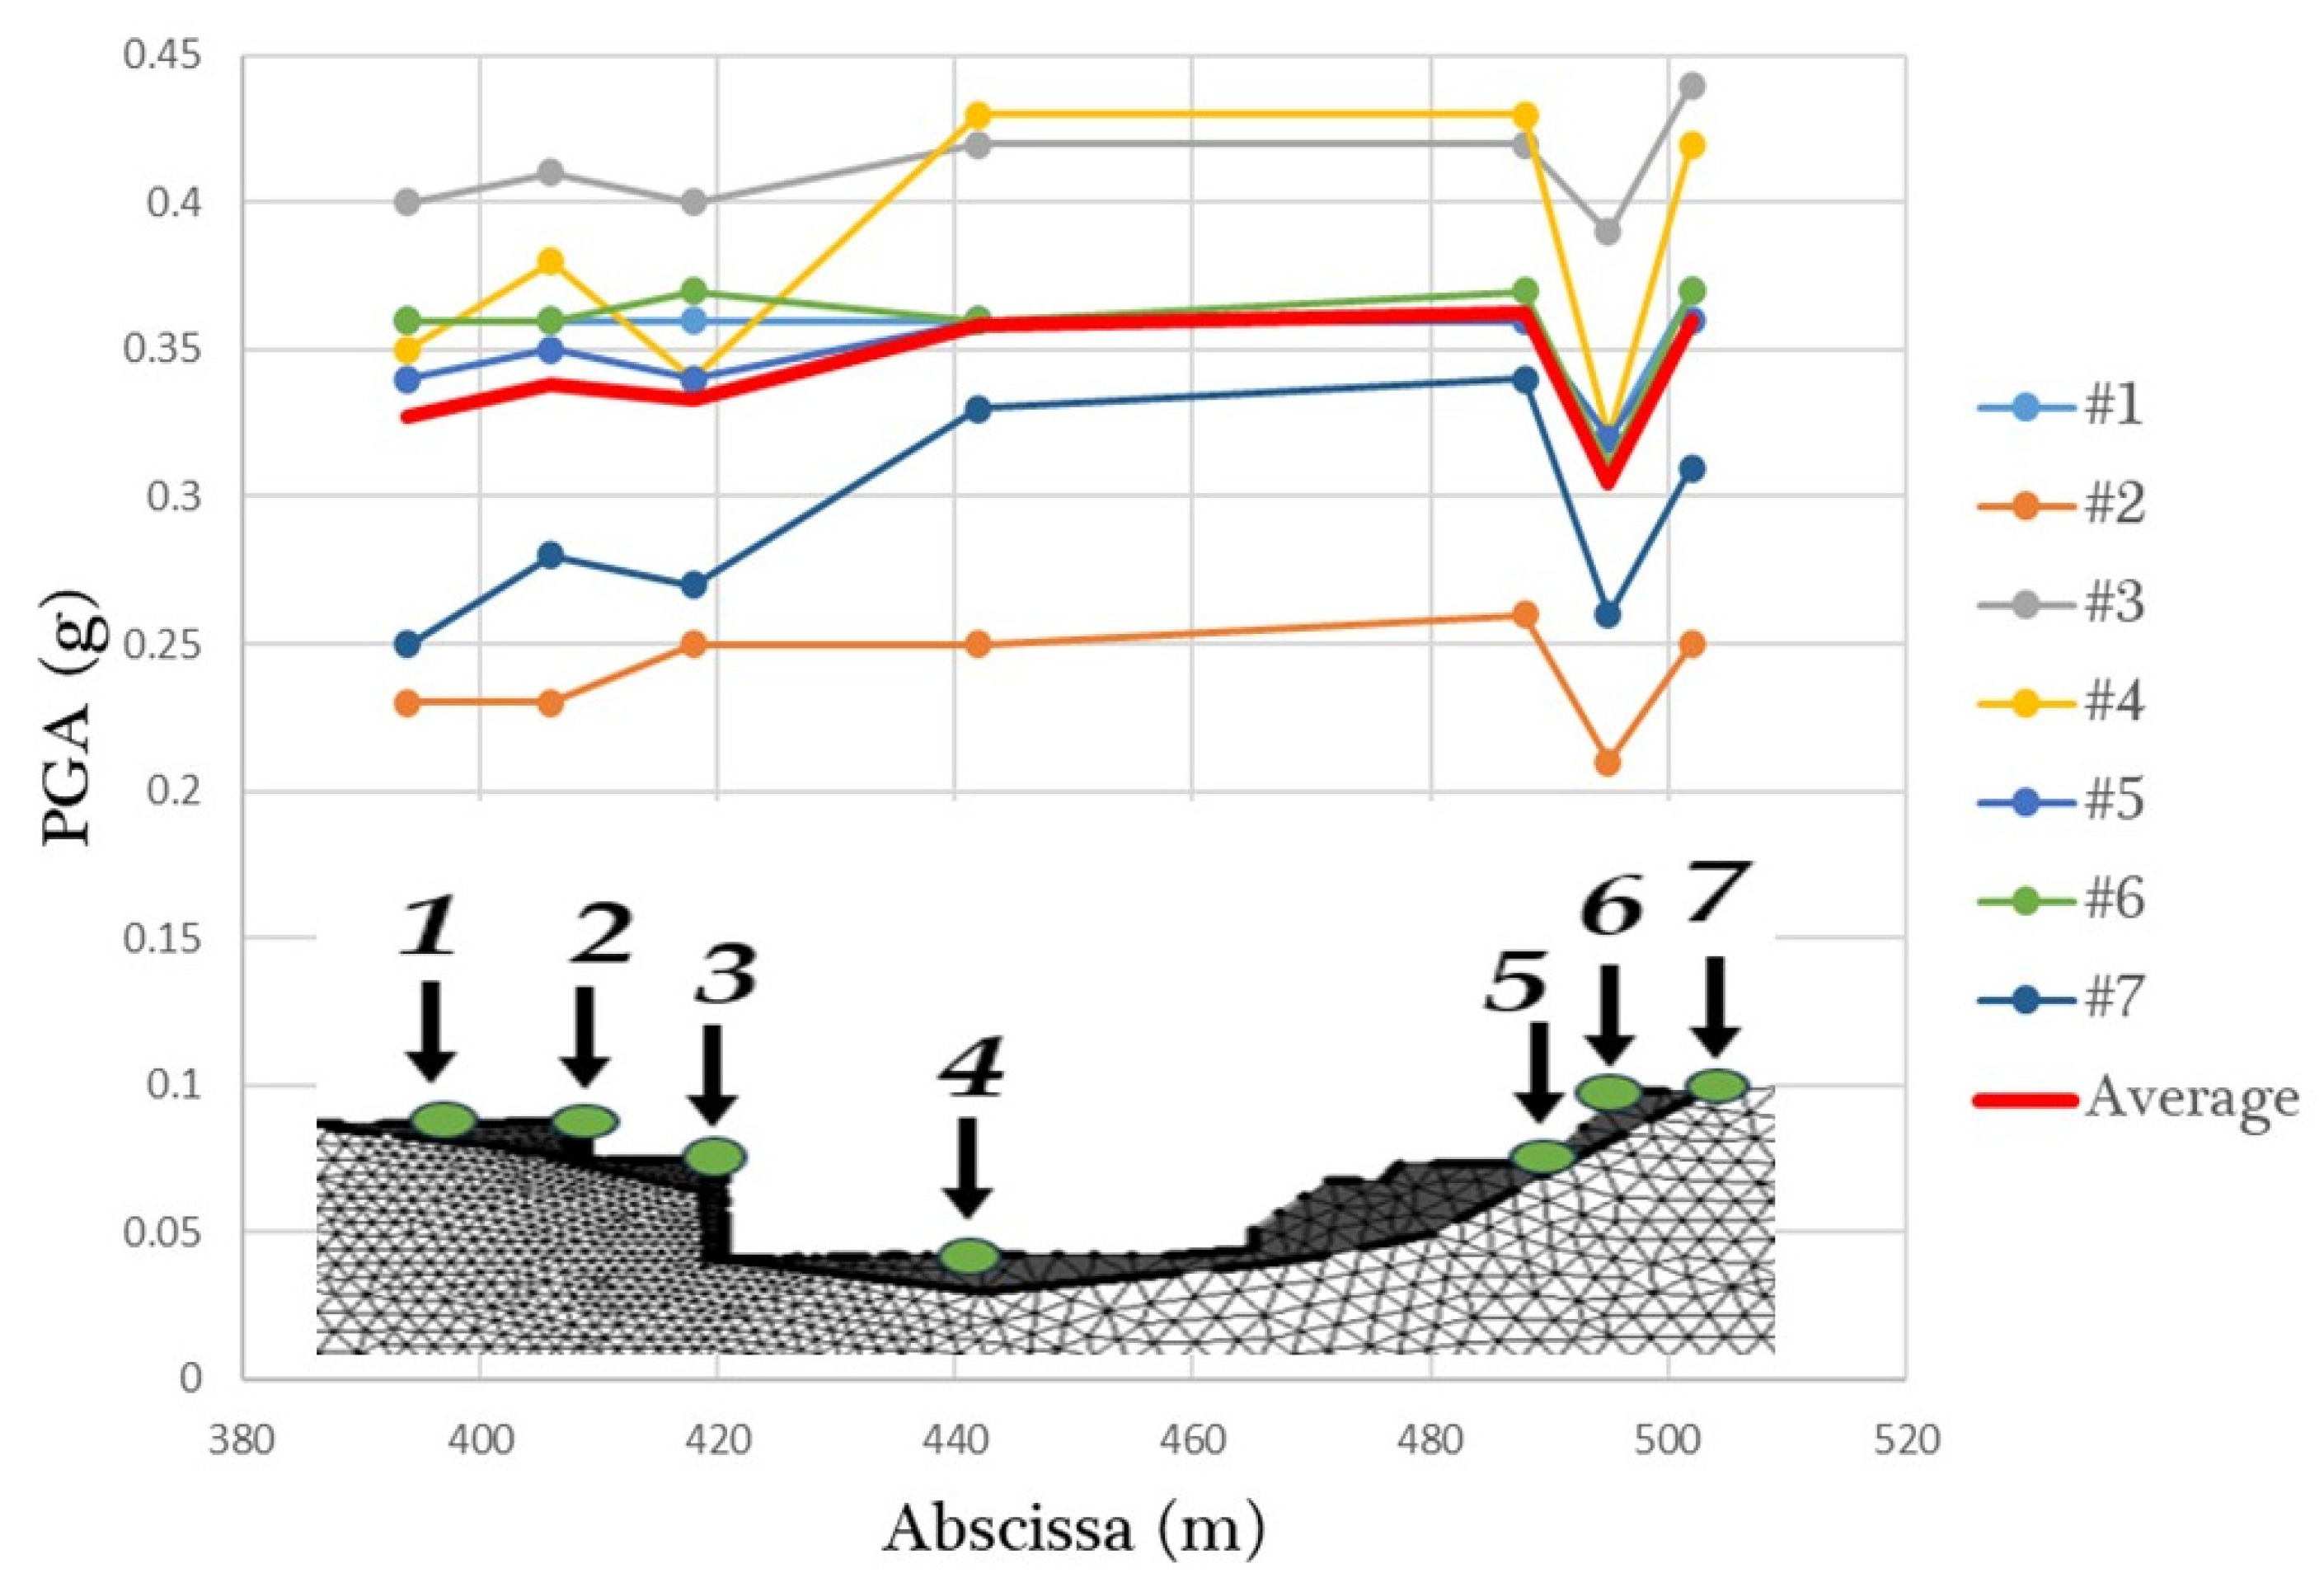
A popular way of presenting the results of the synthetic parameters of seismic motion is as PGA profiles. This paper discusses the elastic acceleration response spectrum (Se) for each control point and amplification factors (AFs) for the spectral acceleration profiles. The AFs are defined as the ratio between the average elastic response spectra at the ground surface and the corresponding input motion response spectra integrated over three period ranges, 0.1–0.5 s, 0.4–0.8 s, 0.7–1.1 s, and 1–1.4, labelled as AF
0.1–0.5, AF
0.4–0.8, AF
0.7–1.1, and AF
1.0–1.5, respectively (
Figure 9,
Figure 10 and
Figure 11).
6. Discussion and Conclusions
The numerous geological, geotechnical, and geophysical studies carried out in the centre of L’Aquila have made it possible to reconstruct a reference subsurface model for the 1D and 2D seismic response analyses of the new Belvedere Bridge site. The site response analysis presented in this study, characterised by complex geotechnical conditions, made it possible to highlight some considerations that could be applied to a valley configurated in an urban context and modified by human actions.
The 1D analyses were used to extract seismic motions at the base of the L’Aquila Breccias, which were used as input motions for the 2D analyses. This solution was adopted to reduce the 2D section domain and reduce both the time and computational burden. The good agreement between the TFs denotes the validity of the conceptual expedient of this method.
The site was suitable for accurate seismic 2D modelling that reproduced the site response more realistically than the 1D model, confirming the presence of valley effects in L’Aquila.
The PGA profiles were highly dependent on the seismic input and depended mainly on the depth of the RD cover overlying the BR formation. Furthermore, the PGA values are in good agreement with the values measured via the accelerometer stations located in the historic centre of L’Aquila during the mainshock on 6 April 2009. However, the use of only one synthetic parameter of seismic motion, the PGA, does not tell us much about the role of energy. A particular meaning, also directly linked to the vulnerability of the different structural typologies, is expressed by the amplification factors.
The peak effects of the amplification factors occur in the range of 0.7–1.1 s and 1.0–1.5 s. Moreover, the scattering of the different AFs confirms the expected dependence on the frequency and amplitude of the input motions and the filtering effect of the soil. Independent of the period range, the highest AFs occurred (i) on the NNO side (i.e., control points N1, N2, and N3) of the section, with mean peak values of AF0.7–1.1 s = 1.65 and AF1–1.4 s = 1.98; and (ii) on the SSE side (i.e., control points N5, N6, and N7), with lower values (AF0.7–1.1 s = 1.55 and AF1.0–1.4 s = 1.9).
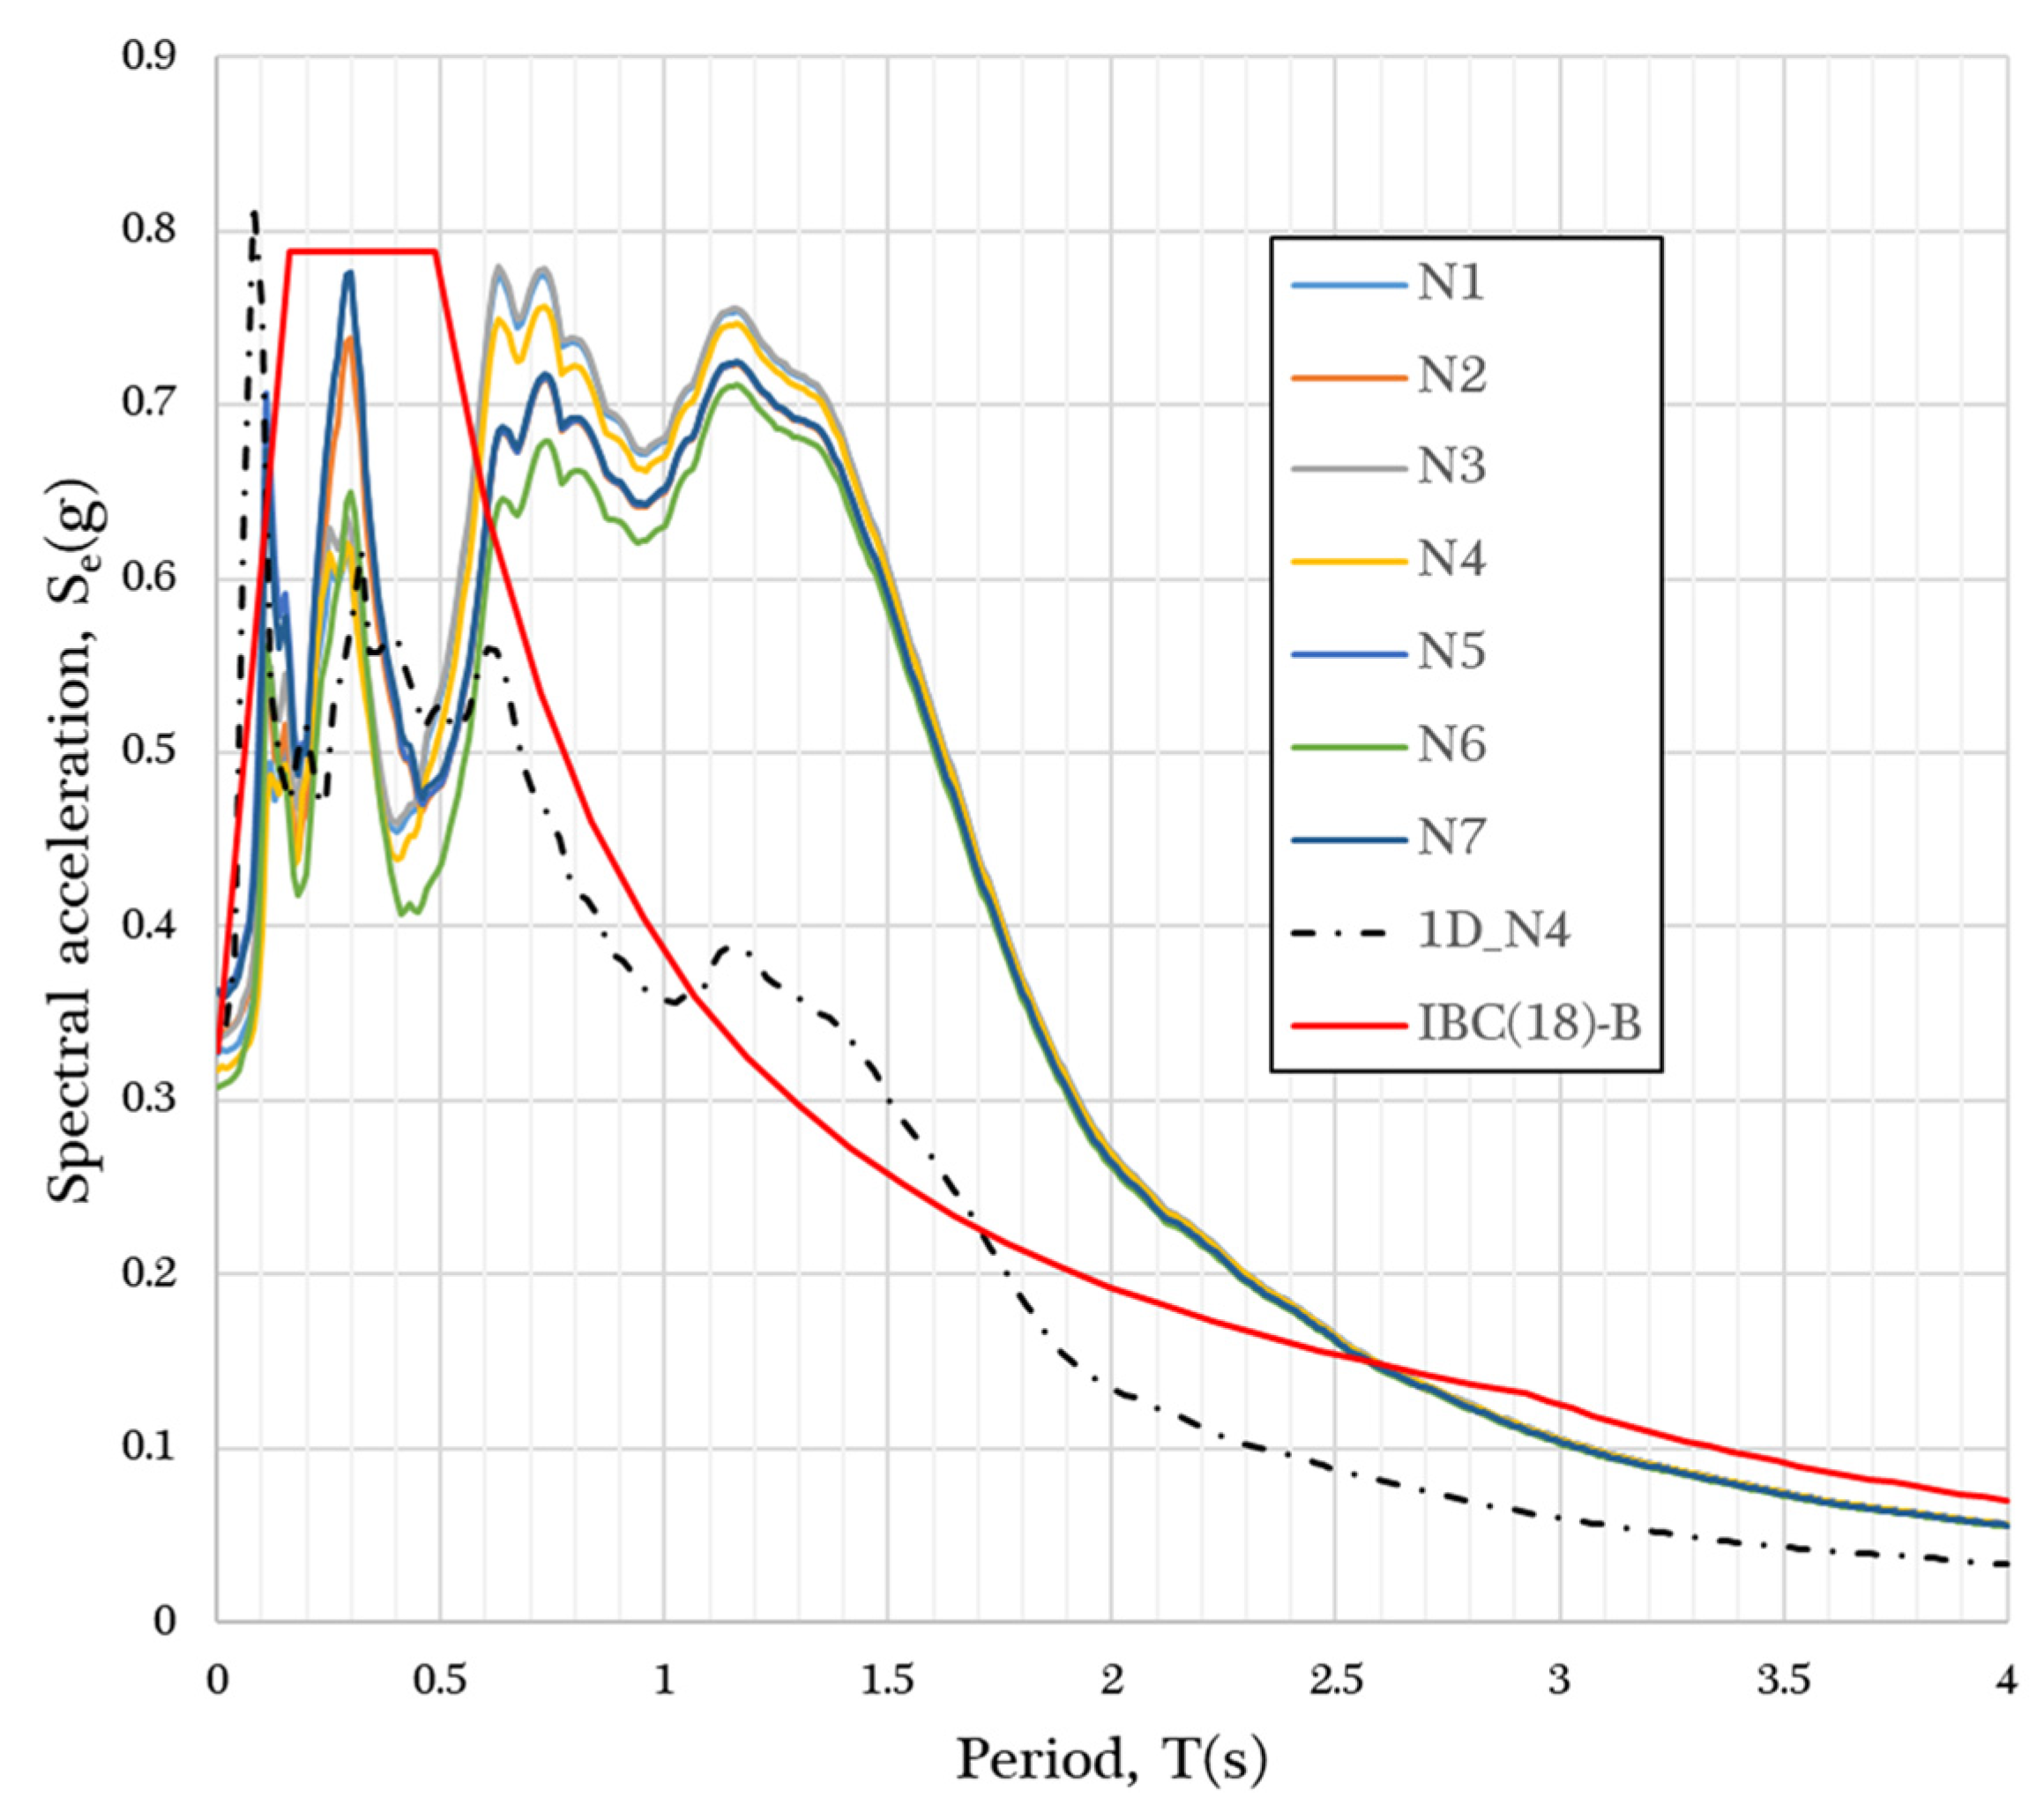
The Ses obtained from the different control points suggest the following conclusions: (i) the 1D modelling still gives a lower amplification over the range of time from 0.7 to 2 s, and this may be justified by the geometry of the section and by basin effects; and (ii) the role of local subsoil conditions produces changes in the shapes of the spectra when switching from one control point to another. The variability in the elastic response spectra obtained from the numerical modelling highlights the fact that the geometry of the problem is a crucial aspect of these numerical analyses. In addition, the importance of including reliable data and considering non-linear soil behaviours in numerical analyses was emphasised.
Figure 11 shows the comparison between the 2D output spectra and the response spectra of the Italian seismic building code 2018 for subsoil category B (IBC(18)-B in
Figure 11). The IBC(18)-B spectra, resulting from a simplified procedure, are not sufficiently conservative, especially for the time range of 0.7–1 s. Only the 2D analyses revealed the real amplifications connected to those of the resonance of the entire valley. These observations are crucial in making decisions about the structural typology and placement and foundation system.
These observations are crucial for making decisions about the structural typology and the placement and foundation system. These results represent an initial analysis of free-field motion and are the first step towards more in-depth analyses of dynamic soil–structure interaction [
26]. The foundation soil has important effects on the response of isolated bridges and, in various circumstances, the motion at the abutments (lateral supports) may be underestimated if the soil–structure interaction is not properly addressed [
27]. Finally, future developments may include the evaluation of the influence on the bridge of ground motion spatial variation [
28] and the influence of vertical input motion due to a near-fault condition [
29,
30,
31,
32,
33].


