Article

Assessment of Vulnerability to Erosion in Amazonian Beaches

by
Remo Luan Marinho Costa Pereira
1,
Cesar Mösso
2,* and
Luci Cajueiro Carneiro Pereira
3,*
1
Department of Civil and Environmental Engineering, Civil Engineering School (Campus Nord), Universitat Politècnica de Catalunya BarcelonaTech, c/Jordi Girona 1-3, 08034 Barcelona, Spain
2
Laboratori d’Enginyeria Marítima, Department of Civil and Environmental Engineering, Civil Engineering School (Campus Nord), Universitat Politècnica de Catalunya BarcelonaTech, c/Jordi Girona 1-3, 08034 Barcelona, Spain
3
Institute of Coastal Studies, Universidade Federal do Pará, Alameda Leandro Ribeiro sn, Aldeia, Braganca-Pará 68600-000, Brazil
*
Authors to whom correspondence should be addressed.
Geographies 2025, 5(3), 29; https://doi.org/10.3390/geographies5030029
Submission received: 18 April 2025 / Revised: 9 June 2025 / Accepted: 26 June 2025 / Published: 28 June 2025

Abstract

Erosion represents a significant global threat to coastal zones, especially beaches, which are among the most valuable coastal landforms. This study evaluates the vulnerability to coastal erosion along the Brazilian Amazon coast, focusing on eight recreational beaches. The research is based on an assessment of geological, physical, ecological, and anthropogenic indicators. Some of these indicators were proposed in this study to enhance the evaluation of vulnerability in Amazonian beaches. The analysis reveals that most of the beaches studied are highly vulnerable to erosion due to a combination of natural factors and human activities. The barrier–beach ridge, composed of unconsolidated sediments, exhibits the highest vulnerability, while low cliffs present a moderate level of risk. The study highlights that semi-urban beaches with significant infrastructure development are particularly susceptible to erosion, a problem exacerbated by unplanned land use. Conversely, rural beaches, especially those located in protected areas, show lower vulnerability due to reduced human impact and better conservation of natural ecosystems. Furthermore, the study underscores the effects of extreme climatic events, such as prolonged rainfall and high-energy waves, which can intensify erosion risks. The findings suggest that anthropogenic changes, combined with extreme climate events, significantly influence the dynamics of coastal erosion. This research emphasizes the importance of targeted management strategies that address both natural and human-induced vulnerabilities, aiming to enhance coastal resilience and sustainability for Amazonian beaches.

Graphical Abstract

1. Introduction

Coastal environments form the dynamic interface between land and sea, hosting essential ecosystems, infrastructure, and nearly 40% of the global population [1,2]. These areas are increasingly exposed to natural and anthropogenic pressures, with coastal erosion being a prominent concern [3,4]. Coastal areas, due to their socio-economic and environmental importance, face global challenges associated with erosion, which impacts sandy coastlines across various regions [5,6]. It is estimated that approximately 70% of the world’s sandy beaches are experiencing erosion [7], resulting from complex interactions among climatic, oceanographic, and human-induced factors.
Erosive dynamics result from natural processes, such as wave action, tides, beach slope, sediment supply, and sea level rise, often intensified by human activities, such as coastal engineering, land-use changes, and uncontrolled urban expansion [8,9,10,11]. Consequently, the net loss of sediment along the beach profile, referred to as erosion [12], can lead to significant morphological transformations in these environments [13], threatening local ecosystems [14], infrastructure, and socio-economic activities, including tourism [15,16]. Storms, among natural forces, are particularly significant, often causing both short- and long-term sediment displacement. In severe cases, these events may lead to permanent alterations in the coastal landscape [17,18,19]. In addition, unplanned occupation and environmental degradation have contributed to the loss of dunes, mangroves, and built infrastructure [20,21].
To assess coastal vulnerability, various indices have been developed globally [22,23,24]. These indices make it possible to identify, quantify, and classify coastal environments based on their varying degrees of vulnerability. One of the most widely applied is the Coastal Vulnerability Index (CVI), which was initially introduced by [25]. It integrates physical, geomorphological, and socio-environmental parameters to assess the susceptibility of coastlines to hazards, such as sea-level rise, storms, and erosion [26,27]. To address the limitations of current vulnerability indices in capturing the socio-environmental interconnections specific to the Amazonian coast, this study incorporates a revised framework adapted from previous CVI applications in other coastal contexts. However, considering the unique environmental dynamics of Amazonian beaches [28,29], specific adjustments were made to better suit these settings.
Based on this, the objective of this work is to provide a comprehensive assessment of beach vulnerability across distinct climatic contexts along the Amazonian coast, supporting the effective management of natural resources and coastal development. Although focused on Pará state, the framework presented here can also be applied to similar coastal areas characterized by high-energy hydrodynamics driven by macrotides and moderate-energy waves, high precipitation levels, and well-preserved environments bordered by dunes and mangroves but affected by erosion processes.

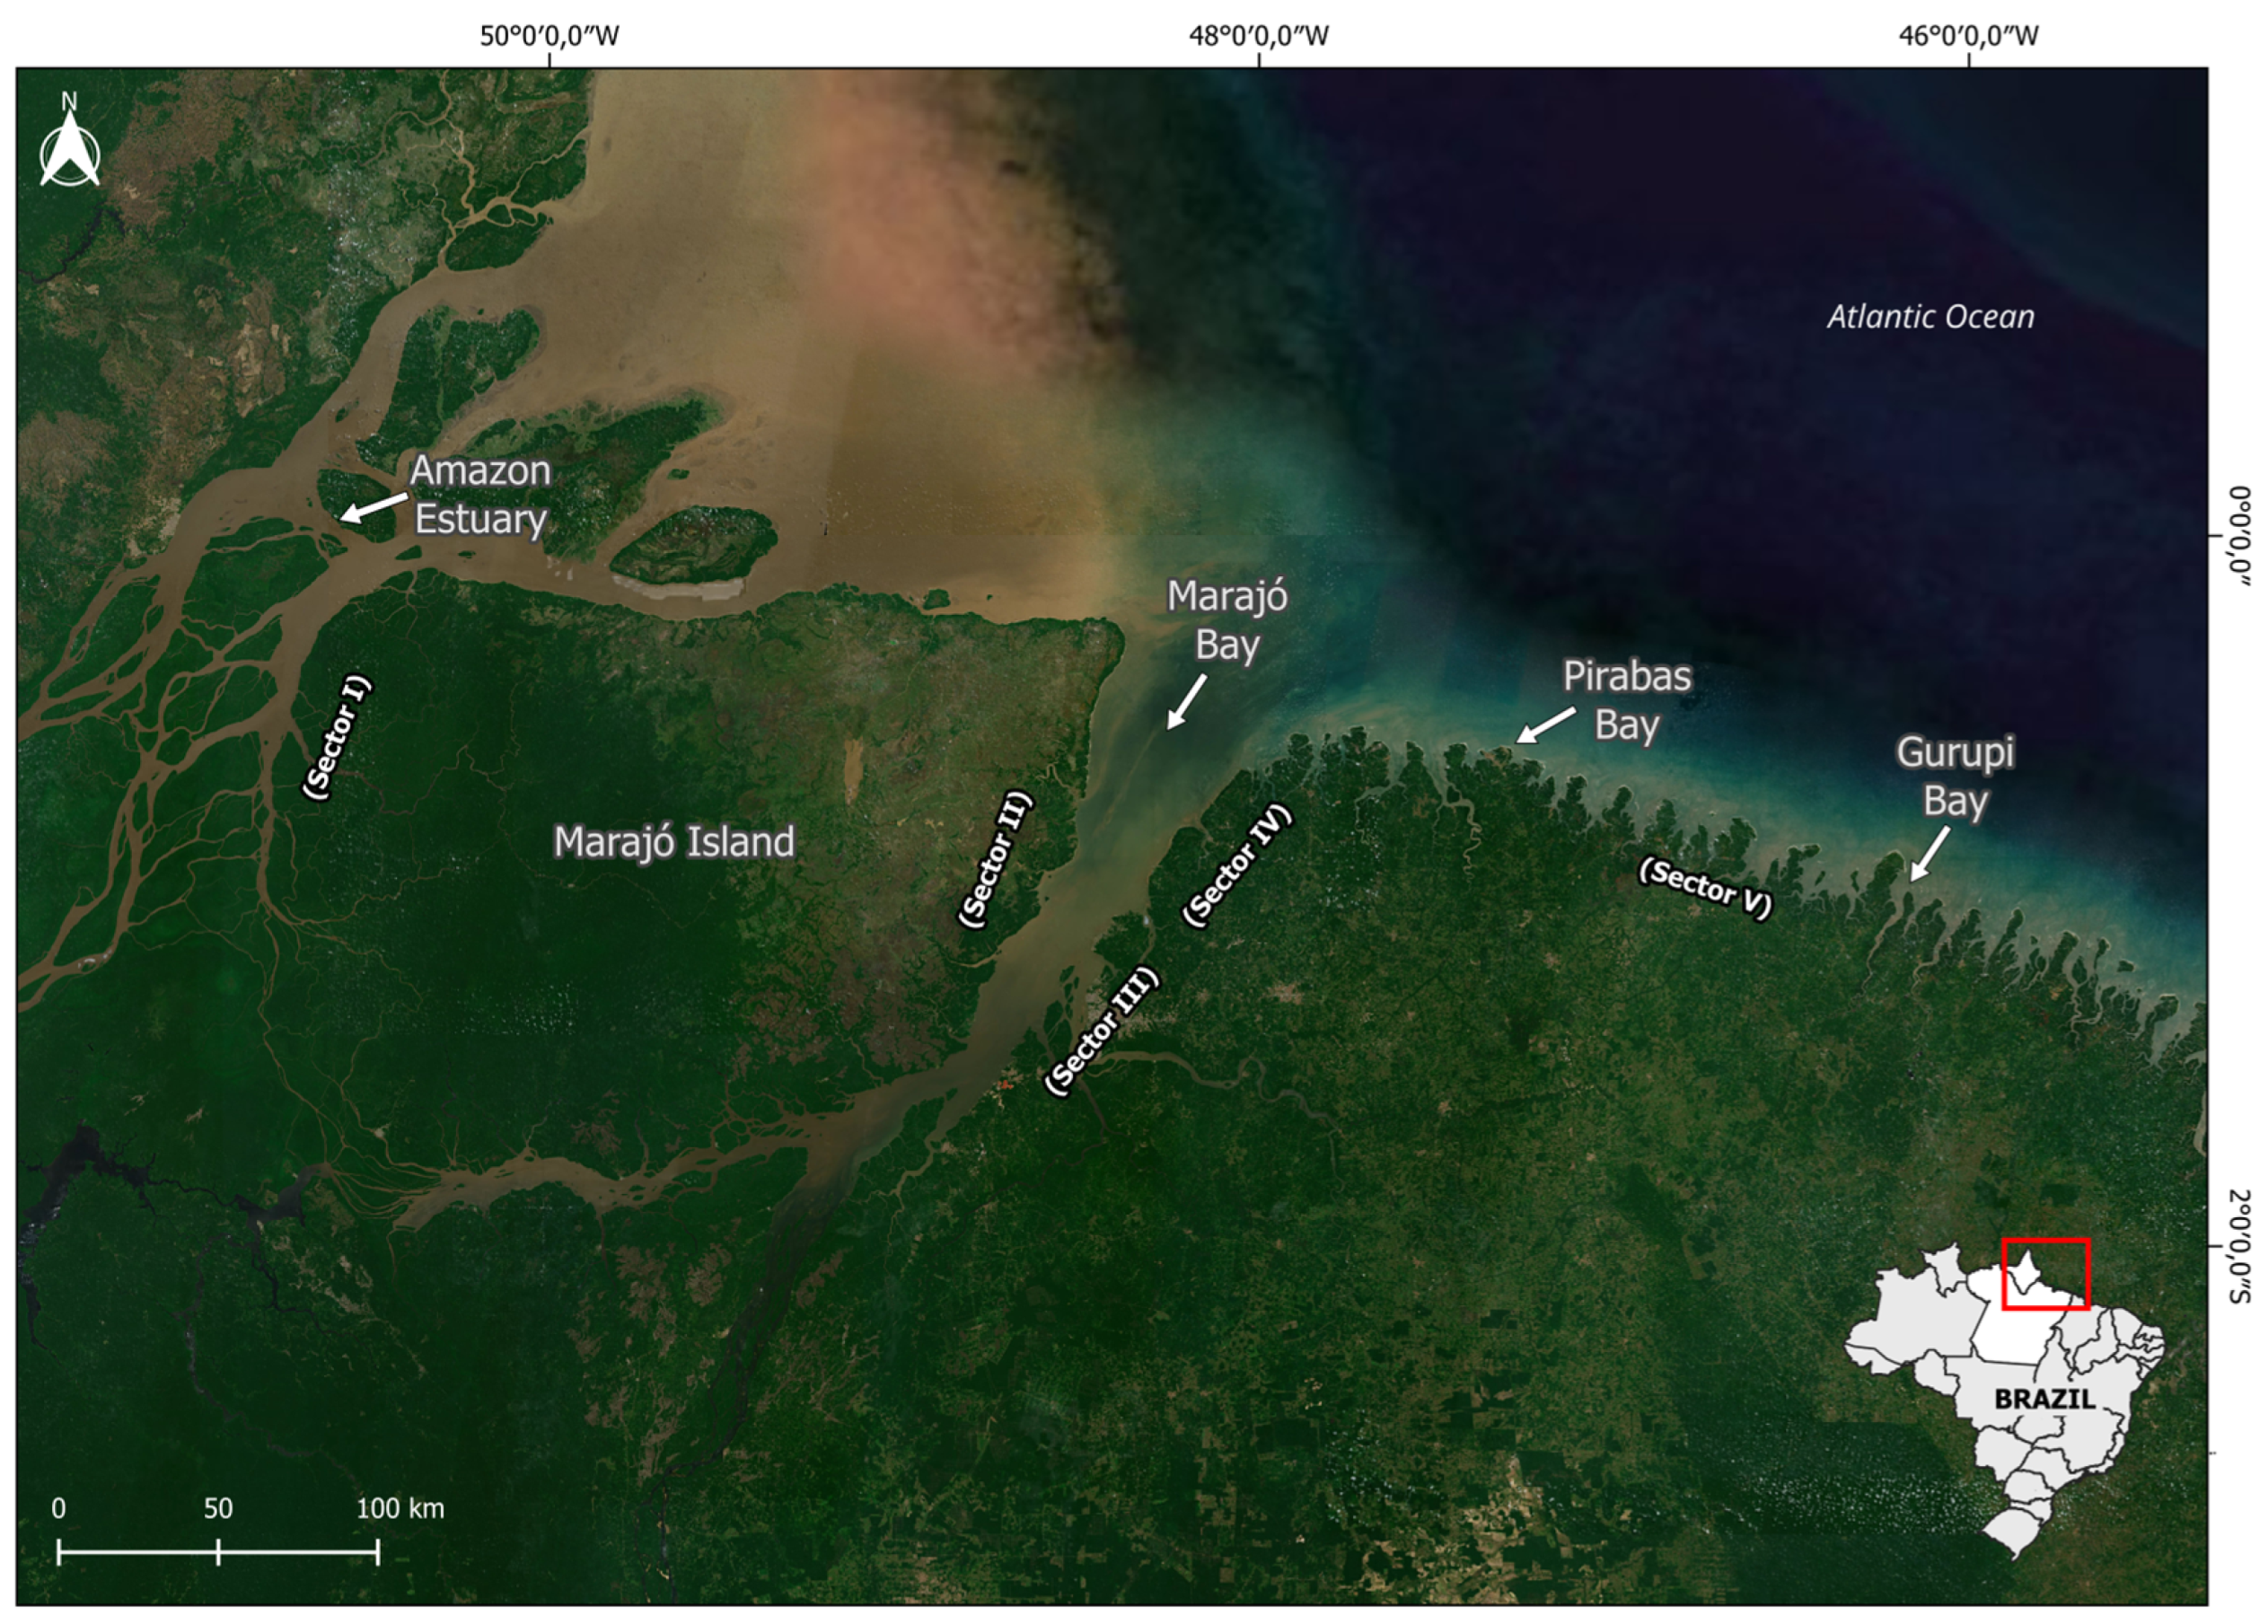
2. Study Area: The Amazon Coast

2.1. Overview of the Amazon Coast

The Brazilian Amazon coast is a vast and dynamic estuarine–marine system shaped by abundant sediment inputs reworked by both fluvial and coastal processes [29,30,31]. Stretching between 4° N and 4° S, this coastal zone represents about 35% of Brazil’s 8500 km-long shoreline [32]. It includes the immense sediment, nutrient, and organic matter discharge of the Amazon River (Figure 1), which alone contributes nearly 20% of global river discharge (~200,000 m3 s−1 on average) and an estimated 754 × 106 tons of suspended sediments per year [33,34,35]. Although bedload constitutes only about 1% of the discharge, it accounts for millions of tons annually [36] and sustains extensive sandy beaches and tidal sandflats.
The coastline is dominated by mangroves and comprises various features, such as tidal flats, salt marshes, cheniers, beach ridges, deltas, and coastal dunes, making up one of the world’s largest mangrove ecosystems [37,38]. Located in a low-latitude region, the Coriolis effect is minimal, making coastal circulation primarily driven by river discharge, prevailing winds, wave action, and meso- to megatidal regimes that create intense tidal currents [29,30].

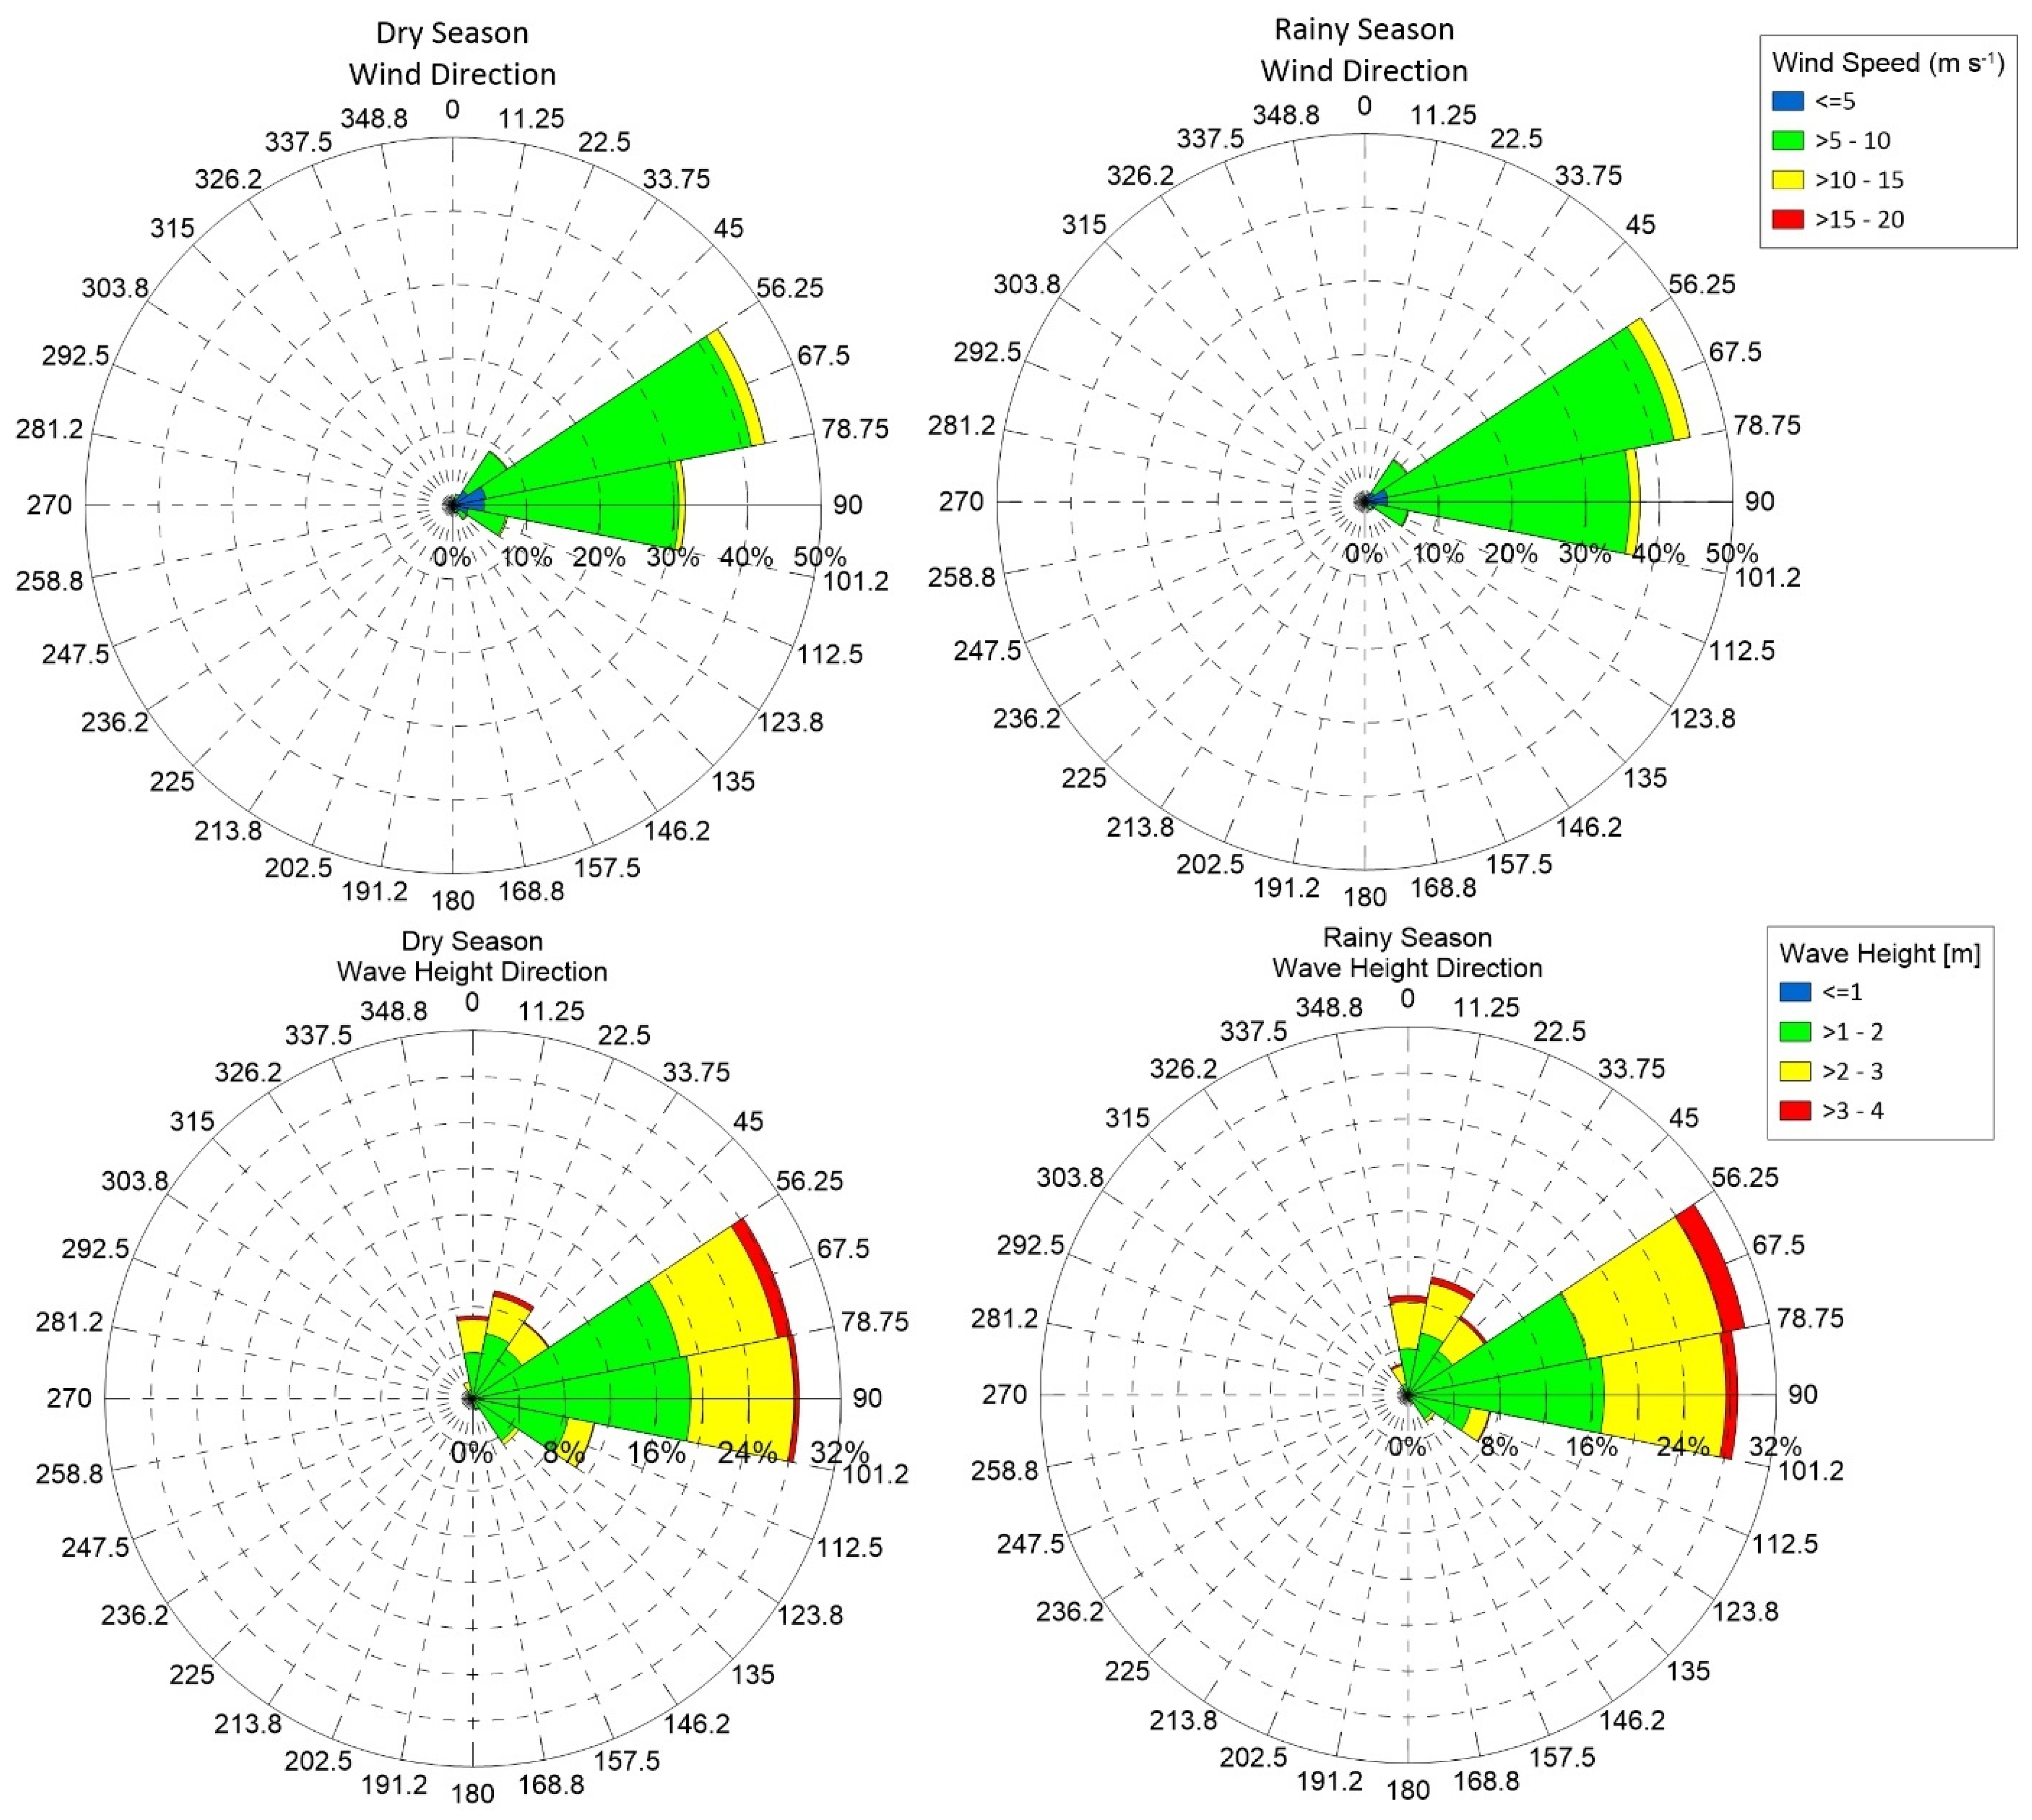
2.2. Geomorphological Setting and Offshore Conditions

From a geomorphological perspective, the Pará coast is divided into two primary zones [39], as follows: (a) the emergent coast, represented by Marajó Island with a relatively straight shoreline and (b) the submergent coast, extending between Marajó and Gurupi Bays and characterized by a more irregular, dissected landscape with estuaries, islands, and tidal inlets.
This coast is further subdivided based on sedimentary environments and coastal processes. For example, the area between Marajó and Pirabas Bays features a narrow coastal plain and active cliffs formed from tertiary sediments (Barreiras and Pirabas formations), while the region between Pirabas and Gurupi Bays is distinguished by expansive mangrove areas and sedimentary plains.
Offshore conditions are a critical element in understanding coastal dynamics. Data from NOAA’s National Data Buoy Center (Station 41041) indicates that prevailing trade winds, from the northeast and east, drive the generation of waves. During the rainy season (February–May), winds (5.0–14.0 m s−1) produce significant wave heights (Hs) of up to 5.0 m, with predominant directions between 50° and 110° and wave periods of 3 to 19 s. In contrast, during the dry season (September–November), wind speeds and wave heights are generally lower. Figure 2 shows the offshore wind and wave parameters that control the nearshore conditions, setting the stage for coastal processes.

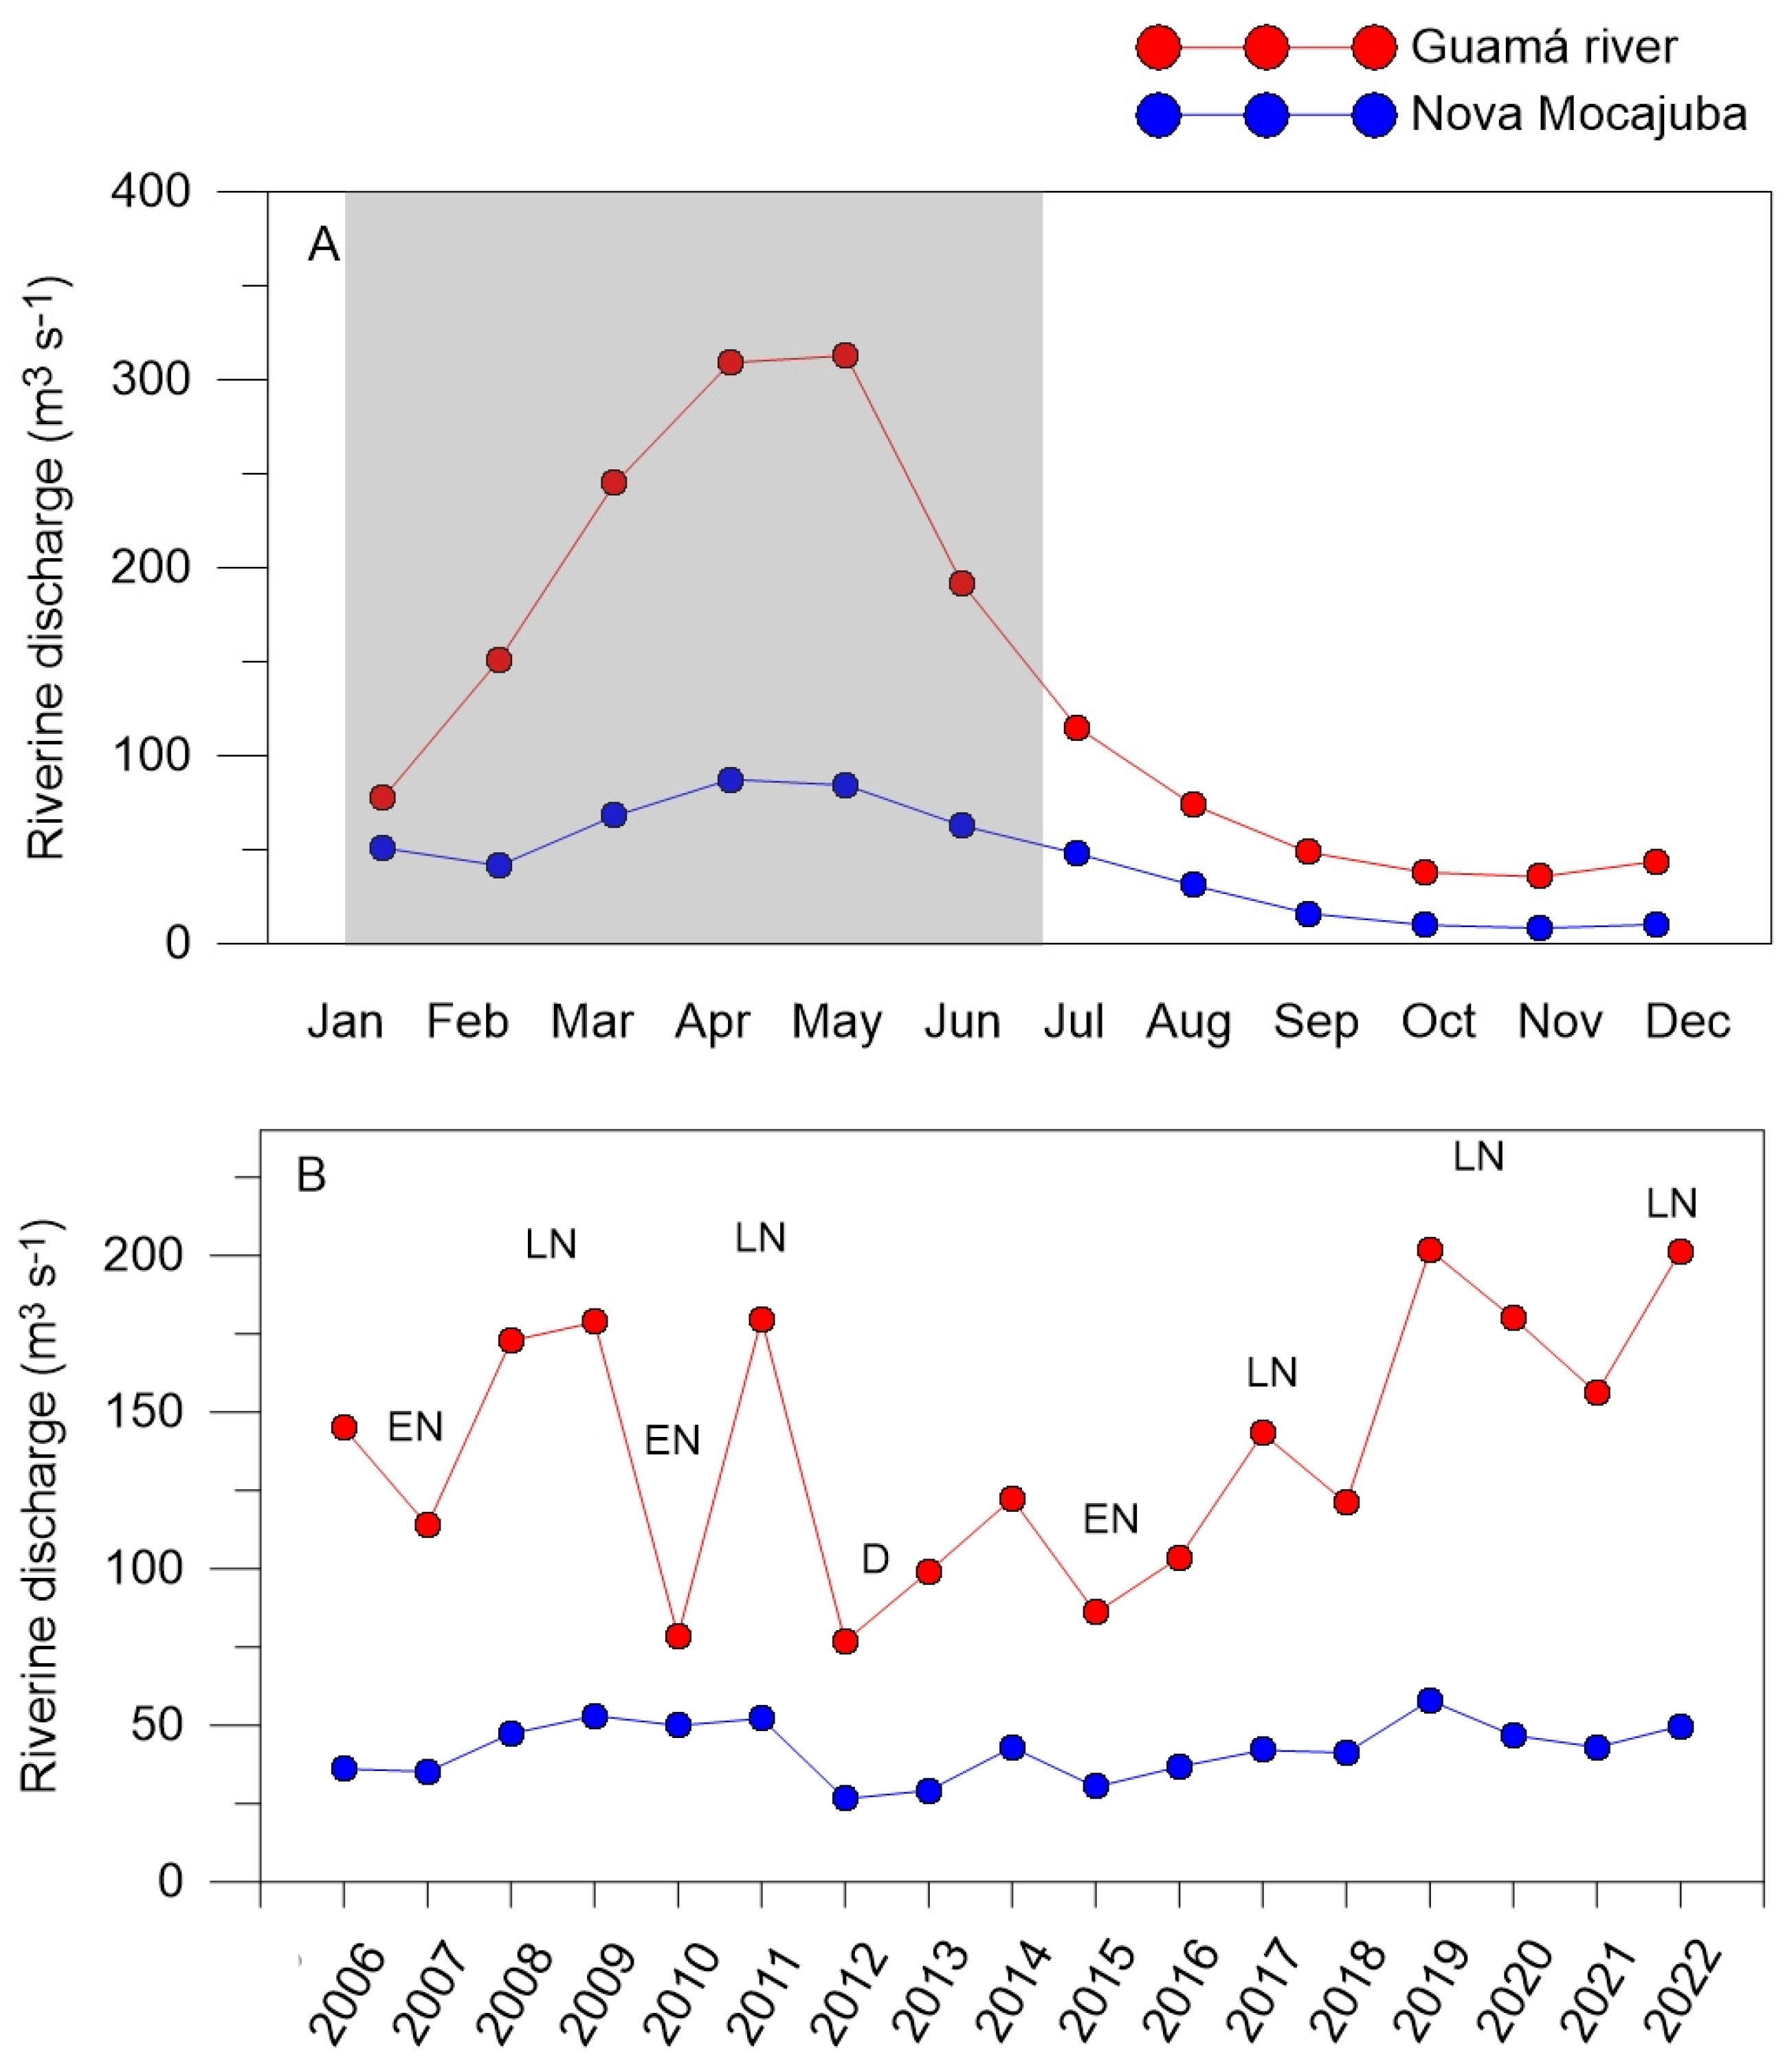
2.3. Climatic Drivers and Hydrological Dynamics

Rainfall on the Amazon coast is predominantly controlled by the Intertropical Convergence Zone (ITCZ). The region experiences a humid equatorial climate (Köppen Am) with distinct rainy (January–June) and dry (July–December) seasons (Figure 3A). Annual rainfall (Figure 3B) may exceed 2000 mm on the Atlantic coast sector (e.g., Tracuateua station) and 3000 mm within the continental estuarine sector (e.g., Belém station) [41,42].
Interannual climate variability on the Amazon coast is strongly influenced by the Oceanic Niño Index (ONI) for the Niño-3.4 region [40], where El Niño events (ONI ≥ +0.5) reduce rainfall, and La Niña events (ONI ≤ −0.5) enhance precipitation. Major El Niño events in 2009–2010 and 2015–2016, as well as La Niña episodes in 2007–2008 and 2010–2011, are clearly reflected in the ONI trends (Figure 4). Additionally, severe droughts, such as those in 2005, 2010, and 2012, have also had notable impacts on regional hydrology, driven in part by elevated sea surface temperatures in the tropical Atlantic.
River discharge is closely linked to regional rainfall, with peak flows typically occuring about one month after the highest precipitation periods. Data from the National Water Agency [44] shows significant variability between stations, such as the Atlantic Coast Sector (Nova Mocajuba station) and the Continental Estuarine Sector (Guamá station), where Guamá’s discharge is approximately 70% higher (Figure 5).
The wide and shallow Amazonian continental shelf amplifies the tidal range; for instance, tidal elevations exceed 4 m in the Atlantic sector (Salinópolis station), but tide attenuation through the Marajó estuary causes a notable reduction in tidal range at Belém and Breves stations (Figure 6).

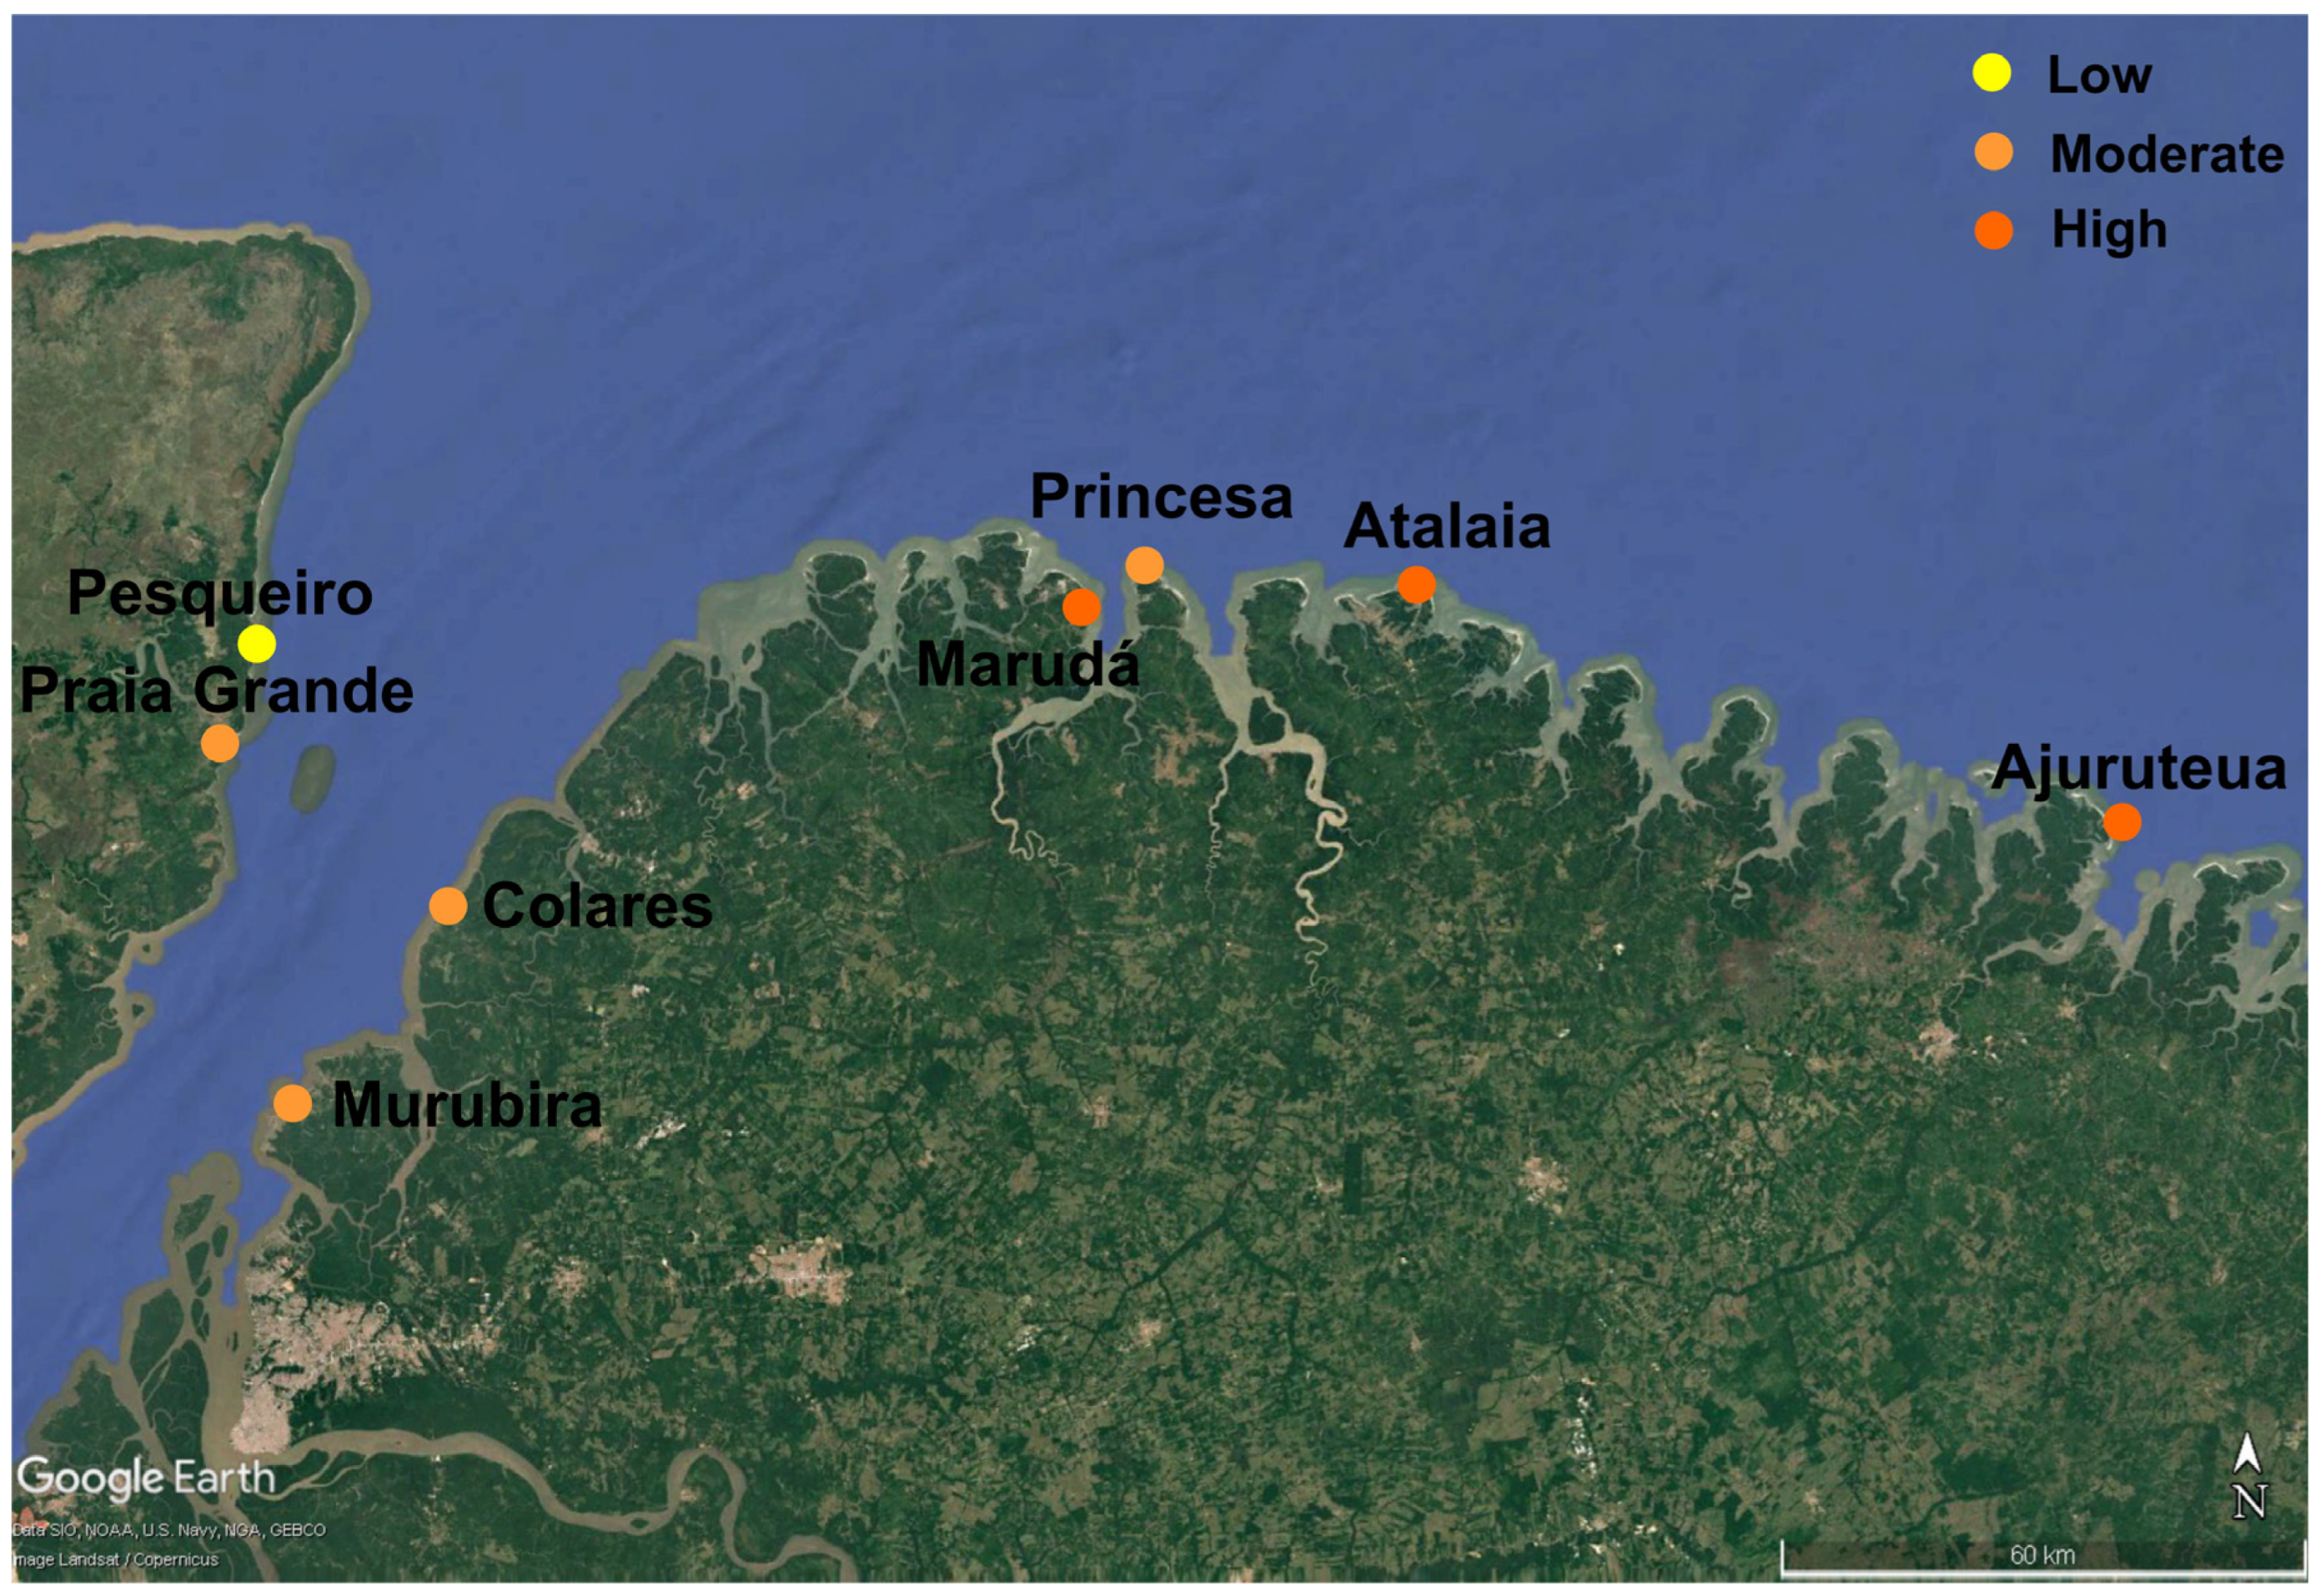
2.4. The Study Area and Beach Characteristics

The study area comprises beaches located across the following four sectors (Figure 7): Eastern Marajó (Pesqueiro and Praia Grande), Continental Estuarine (Murubira), Fluvio-Maritime (Colares, Marudá, and Princesa), and the Atlantic Coast (Atalaia and Ajuruteua).
In the Eastern Marajó sector, Pesqueiro Beach is located in the municipality of Soure. This beach extends approximately 4 km in length and 1 km in width, with a north–south orientation and a straight to convex shoreline. Its gentle slope, segmented by large tidal channels, is influenced by fetch-limited waves from Marajó Bay and strong tidal currents. The fine to very fine sediments contribute to barrier beach formation, while adjacent mangrove and tidal flat systems offer natural shelter. Pesqueiro Beach lies within the Soure Marine Extractive Reserve, supporting traditional artisanal fishing communities. Also, in the Eastern Marajó sector, Praia Grande was another beach studied. It features a 1.2 km-long beach with an NNW-SSE orientation, characterized by a narrow, concave sandy strip and steep topography at the base of coastal cliffs. Sediments derived from the Barreiras/Post-Barreiras Group, along with wave action and tidal currents, shape its geomorphology.
In the Continental Estuarine sector, Murubira Beach is situated on Mosqueiro Island along the Pará River. Murubira spans 1.4 km and is about 70 m wide at low tide. The beach is bordered by a series of active and inactive cliffs from the Barreiras Group, with hydrodynamics influenced by tidal ranges of approximately 3.5 m and wave heights reaching 1.5 m.
In the Fluvio-Maritime sector, Colares is a mesotidal beach located on Colares Island. It measures 560 m in length and 400 m in width during low spring tides. Additionally, Marudá Beach, situated at the mouth of the Marapanim estuary, experiences tidal ranges of up to 5 m, spans over 1 km in length, and reaches up to 300 m in width at low tide.
In the Atlantic Coast sector, the studied beaches were Princesa, Atalaia, and Ajuruteua. These insular beaches are surrounded by dunes, estuaries, lagoons, and mangroves. They are characterized by intertidal sandy ridges (200–400 m wide), shaped by macrotidal conditions (tidal ranges > 4–6 m), and strong tidal currents (up to 1.5 m s−1). Sandbanks modulate wave energy at low tide, while at high tide, wave heights may exceed 1.5 m. Princesa Beach benefits from additional protection within the Algodoal-Maiandeua Environmental Protection Area, whereas Atalaia and Ajuruteua are near protected areas, such as the Caeté-Taperacu Marine Extractive Reserve and the Atalaia Natural Monument.

3. Methodology

This section introduces the newly proposed Coastal Vulnerability Index (CVI), designed to assess coastal erosion and customized to the specific characteristics of the Amazon coast. The methodology is based on the CVI framework from [46]. The dataset comprises 14 indicators grouped into the following four categories: geological (GE), which includes geomorphology (GM), beach slope (BS), beach exposure (BE), and terrain elevation (TE); physical (PH), encompassing wave climate (WC), spring tidal range (sTR), rainfall level (RL), and wave orientation (WO); environmental (EN), covering the conservation status of dunes (CD), the conservation status of mangrove forests (CM), and protected areas (PA); and seafront features (SF), which include development level (DL), territorial occupation (TO), and erosion indicator (EI).
Each CVI component represents a characteristic affecting overall coastal vulnerability, enabling a comprehensive analysis for the eight beaches studied. The indicators were obtained through field campaigns, satellite image analysis, and data from national and international sources (Table 1). The vulnerability scores for each indicator range from 1, indicating very low vulnerability, to 5, representing very high vulnerability, as detailed in Table 2. The CVI value was calculated (Equation (1)) using the arithmetic mean of the indicator values. In this study, the CVI was classified using the same principle applied to the indicators. This standardized scale facilitates the interpretation of the results.
C V I = G M + B S + B E + T E + W C + s T R + R L + W O + C D + C M + P A + D L + T O + E I 14
The data was obtained from field campaigns conducted using two distinct approaches. The first involved medium-term data series (2006–2021) sourced from national institutions, including the Brazilian Institute of Meteorology (INMET), the National Oceanic and Atmospheric Administration (NOAA), and Google Earth satellite images. The second approach focused on short-term in situ data collection, including tides, waves, and topographic leveling at each beach during both equinoctial and non-equinoctial periods, across rainy and dry seasons. During these field campaigns, an expert observer used a checklist to gather data on specific indicators, as shown in Table 1.
To adjust the CVI limits, different climatic conditions were considered. To understand how vulnerability may vary between years, satellite image data obtained from DigitalGlobe was extracted using Google Earth (GE) Pro 7.3.6.10201 (64-bit) software to monitor coastline changes over different periods. Vegetation, dunes, and built structures were visually interpreted and used as reference markers to define the shoreline in each image. Polygons were drawn in GE to estimate beach retreat or advance over three time intervals (2007–2014, 2007–2021, and 2014–2021).

Development of the Coastal Vulnerability Index (CVI)

The geological component includes geomorphology, which serves as an indicator of the relative erodibility of coastal landforms. For this indicator, vulnerability classification intervals are based on the susceptibility of various relief types, where rocky and cliffed coasts receive the lowest vulnerability scores, while landforms, such as beach ridges, sandy beaches, muddy or sandy flats bordered by dunes, deltas, and mangrove environments, are assigned the highest scores (Table 2). Another indicator is beach slope, which encompasses both the subaerial beach profile (linked to inundation vulnerability) and the submerged slope (associated with erosion potential). Gentle slopes indicate higher vulnerability compared to steeper slopes, as shown in Table 2. This study adopts the ranges provided by [47]. Additionally, beach exposure is determined by natural and anthropogenic features, as well as wave–tide interactions (Table 2). The classification system, adapted from [29,48], ranges from sheltered environments that provide physical protection (very low vulnerability) to exposed beaches lacking protective structures, with no modulation of the breaking wave climate (very high vulnerability). The fourth indicator, terrain elevation, evaluates the vulnerability of coastal areas to inundation, overwash, and sea-level rise. In this study, the classification criteria were adapted from [49]. For estuarine beaches, influenced by mesotidal conditions, very low vulnerability corresponds to elevations above 6 m, while very high vulnerability applies to elevations below 3 m. For oceanic beaches, shaped by macrotidal conditions (tidal ranges typically between 5.0 and 6.0 m) and significant wave heights (Hs) up to 1.8 m, very low vulnerability is assigned to elevations above 9 m, and very high vulnerability to elevations below 6 m. Only three scores, as indicated in Table 2, were used for this indicator to align with those established by [49].
The selection of these 14 indicators was guided by the following two criteria: their proven relevance in previous CVI applications and their specific suitability for Amazonian coastal environments. Physical and geological indicators, such as geomorphology, beach slope, wave climate, and tidal range, reflect the dominant natural force in this macrotidal and moderate-wave-energy region [28,30,35]. Environmental indicators, including dune and mangrove conservation status and the presence of protected areas, capture critical buffering ecosystems that are especially significant in the Amazonian coastal setting [21,38]. Finally, the inclusion of seafront development indicators (e.g., territorial occupation and erosion markers) responds to well-documented regional patterns of unregulated tourism growth and coastal occupation [20,21]. Together, these indicators provide a balanced representation of the natural and anthropogenic factors influencing erosion vulnerability in the Amazon coastal zone.
The physical component encompasses four indicators. The first is wave climate, a key factor in coastal sediment balance, particularly during high-energy wave events. According to [47], the ratio between Hs295% (wave height exceeded only 5% of the time) and the Hs threshold (which depends on local conditions) defines coastal vulnerability based on erosion potential. When wave heights exceed this threshold, significant erosive impacts can reshape the coastline, damage habitats, and affect infrastructure (Table 2). The second indicator is spring tidal range, which is linked to risks of permanent and episodic flooding. High tidal ranges, especially when combined with strong tidal currents, are associated with increased coastal erosion [50] (Table 2). High rainfall levels directly influence the water table and coastal sediment transport. Greater soil saturation enhances sediment movement, increasing erosion (higher vulnerability). Along the Amazon coast, groundwater exfiltration in the upper intertidal zone occurs when cumulative three-month rainfall exceeds 500 mm [51]. To incorporate this factor into the assessment, the study modified the classification proposed by [52], as shown in Table 2. Monthly precipitation data was obtained from Instituto Nacional de Meteorologia [43]. The fourth indicator is wave direction, which is determined by the angle between beach alignment and prevailing wave directions. Vulnerability is assessed based on criteria outlined in [50], as shown in Table 2.
With respect to the environmental components, three indicators stand out. The first is the conservation status of dunes, as dunes serve as natural barriers that protect coastal areas and contribute to sediment balance. Adapted from [53], vulnerability classifications range from preserved and vegetated dunes (very low vulnerability) to suppressed dunes (very high vulnerability), as shown in Table 2. The second indicator is the conservation status of mangrove forests, as mangroves act as protective barriers against waves and storms, making them effective indicators of erosion. Vulnerability classifications range from beaches with dense, mature mangroves showing no signs of erosion (very low vulnerability) to sparse or absent mangrove trees and leaning vegetation (very high vulnerability), as shown in Table 2. The last indicator is the presence of protected areas, primarily designated for sustainable use. Vulnerability is ranked from beaches located within protected areas (very low vulnerability) to beaches outside and distant from protected areas (very high vulnerability). To ensure consistency in the qualitative assessment of environmental indicators, such as the conservation status of dunes and mangroves, we employed a standardized checklist during fieldwork. This checklist was informed by prior studies (e.g., [50,54]) and included criteria such as (i) presence or absence of vegetation, (ii) signs of physical suppression or fragmentation of dune fields, (iii) evidence of erosion (e.g., exposed roots, escarpments), and (iv) proximity or intrusion of built infrastructure. Each site was assessed independently by the researchers during the fieldwork. This process also facilitated inter-observer validation, contributing to the credibility of the research. In instances of conflicting evidence, a consensus was established through the meticulous examination of photographic documentation and field notes.
The seafront features are composed of three indicators. The first is the development level, which assesses the distribution of populations and settlements to determine the degree of development in an area. This can place pressure on coastal zones and potentially exacerbate coastal erosion. Development levels are categorized into five classifications, as presented in Table 2. The second indicator is territorial occupation, which evaluates the percentage of spatial occupation along the seafront. Scores, adapted from [54], are determined based on the percentage of occupation, as outlined in Table 2. The third indicator is erosion indicators, which analyze the presence of specific signs of coastal erosion, as shown in Table 2. These indicators include buried vegetation, exposed roots, erosion escarpments, the narrowing or absence of the backshore, coastal protection structures, and damage to seafront properties.
Several of the classification thresholds used in this study were initially adapted from previous CVI applications in other coastal contexts. However, considering the specific environmental dynamics of Amazonian beaches, such as high sediment supply, macrotidal range, and relatively low wave energy, we conducted an expert validation process. This included (i) consultations with local researchers and coastal managers familiar with the study areas, (ii) historical shoreline change analyses, and (iii) field-based comparisons with observed erosion indicators. This process ensured that the adapted ranges were ecologically and geomorphologically appropriate for Amazonian beach settings.

4. Results

4.1. The Coastal Vulnerability Index (CVI)

The Coastal Vulnerability Index (CVI) highlights differences in vulnerability among the studied beaches (Table 3 and Figure 8). The studied beaches exhibited slightly higher vulnerability during equinoctial tides, mainly during the rainy season, when rainfall and offshore conditions were most intense. During this period, the lowest vulnerability scores are observed in rural beaches, such as Pesqueiro (CVI = 2.9), Princesa (CVI = 3.2), and Colares (CVI = 3.3). Although geological and physical factors contribute to moderate-to-high vulnerability in these areas, their lower overall vulnerability is attributed to the conservation of dune, mangrove, and restinga environments, along with limited development and reduced human impact. Moderate vulnerability scores are assigned to Praia Grande (CVI = 3.6) and Murubira (CVI = 3.6), primarily due to higher scores in physical factors (such as rainfall levels and wave orientation), environmental aspects (absence of protected areas), and seafront features (erosion indicators). The highest vulnerability scores are recorded for semi-urban beaches, including Marudá (CVI = 4.2), Atalaia (CVI = 4.2), and Ajuruteua (CVI = 4.0). Ajuruteua, although currently a rural beach, is undergoing rapid development and transitioning towards semi-urbanization, increasing its vulnerability. Below is the description of the indicators by sector.

4.2. Eastern Marajó Island (Sector II)

In this sector, two beaches were analyzed—Pesqueiro and Praia Grande. Pesqueiro Beach exhibited very high vulnerability in the geological and physical components, particularly in the geomorphology indicator, as it is a barrier beach characterized by a curved spit shaped by local north–south longitudinal sediment transport. Similarly, high vulnerability was observed in the rainfall level indicator, due to rainfall accumulation exceeding 1500 mm over three months during the rainiest period, and in the wave orientation indicator. Moreover, high vulnerability was noted in the beach slope indicator, as the slope typically ranges between 0.02 and 0.04, and in the wave climate indicator, where the ratio of Hs295% to Hs2 falls between 1.0 and 1.5. Conversely, Pesqueiro Beach is situated within a protected area, which results in low vulnerability for five of the six environmental and seafront feature indicators. It is a rural beach surrounded by well-preserved dunes and mangroves, making it part of the Soure Marine Extractive Reserve. Territorial occupation along the beachfront is less than 30%. The sole exception was the erosion indicator, which revealed evidence of buried vegetation, exposed roots, and an erosion escarpment. As a consequence of the erosion issue, the beach area experienced a reduction of 61,202 m2 between 2007 and 2021 (Figure 9 and Figure 10).
At Praia Grande, the following six indicators exhibit moderate vulnerability: Two within the geology component, (i) geomorphology, as it is a beach with ridges running in an NNW-SSE direction, bordered by cliffs and headlands of the coastal plateau, and (ii) beach slope, which ranges between 0.04 and 0.08. One indicator within the physical component, the spring tidal range, reaching 2.0–4.0 m, classifying it as mesotidal. Two indicators within the environmental component, dunes and mangroves, which are partially affected by nearby construction. Finally, one within the seafront features component. Very high vulnerability was recorded in the physical component for rainfall level and wave orientation. It is a semi-urban beach located outside protected zones. The territorial occupation at Praia Grande covers 50–70% of the beachfront, indicating high vulnerability, with erosion indicators, including property damage, cliffs, mangroves, dunes, exposed roots, and a narrow shoreline.

4.3. Continental Estuarine and Fluvio-Maritime (Sectors III and IV)

Four beaches were studied within the following sectors: Murubira, Colares, Marudá, and Princesa. Murubira Beach is characterized by active cliffs of the Barreiras Group, indicating moderate vulnerability. Its beach slope, ranging between 0.04 and 0.08, is also classified as moderate vulnerability. About 75% of its terrain has elevations greater than 6 m, corresponding to very low vulnerability. Colares Beach features sandy deposits primarily shaped by wave action, located at the foot of cliffs, resulting in moderate vulnerability. Its beach slope, ranging between 0.04 and 0.08, also falls under moderate vulnerability, with 86% of the coastline at elevations between 3 and 6 m. Marudá Beach consists of sandy ridges, forming banks and channels that create very high vulnerability. The beach slope, varying from 0.02 to 0.04, indicates high vulnerability, while 100% of the coastline has elevations between 3 and 6 m, marking it as moderate vulnerability. Princesa Beach is a flat, linear barrier ridge, surrounded by dunes and mangroves, contributing to very high vulnerability. Its beach slope, ranging between 0.08 and 0.12, is considered low vulnerability, but its coastal elevation, measuring less than 6 m, results in very high vulnerability for this indicator. Among all beaches in these sectors, the Hs295% and the Hs2 ratio exceeded 1.5, only in Princesa beach.
In addition, Murubira and Colares exhibit mesotidal conditions, with a spring tidal range of 3.9 m, indicating moderate vulnerability, while Marudá and Princesa, with spring tidal ranges exceeding 4.0 m, fall into the macrotidal category, leading to very high vulnerability. During the rainiest months, rainfall accumulation surpasses 1500 mm over three months across all beaches, resulting in very high vulnerability in this regard. The environmental features further differentiate these beaches. Murubira and Marudá experience significant human impact, with territorial occupation affecting 70–80% of the coastline, leading to very high vulnerability. These semi-urban beaches are heavily used for recreational purposes, causing considerable modifications to their original natural conditions, resulting in moderate vulnerability. Erosion indicators, such as buried vegetation, exposed roots, erosion escarpments, and damage to properties, are prominent in both locations. Colares and Princesa are rural and less developed, which places them in low and very low vulnerability categories, respectively. Colares, in particular, has less than 30% of its coastline occupied by buildings, with well-preserved dunes and native vegetation, denoting low vulnerability. Princesa Beach, located within the Algodoal/Maiandeua Environmental Protection Area, enforces strict territorial management, ensuring well-conserved dunes and mangroves, contributing to very low vulnerability. However, the construction of 30 bars in the intertidal zone adds an element of low vulnerability to its overall environmental profile. However, at Marudá and Princesa beaches, the surface area decreased by 41,414 m2 and 51,910 m2, respectively, between 2007 and 2021. In Murubira, the retaining wall helped limit the reduction in surface area to 709 m2 during this period (Figure 9 and Figure 10).

4.4. Atlantic Coast (Sector V)

The two beaches analyzed in this sector, Ajuruteua and Atalaia, are geomorphologically classified as highly vulnerable due to their barrier beach ridge characteristics. Both beaches are flat, linear, elongated landforms, bordered by tidal deltas, dunes, and mangrove areas, contributing to their very high vulnerability. Additionally, the beach slope is absent in both Ajuruteua and Atalaia, further emphasizing their very high vulnerability. During low tide, semi-submerged sandbanks offer protection to both beaches. Ajuruteua provides better protection during low tide, with wave heights (Hs values) ranging from 0.1 to 0.4 m, while Atalaia offers less protection, with Hs values between 0.5 and 0.8 m. The seafront terrain elevation ranges from 3 to 9 m, yet inhabited areas reveal that 52% of Ajuruteua’s coastline and 77% of Atalaia’s coastline feature elevations below 6 m, placing both beaches in the very high vulnerability category.
The physical indicators further reflect their susceptibility to erosion. The Hs295% and the Hs2 threshold ratio exceeded 1.5, indicating very high vulnerability. This ratio signifies that wave heights exceeded 5% of the time are greater than 2.5 m, demonstrating significant erosion potential. Additionally, the spring tidal range (sTR) for both beaches varies between 5 and 6 m, representing high vulnerability. Rainfall accumulation during the wettest months surpasses 1500 mm over three months, confirming very high vulnerability in this regard.
In addition, Ajuruteua is adjacent to the Caeté-Taperaçu Marine Extractive Reserve, established in 2005, while Atalaia is adjacent to the Atalaia Natural Monument, created in 2018. Both beaches feature numerous wooden structures built on stilts within the intertidal zone, dunes, and mangrove areas. Territorial occupation affects 50–70% of Ajuruteua’s coastline, resulting in high vulnerability, while Atalaia’s territorial occupation exceeds 70%, placing it in the very high vulnerability category. Ajuruteua retains rural characteristics but is transitioning into semi-urbanization, presenting low vulnerability. Several houses, bars, and restaurants line its seafront, whereas Atalaia Beach exhibits significant semi-urbanization, with extensive construction of bars, hotels, and houses, contributing to moderate vulnerability. With respect to erosion, both beaches have experienced substantial erosion over the decades, leading to the partial or complete destruction of buildings, infrastructure, dunes, and mangroves. Equinoctial spring tides exacerbate erosion events, resulting in the loss of street lighting, bars, restaurants, and inns. At Atalaia, wooden structures are frequently relocated to dunes during periods of severe erosion, while Ajuruteua has implemented structural engineering solutions to protect its buildings. However, Ajuruteua’s surface area has decreased by 110,046 m2 between 2007–2021 (Figure 9 and Figure 10). Common erosion indicators at both beaches include buried vegetation, exposed roots, escarpments, concentrations of heavy minerals, coastal protection structures, and damage to seafront properties.

5. Discussion

5.1. Geological Indicators

Coastal erosion vulnerability is assessed through indicators that reflect susceptibility to high-energy events [27,47,55]. In this study, the Coastal Vulnerability Index (CVI) incorporates geological, physical, environmental, and seafront indicators. Geomorphology was classified based on the relative resilience of coastal landforms [8,56,57]. The following two types of coastal relief were identified: (i) barrier beach ridges, composed of unconsolidated sediments and highly vulnerable (score 5), found in Pesqueiro, Marudá, Princesa, Atalaia, and Ajuruteua; and (ii) low cliffs, moderately vulnerable, in Praia Grande, Murubira, and Colares. Beach slope, a key erosion predictor, shows that gentler slopes are more prone to erosion [49,58]. Protection levels, natural or artificial, also modulate exposure; (i) Estuarine beaches within bays (e.g., Marajó Bay) have moderate vulnerability due to limited fetch; (ii) partially protected beaches (e.g., with sandbanks or tidal bars) show very low vulnerability; and (iii) less sheltered beaches, like Atalaia, exhibit low vulnerability [29]. Elevation proved to be crucial; beaches below 6 m are highly vulnerable, 6–9 m moderately so, and above 9 m, they have low vulnerability (modified from [48]). High vulnerability coincides with barrier beach ridges, while low cliffs correspond to lower vulnerability.
Despite the fact that the CVI approach implemented in this study assigns equal weight to all 14 indicators, the authors recognize that, in practice, various factors may influence coastal erosion to different extents. Physical drivers, such as wave climate or tidal range, frequently exert more substantial and immediate effects than other factors, particularly in macrotidal environments. However, the unweighted method proposed by [46] and later employed in similar regional studies was utilized, a technique that facilitates consistent application and comparability across diverse settings. This limitation is acknowledged, and it is proposed that subsequent applications of the CVI in the Amazon region would benefit from incorporating weighting schemes or sensitivity analyses to evaluate the relative influence of each indicator. Such refinements would enhance the diagnostic capacity of the index and its use in decision making.

5.2. Physical Indicators

Tidal attenuation reduces tidal elevation by ~35% in Marajó Bay compared to the Atlantic coast. Thus, macrotidal beaches (Atlantic) are more vulnerable due to stronger currents and flooding risk, contrary to previous classifications [46,59]. On the Amazon coast, macrotides and moderate waves drive intense erosion, particularly during equinoctial spring tides [28,51]. Offshore waves (3–4 m) attenuate nearshore (1–2 m), with sandbanks buffering wave energy at low tide. However, high tide exposes the shoreline to wave impact, making it the critical period for erosion. Storm-induced vulnerability is classified as very high (CVI > 1.5) due to significant Hs values (1.5–1.8 m). Wave incidence angles (θ > 70°) increase exposure [57,60]. Rainfall also contributes heavy seasonal rains saturate beaches, enhancing offshore sediment transport and erosion [61]. All beaches showed high vulnerability due to intense rainfall.

5.3. Environmental Indicators

Dune fields and coastal vegetation, such as mangroves and restinga, serve as critical natural barriers. They not only mitigate the direct impact of waves and storms on the coast but also play a central role in maintaining the sediment balance by acting as both buffers and sources of sediment for neighboring areas. In the study area, rural beaches with well-preserved dune systems and mangroves (e.g., Pesqueiro, Colares, and Princesa) demonstrate low vulnerability to erosive processes, highlighting the protective function of these natural elements. In addition, the existence of protected areas, where local regulations restrict unplanned urban expansion and promote coastal ecosystem preservation [62,63,64], reinforces the resilience of these coastal zones. Such areas facilitate the implementation of sustainable management strategies and effective land-use regulations, which are essential for maintaining the natural stability of the coastline. In contrast, unregulated development and disorganized territorial occupation alter sedimentary processes and significantly increase erosion risk [65,66]. This unsustainable development undermines the natural recovery capability of coastal ecosystems, making them more vulnerable to extreme events.

5.4. Seafront Features

In terms of seafront features, semi-urban beaches, like Murubira, Atalaia, and Marudá, are characterized by a higher concentration of facilities and services, including restaurants, bars, private residences, inns, and hotels, which intensifies the pressure on these coastal zones. In areas with high territorial occupation (e.g., Praia Grande, Murubira, Marudá, Atalaia, and Ajuruteua), increased anthropogenic activity often exacerbates the natural processes of erosion. The presence of infrastructure limits the natural adaptability of the coast, often aggravating erosion by altering natural sediment dynamics.
When erosion intensifies, it frequently results in significant structural impacts; wooden buildings might be relocated to avoid total loss of utility, whereas concrete constructions could suffer partial or complete failure. Visible signs of erosion include deteriorating structures, exposed tree roots, and the tilting or collapse of trees, which are indicators of severe substrate instability. Although some coastal protection structures have been installed in locations such as Atalaia, Ajuruteua, and Murubira, these interventions are typically limited in scope and sometimes insufficient to counteract the severe impact of extreme weather events.
Furthermore, climatic phenomena, like El Niño and La Niña, amplify these challenges by causing alternating periods of drought and intense rainfall. These events not only increase rainfall intensity and wave energy during strong wind conditions but also elevate groundwater levels, further destabilizing the coastal landscape. The compounded influence of natural forces and human activities underscores the importance of comprehensive vulnerability assessments. Such integrated analyses are crucial for devising sustainable coastal management strategies and for planning interventions aimed at mitigating the adverse effects of coastal erosion.
In addition to physical and environmental indicators, socio-economic drivers play a crucial role in shaping coastal vulnerability. In the Amazonian context, rapid and often informal development, driven by seasonal tourism, a lack of land-use regulation, and economic pressures on coastal populations, has intensified occupation along the seafront, particularly in semi-urban beaches. The expansion of bars, restaurants, second homes, and rental lodgings within the dune field and intertidal zone disrupts natural sediment dynamics and weakens the resilience of beach systems. The limited enforcement of environmental regulations and the absence of long-term planning mechanisms further contribute to the persistence of high-risk occupation. Although these socio-economic processes are not explicitly scored in the CVI, they are partially reflected in the territorial occupation and development level indicators. Despite the absence of a formal sensitivity analysis, a comparative review of indicator scores across sites revealed that wave climate, rainfall level, and territorial occupation were consistently associated with higher CVI values, suggesting a stronger influence on erosion vulnerability. Future refinements of the index should consider integrating socio-economic drivers more explicitly and implementing sensitivity testing to guide indicator weighting and improve the index’s diagnostic and planning capacity.

6. Summary and Conclusions

This study evaluated the erosion vulnerability of eight beaches along the Pará coast (Amazonian coast, Brazil) by integrating geomorphological characteristics, coastal physical processes, patterns of territorial occupation, ecosystem conservation, and erosion indicators. The analysis revealed a vulnerability spectrum ranging from low to high across the study area. Natural factors play a crucial role, as the inherent geology and physical processes largely drive high vulnerability in most of the beaches. Anthropogenic impacts further exacerbate vulnerability, with unplanned territorial occupation significantly affecting semi-urban beaches (e.g., Atalaia) or in semi-urban process (e.g., Ajuruteua) with higher development. In contrast, rural beaches, particularly those within protected areas, demonstrated lower vulnerability due to reduced human interference and better preservation of natural protective features. However, evidence of erosion was recorded in Princesa and Pesqueiro beaches. The presence of promenades on the semi-urban beaches of Marudá, Murubira, and Colares prevented them from experiencing significant variations in the coastline. Extreme meteorological events, including prolonged rainfall and intensified wave activity, also contribute to erosion, temporarily heightening erosive processes and disrupting coastal equilibrium. These episodic events can accelerate erosion, posing additional threats to coastal stability. The findings highlight the necessity of integrating comprehensive vulnerability assessments into coastal management practices. They provide critical support for the development and implementation of mitigation strategies to reduce erosion impacts on both estuarine and oceanic beaches, regardless of urbanization levels. Overall, the study offers valuable insights for the sustainable management of natural resources and infrastructure preservation along the Amazonian coast, emphasizing the need for proactive and adaptive management strategies in response to both natural and human-induced challenges.

Author Contributions

Conceptualization, R.L.M.C.P., L.C.C.P. and C.M.; methodology, R.L.M.C.P., L.C.C.P. and C.M.; validation, R.L.M.C.P., L.C.C.P. and C.M.; formal analysis, R.L.M.C.P., L.C.C.P. and C.M.; investigation, R.L.M.C.P. and L.C.C.P.; resources, R.L.M.C.P., L.C.C.P. and C.M.; data curation, R.L.M.C.P., L.C.C.P. and C.M.; writing original draft preparation, R.L.M.C.P., L.C.C.P. and C.M.; supervision, R.L.M.C.P. and C.M.; funding acquisition, L.C.C.P. All authors have read and agreed to the published version of the manuscript.

Funding

This research was funded by Brazilian National Council for Scientific and Technological Development—CNPq (483913/2012-0, 431295/2016-6, 314037/2021–7).

Data Availability Statement

Data will be available on request.

Acknowledgments

This study was financed by the Brazilian National Council for Scientific and Technological Development (CNPq) through a Universal Project (483913/2012-0, 431295/2016-6). The author Luci C.C. Pereira (314037/2021–7) would also like to thank CNPq for its research grants.

Conflicts of Interest

The authors declare no conflicts of interest.

References

  1. Martinez, M.L.; Intralawan, A.; Vázquez, G.; Pérez-Maqueo, O.; Sutton, P.; Landgrave, R. The coasts of our world: Ecological, economic and social importance. Ecol. Econ. 2007, 63, 254–272. [Google Scholar] [CrossRef]
  2. Barbier, E.B.; Hacker, S.D.; Kennedy, C.; Koch, E.W.; Stier, A.C.; Silliman, B.R. The value of estuarine and coastal ecosystem services. Ecol. Monogr. 2011, 81, 169–193. [Google Scholar] [CrossRef]
  3. Prasad, D.H.; Kumar, N.D. Coastal erosion studies—A review. Int. J. Geosci. 2014, 5, 341–345. [Google Scholar] [CrossRef]
  4. Vousdoukas, M.I.; Ranasinghe, R.; Mentaschi, L.; Plomaritis, T.A.; Athanasiou, P.; Luijendijk, A.; Feyen, L. Sandy coastlines under threat of erosion. Nat. Clim. Change 2020, 10, 260–263. [Google Scholar] [CrossRef]
  5. Pranzini, E.; Williams, A.T. Coastal Erosion and Protection in Europe; Routledge: London, UK, 2013; 457p. [Google Scholar]
  6. Mentaschi, L.; Vousdoukas, M.I.; Pekel, J.F.; Voukouvalas, E.; Feyen, L. Global long-term observations of coastal erosion and accretion. Sci. Rep. 2018, 8, 12876. [Google Scholar] [CrossRef]
  7. Davis, R.A., Jr.; FitzGerald, D.M. Beaches and Coasts, 1st ed.; Blackwell Science Ltd.: Chichester, UK, 2004; p. 512. [Google Scholar] [CrossRef]
  8. Karymbalis, E.; Chalkias, C.; Chalkias, G.; Grigoropoulou, E.; Manthos, G.; Ferentinou, M. Assessment of the sensitivity of the southern coast of the Gulf of Corinth (Peloponnese, Greece) to sea-level rise. Cent. Eur. Geol. 2012, 4, 561–577. [Google Scholar] [CrossRef]
  9. Temmerman, S.; Meire, P.; Bouma, T.J.; Herman, P.M.; Ysebaert, T.; Vriend, H.J. Ecosystem-based coastal defence in the face of global change. Nature 2013, 504, 79–83. [Google Scholar] [CrossRef]
  10. Biel, R.G.; Hacker, S.D.; Ruggiero, P.; Cohn, N.; Seabloom, E.W. Coastal protection and conservation on sandy beaches and dunes: Context-dependent tradeoffs in ecosystem service supply. Ecosphere 2017, 8, e01791. [Google Scholar] [CrossRef]
  11. McLachlan, A.; Defeo, O.; Short, A.D. Characterising sandy beaches into major types and states: Implications for ecologists and managers. Estuar. Coast. Shelf Sci. 2018, 215, 152–160. [Google Scholar] [CrossRef]
  12. Antolinez, J.A.A.; Méndez, F.J.; Camus, P.; Vitousek, S.; González, E.M.; Ruggiero, P.; Barnard, P. A multiscale climate emulator for long-term morphodynamics (MUSCLE-morpho). J. Geophys. Res. Oceans 2016, 121, 775–791. [Google Scholar] [CrossRef]
  13. Harley, M.D.; Masselink, G.; Alegría-Arzaburu, R.A.; Valiente, N.G.; Scott, T. Single extreme storm sequence can offset decades of shoreline retreat projected to result from sea-level rise. Commun. Earth Environ. 2022, 3, 112. [Google Scholar] [CrossRef]
  14. Thakur, S.; Mondal, I.; Bar, S.; Nandi, S.; Ghosh, P.B.; Das, P.; De, T.K. Shoreline changes and its impact on the mangrove ecosystems of some islands of Indian Sundarbans, North-East coast of India. J. Clean. Prod. 2021, 284, 124764. [Google Scholar] [CrossRef]
  15. Phillips, M.R.; Jones, A.L. Erosion and tourism infrastructure in the coastal zone: Problems, consequences and management. Tour. Manag. 2006, 27, 517–524. [Google Scholar] [CrossRef]
  16. Roig-Munar, F.X.; Mir-Gual, M.; Rodríguez-Perea, A.; Pons, G.X.; Martín-Prieto, J.A.; Gelabert, B.; Blázquez-Salom, M. Beaches of Ibiza and Formentera (Balearic Islands): A classification based on their environmental features, tourism use and management. J. Coast. Res. 2013, 65, 1850–1855. [Google Scholar] [CrossRef]
  17. Splinter, K.D.; Carley, J.T.; Golshani, A.; Tomlinson, R. A relationship to describe the cumulative impact of storm clusters on beach erosion. Coast. Eng. 2014, 83, 49–55. [Google Scholar] [CrossRef]
  18. Harley, M.D.; Turner, I.L.; Kinsela, M.A.; Middleton, J.H.; Mumford, P.J.; Splinter, K.D.; Short, A.D. Extreme coastal erosion enhanced by anomalous extratropical storm wave direction. Sci. Rep. 2017, 7, 6033. [Google Scholar] [CrossRef]
  19. Ciavola, P.; Coco, G. Coastal Storms: Processes and Impacts; John Wiley & Sons: Hoboken, NJ, USA, 2004. [Google Scholar] [CrossRef]
  20. Pereira, L.C.C.; Guimarães, D.O.; Ribeiro, M.J.S.; Costa, R.M.; Souza-Filho, P.W.M. Use and occupation in Bragança littoral, Brazilian Amazon. J. Coast. Res. 2007, SI 50, 1116–1120. [Google Scholar] [CrossRef]
  21. Pereira, L.C.C.; Sousa-Felix, R.C.; Costa, R.M.; Jimenez, J.A. Challenges of the recreational use of Amazon beaches. Ocean Coast. Manag. 2018, 165, 52–62. [Google Scholar] [CrossRef]
  22. Sharples, C. Indicative Mapping of Tasmanian Coastal Geomorphic Vulnerability to Sea-Level Rise Using GIS Line Map of Coastal Geomorphic Attributes; Department of Primary Industries & Water: Hobart, Australia, 2016.
  23. Narra, P.; Coelho, C.; Sancho, F.; Escudero, M.; Silva, R. Coastal hazard assessments for sandy coasts: Appraisal of five methodologies. J. Coast. Res. 2019, 35, 574–589. [Google Scholar] [CrossRef]
  24. Rodríguez-Rosales, B.; Abreu, D.; Ortiz, R.; Becerra, J.; Cepero-Acán, A.E.; Vázquez, M.A.; Ortiz, P. Risk and vulnerability assessment in coastal environments applied to heritage buildings in Havana (Cuba) and Cadiz (Spain). Sci. Total Environ. 2021, 750, 141617. [Google Scholar] [CrossRef]
  25. Gornitz, V.M. Vulnerability of the East Coast USA to future sea level rise. J. Coast. Res. 1990, 9, 201–237. [Google Scholar]
  26. Kumar, A.; Kunte, P.D. Coastal vulnerability assessment for Chennai, east coast of India using geospatial techniques. Nat. Hazards 2012, 64, 853–872. [Google Scholar] [CrossRef]
  27. Pantusa, D.; D’Alessandro, F.; Riefolo, L.; Principato, F.; Tomasicchio, G.R. Application of a coastal vulnerability index. A case study along the Apulian Coastline, Italy. Water 2018, 10, 1218. [Google Scholar] [CrossRef]
  28. Pereira, L.C.C.; Vila-Concejo, A.; Costa, R.M.; Short, A.D. Managing physical and anthropogenic hazards on macrotidal Amazon beaches. Ocean Coast. Manag. 2014, 96, 149–162. [Google Scholar] [CrossRef]
  29. Pereira, L.C.C.; Vila-Concejo, A.; Short, A.D. Coastal Morphodynamic Processes on the Macro-Tidal Beaches of Pará State Under Tidally Modulated Wave Conditions. In Brazilian Beach Systems; Short, A., Klein, A., Eds.; Coastal Research Library; Springer: Cham, Switzerland, 2016; Volume 17. [Google Scholar] [CrossRef]
  30. Anthony, J.E.; Gardel, A.; Proisy, C.; Fromard, F.; Gensac, E.; Peron, C.; Walcker, R.; Lesourd, S. The role of fluvial sediment supply and river-mouth hydrology in the dynamics of the muddy Amazon-dominated Amapá-Guianas coast South America: A three-point research agenda. J. S. Am. Earth Sci. 2013, 44, 18–24. [Google Scholar] [CrossRef]
  31. Anthony, J.E.; Gardel, A.; Gratiot, N. Fluvial sediment supply, mud banks, cheniers and the morphodynamics of the coast of South America between the Amazon and Orinoco river mouths. Geol. Soc. Lond. Spéc. Publ. 2013, 388, 533–560. [Google Scholar] [CrossRef]
  32. Isaac, V.J.; Barthem, R.B. Os Recursos Pesqueiros da Amazônia Brasileira; PR-MCT/CNPq Museu Paraense Emílio Goeldi: Belém, Brazil, 1995. [Google Scholar]
  33. Meade, R.H.; Rayol, J.M.; Conceicão, S.C.; Natividade, J.R. Backwater effects in the Amazon River basin of Brazil. Environ. Geol. Water Sci. 1991, 18, 105–114. [Google Scholar] [CrossRef]
  34. Moura, R.L.; Amado-Filho, G.M.; Moraes, F.C.; Brasileiro, P.S.; Salomon, P.S.; Mahiques, M.M.; Thompson, F.L. An extensive reef system at the Amazon River mouth. Sci. Adv. 2016, 2, e1501252. [Google Scholar] [CrossRef]
  35. Anthony, J.E.; Gardel, A.; Gratiot, N.; Proisy, C.; Allison, M.A.; Dolique, F.; Fromard, F. The Amazon-influenced muddy coast of South America: A review of mud-bank–shoreline interactions. Earth Sci. Rev. 2010, 103, 99–121. [Google Scholar] [CrossRef]
  36. Dunne, T.; Mertes, L.A.K.; Meade, R.; Richey, J.E.; Forsberg, B.R. Exchanges of sediment between the floodplain and channel of the Amazon in Brazil. Geol. Soc. Am. Bull. 1998, 110, 450–467. [Google Scholar] [CrossRef]
  37. Kjerfve, B.; Lacerda, L.D. Mangroves of Brazil. In Conservation and Sustainable Utilization of Mangrove Forests in Latin America and Africa Regions; Lacerda, L.D., Ed.; International Society for Mangrove Ecosystems: Okinawa, Japan, 1993; pp. 245–272. [Google Scholar]
  38. Souza-Filho, P.W.M.; Morais Tozzi, H.A.; El-Robrini, M. Geomorphology, land-use and environmental hazards in Ajuruteua macrotidal sandy beach, northern Brazil. J. Coast. Res. 2003, 580–589. Available online: https://www.jstor.org/stable/40928810 (accessed on 25 June 2025).
  39. Franzinelli, E. Evolution of the geomorphology of the coast of the State of Pará Brazil. In Évolution des Littoraux de Guyane et de la Zone Caraïbe Méridionale Pendant le Quaternaire; Prost, M.T., Ed.; ORSTOM: Paris, France, 1992; pp. 203–230. [Google Scholar]
  40. National Oceanic and Atmospheric Administration-NOAA. Buoy Data—41041 Middle Atlantic. 2024. Available online: https://ncei.noaa.gov/access/marine-environmental-buoy-database/41041.html (accessed on 30 November 2024).
  41. Figueroa, S.N.; Nobre, C.A. Precipitations distribution over central and western tropical South America. Climanálise 1990, 5, 36–45. [Google Scholar]
  42. Marengo, J.A. Interannual variability of deep convection over the tropical South American sector as deduced from ISCCP C2 data. Int. J. Climatol. 1995, 15, 995–1010. [Google Scholar] [CrossRef]
  43. Agência Bacional de Águas—ANA. 2024. Available online: https://www.gov.br/ana/pt-br (accessed on 30 November 2024).
  44. Instituto Nacional de Meteorologia—INMET. Monitoramento das Estações Automáticas. 2024. Available online: http://www.inmet.gov.br/sonabra/maps/automaticas.php (accessed on 30 November 2024).
  45. Centro de Hidrografia da Marinha—CHM. Tábuas de Maré. 2024. Available online: www.marinha.mil.br/chm/dados-do-segnav/dados-de-mare-mapa (accessed on 30 November 2024).
  46. Thieler, E.R.; Hammar-Klose, E.S. National Assessment of Coastal Vulnerability to Sea-Level Rise: Preliminary Results for the US Atlantic Coast (No. 99-593); US Geological Survey: Reston, VA, USA, 1999.
  47. López Royo, M.; Ranasinghe, R.; Jiménez, J.A. A rapid, low-cost approach to coastal vulnerability assessment at a national level. J. Coast. Res. 2016, 32, 932–945. [Google Scholar] [CrossRef]
  48. Mangor, K.; Drønen, N.K.; Kærgaard, K.H.; Kristensen, S.E. Shoreline Management Guidelines; DHI: London, UK, 2004. [Google Scholar]
  49. Bush, D.M.; Neal, W.J.; Young, R.S.; Pilkey, O.H. Utilization of geoindicators for rapid assessment of coastal-hazard risk and mitigation. Ocean Coast. Manag. 1999, 42, 647–670. [Google Scholar] [CrossRef]
  50. Tragaki, A.; Gallousi, C.; Karymbalis, E. Coastal hazard vulnerability assessment based on geomorphic, oceanographic and demographic parameters: The case of the Peloponnese (Southern Greece). Land 2018, 7, 56. [Google Scholar] [CrossRef]
  51. Pereira, L.; Concejo, A.V.; Trindade, W. Tidal modulation. In Sandy Beach Morphodynamics; Elsevier: Amsterdam, The Netherlands, 2020; pp. 87–101. [Google Scholar] [CrossRef]
  52. Browning, T.N.; Sawyer, D.E. Vulnerability to watershed erosion and coastal deposition in the tropics. Sci. Rep. 2021, 11, 885. [Google Scholar] [CrossRef]
  53. Sousa, P.H.G.O. Vulnerabilidade à Erosão Costeira no Litoral de São Paulo: Interação Entre Processos Costeiros e Atividades Antrópicas. Ph.D. Thesis, Instituto Oceanográfico, Universidade de São Paulo, São Paulo, Brazil, 2013. [Google Scholar]
  54. Silva, I.R.; Pereira, L.C.C.; Trindade, W.N.; Magalhaes, A.; Costa, R.M. Natural and anthropogenic processes on the recreational activities in urban Amazon beaches. Ocean Coast. Manag. 2013, 76, 75–84. [Google Scholar] [CrossRef]
  55. Alexandrakis, G.; Poulos, S. An holistic approach to beach erosion vulnerability assessment. Sci. Rep. 2014, 4, 6078. [Google Scholar] [CrossRef]
  56. Nageswara Rao, K.; Subraelu, P.; Venkateswara Rao, T.; Hema Malini, B.; Ratheesh, R.; Bhattacharya, S.; Ajai. Sea-level rise and coastal vulnerability: An assessment of Andhra Pradesh coast, India through remote sensing and GIS. J. Coast. Conserv. 2008, 12, 195–207. [Google Scholar] [CrossRef]
  57. Andrade, T.S.; Sousa, P.H.G.O.; Siegle, E. Vulnerability to beach erosion based on a coastal processes approach. Appl. Geogr. 2019, 102, 12–19. [Google Scholar] [CrossRef]
  58. Bozzeda, F.; Ortega, L.; Costa, L.L.; Fanini, L.; Barboza, C.A.; McLachlan, A.; Defeo, O. Global patterns in sandy beach erosion: Unraveling the roles of anthropogenic, climatic and morphodynamic factors. Front. Mar. Sci. 2023, 10, 1270490. [Google Scholar] [CrossRef]
  59. Pendleton, E.A.; Thieler, E.R.; Williams, S.J.; Beavers, R.L. Coastal Vulnerability Assessment of Padre Island National Seashore (PAIS) to Sea-Level Rise (No. 2004-1090); US Geological Survey: Reston, VA, USA, 2004.
  60. Pereira, L.C.C.; Silva, N.I.S.; Costa, R.M.; Asp, N.E.; Costa, K.G.; Vila-Concejo, A. Seasonal changes in oceanographic processes at an equatorial macrotidal beach in northern Brazil. Cont. Shelf Res. 2012, 43, 95–106. [Google Scholar] [CrossRef]
  61. Oliveira, S.; Moura, D.; Horta, J.; Nascimento, A.; Gomes, A.; Veiga-Pires, C. The morphosedimentary behaviour of a headland–beach system: Quantifying sediment transport using fluorescent tracers. Mar. Geol. 2017, 388, 62–73. [Google Scholar] [CrossRef]
  62. Pessoa, R.M.C.; Pereira, L.C.C.; Sousa, R.C.; Costa, R.A.M. Water Quality during the Recreational High Season for a Macrotidal Beach (Ajuruteua, Pará, Brazil). J. Coast. Res. 2016, 75, 1222–1226. [Google Scholar] [CrossRef]
  63. Pessoa, R.M.C.; Jiménez, J.A.; Costa, R.M.; Pereira, L.C.C. Federal conservation units in the Brazilian amazon coastal zone: An adequate approach to control recreational activities? Ocean Coast. Manag. 2019, 178, 104856. [Google Scholar] [CrossRef]
  64. Pereira, L.C.C.; Pessoa, R.M.C.; Sousa-Felix, R.C.; Dias, A.B.B.; Costa, R.M. How sustainable are recreational practices on Brazilian Amazon beaches? J. Outdoor Recreat. Tour. 2024, 45, 100741. [Google Scholar] [CrossRef]
  65. Sousa, R.C.; Pereira, L.C.C.; Silva, N.I.S.; Oliveira, S.M.O.; Pinto, K.S.T.; Costa, R.M. Recreational carrying capacity of three Amazon macrotidal beaches during the peak vacation season. J. Coast. Res. 2011, 64, 1292–1296. [Google Scholar]
  66. Sousa, P.H.; Siegle, E.; Tessler, M.G. Vulnerability assessment of Massaguaçú beach (SE Brazil). Ocean Coast. Manag. 2013, 77, 24–30. [Google Scholar] [CrossRef]
Figure 1. State of Pará highlighting the Amazon and Gurupi estuaries, Marajó Island, Marajó, and coastal sectors: Western Marajó (Sector I), Eastern Marajó (Sector II),Continental Estuarine (Sector III), Fluvial Maritime (Sector IV), and the Atlantic Coast of Pará (Sector V) according to [29].
Geographies 05 00029 g001
Figure 2. Seasonal pattern of wind (m s−1) and wave height (m) conditions. Source: [40], Buoy Data—41041.
Geographies 05 00029 g002
Figure 3. (A) Average monthly rainfall between 2006 and 2022 and (B) annual rainfall (2006–2022) in Belém and Tracuateua. The grey hatching represents the rainy season. EN—El Niño, LN—La Niña, and D—drought. Source: [43].
Geographies 05 00029 g003
Figure 4. Month Oceanic Niño Index, detaching El Niño and La Niña levels between 2006 and 2022. Source: [40].
Geographies 05 00029 g004
Figure 5. (A) Average monthly riverine discharge between 2006 and 2022 and (B) annual discharge (2006–2022) at the Nova Mocajuba and Guamá stations. The grey hatching represents the rainy season. EN—El Niño, LN—La Niña, and D—drought. Source: [44].
Geographies 05 00029 g005
Figure 6. Tidal range per month at six stations along the Para coast (AF) and the maximal range at each station (G). Source: [45].
Geographies 05 00029 g006
Figure 7. Study area, showing tide gauge, fluviometer and climatological stations, and studied beaches.
Geographies 05 00029 g007
Figure 8. Coastal Vulnerability Index (CVI) per beach.
Geographies 05 00029 g008
Figure 9. Study beaches showing details of the natural characteristics and development level. The red line represents 2007, the blue line represents 2014, and the green line represents 2021.
Geographies 05 00029 g009
Figure 10. Surface area at different time intervals.
Geographies 05 00029 g010
Table 1. A summary of the methodology used for the calculation of the CVI.
Sub-IndexesIndicatorsMethodology
GeologyGeomorphologyField campaigns (direct observation), Google Earth satellite images, and literature review.
Beach slopeField campaigns. Two topographic levelling campaigns were carried out on each beach, from the dunes, backshore area, or promenade to the nearshore area (up to 1.5 me deep, relative to the spring low tide level).
Beach exposureField campaigns (direct observation and hydrodynamic measures), Google Earth satellite images, and literature review. Hydrodynamics (tidal elevation and significant wave height—Hs) were collected using a mooring mounted on the bottom at a depth of 4.7 m below the MWL, to which wave and tide data loggers (TWR 2050) were attached. Wave sampling was carried out on the basis of 512 samples at a burst rate of 4 Hz, with sampling periods of 10 min. Tidal water level data was obtained every 2 s, and average values were measured every 10 min.
Terrain elevationSatellite imagery from Google Earth
PhysicalWave climate Hs95%/HsField campaigns. Significant wave height (Hs) were collected using a bottom-mounted mooring at a depth of 4.7 m below MWL, to which a wave data logger (TWR 2050) was attached. Wave sampling was based on 512 samples at a burst rate of 4 Hz with sampling periods of 10 min duration. Offshore significant wave heights (Hos) (average height of the highest one-third of all waves measured), periods (Tp) (defined as the wave period associated with the most energetic waves in the total wave spectrum at a specific point), and directions (θ) were obtained from National Data Buoy Center (NDBC), which holds data from NOAA (station 41041)
Spring tidal rangeTidal range was obtained using a bottom-mounted mooring at a depth of 4.7 m below MWL, to which a tide data logger (TWR 2050) was attached. Tidal water level data was obtained every 2 s, and mean values were measured every 10 min.
Rainfall levelMonthly precipitation data was provided by the INMET (meteorological stations located at Tracuateua and Belém).
Wave orientationThe wave direction was obtained from NOAA (station 41041), the beach orientation was determined using Google Earth, and the angle of rotation of the orientation for this shallow angle was obtained using a software program.
EnvironmentalConservation status of the dunes Field campaigns (direct observation).
Conservation status of the mangroveField campaigns (direct observation).
Protect area Literature review.
Seafront featuresDevelopment levelSatellite imagery from Google Earth and field campaign (direct observation).
Territorial occupationSatellite imagery from Google Earth and field campaign (direct observation).
Erosion indicatorsField campaign (direct observation).
Table 2. Ranges of vulnerability scores for the indicators of sub-indexes.
Sub-IndexIndicatorsScore
1-Very Low2-LOW3-Moderate4-High5-Very High
Geology
(GE)
Geomorphology (GM)Rocky, cliffed coastsMedium cliffs and indented coastsLow cliffsEstuary and lagoonBarrier–beach ridge, sandy beaches, muddy or sandy flats bounded by dunes, deltas, mangrove environments
Beach slope (BS)>0.12°0.08–0.12°0.04–0.08°0.02–0.04°<0.02°
Beach exposure (BE)Beaches protected by breakwater or natural barrier and influenced by high tidal modulationBeaches partially protected by natural barrier and with moderate modulation tidal modulationBeaches partially protected inside the bays, receiving fetch-limited waves Beaches partially exposed and marked for no modulation of the breaking wave climateExposed beaches without protective structures and exhibit no modulation of the breaking wave climate
Terrain elevation (TE)>6 m (estuarine beaches) > 9 m (oceanic beaches)--3 to 6 m (estuarine beaches) 6 to 9 m (oceanic beaches)--<3 m (estuarine beaches) and <6 (oceanic beaches)
Physical
(PH)
Wave climate (WC) <0.650.65–0.750.75–1.01.0–1.5>1.5
Spring tidal range (sTR)<1.0 m1.0–2.0 m2.0–4.0 m4.0–6.0 m>6.0 m
Rainfall level (cumulative three-month - RL) <0–49.9 mm50.0–199.9 mm200.0–324.9 mm325.0–499.9 mm>500 mm
Wave orientation (WO)75°–90°
91°–105°
--60°–74°
106°–120°
--45°–59°
121°–135°
Environmental
(EN)
Conservation status of the dunes
(CD)
Preserved and vegetated--Partially affected: not vegetated dunes, territorial occupation--Suppressed
Conservation status of the mangrove forest
(CM)
Dense, mature mangroves with no evidence of erosion--Partially affected: plants with exposed roots, territorial occupation -- Little or no trees or leaning trees
Protect area (PA)Within a protected area --Adjacent to a protected area --Far from protected area
Seafront features
(SF)
Development level
(DL)
RuralSemi-urban processSemi-urbanUrbanization processUrban
Territorial occupation (TO) <10%10–30%30–50%50–70%>70%
Erosion indicators * (EI)None--1 to 4-->5
* Indicators: buried vegetation, exposed roots, erosion escarpment, narrowing or absence of backshore, coastal protection engineering structures, state of conservation of dunes, mangroves, cliffs, and damage to seafront properties.
Table 3. Components, indicators, and CVI values per beach.
ComponentsIndicatorsPesqueiroPraia GrandeMurubiraColaresMarudáPrincesaAtalaiaAjuruteua
GeologyGeomorphology53335555
Beach slope43334555
Beach exposure33333121
Terrain elevation31133555
PhysicalWave climate 44445555
Spring tidal range33335555
Rainfall level55555555
Wave orientation55555555
EnvironmentalConservation status of the dunes 13313133
Conservation status of the mangrove13313133
Protect area 15555133
Seafront featuresDevelopment level13323132
Territorial occupation24545254
Erosion indicators35545355
CVI2.93.63.63.34.23.24.24.0
Disclaimer/Publisher’s Note: The statements, opinions and data contained in all publications are solely those of the individual author(s) and contributor(s) and not of MDPI and/or the editor(s). MDPI and/or the editor(s) disclaim responsibility for any injury to people or property resulting from any ideas, methods, instructions or products referred to in the content.

