Abstract
In this study, we selected a series of pothole wetlands to investigate their nucleation, evolution, and recent anthropogenic degradation in the Alcores Depression (AD), southern Iberian Peninsula, where over 100 closed watersheds containing shallow, ephemeral water bodies up to 2 hm2 have been identified. We surveyed the regional geological framework, utilized digital elevation models (DEMs), orthophotos, and aerial images since 1956. Moreover, we analyzed precipitation and temperature data in Seville from 1900 to 2024, collected hydrometeorological data since 1990 and modelled the water level evolution from 2002 to 2025 in a representative pothole in the area. Our observations indicate a flooded surface reduction by more than 90% from the 1950s to 2025. Climatic data reveal an increase in annual mean temperatures since 1960 and a sharp decline in annual precipitation since 2000. The AD’s inception due to tectonic isolation during the Quaternary favoured the formation of pothole wetlands in the floodplain. The reduction in the hydroperiod and wetland degradation was primarily due to agricultural expansion since 1950, which followed an increase in groundwater extraction and altered the original topography. Recently, decreased precipitation has exponentially accelerated the degradation and even the complete disappearance of many potholes. This study underscores the fragility of small wetlands in the Mediterranean basin and the critical role of human management in their preservation. Restoring these ecosystems could be a highly effective nature-based solution, especially in semi-arid climates like southern Spain. These prairie potholes are crucial for enhancing groundwater recharge, which is vital for maintaining water availability in regions with limited precipitation. By facilitating rainwater infiltration into the aquifer, recharge potholes increase groundwater levels. Additionally, they capture and store run-off during heavy rainfall, reducing the risk of flooding and soil erosion. Beyond their hydrological functions, these wetlands provide habitats that support biodiversity and promote ecological resilience, reinforcing the need for their protection and recovery.
1. Introduction
Wetlands in the Mediterranean basin have suffered a significant impact since human activity has started. First wetlands modifications date to >30,000 years, when these ecosystems served as refugia preserving mild microclimates for human communities [1]. The high biodiversity of these areas probably contributed to the human sedentarisation and the development of agricultural practices during the early Holocene [2]. Human-driven modifications were particularly outstanding during the Roman Empire due to the construction of water management infrastructures for agricultural and human demand. It occurred all along the Mediterranean basin: the Iberian Peninsula, Italy (e.g., Fucino Lake [3]), and the eastern Mediterranean basin (e.g., [4]). These wetland alterations have persisted throughout history, but in recent decades, an additional impact has emerged—anthropogenic climate change. The Mediterranean basin is a highly sensitive area, and a significant increase in air temperature and changes in precipitation patterns have been detected during the last decades (e.g., [5]) and have drastically modified surface/groundwater interactions, affecting wetlands, for instance, in southern Spain [6]. To the north of Europe, pothole wetlands develop as seasonal, small, shallow water bodies hosted in small depressions, often originated after Pleistocene glaciation. These ecosystems, which have not been detected in the Iberian Peninsula, are also strongly affected by global climate change [7].
The Iberian Peninsula acts as a biodiversity corridor between Africa and Europe during the whole Quaternary. It represented a refugium for temperate plants and animals in the Quaternary’s glacial periods (e.g., [8,9]). Recent studies documented how some species expanded toward this southern European refugium [10,11]. Complex interactions between the ecological and socio-cultural values of Iberian landscapes occurred during the last 2000 years [12]. These interactions resulted in a planned retreat of wetlands (mainly by drainage), as they were historically considered focal points for diseases such as malaria or marsh fever. A good illustration is the enactment of the Spanish water and port laws during the nineteenth century, which gave benefits, grants, and tax breaks to those who desiccated and took care of drained wetlands [13]. In addition, irrigation agriculture expanded in the Iberian Peninsula during the last century, modifying landscapes, especially in floodplains and fertile depressions [14]. This irrigation expansion is driving most of Iberian rivers’ basins, such as the Guadalquivir basin, towards an ‘emergency’ phase characterized by water resources that are lower than the water demand [15]. The effects of climate change are also more perceptible in the southern Iberian Peninsula, where dry periods are progressively longer and a rise in temperatures has been observed during the last decades (e.g., [16]).
The Guadalquivir River basin hosts a wide variety of wetlands associated with closed watersheds and flooded plains. In the Andalusian countryside there are many water bodies (called “lagunas”) that are seasonal because of a negative water balance, where evaporation largely exceeds precipitation [17]. Their size varies from 0.5 hm2 to more than 100 hm2 and they are very shallow, normally no more than 1.5 m in depth. They have been intensively modified because of human activity. Regional and national governments implemented protectionist measures to restore and/or protect these wetlands (e.g., the Tollos playa-lake restoration and Lantejuela endorheic system [18]). Nevertheless, many wetlands remain unknown and unnoticed by administration and, consequently, unprotected.
An ancient area seasonally flooded, nowadays highly degraded, that has not been studied to date, is the one located in the left Guadalquivir riverbank, between the Guadaíra and Corbones rivers (Figure 1). This area is occupied by urban land and irrigated agricultural fields [19]. Some seasonal/ephemeral riparian wetlands have been discretely reported by local governments, which tried to implement some protection measures due to their degraded state (https://turismo.carmona.org/naturaleza/) (accessed on 12 February 2025). However, little is known about how they formed, what was their maximum extension, why they retreated, and their hydrological function—information essential for proposing plausible measures to restore some of them, when possible.
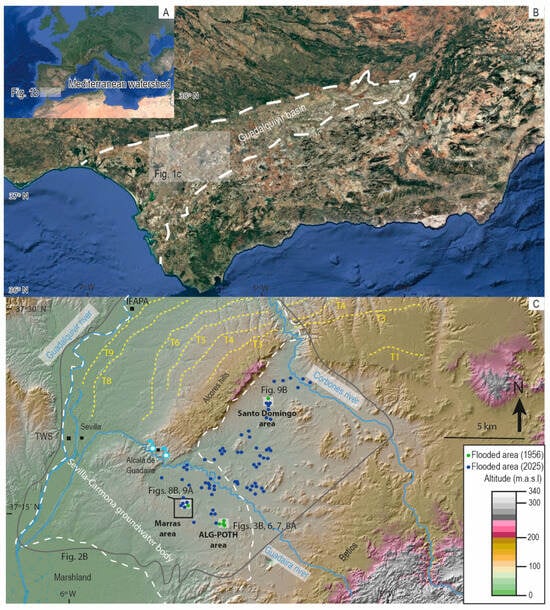
Figure 1.
(A) Study area location in a European context and (B) in the southern Iberian Peninsula, where the Guadalquivir basin is located © Google Earth. (C) Digital elevation map (DEM) together with hill shade of the Alcores Depression. TWS, Tablada weather station. IFAPA, IFAPA Centro Las Torres-Tomejil weather station. T1 to T9 correspond to Guadalquivir terraces, where T1 is the oldest and T9 the youngest one.
Overall, in this study, we combined fieldwork, high-resolution digital elevation models and comparative images from the Spanish Geographical Institute (IGN) to investigate the origin and hydrogeomorphological evolution of described riparian wetlands in the southern Iberian Peninsula. Additionally, we analyzed long-term precipitation and temperature records in Seville (1900–2024), gathered hydrometeorological data since 1990, and modelled the water level dynamics in a representative riparian wetland in the area from 2002 to 2025. This multi-scalar approach aims to understand the main drivers of their degradation and support the design of nature-based strategies for their potential restoration.
2. Regional Framework
The study area is located within the Guadalquivir basin, which is the foreland basin of the Betics orogen (the northern branch of the Gibraltar arc; Figure 1A). The Guadalquivir basin was formed by the lithospheric flexure of the Betics foreland because of the load exerted by this orogenic wedge [20,21,22]. Consequently, maximum sedimentary record is found close to the betic mountain front (approx. 2 km is the maximum thickness according to well data). This basin is filled with shallowing-upward Langhian to Holocene sediments, ranging from marine to alluvial [23,24]. It is composed of sigmoid-shape sequences due to centripetal progradation, which began at 8 Ma at the eastern basin and currently continues in the Gulf of Cádiz [20,23,24].
We focused on a relatively depressed area within the Guadalquivir basin, hereafter referred to as the Alcores Depression (AD; Figure 1). This area, elevated several tens of metres above the current Guadalquivir flood plain, is limited to the northwest and southeast by the Alcores hills and the Betics cordillera foothills, respectively. Its northeast and southwest limits are the Corbones and Guadaíra rivers’ floodplains, respectively. The Alcores hills are a 20 km long, northeast–southwest oriented, tabular relief whose maximum altitude (up to 250 m a.s.l) is observed towards its northeast edge (Figure 1C). This mesa is smoothly dipping towards the NW, and it is sharply truncated towards the southeast by a scarp (Figure 1C). The southeast boundary of the AD is poorly defined in its transition to the Betics foothills. The northeast and southwest boundaries are also marked by altitudinal drops higher than 20 m (Figure 1C).
The rocks that crop out in the studied area belong to the Guadalquivir basin infill. They consist of Miocene to Pliocene marine sediments overlain by Quaternary continental sediments ([25]; Figure 2). Marine sediments correspond to calcarenites, sandstones, and marls. Continental sediments are alluvial conglomerates, clays, and marls (Figure 2). To the northwest of the Alcores hills, these alluvial sediments define a terrace system, younger toward the northwest, related to the Guadalquivir River (Figure 1C). The oldest terraces, Early Pleistocene in age, are approx. 140 m above the current Guadalquivir floodplain ([26]; Figure 1C). In the lower parts of the AD, vertisols develop in association with river deposits. These soils exhibit strong shrink–swell behaviour due to seasonal moisture fluctuations, leading to deep cracks and a highly plastic texture when wet [27]. Conversely, in the higher parts of the Alcores hills (Figure 1C), regosols form over sandstone-derived parent material, marked by a weakly developed profile with limited horizon differentiation. The contrast between these soil types influences land use suitability, with vertisols favouring agricultural activities requiring high water retention, while regosols present challenges for cultivation due to their lower fertility and structural limitations. In addition, vertisols favour the formation of ponds and pools due to their low permeability and flat topography.
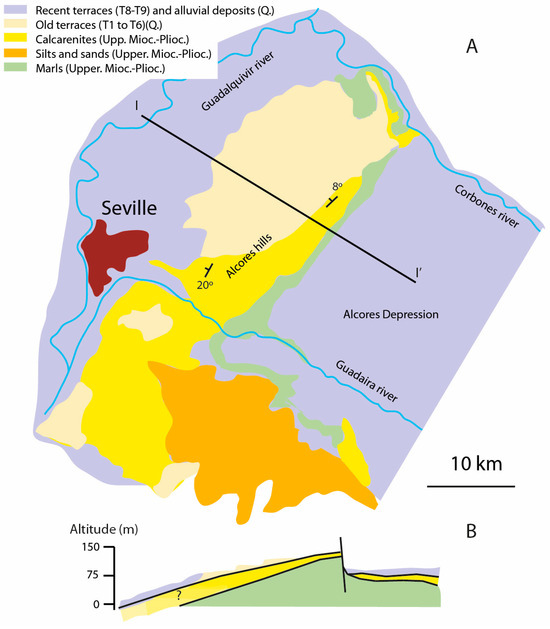
Figure 2.
(A) Geological map and (B) cross-section of the studied area I-I’ oriented. Same location as Figure 1C.
In this area, there are three high-permeability formations that constitute aquifer levels, which form part of the Sevilla-Carmona groundwater body (See Figure 1C for delimitation; [28]). They are upper Miocene–Pliocene calcarenites, gravel and sands, Pleistocene old terraces and Holocene recent terraces (Figure 2). These three aquifer levels are connected, and they have a wide range of thicknesses from 10 m to approx. 50 m [28]. The low-permeability layer beneath the aquifers are the upper Miocene marls (Figure 2B). Although no aquifer is delimitated by regional administration within the AD (see Figure 1C), the upper Miocene calcarenites layer also continues beneath the low permeability sediments in this area. The aquifer’s recharge depends on rainfall infiltration that follows the Mediterranean climate pattern (precipitation mostly concentrates in autumn and spring). Moreover, lateral inflows from other Guadalquivir River tributaries such as the Guadaíra and Corbones rivers may also contribute. The groundwater flow runs from the higher areas (Alcores hills) towards the northwest and southwest, where natural discharge occurs, especially towards the Guadaíra River (Figure 1C). Both Guadaíra and Corbones rivers receive discharge from the aquifers. Intensive exploitation has altered the groundwater flows and the water quality decreased: salinity, nitrates, and other pollutants increased [29,30].
The AD is located in a semi-arid region influenced by the Mediterranean climate, where potential evapotranspiration (>1500 mm) greatly exceeds average precipitation (490 mm/yr on average in Alcalá de Guadaíra from 1991 to 2021; Table 1). Average precipitation is similar in all of the AD, and most of the precipitation is concentrated during winter, due to Atlantic fronts coming from the west (Figure 1C). However, precipitation varies depending on the year from less than 300 mm to more than 600 mm during wet years. Temperatures may exceed 40 °C in summer. The climate is considered as Csa according to the Köppen–Geiger Climate Classification [31].

Table 1.
Climatic parameters in the Alcalá de Guadaíra weather station (location in Figure 1C). Data from 1991 to 2021.
Irrigated agriculture is the main human activity in this area, frequently supplied by groundwater. Moreover, cities with populations greater than 50,000 people such as Alcalá de Guadaíra are present in this area (Figure 1).
3. Methodology
In this section, we explain the methodology used to study the wetlands located in the AD. To do that, we collected climatic parameters, studied images, and performed field work.
3.1. Data Sources
To observe the variations in climatic parameters, we first collected annual precipitation and average temperatures from the last 125 years from the closest weather stations to the study area. We used the Tablada weather station and filled precipitation gaps from the IFAPA Centro Las Torres-Tomejil weather station (see Figure 1C for location of weather stations).
To delve into the flooded areas and wetlands evolution, we used the following: (1) orthophotographs from the IGN (www.ign.es) (accessed on 16 March 2025); (2) historic orthophotographs from the American series (1956–1957), Interministerial (1973–1986), Nacional (1980–1986), Olistat (1997–1998), and SIGPAC (1997–2003); and (3) recent images from PNOA (National Plan of Aerial Orthophotography) from 2004 to 2024. Moreover, we used available Google Earth images from 1950 to 2025.
3.2. Hydrological Analysis
Lake water level modelling has been proven to be an effective tool to predict the evolution of wetlands in the past and during climate change scenarios (e.g., [17]). In our work, we model the water level of one of the best-preserved area (namely ALG-POTH area) from January 2002 to January 2025 (see location in Figure 2). Due to the low permeability of the clays, over which the ponds are formed, we consider a negligible water interchange with the saturated zone of the aquifer, i.e., groundwater net flux (GWNF), recharge or discharge (Figure 3). Then, the water level change (Hs) can be simplified as the following:
Hs = P + BD − O − E
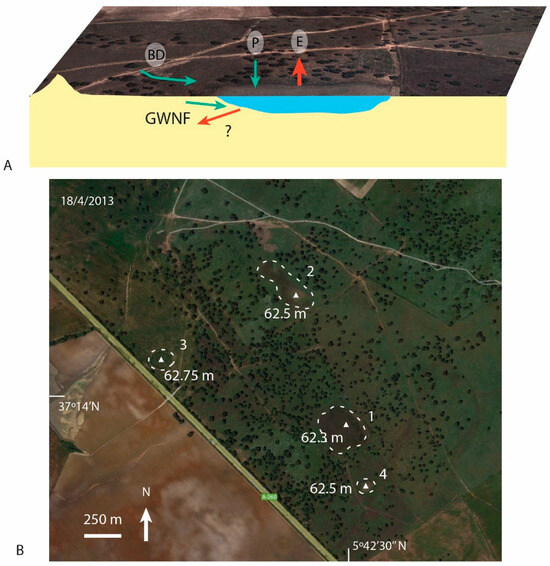
Figure 3.
(A) Hydrogeological model proposed for these wetlands. Red arrows: groundwater recharge. Blue arrows: groundwater discharge. (B) Picture showing the flooded area of wetlands in ALG-POTH area and altitude of their deepest points (location in Figure 1C). GWNF stands for ground water net flux. © Google Earth images.
Water inputs are precipitation (P) and basin discharge (BD) due to run-off or subsurface water discharge from the watershed to the pond. Water outputs are overflow (O) and evapotranspiration (E). Climatic parameters such as P and E are directly obtained from a close weather station: IFAPA Centro Las Torres-Tomejil (see Figure 1C for location). To calculate E, we used potential evapotranspiration (PET) by the Hargreaves method calculated by means of the maximum and minimum temperature records. We corrected these values by multiplying them by 1.15 to calibrate direct evapotranspiration from an open water body, as in previous works [17,32]. BD is calculated by soil–water balance using the TRASERO 3.0 software [33]. We used a water-holding capacity (WHC) of 230 mm and calculated daily series of PET by the Thornthwaite method. Once BD was calculated in mm, we multiplied it by the watershed/average flooded surface relationship (W/AFS) to obtain the increase in water level due to run-off. For water level modelling, we chose the best-preserved area (ALG-POTH area, located in Figure 1C) where 4 water bodies appear during wet periods. For modelling, we used the W/AFS from flooded area 1 of the ALG-POTH area (Figure 1C), which is 10. The maximum depth observed is 1.2 m according to DEM, then it overflows (O) towards the drainage network (Figure 3B). We included this maximum water level in the modelling.
The result of the water balance (Hs) is added to the lake water level of the previous day to obtain the lake water level variation. We modelled the water level from January 2002 until March 2025. In this study, we cannot validate the model due to the lack of monitoring data. We constrained the model with lake pictures showing the presence/absence of water from © Google Earth. To obtain the actual water level, we compared the flooded area with an accurate Digital Elevation Model (DEM) derived it from LiDAR.
We also applied the Hydrological Function Index (HFI) to investigate the hydrological functioning of wetlands. HFI is defined as follows:
where W is the watershed, AFS is the average flooded surface, and effective rainfall corresponds to the BD in the region. HFI usually ranges from 1 to 2 m/yr when the flooded surface is in equilibrium with the effective rainfall produced in its watershed (BD). If the HFI exceeds 2 m/yr, it suggests that the watershed is too large for the flooded surface, suggesting “recharge lakes” or lakes that are altered by groundwater pumping in the watershed or even partially drained. If the HFI is below 1 m/yr, the watershed surface is too small to generate enough water discharge to justify the size of the lake. In this hydrological situation, it could be related to the existence of groundwater discharge coming from a bigger hydrogeological watershed.
We also measured the electrical conductivity (EC) of some of these water bodies from 2024 to 2025. Electrical conductivity increases when there are more ions dissolved in the water. EC in playa-lakes of the southern Iberian Peninsula ranges from 0.3 to 10 mS/cm, meaning brackish waters.
3.3. Structural Analysis
Active tectonics may affect the nucleation or disappearance of wetlands but also can modify them by reducing or enhancing their flooded area [34,35]. Consequently, to improve the hydrogeological model of the studied wetlands and to investigate the AD inception, we have defined the geometry and kinematics of structures that deform recent sediments (upper Miocene or younger rocks). We especially focused on the faults that control the Alcores range boundaries.
3.4. Land Use
To investigate changes in the land use, we utilized 1:25,000-scale maps of uses and soil cover from REDIAM, 2025. These maps were made by using historical pictures from 1956, 1977, 1984, 1999, 2003, and 2007.
4. Results
4.1. Climatic Parameters
Figure 4 shows the evolution of the annual precipitation and annual average temperature from 1900 to 2024. The average annual air temperature for the studied period is 18.52 °C, but it shows significant oscillations from lower than 17 °C up to more than 20 °C. When studying the temperature tendency for all the studied periods, we observe an increase of 0.015 °C/year with a correlation coefficient of 0.5 (Figure 4). Nevertheless, we do not observe increases in the annual air temperature during the 1900–1950 period (R2 = 0.01). This increase started after 1960 and is especially remarkable after 2000, when average temperatures surpassed 20 °C four times (Figure 4). The annual average temperature from 2000 to 2023 is 19.38 °C. The increase in evaporation rates is directly associated with the increase in temperature.
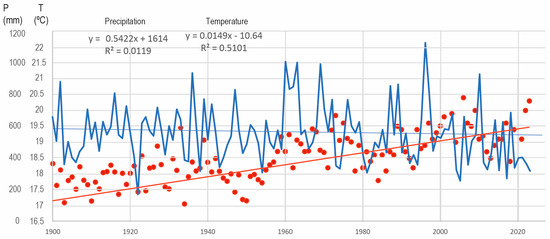
Figure 4.
Annual average temperatures (red colour) and annual precipitation (blue colour) in Seville from 1900 to 2024.
Annual average precipitation for the 124 years is 550 mm/yr, although its trend shows sharp oscillations between less than 300 mm/yr and more than 1000 mm/yr (Figure 4). There is no significant trend in the precipitation series (Figure 4). However, there is a relatively dry period after 2000, when annual precipitation seems to draw a downward trend (Figure 4). Average precipitation from 2000 to 2023 is 473 mm/yr. Moreover, a long dry period from 2020 to 2024 with precipitation lower than 400 mm/yr has been detected.
4.2. Post-Pliocene Structures
In this section, we focused on the structures responsible of the AD nucleation, especially on those responsible for the Alcores hills uplift. The flat tops of the Alcores hills are defined by upper Miocene to Pliocene calcarenites strata that dip slightly toward the northwest, between 5° and 25° (Figure 2). The sharp escarpment of more than 100 m that interrupts this relief to the southeast is conditioned by a northeast–southwest fault zone that widens towards the southwest. Fault surfaces are steeply dipping, usually toward the southeast, and exhibit slicken lines with pitches ranging from 30°, to 70°, usually to the southwest. All these data together with observed kinematic criteria show that it is a dextral–normal fault zone, descending the southeast hanging wall, where the AD is located (Figure 5). Pliocene sands and calcarenites show synsedimentary structures related to faults such as bed thickening in the hanging wall. In plan view, the main escarpment draws step-like offsets generated by two fault sets, which are oriented northwest–southeast and north–northwest–south–southeast, respectively. They are mainly normal faults, (Figure 5B) and are probably responsible for the topographic descent of the hills toward the southwest. In this respect, the northeast boundary of the hill, defined by a west–northwest–east–southeast fault escarpment, is higher than 200 m, whereas its southwest limit is below 100 m altitude (Figure 5A). Although the low cohesion of sediments in this area did not allow us to measure fault surfaces, this escarpment is probably controlled by the west–northwest–east–southeast fault zone.
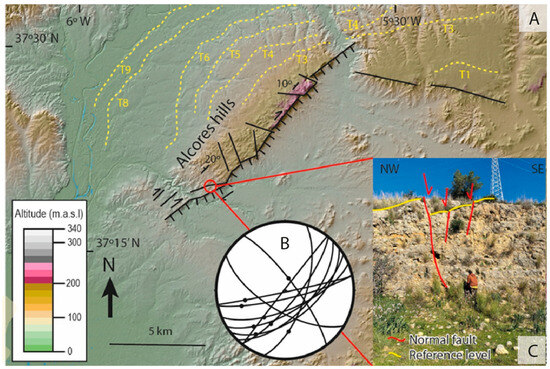
Figure 5.
(A) Structural map of the Alcores hills, (B) Stereoplot of faults and (C) representative picture of normal faults. Same location as Figure 1C.
4.3. Flood-Prone Areas Characterization
Within the AD, we have observed many areas subjected to flooding, between the Corbones and Guadaíra floodplains. Both rivers and their tributaries in this area show meandering courses where sedimentary processes prevail over erosion. In the aerial picture of 1956, 76 flooded areas can be delimited (see Figure 1C). However, most of them disappeared in the following pictures from 1977 and 1984. We observed that only 6 flooded during the wet months during 2025 (Figure 1C). These ecosystems are located from 40 m a.s.l. in the southwest part of the AD, close to the Guadaíra floodplain, up to 80 m a.s.l., close to the Corbones floodplain (Figure 1C). They lie on low-permeability rocks such as upper Miocene to Quaternary clays and marls. Their watershed shows a smooth topography, and the differences in altitude within the watersheds are from 2 to 5 m (Figure 6). Flooded areas vary from some m2 up to 5 hm2 observed in one of the flooded areas in 1956. Remaining flooded areas significantly change through decades. In general, they are shallow water bodies, up to 1.5 m depth, then they overflow towards the drainage network.
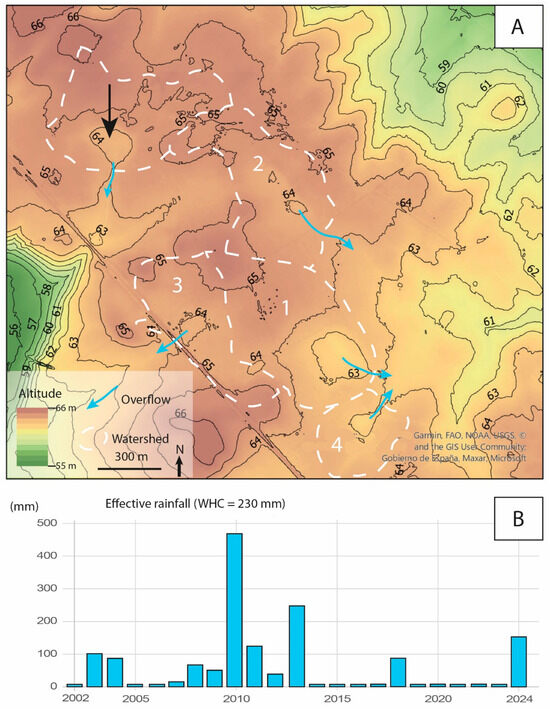
Figure 6.
(A) Accurate LiDAR of the ALG-POTH area showing the watershed areas. Blue arrows show overflows to the drainage network. Black arrows show a closed watershed without flooded area. Dashed white line means endorheic watershed (B) yearly effective rainfall calculation from 2002 to 2024.
We observed three areas where these ecosystems endure: (1) ALG-POTH area, conditioned by a forest and livestock use; (2) Marras area, close to an urban area; and (3) Santo Domingo area, dominated by agriculture land use (see Figure 1C for locations).
These wetlands are not degraded, their hydrology is in natural regime, in the ALG-POTH area, therefore we used them for water level modelling. Average flooded areas are quite small, except for water body 1, which surpasses 1.5 hm2 (Table 2). We calculated the watershed area by LiDAR images (Figure 6). Closed watersheds range from 5 to 18 hm2 and they show a smooth topography. Interestingly, we detected a closed watershed without flooded area (black arrow; Figure 6A). We obtained values of W/AFS relationships higher than 20 in water bodies 2, 3, and 4, while it is 10 for water body 1. We calculated the effective rainfall from January 2002 to March 2025 by soil water balances in the ALG-POTH area, obtaining an average effective rainfall of 62.5 mm/yr (Figure 6 and Table 2). Annual effective rainfall varies from 0 during dry years to more than 200 mm during extremely wet years (Figure 6B). With this data, we obtained HFI values higher than 2, except for water body 1 (Table 2). Thus, HFI shows that the water resources associated with the watershed size are not in equilibrium with water bodies. This means that these water bodies must recharge the aquifer, at least during some periods. Water body 1 remains in equilibrium during the studied period, so we used it for water level modelling. Measurements of EC in water bodies 1 and 3 are lower than 300 µS/cm, which values are close to the rainwater EC (Table 2). This is coherent with recharge water bodies, as the salts have a way out through infiltration processes.
Table 2.
Morphometric and hydrogeological parameters of the studied water bodies in the ALG-POTH area. AFS: Average flooded area. W: Watershed. MFA: Maximum flooded area.
Figure 7 shows the results from the water level modelling applied to water body 1 in the ALG-POTH area. Evaporation rates are higher than 1.5 m/yr, and the maximum water level is 1.2 m when it overflows to the drainage network. The water surplus overflows to the drainage network and finally to the Guadaira River (Figure 1C). The water level sharply drops every summer until it dries up, independently of the precipitation. It dries even in 2010 when effective rainfall is higher than 450 mm (Figure 6B and Figure 7). It behaves as a seasonal water body during wet years with significant effective rainfall (e.g., 2011/2012), whilst it behaves as an ephemeral water body during dry years (e.g., 2020–2023; Figure 7). However, no vegetation related to wetlands developed, probably due to the livestock activity (cattle farming). Land use maps from 1956 to 2007 do not show significant changes during these decades. We observed an increase in woodland at the expense of dry farmland. Water body 1 is listed as a playa-lake (Figure 8A).
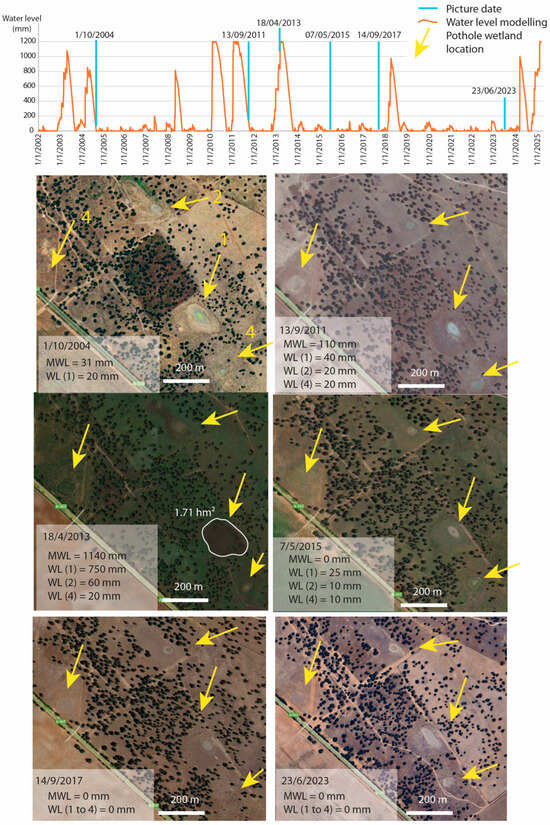
Figure 7.
Water level modelling from 2002 to 2025 of the water body 1 in the ALG-POTH area and comparisons with © Google Earth images. Yellow arrows show the location of pothole wetlands.
As we explained in the Methodology section, we estimated the actual water level by using © Google Earth images and an accurate Digital Elevation Model (DEM) derived from LiDAR. We used these data to constrain the modelling. We observed that the modelled data fit very well with the water level of the water body 1 estimated by images (Figure 7). As mentioned before, water bodies 2, 3, and 4 remained dry or close to dry even during wet periods. Water body 3 was completely dry during the studied period. Water bodies 2 and 4 acted as ephemeral water bodies whose maximum depth does not seem to reach 10 cm (Figure 6B and Figure 7). Although there is a good correlation between modelling and actual data, the modelled water level is frequently higher than the actual data obtained by images (Figure 7). Consequently, water body 1 may also lose water.
To study the reduction in the flooded area of these ecosystems during the 20th century, we studied the Marras and Santo Domingo areas. To do that, we compared historical pictures, especially that one from the American flight (1956), made in summer, with a PNOA picture in 2013, which corresponds with a wet year (Figure 9). We also analyzed land use maps from 1956 and 2007 (Figure 8).
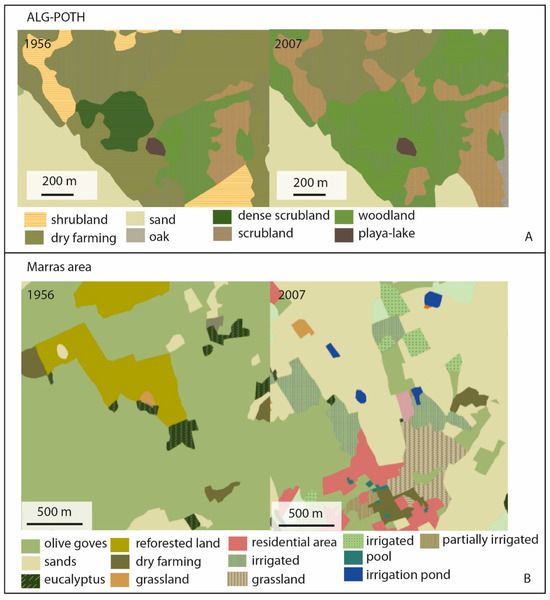
Figure 8.
Land use maps from 1956 to 2007 in (A) ALG-POTH area and (B) in Marras area [36].
In the Marras area, we observed five flooded areas wider than 1 hm2 in 1956, being 5 hm2 the biggest one (Figure 9A). At this time, they already showed a significant state of degradation by the construction of agriculture channels. Some of these areas were partially affected by artificial drainages with the purpose of drying them up. To drain the biggest flooded area, 2.6 hm2 of eucalyptus were planted at its southwest boundary, and they were removed between 2003 and 2007, according to the REDIAM land use visor (Figure 8B and Figure 9A). Eucalyptus sp. has been traditionally used in the Iberian Peninsula to dry wetlands (e.g., Doñana during the 20th century; [37]), but their effects impact soil ecosystems [38]. The main land use was extensive agriculture, especially olive-growing, and the space between trees was 15 m. These water bodies progressively degraded up to 2013, when most of them had disappeared and one of them converted into a water irrigation pond (Figure 8B and Figure 9A). The biggest flooded area, which has been used as a landfill since 2000, flooded during 2013, although its flooded area reduced from 5 hm2 to 1.4 hm2 (Figure 9A). Olive growth continues as the main land use, but in intensive production (space between trees reduced to less than 5 m). Many fields converted to irrigated lands (Figure 8B). Moreover, residential developments significantly grew to the south of this area as second homes for people from urban zones (Figure 8B). Many private swimming pools have also been detected. Consequently, these residential developments have water consumption supplied by groundwater. From 2013, the remaining water body only flooded during exceptional precipitation events, and it quickly dried. Irrigation concessions for agriculture granted by the Guadalquivir Confederation have played a significant role in supporting such important activity in Andalusia. These concessions have not increased since 2005, although intensively irrigated lands have increased significantly [39]. Growing groundwater abstraction by both legal but also illegal wells has contributed to the degradation of aquatic ecosystems in Andalusia since the past XXth century. This issue is particularly evident in areas like Doñana [40] and other wetlands, where excessive groundwater extraction has led to severe environmental damage [41].
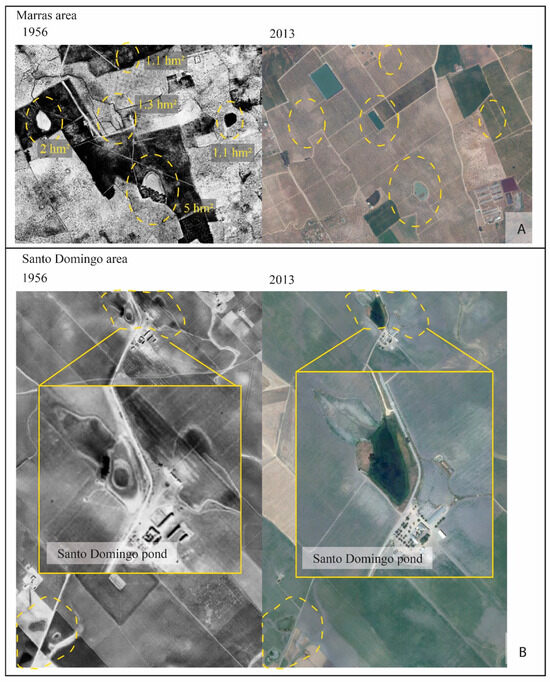
Figure 9.
Comparison between pictures from 1956 and 2013 in the Marras (A) and Santo Domingo areas (B) [42].
In the Santo Domingo area, some areas flooded during wet years from 1956 until 2025. There is a big, flooded area called the Santo Domingo Pond, whose maximum size is approx. 1.5 hm2, and others to the south, whose size is less than 0.5 hm2 (Figure 7). Even though the Santo Domingo Pond probably nucleated as a natural wetland, in 1956 it was already artificially over-excavated, probably to increase its hydroperiod during dry periods. Small, flooded areas have not been modified during these decades but only flooded during exceptionally wet years, such as 2013 (Figure 9B). The main land use is cropland, and we observed that the Santo Domingo Pond has nowadays an environmental use for avian fauna. In October 2024, we measured an EC of 460 µS/cm, and we observed an artificial discharge of freshwater into the pond through a ditch in its northern part (see Figure 9B). The topography of the pond is completely modified, and the maximum depth is probably more than 2 m. In 2020, vegetation of Tamarix sp. started to grow surrounding this pond. It is the only flooded area in the AD that shows this type of vegetation typical of wetlands with natural functioning in the southern Iberian Peninsula. Santo Domingo Pond is a space of natural interest for local administration (https://turismo.carmona.org/naturaleza/) (accessed on 1 March 2025).
5. Discussion
5.1. Alcores Depression Inception
The AD developed as a part of the Guadalquivir basin from the Tortonian to the Pliocene, the emersion of which probably occurred from the Pliocene onward [26,43].
The northwest-ward migration of the river is supported by the occurrence of a markedly asymmetric terrace system, progressively younger toward the northwest. These terraces are probably currently uplifted and tilted, both on the northwest slope of the Alcores hills and constituting the northeast limit of the AD (Figure 1C and Figure 5). In the Guadalquivir basin 14 terraces have been dated [44] T1–T4 are probably early Pleistocene (>0.78 Ma; [45]). Terrace level T6 is attributed to an age range of 0.78 to 0.18 Ma and the middle Pleistocene to late Pleistocene boundary is placed between T10 and T12; [46]). Interestingly, recent chronological studies from two terraces located at 30 m and 50 m above the current river yield the same age: 0.09 + 0.03/−0.02 Ma ([47]). However, it could also be explained by the quick northwest-ward migration of the Guadalquivir River.
The ages of the oldest terraces suggest that the Alcores area (i.e., AD and Alcores hills) uplift would have not started at least until the early-middle Pleistocene. This uplift must have been operating until very recent times, even still, as the youngest terraces deposited during the Holocene also show a northwest-ward Guadalquivir River movement (Figure 1C and Figure 5).
The AD subsidence with respect to the surrounding area might have been favoured by the Alcores hills uplift, mainly accommodated by southwest–northeast faults. Additionally, the northeast boundary of the AD is formed by the oldest terraces, located at approx. 100 m above the AD floor, suggesting a pre-Pleistocene uplift (Figure 1C and Figure 5). Because of the low rock cohesion (marls) in this boundary, the nature of this boundary remains unclear. However, previous works, based on geomorphic criteria, have suggested the tectonic subsidence of the Corbones watershed [48]. This boundary has a similar orientation to the normal faults controlling the northeast boundary escarpment of the Alcores hills (Figure 5). Thus, this boundary might be potentially conditioned by west–northwest–east–southeast normal faults throwing the south–southwest block down. The southeast boundary is controlled by the rough topographic envelope of the Betics towards the northwest (Figure 1C). Some hills probably emerged during the Pliocene as an archipelago, and all this boundary had emerged prior to the Alcores hills emersion. The southwest boundary is a few dozens of metres above the AD and no terraces were deposited, so it is difficult to constrain its uplift (Figure 1C and Figure 5).
Once the AD individualized, both the Guadaíra River, to the southwest, and the Corbones River, to the northeast, started to drain this area. The oldest terraces from these rivers date from the middle-upper Pleistocene (e.g., [49]). These rivers acted as natural corridors for hominids from the Betics chain to the Guadalquivir basin [49,50]. Nevertheless, this area was probably never completely drained by the drainage network because of the following: (1) presence of low-permeable sediments such as clays and (2) low topography with respect to the AD boundaries. These features favoured the inception of endorheic watersheds that host small water bodies. Recurrent wetter periods during the Pleistocene (e.g., [51,52]) probably conditioned the higher number and extended hydroperiod of these water bodies during the Pleistocene.
5.2. Pothole Wetlands’ Hydrological Functioning and Degradation
The presence of riparian wetlands in the AD has never been studied. In this work, we observed the presence of many water bodies smaller than 5 hm2 in size. They are shallow (up to 1.5 m), which determines their seasonal/ephemeral hydroperiod. We applied the water level modelling validated in other wetlands in the southern Iberian Peninsula (e.g., [17,32]). This model does not consider a net recharge of surface water to the aquifer, as the water balance is simplified into precipitation and water surplus of the soil water balance in the watershed (run-off and subsurface groundwater) as water inputs and only evaporation and evapotranspiration as water output (Figure 3). In this case, because of the lack of water level monitoring, we used pictures and LiDAR images to infer the actual water level (Figure 6 and Figure 7). During the studied period from 2002 to 2025, most wetlands remained dry most years, except for one located in the ALG-POTH area. When water level modelling is compared with actual data, we observed that the water level expected from the model is frequently higher than actual data (Figure 7). These data suggest that an amount of water could be recharging the aquifer via infiltration. Consequently, they could be classified as recharge wetlands. This is a very important finding, because most Andalusian countryside wetlands are discharge water bodies [17]. Water conductivity data below 500 µS/cm measured during 2024 and HFI values usually higher than 2 also support this hypothesis (Table 2). Thus, although these wetlands lie on low-permeability rocks such as clays and marls, some groundwater–wetlands connection is present. This hydrological functioning is similar to pothole lakes described in other areas such as North America [53,54] and northern Europe (e.g., [55,56]). Consequently, these ecosystems located in the AD may be defined as pothole wetlands. Again, this is the first time that these small wetlands with a degree of groundwater–wetlands connections are characterized in the southern Iberian Peninsula.
Nowadays, five pothole lakes are preserved, all of them with a high degree of degradation (Figure 1C). However, DEMs and historical ortho-pictures suggest the presence of more than 100 pothole lakes at the beginning of the 20th century (76 in 1956; Figure 1C). The flooded areas of remaining pothole lakes reduced between 50% and 80%. In this work, we characterized the main factors that control the pothole wetlands degradation. First, agriculture has intensively modified the surface, especially during the 20th century [57]. Most flooded areas were drained by channels and ditches and immediately cultivated; others were converted into irrigation pools (Figure 9A). Moreover, agricultural mechanization favours erosion and clogging of flooded areas. Interestingly, the best-preserved pothole lakes are located in a pastureland used for grazing (Figure 7 and Figure 8A). During the last decades, urban development together with groundwater withdrawal has boosted the pressure and disappearance of these wetlands (Figure 8B). A minority of wetlands were modified by increasing their depth or water inputs to raise their hydroperiod for ecological purposes (e.g., Santo Domingo; Figure 9B). Climate also plays a crucial role in the pothole wetlands degradation. Temperatures have progressively risen during the last century, increasing evaporation from the water bodies (Figure 4). Additionally, the reduction in precipitation, especially in the 21st century, has lowered the effective rainfall up to 0 mm during dry years (Figure 6). Without effective rainfall, these wetlands remain dry all year (Figure 6 and Figure 7) favouring the reclamation of new plots for agriculture (see [41]). Climate change scenarios in the southern Iberian Peninsula foresee changes in precipitation patterns, increasing extreme precipitation events followed by long dry periods. This has implied a reduction in the wetland hydroperiod, as has been recently reported in other Andalusian playa-lakes [32].
Although the current degradation state of these pothole wetlands, they constitute an essential link within the Mediterranean ecosystems. Pothole wetlands are true “nature-based solutions” due to their ability to provide multiple ecological and socioeconomic benefits. These wetlands not only enhance aquifer recharge but also act as carbon sinks, helping to mitigate climate change. Additionally, they offer crucial habitats for biodiversity, including flora and fauna species that depend on these ecosystems for survival. Implementing measures to restore topography and vegetation in these areas can increase their capacity to store water and improve water quality, benefiting both wildlife and human communities. By controlling land uses near the wetlands, pollution and habitat degradation can be reduced, ensuring that these ecosystems continue to provide essential services. In summary, pothole wetlands are a natural solution that can help address environmental challenges and improve the resilience of semi-arid regions. To do that, local and regional governments should try to implement measures to control land uses close to pothole wetlands.
5.3. Comparisons with Other Pothole Wetlands and Managerial Implications
In this section, we compare the pothole wetlands studied in the southern Iberian Peninsula with prairie pothole lakes studied in North America and Europe. Pothole lakes are defined as small, often circular depressions filled with water frequently grouped into a chain of pools (e.g., [58]). They are usually found in regions of glacial activity, where the past erosion due to glacier movement resulted in the formation of depressions in the ground [59]. Our studied pothole wetlands show similar features, but the origin of depressions has no glacial origin. In the southern Iberian Peninsula, a warm climate prevailed during the Pleistocene–Holocene [60,61].
Pothole lakes behave as recharge lakes, and a certain amount of water recharges the aquifer, reducing their hydroperiod into seasonal [62]. However, their hydrological functioning may change depending on climate [63]. In our work, we observed that they act as recharge systems. However, some of them could behave as flow-through lakes (e.g., wetland 1; Figure 7). The formation of pothole lake areas is associated with landscapes with low topographic gradients, low infiltration rates, and low stream density [64]. In our work, the formation of an area with low topographic gradients is favoured by the Alcores hills uplift, which controls the formation of the AD (Figure 5). This uplift is controlled by geological structures that have been active during the Pleistocene onwards. Both Guadaira and Corbones rivers show thick alluvial deposits when they cross the AD (Figure 2). The ephemeral-seasonal hydroperiod of the studied wetlands is similar to those observed in other pothole lakes in northern America [65].
Finally, remarkable is the high sensitivity of these ecosystems to human mismanagement and climate change [66]. Due to the low salinity, these flooded areas may quickly change into agriculture fields (Figure 9). Previous works already pointed out the importance of agriculture practices in the preservation of pothole lakes [67]. We observe in this work that livestock activities have favoured the wetland preservation in some areas (Figure 8). Because of that, some protection zones that include the hydrological watershed could be implemented to preserve these pothole wetlands, as it is made in other wetlands in the southern Iberian Peninsula (e.g., [41]). Climate change provokes strong effects in these ecosystems, as in other wetlands. Nevertheless, previous works agree with our results in the importance of these ecosystems in the water resources management when the climate is changing [68].
6. Conclusions
This study investigates pothole wetlands in the Alcores Depression (AD), located in the southern Iberian Peninsula. We identified over 100 ancient, closed watersheds; 95% of them nowadays have disappeared. Using a variety of satellite images and hydromorphological tools, we analyzed their nucleation, evolution, and recent anthropic degradation. Our observations indicate a dramatic reduction in the flooded area from the 1950s to 2025. The AD inception due to the uplifting during the Quaternary favoured the formation of pothole wetlands in the floodplain. The reduction in hydroperiod and wetland degradation was primarily due to agricultural expansion before 1950, altering the original topography. One of the findings of this study is that these prairie potholes are important for enhancing groundwater recharge. Recently, decreased precipitation has exponentially accelerated the degradation and even the complete disappearance of many potholes. This study underscores the fragility of small wetlands in the Mediterranean basin and the critical role of human mismanagement in their preservation. Restoring these ecosystems, good agricultural practices and the declaration of protection areas could be a highly effective nature-based solution, especially in semi-arid climates like southern Spain. The weak point of this work is the lack of accurate data series. For future investigations, climatic parameters should be collected daily, a water level monitoring must be implemented in some of these wetlands, as well as the acquisition of other parameters such as water conductivity. This monitoring could help to delve into the evolution of these wetlands.
Author Contributions
Conceptualization, A.J.-B. and M.R.-R.; methodology, A.J.-B., M.R.-R. and I.E.; validation, J.L.Y. and F.G.; formal analysis, A.J.-B., M.R.-R. and F.G.; investigation, A.J.-B., M.R.-R., J.L.Y., I.E. and F.G.; data curation, M.R.-R. and A.J.-B.; writing—original draft preparation, A.J.-B. and M.R.-R.; writing—review and editing, F.G., J.L.Y., I.E.; visualization, M.R.-R. and A.J.-B.; supervision, M.R.-R., I.E. and F.G.; project administration, M.R.-R., I.E. and F.G.; funding acquisition, M.R.-R., I.E., F.G. and A.J.-B. All authors have read and agreed to the published version of the manuscript.
Funding
This study was supported by the following: (1) Tectonic conditioning and climate change effects on the hydrogeological evolution of wetlands and playa-lakes in the southern Spain research project (University of Pablo de Olavide); (2) GYPCLIMATE research project (PID2021-123980OA-I00) Spanish Ministry of Economy and Competitiveness—Regional Development European Fund (FEDER); (3) the PGC2018-100914-B-I00 project, funded by the Ministerio de Ciencia e Innovacíon (Spanish Government)/AEI/10.13039/501100011033/ERDF; (4) the UPO-1259543 project, funded by the Consejería de Economía, Conocimiento, Compañías y Universidad (Andalusian Government)/ERDF; and (5) “Monitorizacion hidrológica y modelización de la relación laguna-acuífero en los mantos eólicos de Doñana. Seguimiento y ampliación del inventario” (Agreement between the Guadalquivir River Basin Authority and the University Pablo de Olavide). F.G. acknowledges the Ramón y Cajal fellowship, RYC2020-029811-I, and the PPIT-UAL grant, Junta de Andalucía-FEDER 2022–2026 (RyC-PPI2021-01).
Data Availability Statement
The original contributions presented in this study are included in the article. Further inquiries can be directed to the corresponding authors.
Conflicts of Interest
The authors declare no conflicts of interest.
References
- Bennett, K.D.; Tzedakis, P.C.; Willis, K.J. Quaternary Refugia of North European Trees. J. Biogeogr. 1991, 18, 103–115. [Google Scholar] [CrossRef]
- Barker, G. The Agricultural Revolution in Prehistory: Why Did Foragers Become Farmers? Oxford University Press: Oxford, UK, 2006. [Google Scholar]
- Di Angelo, L.; Di Stefano, P.; Guardiani, E.; Morabito, A.E.; Pane, C. 3D Virtual Reconstruction of the Ancient Roman Incile of the Fucino Lake. Sensors 2019, 19, 3505. [Google Scholar] [CrossRef] [PubMed]
- Erdoğan, S. Archaeological sites and historic buildings in Turkish wetlands. In Culture and Wetlands in the Mediterranean: An Evolving Story; Med-INA: Athens, Greece, 2011. [Google Scholar]
- Zittis, G.; Almazroui, M.; Alpert, P.; Ciais, P.; Cramer, W.; Dahdal, Y.; Fnais, M.; Francis, D.; Hadjinicolaou, P.; Howari, F.; et al. Climate Change and Weather Extremes in the Eastern Mediterranean and Middle East. Rev. Geophys. 2022, 60, e2021RG000762. [Google Scholar] [CrossRef]
- Guardiola-Albert, C.; Jackson, C.R. Potential Impacts of Climate Change on Groundwater Supplies to the Doñana Wetland, Spain. Wetlands 2011, 31, 907–920. [Google Scholar] [CrossRef]
- Kalettka, T.; Rudat, C.; Quast, J. Potholes in Northeast German agro-landscapes: Functions, land use impacts, and protection strategies. In Ecosystem Approaches to Landscape Management in Central Europe, Ecological Studies; Springer: Berlin/Heidelberg, Germany, 2001; pp. 291–298. [Google Scholar]
- González-Sampériz, P.; Valero-Garcés, B.; Moreno, A.; Jalut, G.; García-Ruiz, J.; Martí-Bono, C.; Delgado-Huertas, A.; Navas, A.; Otto, T.; Dedoubat, J. Climate variability in the Spanish Pyrenees during the last 30,000 yr revealed by the El Portalet sequence. Quat. Res. 2006, 66, 38–52. [Google Scholar] [CrossRef]
- Carrión, J.S.; Ochando, J.; Michelangeli, F.; Jiménez-Espejo, F.; Ojeda, F.; Amorós, G.; Munuera, M.; Marín-Arroyo, A.B.; González-Sampériz, P.; Rodríguez-Vidal, J.; et al. Tracing 40,000 years of vegetation change in the Baetic-Rifan biodiversity hotspot. Rev. Palaeobot. Palynol. 2024, 331, 105202. [Google Scholar] [CrossRef]
- Gómez, A.; Lunt, D.H. Refugia within refugia: Patterns of phylogeographic concordance in the Iberian Peninsu-la. In Phylogeography of Southern European Refugia: Evolutionary Perspectives on the Origins and Conservation of European Biodiversity; Springer: Berlin/Heidelberg, Germany, 2007; pp. 155–188. [Google Scholar]
- Abellán, P.; Svenning, J.-C. Refugia within refugia—Patterns in endemism and genetic divergence are linked to Late Quaternary climate stability in the Iberian Peninsula. Biol. J. Linn. Soc. 2014, 113, 13–28. [Google Scholar] [CrossRef]
- Gómez-Sal, A.; Bonet, A.; Saldaña-López, A.; Muñoz-Rojas, J. Landscape ecology and landscape approaches in the Iberian context: Challenges, opportunities, and future prospects. Landsc. Ecol. 2024, 39, 1–21. [Google Scholar] [CrossRef]
- Abellán Contreras, F.J. Consideraciones Histórico-Jurídicas Sobre El Saneamiento de Terrenos Pantanosos, Lagunas y Marismas en España (SS. XIX–XX): Exégesis de la «Ley Cambó»; Junta de Castilla y León: Valladolid, Spain, 2022.
- Díaz, J.A.R.; Poyato, E.C.; Luque, R.L. Applying benchmarking and data envelopment analysis (DEA) techniques to irrigation districts in Spain. Irrig. Drain. 2004, 53, 135–143. [Google Scholar] [CrossRef]
- Expósito, A.; Berbel, J. Agricultural Irrigation Water Use in a Closed Basin and the Impacts on Water Productivity: The Case of the Guadalquivir River Basin (Southern Spain). Water 2017, 9, 136. [Google Scholar] [CrossRef]
- De la Fuente, A.F.; de Andalucía, J. Amenazas sobre los paisajes y actividades salineras del suroeste español por el cambio climático. PH Boletín Del Inst. Andal. Del Patrim. Histórico 2021, 29, 409–412. [Google Scholar] [CrossRef]
- Rodriguez-Rodriguez, M.; Martos-Rosillo, S.; Pedrera, A. Hydrogeological behaviour of the Fuente-de-Piedra playa lake and tectonic origin of its basin (Malaga, southern Spain). J. Hydrol. 2016, 543, 462–476. [Google Scholar] [CrossRef]
- De la Fuente, A.F. Ocaso y resurrección de los Humedales del complejo endorreico de las llanuras esteparias sevillanas. Écija y Osuna: Tierra de lagunas. Cuad. De Los Amigos De Los Museos de Osuna 2018, 20, 164–174. [Google Scholar]
- Ales, R.F.; Martin, A.; Ortega, F.; Ales, E.E. Recent changes in landscape structure and function in a mediterranean region of SW Spain (1950–1984). Landsc. Ecol. 1992, 7, 3–18. [Google Scholar] [CrossRef]
- Roldán, F.J.; García Cortés, A. Implicaciones de materiales triásicos en la depresión del Guadalquivir, Cordilleras Beticas, Provincias de Cordoba y Jaen. In Congreso Geológico de España. 2; Sociedad Geológica de España: Salamanca, Spain, 1998; pp. 189–192. [Google Scholar]
- Vera, J.A. (Ed.) Geología de España; IGME: Madrid, Spain, 2004. [Google Scholar]
- Garcia-Castellanos, D.; Fernàndez, M.; Torne, M. Modeling the evolution of the Guadalquivir foreland basin (southern Spain). Tectonics 2002, 21, 9-1–9-17. [Google Scholar] [CrossRef]
- Sierro Sánchez, F.J.; González Delgado, J.Á.; Dabrio González, C.J.; Flores Villarejo, J.A.; Civis Llovera, J. The Neogene of the Guadalquivir Basin (SW Spain); Sociedad Geológica de España: Salamanca, Spain, 1990. [Google Scholar]
- Braga, J.C.; Martín, J.M.; Aguirre, J.; Baird, C.D.; Grunnaleite, I.; Jensen, N.B.; Puga-Bernabéu, A.; Sælen, G.; Talbot, M.R. Middle-Miocene (Serravallian) temperate carbonates in a seaway connecting the Atlantic Ocean and the Mediterranean Sea (North Betic Strait, S Spain). Sediment. Geol. 2010, 225, 19–33. [Google Scholar] [CrossRef]
- Roldán, F.J.; Rodríguez-Fernández, J.; Villalobos, M.; Lastra, J.; Díaz-Pinto, G.; Pérez Rodríguez, A.B. Zonas: Subbético, Cuenca del Guadalquivir y Campo de Gibraltar. In GEODE. Mapa Geológico Digital Continuo de España. Sistema de Información Geológica Continua: SIGECO; Navas, J., Ed.; IGME: Madrid, Spain, 2012; Available online: https://info.igme.es/cartografiadigital/datos/geode/docs/GEODE_INFO.pdf (accessed on 1 December 2024).
- Moral, F.; Balanyá, J.C.; Expósito, I.; Rodríguez-Rodríguez, M. Análisis geomorfológico de las terrazas fluviales del Bajo Guadalquivir e implicaciones tectónicas. Geogaceta 2013, 54, 143–146. [Google Scholar]
- Gómez-Miguel, V.D.; Badía-Villas, D. Soil distribution and classification. In The Soils of Spain; Springer International Publishing: Cham, Switzerland, 2015; pp. 11–48. [Google Scholar]
- IGME-Diputación de Sevilla. Atlas Hidrogeológico de la Provincia de Sevilla; IGME: Madrid, Spain, 2003. [Google Scholar]
- Gonzalez Vazquez, J.C.; Grande Gil, J.A.; Barragan de la Rosa, F.J.; Jimenez Sanchez, J.C. Characterisation of the nitrate contamination process in the Seville-Carmona aquifer system; Caracterizacion del proceso de contaminacion por nitratos en el sistema acuifero Sevilla-Carmona. Tecnol. Del Agua 1998, 175, 40–49. [Google Scholar]
- Grande, J.A.; De La Torre, M.L.; Vázquez, J.C.G.; Barragán, F.J.; Ocaña, J.A. Nitrate Accumulation and Other Components of the Groundwater in Relation to Cropping System in an Aquifer in Southwestern Spain. Water Resour. Manag. 2005, 19, 1–22. [Google Scholar] [CrossRef]
- Essenwanger, O.M. General Climatology 1C: Classification of Climates. (No Title); Elsevier: Amsterdam, The Netherlands, 2001. [Google Scholar]
- Jiménez-Bonilla, A.; Rodríguez-Rodríguez, M.; Yanes, J.; Gázquez, F. Impact of climate change on permanent lakes in a semiarid region: Southwestern Mediterranean basin (S Spain). Sci. Total. Environ. 2025, 961, 178305. [Google Scholar] [CrossRef]
- Rodríguez-Hernández, L.; Hernández-Bravo, J.C.; Fernández-Mejuto, M. Processing and Management of Hidrologic Time Series: User Manual: Application, TRASERO; Diputación de Alicante, Ciclo Hídrico: Alicante, Spain, 2007.
- Barredo, S.P. Geodynamic and tectonostratigrafic study of a continental rift: The Triassic Cuyana Basin, Argentina. In Tectonics-Recent Advances; IntechOpen: London, UK, 2012. [Google Scholar]
- Camuera Bidaurreta, J. Climate and Environmental Change in Southern Europe–The Paleoecological Record of Padul, Sierra Nevada (Western Mediterranean, Southern Iberian Peninsula). Ph.D. Thesis, Universidad de Granada, Granada, Spain, 2019. [Google Scholar]
- Red de Información Ambiental de Andalucía (REDIAM). Characterization of Vegetation and Land Cover. Available online: https://portalrediam.cica.es/caracterizacion_vegetacion/coberturas_suelo.html (accessed on 15 March 2025).
- Martín, A.S.; Murillo, P.G. El paisaje vegetal de la zona oeste del Parque Natural de Doñana (Huelva). Lagascalia 1999, 21, 111–132. [Google Scholar]
- Hoogar, R.; Malakannavar, S.; Sujatha, H.T. Impact of eucalyptus plantations on ground water and soil ecosystem in dry re-gions. J. Pharmacogn. Phytochem. 2019, 8, 2929–2933. [Google Scholar]
- Hernández-Mora, N.; Martínez Cortina, L.; Fornés, J. Intensive groundwater use in Spain. In Intensive Use of Groundwater: Challenges and Opportunities; Routledge: London, UK, 2003; p. 387. [Google Scholar]
- Acreman, M.; Casier, R.; Salathe, T. Evidence-based Risk Assessment of Ecological Damage due to Groundwater Abstraction; the Case of Doñana Natural Space, Spain. Wetlands 2022, 42, 63. [Google Scholar] [CrossRef]
- Rodríguez-Rodríguez, M.; Halmos, L.; Jiménez-Bonilla, A.; Díaz-Azpiroz, M.; Gázquez, F.; Delgado, J.; Fernández-Ayuso, A.; Expósito, I.; Martos-Rosillo, S.; Yanes, J.L. Assessing the Impact of Groundwater Extraction and Climate Change on a Protected Playa-Lake System in the Southern Iberian Peninsula: La Ratosa Natural Reserve. Geographies 2025, 5, 21. [Google Scholar] [CrossRef]
- Plan Nacional de Ortofotografía Aérea (PNOA). Available online: https://visualizadores.ign.es/comparador_pnoa/ (accessed on 15 March 2025).
- Viseras, C.; Soria, J.M.; Fernández, J. Cuencas Neógenas Postorogénicas de la Cordillera Bética. In Geología de España; Vera, J.A., Ed.; SGE-IGME: Madrid, Spain, 2004; pp. 576–581. [Google Scholar]
- Santisteban, J.I.; Schulte, L. Fluvial networks of the Iberian Peninsula: A chronological framework. Quat. Sci. Rev. 2007, 26, 2738–2757. [Google Scholar] [CrossRef]
- Baena Escudero, R.; Díaz del Olmo, F. Cuaternario aluvial de la depresión del Guadalquivir: Episodios geomorfo-lógicos y cronología paleomagnética. Geogaceta 1994, 15, 102–104. [Google Scholar]
- Gómez, J.A.C.; Del Olmo, F.D.; Artigas, R.C.; Espejo, J.M.R.; Barrera, C.B. Geoarchaeological alluvial terrace system in Tarazona: Chronostratigraphical transition of Mode 2 to Mode 3 during the middle-upper pleistocene in the Guadalquivir River valley (Seville, Spain). Quat. Int. 2011, 243, 143–160. [Google Scholar] [CrossRef]
- Schaller, M.; Ehlers, T.A.; Stor, T.; Torrent, J.; Lobato, L.; Christl, M.; Vockenhuber, C. Timing of European fluvial terrace formation and incision rates constrained by cosmogenic nuclide dating. Earth Planet. Sci. Lett. 2016, 451, 221–231. [Google Scholar] [CrossRef]
- Moral, F.M. Evidencias geomorfológicas del área subsidente del río Corbones medio (Sevilla). Geotemas 2016, 16, 299–302. [Google Scholar]
- del Olmo, F.D.; Gómez, J.A.C.; Barrera, C.B.; Espejo, J.M.R.; Artigas, R.C.; Aguirre, A.M. Hominid Alluvial Corridor (HAC) of the Guadalquivir and Guadaíra River Valleys (Southern Spain): Geoarchaeological Functionality of the Middle Paleolithic Assemblages during the Upper Pleistocene. Geosciences 2023, 13, 206. [Google Scholar] [CrossRef]
- Caro, J.J.F. Las industrias líticas paleolíticas del Bajo Guadalquivir: Río Corbones (y II). Carel Carmona Rev. De Estudios Locales 2008, 6, 2395–2497. [Google Scholar]
- González-Sampériz, P.; Leroy, S.A.; Carrión, J.S.; Fernández, S.; García-Antón, M.; Gil-García, M.J.; Uzquiano, P.; Valero-Garcés, B.; Figueiral, I. Steppes, savannahs, forests and phytodiversity reservoirs during the Pleistocene in the Iberian Peninsula. Rev. Palaeobot. Palynol. 2010, 162, 427–457. [Google Scholar] [CrossRef]
- Sánchez-Bandera, C.; Fagoaga, A.; Serrano-Ramos, A.; Solano-García, J.; Barsky, D.; DeMiguel, D.; Ochando, J.; Saarinen, J.; Piñero, P.; Lozano-Fernández, I.; et al. Glacial/interglacial climate variability in southern Spain during the late Early Pleistocene and climate backdrop for early Homo in Europe. Palaeogeogr. Palaeoclim. Palaeoecol. 2023, 625, 111688. [Google Scholar] [CrossRef]
- Winter, T.C.; Rosenberry, D.O. The interaction of ground water with prairie pothole wetlands in the Cottonwood Lake area, east-central North Dakota, 1979–1990. Wetlands 1995, 15, 193–211. [Google Scholar] [CrossRef]
- Liu, G.; Schwartz, F.W. An integrated observational and model-based analysis of the hydrologic response of prairie pothole systems to variability in climate. Water Resour. Res. 2011, 47. [Google Scholar] [CrossRef]
- Wilpiszewska, I.; Kloss, M. Wetland patches (potholes) in a mosaic landscape (Masurian Lakeland, Poland): Floristic diversity and disturbance. Pol. J. Ecol. 2002, 50, 515–525. [Google Scholar]
- van der Valk, A.; Mushet, D.M. Interannual water-level fluctuations and the vegetation of prairie potholes: Potential impacts of climate change. Wetlands 2016, 36 (Suppl. 2), 397–406. [Google Scholar] [CrossRef]
- Vila-Traver, J.; Aguilera, E.; Infante-Amate, J.; de Molina, M.G. Climate change and industrialization as the main drivers of Spanish agriculture water stress. Sci. Total. Environ. 2021, 760, 143399. [Google Scholar] [CrossRef]
- Elston, E.D. Potholes: Their variety, origin and significance. Sci. Mon. 1917, 5, 554–567. [Google Scholar]
- Sturm, M. Observations on the distribution and characteristics of potholes on surging glaciers. J. Geophys. Res. 1987, 92, 9015–9022. [Google Scholar] [CrossRef]
- Català, A.; Cacho, I.; Frigola, J.; Pena, L.D.; Lirer, F. Holocene hydrography evolution in the Alboran Sea: A multi-record and multi-proxy comparison. Clim. Past 2019, 15, 927–942. [Google Scholar] [CrossRef]
- Camuera, J.; Ramos-Román, M.J.; Jiménez-Moreno, G.; García-Alix, A.; Ilvonen, L.; Ruha, L.; Seppä, H. Quantitative Reconstruction of Hydroclimate Variability Over the Last 200 kyr in the West Mediterranean. PANGAEA. 2022. Available online: https://cir.nii.ac.jp/crid/1884242817409784064 (accessed on 15 March 2025).
- Brunet, N.N. Prairie Pothole Drainage and Water Quality. Ph.D. Thesis, University of Saskatchewan, Saskatoon, SK, Canada, 2011. [Google Scholar]
- Rover, J.; Wright, C.K.; Euliss, N.H., Jr.; Mushet, D.M.; Wylie, B.K. Classifying the hydrologic function of prairie potholes with remote sensing and GIS. Wetlands 2011, 31, 319–327. [Google Scholar] [CrossRef]
- Vanderhoof, M.K.; Alexander, L.C. The Role of Lake Expansion in Altering the Wetland Landscape of the Prairie Pothole Region, United States. Wetlands 2016, 36, 309–321. [Google Scholar] [CrossRef] [PubMed]
- Daniel-Simon, J. The Role of Wetland Pond Permanence in the Assembly of Biological Communities in the Prairie Potholes of Alberta. Ph.D. Thesis, University of Waterloo, Waterloo, ON, Canada, 2020. [Google Scholar]
- Paredes-Trejo, F.; Barbosa, H.A.; Daldegan, G.A.; Teich, I.; García, C.L.; Kumar, T.V.L.; Buriti, C.d.O. Impact of Drought on Land Productivity and Degradation in the Brazilian Semiarid Region. Land 2023, 12, 954. [Google Scholar] [CrossRef]
- Detenbeck, N.E.; Elonen, C.M.; Taylor, D.L.; Cotter, A.M.; Puglisi, F.A.; Sanville, W.D. Effects of agricultural activities and best management practices on water quality of seasonal prairie pothole wetlands. Wetl. Ecol. Manag. 2002, 10, 335–354. [Google Scholar] [CrossRef]
- Muhammad, A.; Evenson, G.R.; Stadnyk, T.A.; Boluwade, A.; Jha, S.K.; Coulibaly, P. Assessing the Importance of Potholes in the Canadian Prairie Region under Future Climate Change Scenarios. Water 2018, 10, 1657. [Google Scholar] [CrossRef]
Disclaimer/Publisher’s Note: The statements, opinions and data contained in all publications are solely those of the individual author(s) and contributor(s) and not of MDPI and/or the editor(s). MDPI and/or the editor(s) disclaim responsibility for any injury to people or property resulting from any ideas, methods, instructions or products referred to in the content. |
© 2025 by the authors. Licensee MDPI, Basel, Switzerland. This article is an open access article distributed under the terms and conditions of the Creative Commons Attribution (CC BY) license (https://creativecommons.org/licenses/by/4.0/).