1. Introduction
‘Landscapes’ have long been part of geomorphology, the scientific study of scenery, ‘which has sprung from the union of Geology and Geography’ [
1]. Indeed, for many people, landscapes are geomorphology. As Adrian Harvey’s Preface to his ‘Introducing Geomorphology: A Guide to Landforms and Processes’ [
2] has it, ‘Many people enjoy scenery, and see landscapes as beautiful’. Cuchlaine King said, ‘a real appreciation of the value and beauty of the landscape’ is essential for a successful career in geomorphology’ [
3] (p. 447). Harvey also noted that ‘Landscapes have inspired painters and photographers, even poets and composers of music’ and asked, ‘What is it about scenery that inspires people?’ [
2] (p. xi). The aim of the present paper is not to answer Harvey’s question, but rather to explore new ways of representing geomorphological observations and the information they generate within a ‘landscape tradition’. This tradition can also encompass representations from geography, for example [
4], or geology [
5]. These landscapes, whether broad and narrow, artistic or scientific, should be capable of digital representation and be valuable for the public, including policy makers as well as geomorphologists, earth scientists, ecologists, and the tourists of the future. Policy is not an immediately apparent aspect of landscape evaluation but, via geoheritage and geotourism, is very much part of cultural landscapes [
6]. Communication of ideas, aesthetics, and science, as well as visual images, is a significant part of our 21st century ‘I’, that is digital as well as personal, in the behavioural environment that William Kirk would recognise [
7]. The paper starts to develop some ideas whereby the earth and geographical sciences can contribute to visual communication within the context of ‘Large Language Models’. Such models can contribute, not only via geomorphology, to the wider geographical and earth sciences, to the widest context of Al Gore’s ‘Digital Earth’ [
8]. The progress of many spatial sciences, from geography and geology to archaeology, planning, and policy making, could benefit from better generation and use of geospatial data and the development of Large Language ‘Geographical’ Models.
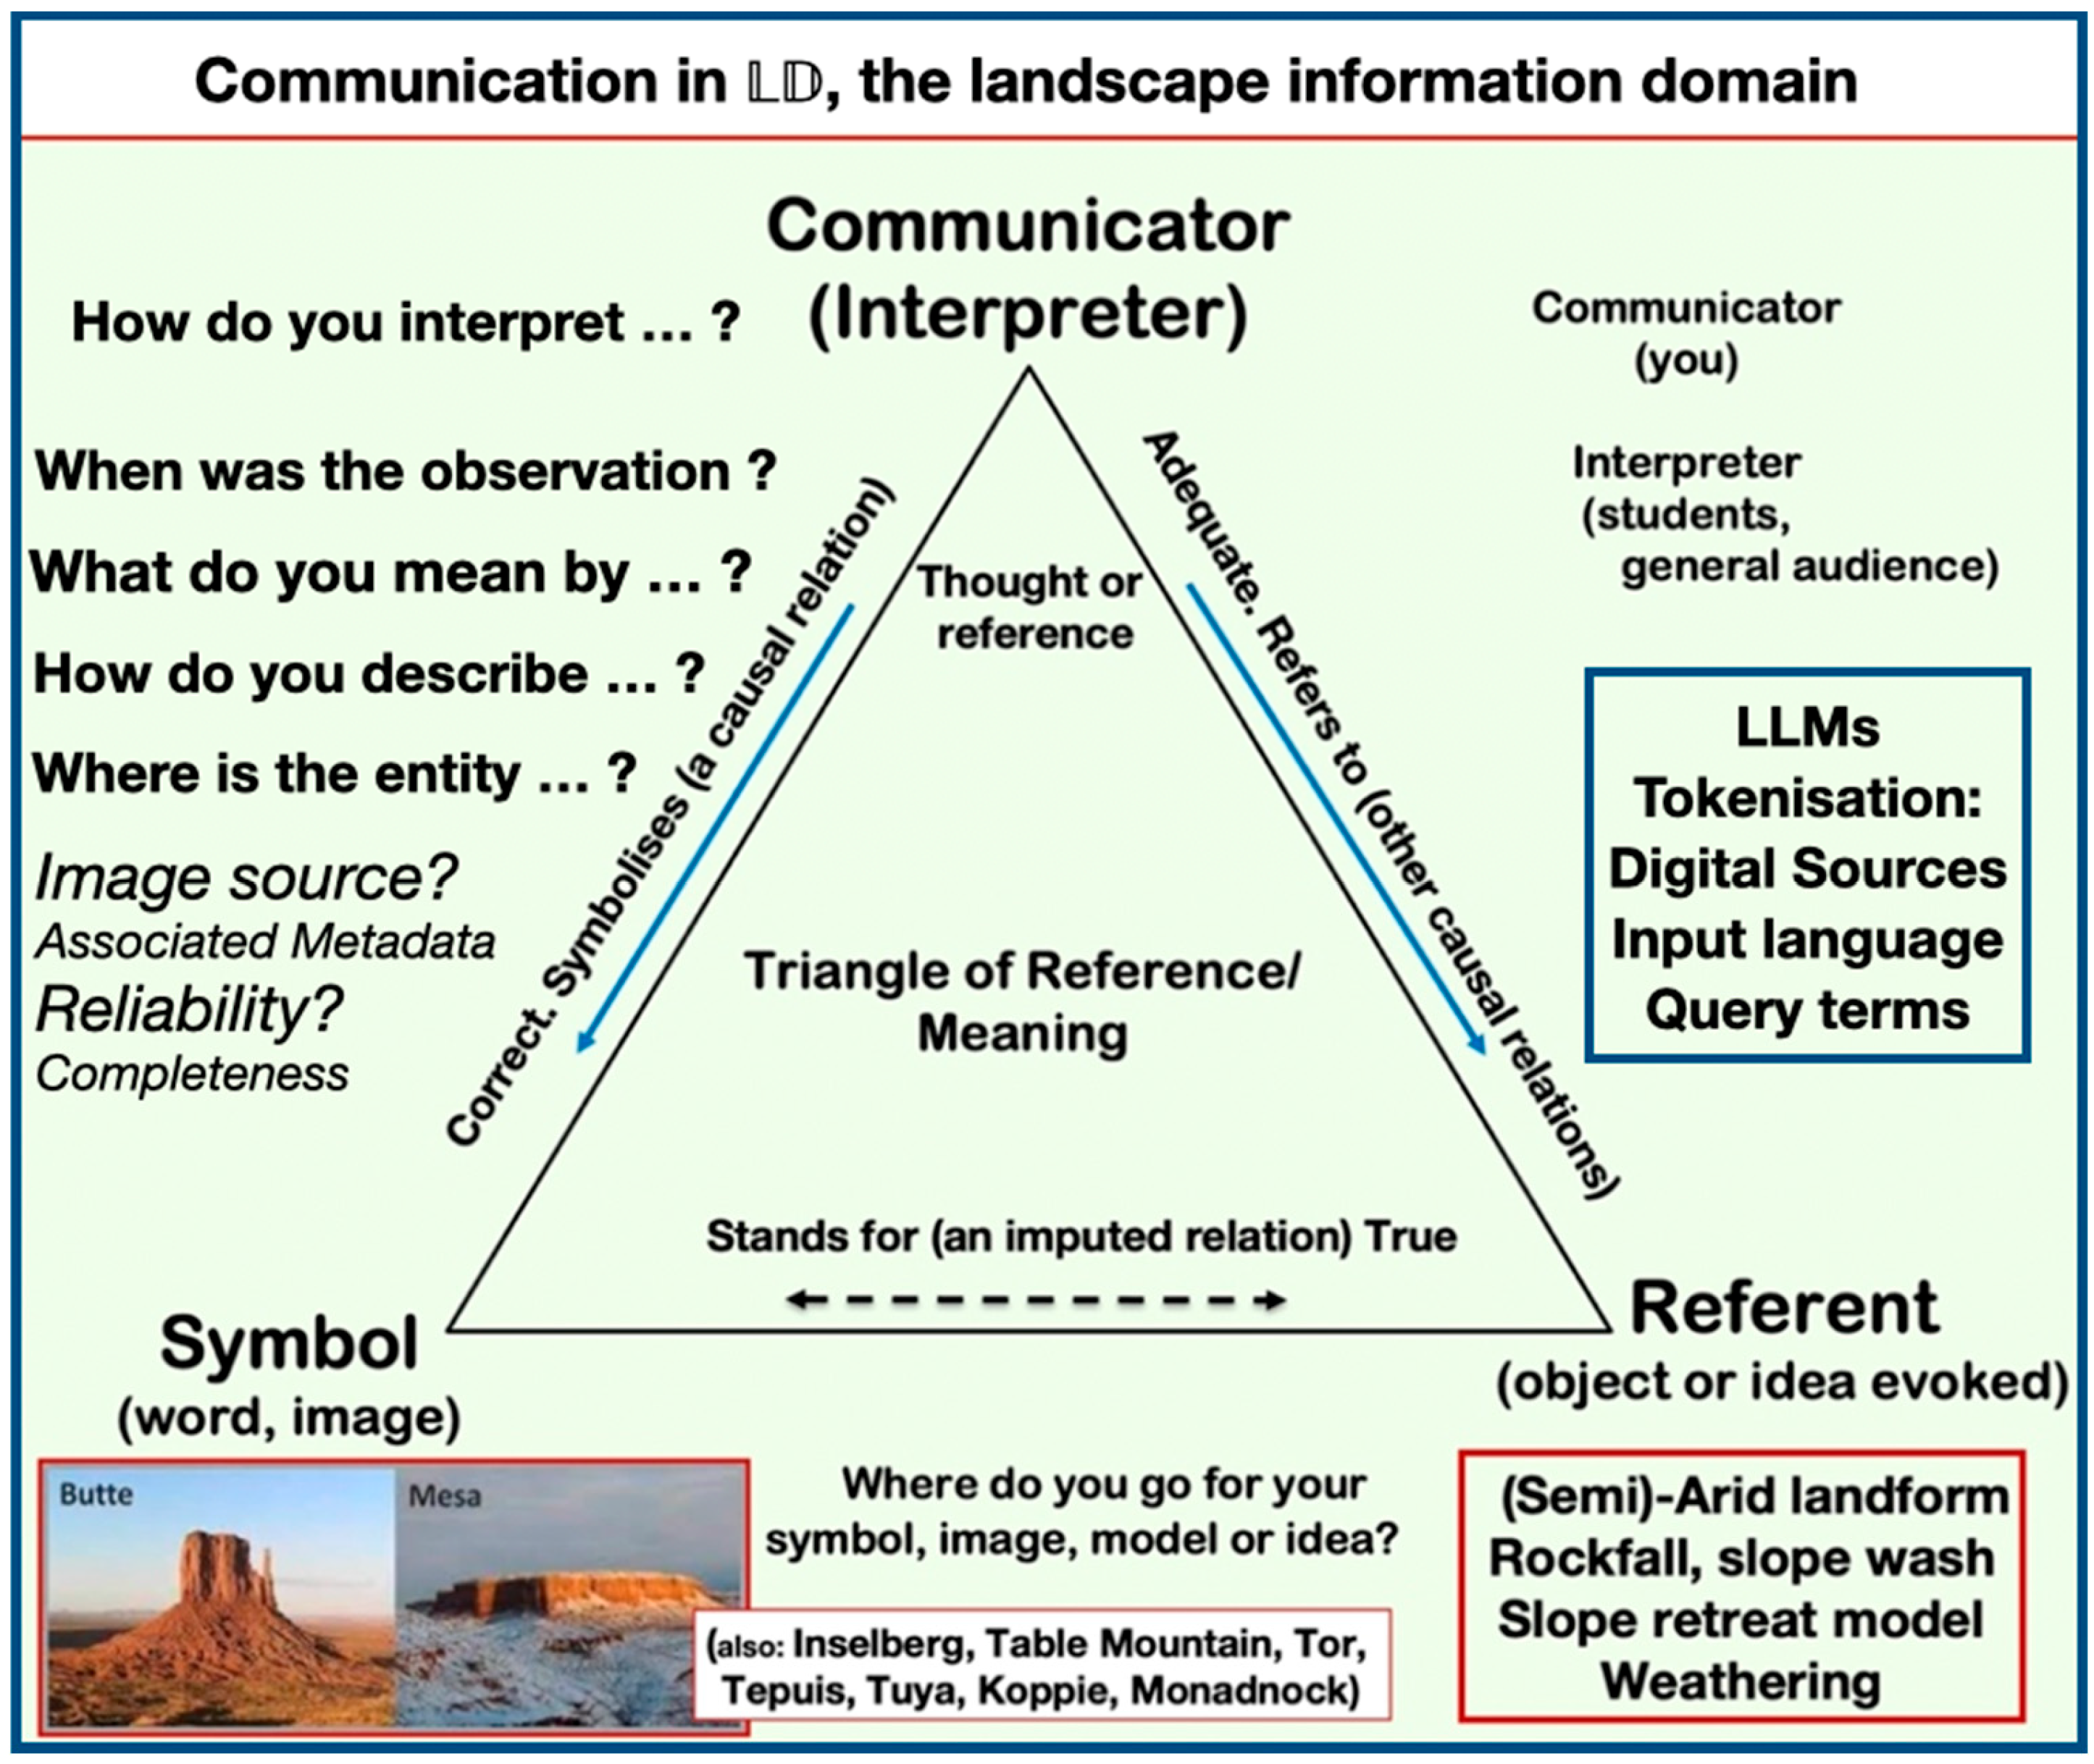
The view of any landscape is dependent on the viewer(s), location, subject, and context. Some of this can be encompassed by a semiotic approach (
Figure 1) to the meaning of geomorphological terms [
9], within which it is possible to communicate, if not define, features at any scale. Such terms can be seen in the ‘Landscape Domain’,
: geomorphic, cultural, climatic, artistic, and political. Within the domain, identification of a landform by geolocation allows investigation, query, and discussion. In the ‘desert landscape domain’, discussion of ‘mesa’ and ‘butte’ might be included in a Wikipedia or in a dictionary of geology [
10] (butte-and-mesa topography p. 320) or geomorphology [
11] (butte p. 66 and mesa p. 313). Note, however, that currently only Wikipedia is digitally searchable and updatable. Even recent compilations of landforms such as ‘Periglacial landscapes of Europe’ [
12] and ‘Landscapes and Landforms of England and Wales’ [
13] are not digitally searchable in text or index. Even if indexes are present, they are ‘messy bundles’ of geographical information if they are not digitally searchable [
14]. Note, too, that geomorphology operates with very poor classification systems or tools, unlike biology for example, so that structured searching for information on a specific landform may produce a variety of results (
Figure 1): ‘Where do you go for your symbol, image, model, or idea?’ and associated questions.
2. Visual Images, Landforms and Communication
Investigations in earth and geographical sciences often start by capturing landforms as visual images in some manner. More mundanely, holiday advertisements may well use images of landforms as enticements and rewards for visits and generated memories. Aspects of these connections were explored long ago by Cornish [
15,
16,
17]. Geomorphological stories may be encapsulated by identification of pictorial images of landforms and within landscapes [
18,
19]. ‘The visual’ can be seen in many textbooks, as exemplified above [
2] or in the ‘Landscapes and geomorphology of England and Wales’ [
13] or ‘Lake District, Mountain Landforms’ [
20], which encompass technical aspects of geomorphology but within landscapes and their own geoheritage traditions. It is difficult to conceive how a book such as ‘The Face of the Earth, natural landscapes, science and culture’ [
21] includes not one image, graph, or diagram, let alone symbolic or numerical expression. This is surprising given that ‘The Face of the Earth’ by Suess [
22] has a few illustrations and maps and that King’s [
23] geomorphology of Northern England contains maps and diagrams, even if no landscape photographs. ‘The Pattern of Landscape’ by the planners Crowe and Mitchell [
24] states, ‘To read the landscape like a book, as well as to enjoy it as a picture, opens the way to a new relationship between men and their environment. The health of the landscape, its appearance and men’s response to it are interdependent’. Indeed, health, of and in landscapes, is part of discovering a sense of wonder in encouraging geodiversity [
25]. Geomorphological messages are followed by Bell [
26] in his ‘Landscape. Pattern, perception and process’, communicating geomorphology beyond geomorphologists. Higgitt and Lee’s [
27] ten-chapter compilation evaluating ‘the evidence for geomorphological process activity over the last 1000 years’ in Britain concentrates on ‘process’ rather than landscape formation. Yet Higgitt and Lee [
27] (p. 269) state that, ‘Despite the well-documented variability in climate and the increasing impact of humans, the changes have only involved the minor modification of an existing landscape inherited from the Quaternary and the Tertiary’. Much of this modification has come to incorporate the anthropocene and its approximate cognates ‘capitalocene’ and ‘chthulucene’ [
28], thereby raising ‘what do you mean by …?’ in a conceptual framework. Cross-cultural communications might be a similar rationale for the ‘critical zone’ [
9,
29], a term describing the interactions of earth surface topography, flora, and fauna, and yet pose questions for geomorphologists at large: how do we communicate our research and stored knowledge? Communication is not just to geomorphologists and earth scientists but to the widest communities exploring landscapes now and in the future with respect to the anthropocene [
18] and the capitalocene [
30]. In effect, these books are engaged in providing stories about ‘the landscape’ and its changes and the influences of climate and humankind on the surface of the earth in the manner of Kirk’s behavioural environment [
7,
31]. This paper is concerned with ways in which we might produce a digital representation of the earth, and the information associated with its geomorphology to produce better storylines that might help us all accommodate an uncertain future. In this paper, I set out some academic explorations, storylines, by the late Professor Cuchlaine King (1922–2019), the first professor of geomorphology in the UK at the University of Nottingham. In particular, I focus on the representation of ‘place’ on the earth. In the following, I have used site examples particularly from northern England, being the area covered in King’s contribution to the ‘geomorphology of the British Isles’ series [
23]. The task is to investigate ways in which landscapes and landforms, scenery and social context can be brought together, along with text and data, to become a searchable, thus digital, ‘information surface’. In effect, geographers need to produce data for Large Language Models and for the digital earth.
3. Cuchlaine King and Landscape Exploration
Just as artists follow their predecessors and add new techniques and ideas to their oeuvre (or rebel against them), so too may scientists. John Marr was Woodwardian Professor of Geology at Cambridge University and contributed to knowledge of the geology of the English Lake District as well as its geomorphology [
32]. William B.R. King was demonstrator to Marr when Cuchlaine was born. Bill King, who had a distinguished geological career himself, followed Marr as Woodwardian Professor. Cuchlaine was inevitably drawn into earth science [
33], although following a more geomorphological line, probably because the fieldwork she loved could be practiced more easily in geography, rather than geology, departments. Cuchlaine King continued the tradition of Marr’s study of scenery [
1] scientifically throughout her academic life. Data collection, analysis, and synthesis was a significant part of her approach. She learned topographic surveying at Cambridge under Frank Debenham (co-founder of the Scott Polar Research Institute) and gained an interest in sand movement on beaches with William Williams, who later published his work on beach surveys at St Annes, Lancashire, in preparation for the Normandy landings of June 1944. She completed a PhD with Williams on sand beaches in 1949. At Cambridge, she was also influenced by William Vaughan Lewis and his innovative investigations of waves on beaches [
34] and on glacial erosion. Lewis is now largely forgotten but is a part of the storyline of glacial and coastal geomorphology. W.H. Ward wrote in Lewis’ obituary [
35]:
‘At one of his earlier lectures on Vest-Skautbreen work I remember being particularly impressed by the keen controversy which he led and by the way he had collected together a team of geographers, geologists, physicists and engineers to find out just how that small glacier was moving. It was not long afterwards that Lewis’s enthusiasm overtook me and I found myself, together with John Nye, John Glen, Cuchlaine King and scores of willing assistants, thoroughly involved in a study of the motion of the much larger glacier in Austerdalen. Lewis had heartily inveigled us all into a lot of healthy, hard work. There was nothing he enjoyed more than to provide his students and friends with opportunities for testing their ideas about the action of glaciers and to join in the free discussion which invariably developed over the evening meal in camp.’
I quote this to show that geomorphological research, fieldwork in particular, involves enthusing and communicating ideas and results.
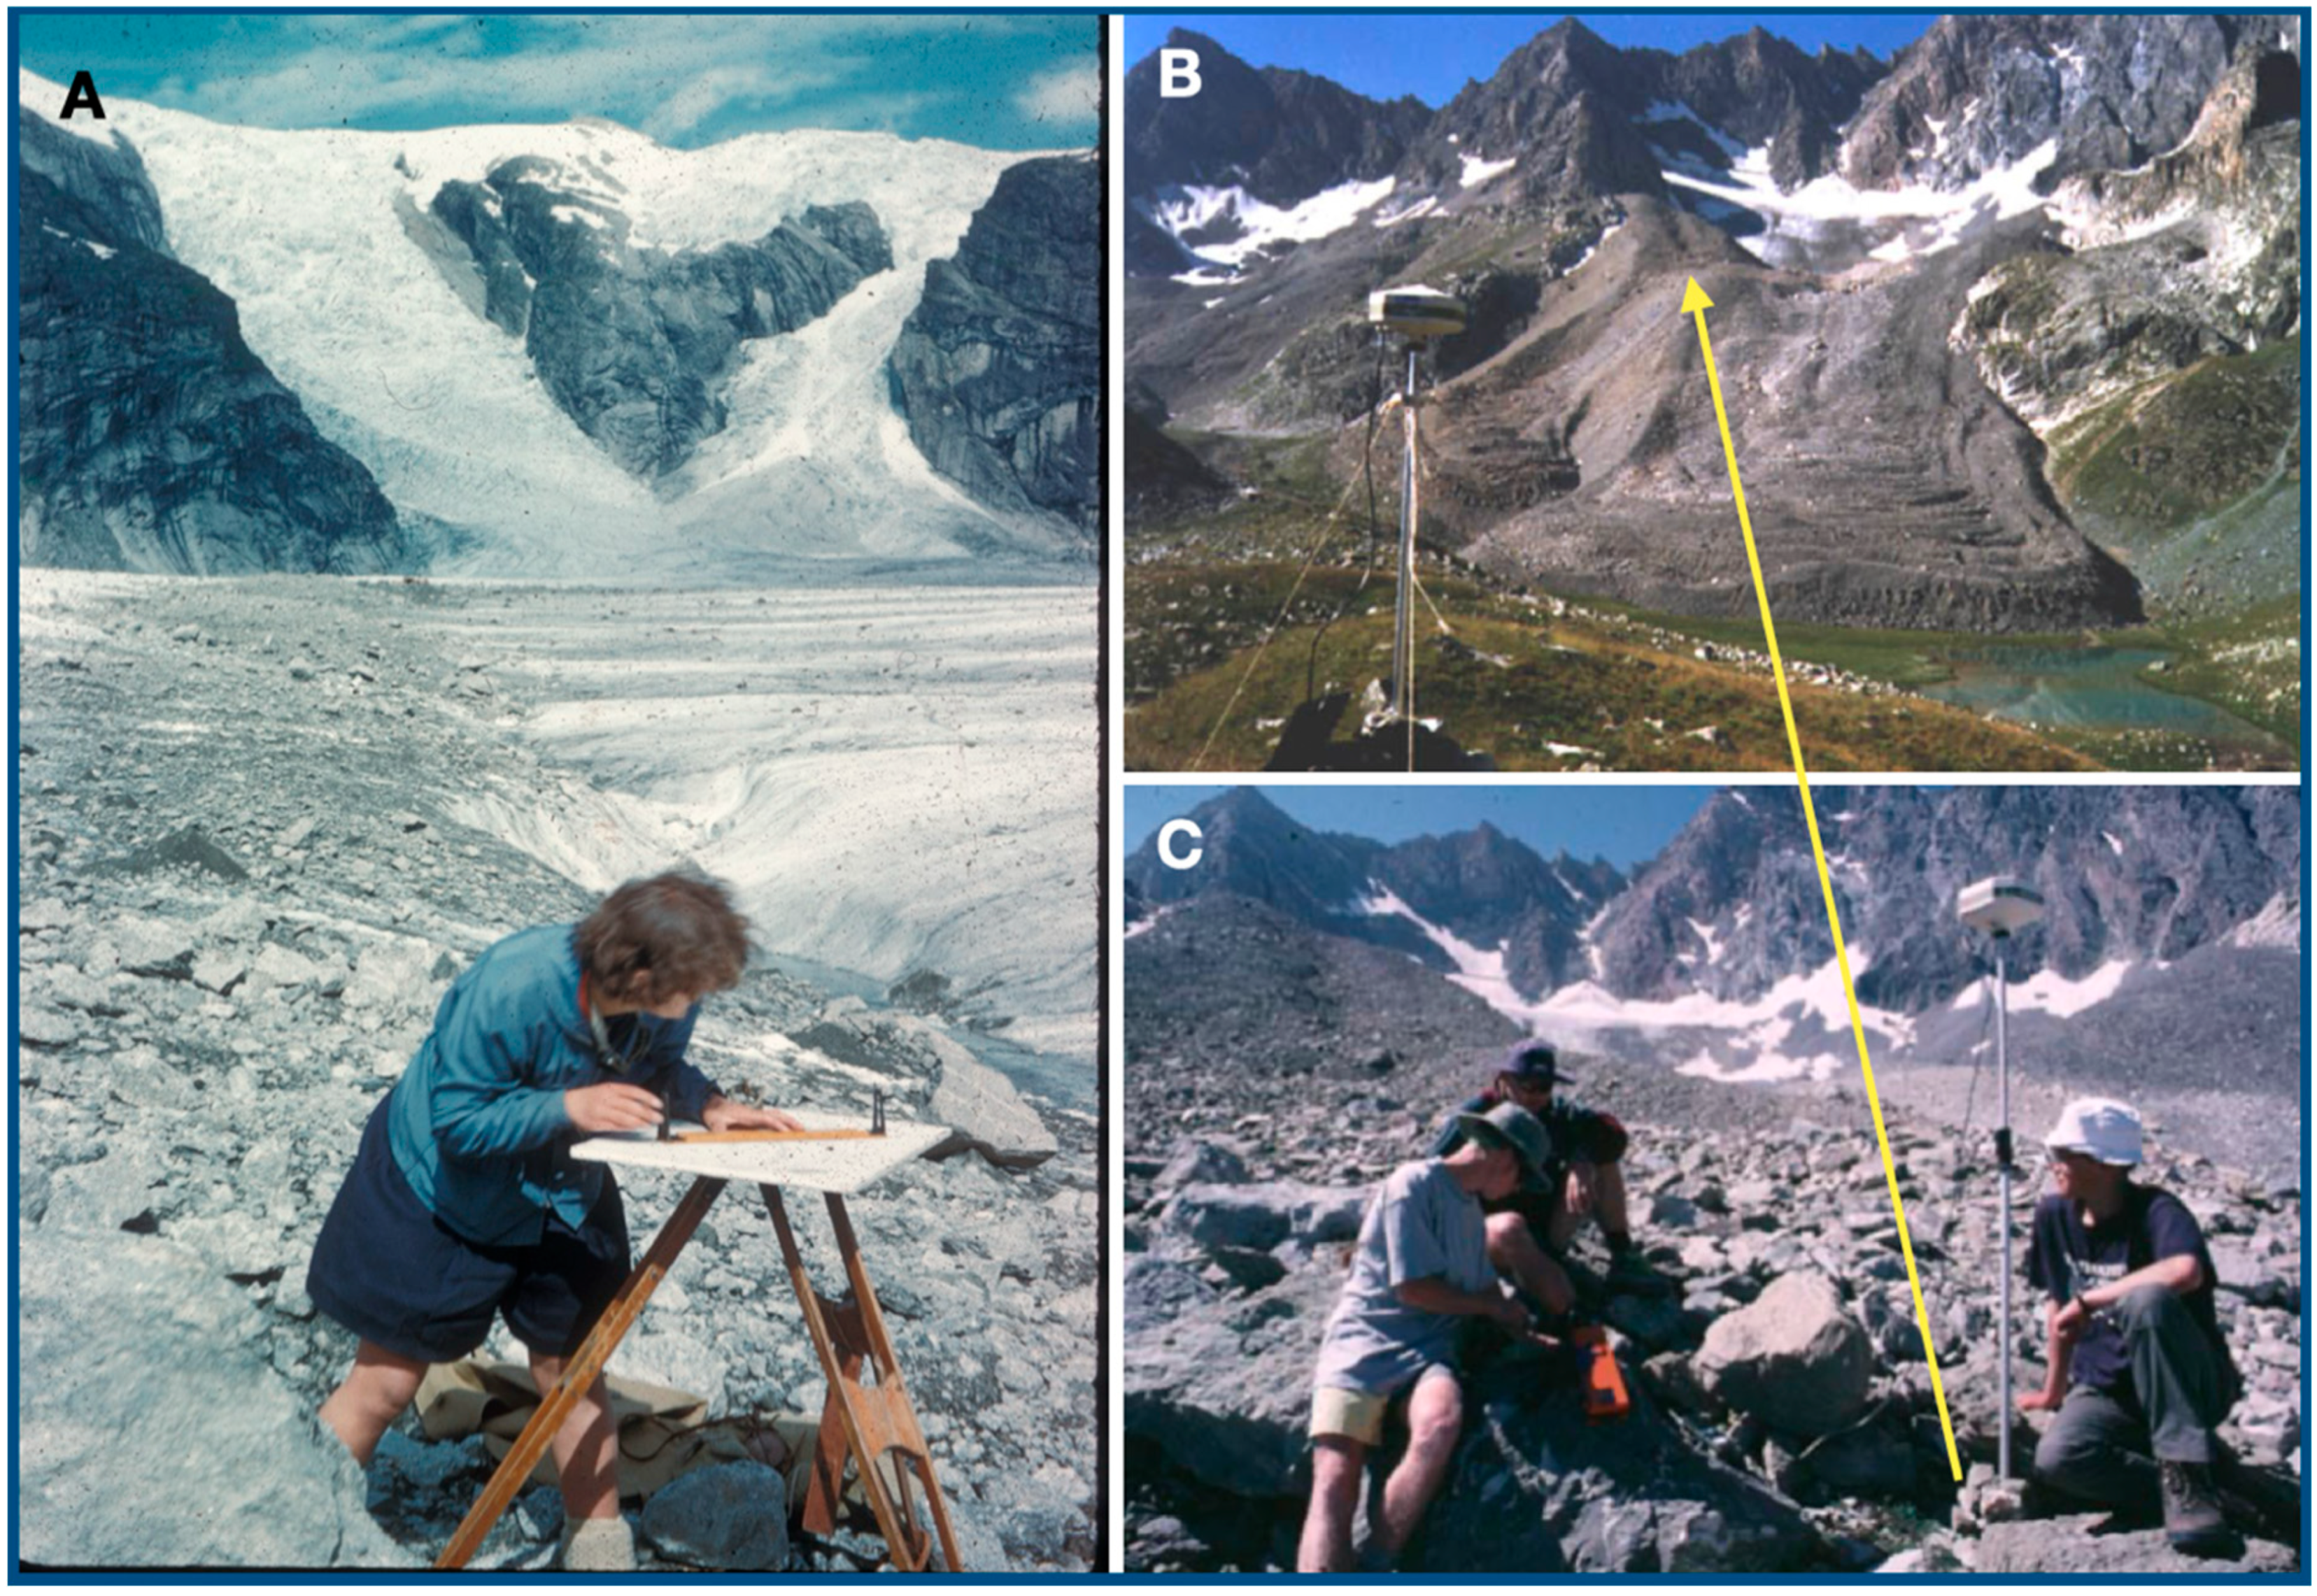
Figure 2 shows Cuchlaine King plane table surveying at Austerdalsbreen, Norway. The map produced can be seen in King’s text on geomorphological techniques [
36] (
Figure 2).
Mapping using plane tabling and theodolites was a standard technique [
36] until digital theodolites became common, before being replaced by the centimetric precision of GNSS (Global navigation satellite system, or GPS) instrumentation.
4. Landscapes and Geomorphological Storytelling
Landscape painters try, in various ways, to capture the ‘essence’ of a landscape as they see it. I envisage something similar for geomorphological observations, for example in the distinction between detailed and general viewpoints and the use of narratives [
38]. In this section and those that follow, I present some diverse examples to show how past and present research can be brought in towards the creation of digital narratives, especially in the light of accumulating information in a world of ‘big data’. Earth surface storylines operate by investigations and observations that can be facilitated from days to millions of years. Ansel Adams’ images of rocks and landscapes provide more than a geomorphological view of landscapes, structures, and forms [
39]. Guy Tal’s ‘More than a Rock’ [
40] adds other views of creativity in landscape storytelling, and Julie Brook’s work brings together geomorphological storytelling, photography, sketching, and land art [
41]. These, and many more examples, could be used to link visualisation of artworks in the landscape such as in books [
42,
43] and to music [
44], all of which have images of places and buildings.
Tooth et al. [
45] note the importance of ‘visualizing geomorphology: improving communication of data and concepts through engagement with the arts’. Here I try to establish some ground rules for better communication in general (not just artists, whether written, visual, haptic, or sonic), but also to better explain the nature of geomorphic landscapes. To concur with Edward Casey [
46] (p. 170):
Landscape painting in the Northern Sung dynasty and in seventeenth-century Holland is a painting of places in their characteristic (in)formal patterns. Such painting represents the places of given regions of the earth in their intrinsic shapes, and it is in this sense a practice of geo-choro-morphology. This art seeks not just a lucid representation of landscape but a clarified depiction of land-shape.
Notably, the front cover of Casey’s ‘Earth-Mapping’ [
47] features an image by Sandy Gellis, ‘Viewing Mounds’. That simplified geomechanical system, sand piles of granular interactions, still has connotations of ‘complexity’ [
48]. The individual, site, and observations of geomorphology fall within this view, where χῶρος
(choros) is an area or region—as in choropleth maps.
This landscape viewpoint is not through art or geomorphology per se but via ‘scientific study of scenery’ (i.e., landscapes and landforms contained within them) that needs to ask, as Yatsu [
49], ‘how do we make geomorphology more scientific?’. A simple answer might be ‘better explanations’, but this statement, however trivial, raises not only metaphysical questions but concerns semantics and ontologies as well as visualisation. Here, I want to bring together past explorations in geomorphology and add those currently being made to identify and suggest a framework for future explanations or ’storylines’. Fortunately, this is simple to initiate and should make better use of the complex observations and instrumentation now available, from dating methods, remote sensing, and surveying to digital and machine learning data analysis. An important aspect, explained in more detail in
Section 6, is the digital latitude-longitude, single value, geolocator dLL that can be added to place names, toponyms, landforms, or features of many kinds.
5. ‘Big Data’, Digital Earth—Geolocation and Its Implications
Boulton [
50,
51] argued, in 2018, the case for ‘big earth data’: ‘The digital revolution, big data and revealing patterns in nature and society’, as have others in earth system science [
52]. In archaeology, another landscape science, Gattiglia [
53] indicates that ‘Data are what economists call a non-rivalrous good, in other words, they can be processed again and again and their value does not diminish. On the contrary, their value arises from what they reveal in aggregate, namely we may realise innovative things by combining data in new ways’. Al Gore’s concept of a
Digital Earth [
8] can be brought into this using some of the knowledge, fieldwork, and inspiration of Cuchlaine King to produce ways of viewing landscapes that can be built upon to give a coherent georeferenced framework.
Some techniques in satellite technology, particularly InSAR (Interferometric Synthetic Aperture Radar) [
54], coupled with the established technologies of DEMs (Digital Elevation Models) and cosmogenic ratio ‘dating’ methods will add greatly to ‘big data’. How can these contributions be collected and use ‘big data’ approaches? For example, the NISAR project (NASA-Indian Space Research Organisation SAR Mission) will use L and S band radars to map earth surface movements at centimetric scales with free and open data access. The concept of ‘big data’ involves not only the generation of data points at a site but also the integration of past event data, such as landscape and geomorphological change. Preferably, such data should accord to the FAIR data principles [
14] of findability, accessibility, interoperability, and reusability. Overall, we wish to establish ‘quality data’ that can be easily accessed and made available for subsequent addition, model testing, and knowledge advancement. These ideas go back at least to Krumbein and Graybill [
55] and involve Cuchlaine’s interest in surveying and geomorphological techniques [
36,
56].
We can now, using some of the antecedents just mentioned, put together techniques for constructing better, and digital, ways for geographical storytelling. Two simple ideas are required for this: the Digital Earth and decimal latitude longitude geolocation (dLL), explained in the next two sections.
Al Gore’s concept of a
Digital Earth [
8] suggested that:
A new wave of technological innovation is allowing us to capture, store, process and display an unprecedented amount of information about our planet and a wide variety of environmental and cultural phenomena. Much of this information will be “georeferenced”—that is, it will refer to some specific place on the Earth’s surface.
Digital Earth is more than ‘GIS/GNSS’, although the latter has a role to play [
57]. Digital earth attributes are included in GNSS navigation and digital maps, on GNSS displays and digitized mapping systems, as well as in locational data. Discussion can be found in papers by Wang et al. [
58] and in the book by Guo et al. [
57]. There are, however, ways in which ‘searchability’ on a digital earth could be exploited with traditional geographical concepts such as drainage basins and climatic regions [
59]. On a small scale, birds and other animals are tracked with GNSS systems, sending back a variety of data, not just positions. Individual bird foraging and migration paths are examples, as too are migration patterns related to weather conditions mapped by radars [
60]. These are examples of spatial data derived from varied sensors being related to geospatial referencing. Although there are geomorphological investigations in the ‘International Journal of Digital Earth’, for example Zhang et al. [
61], most geomorphological investigations are case studies with little or no digital geolocation that can be used within Digital Earth. Case studies often use ill-defined concepts of space, such as toponym referencing, and lack integration into classification system. There are problems associated with climate-zonal ‘classifications’ of mountain landforms [
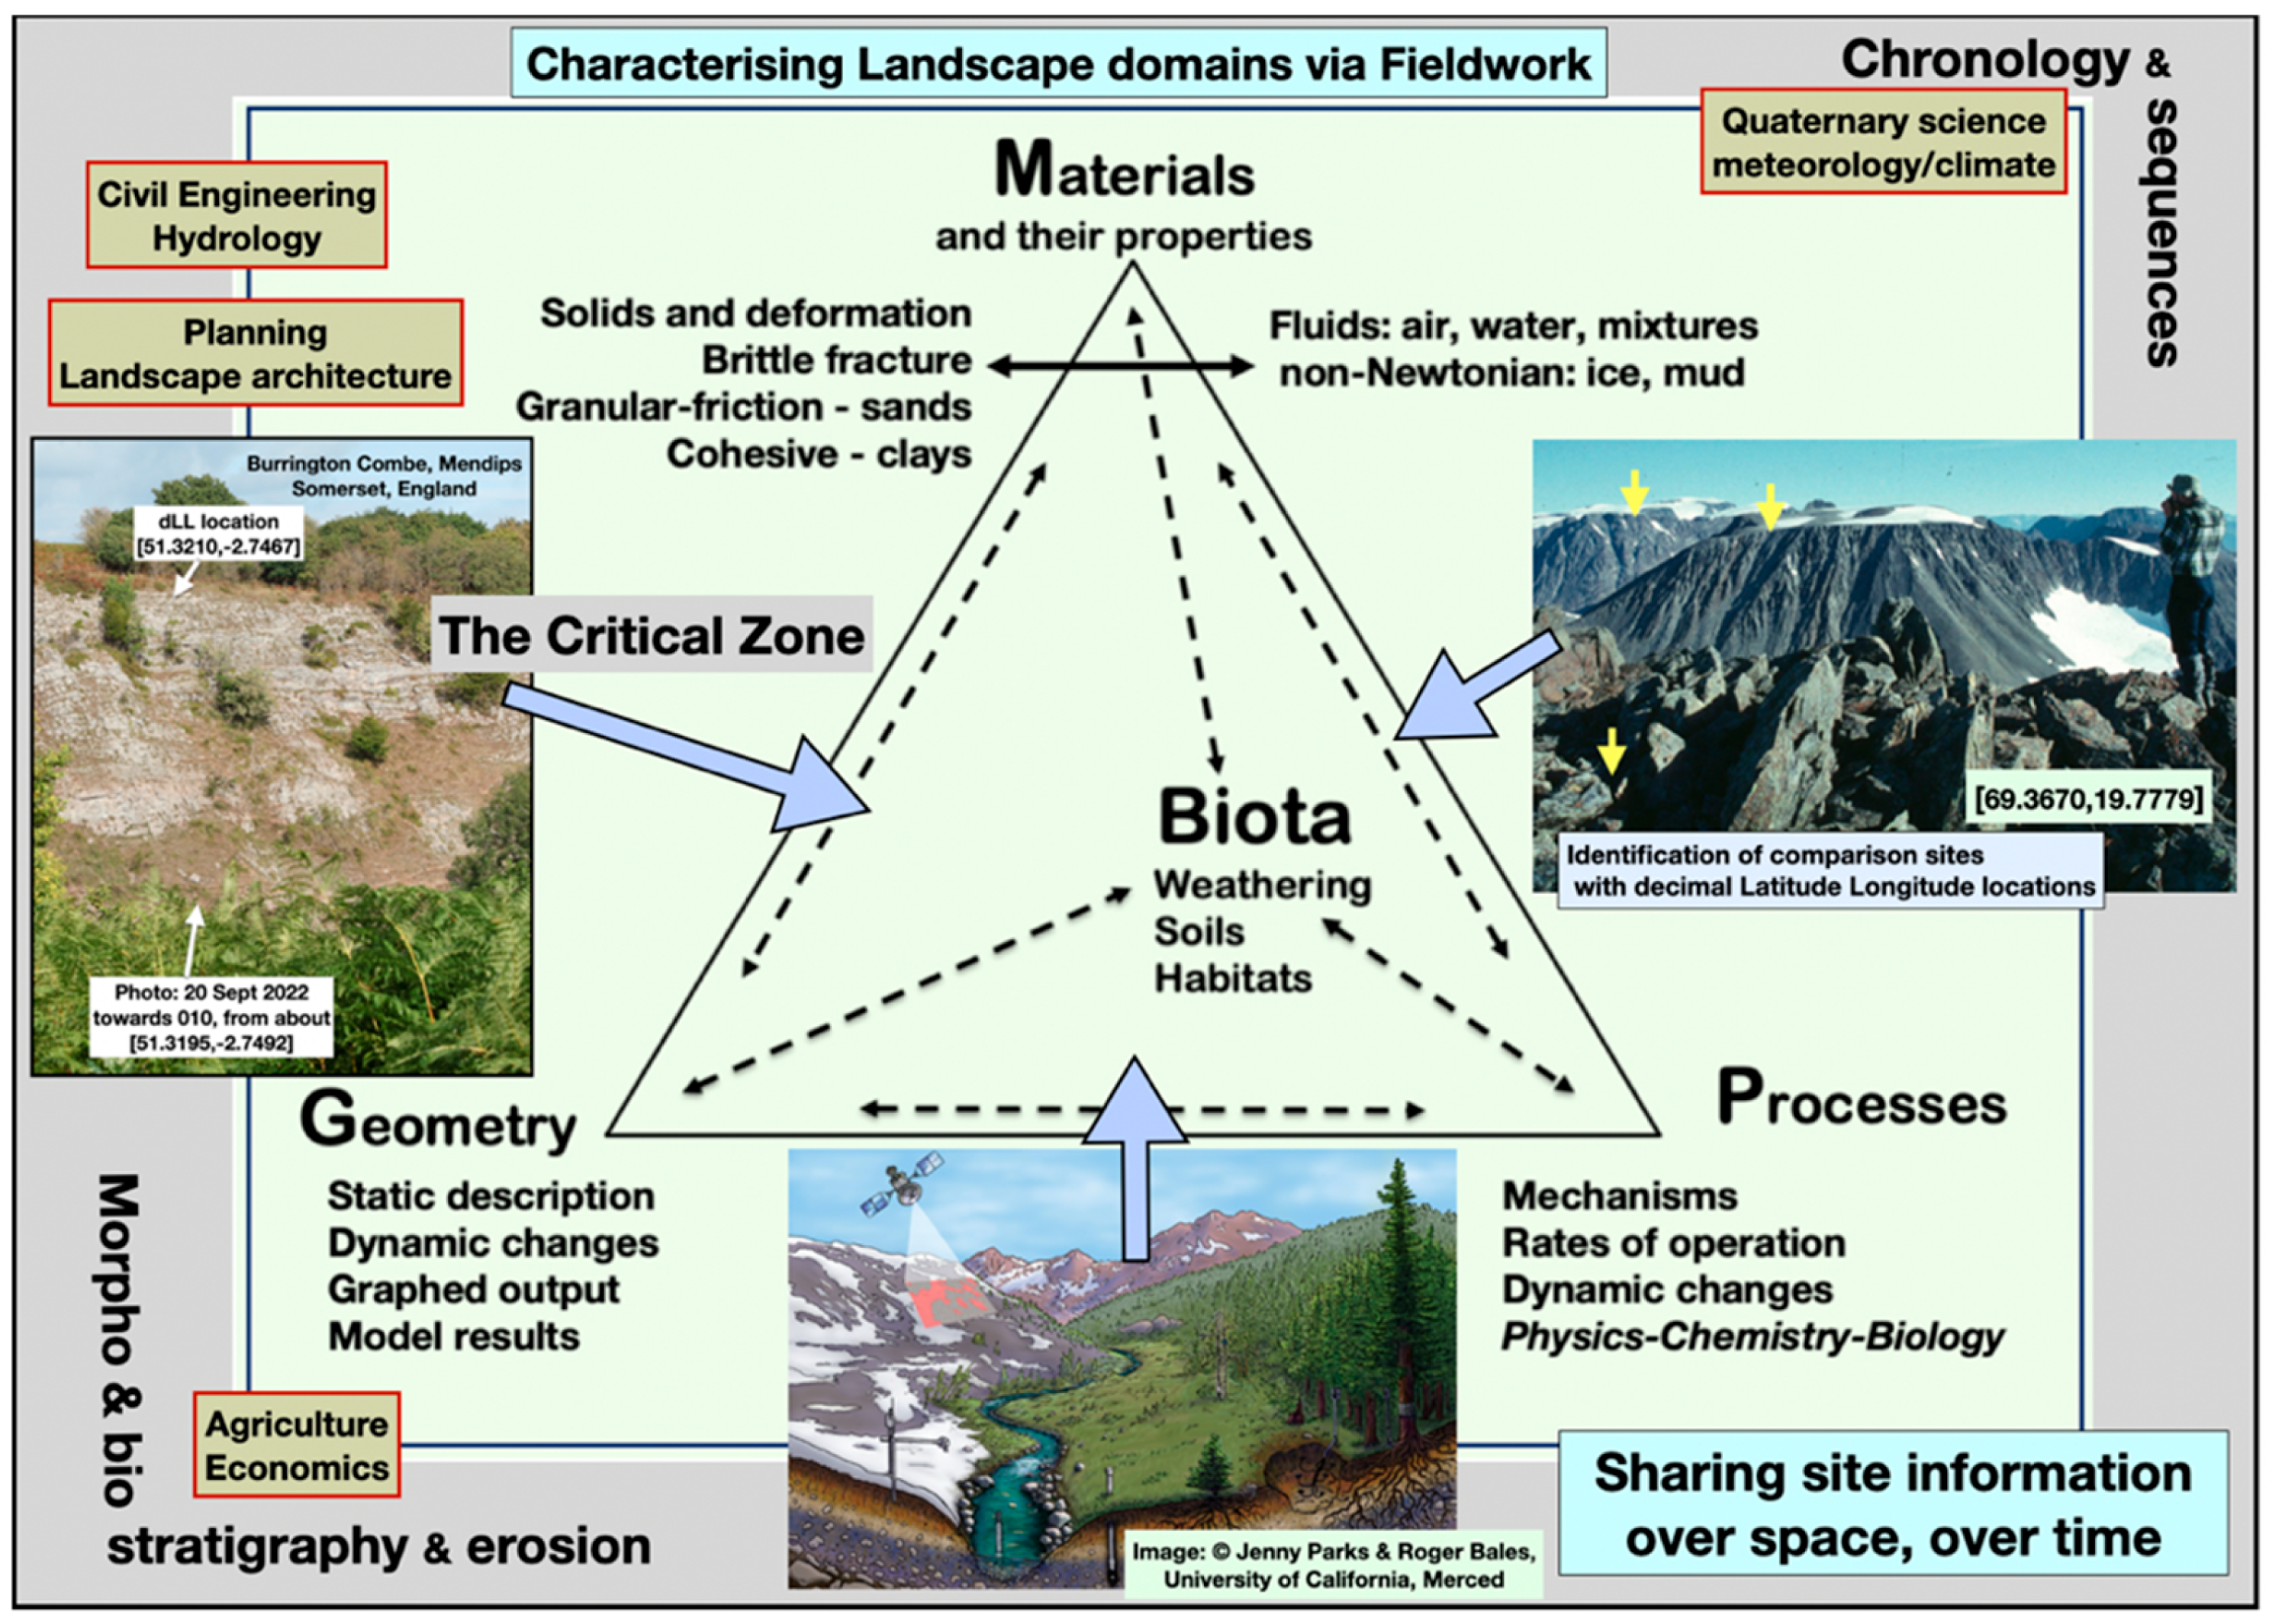
62]. Although a ‘mountain’ itself may be difficult to define, the idea of entities within a general ‘mountain domain’ (
), itself within a general Landscape Domain,
, allows relaxing classification boundaries as long as individual entities can be identified or specified. We might also consider, to be easily recognizable, a coastal shoreline domain, tundra domains, as with the desert domain that includes mesas and buttes (
Figure 1). Within these broad domains, digital reference can be made to specific features or assemblages using geolocation. Brierley et al. [
63] (p. 1) have discussed some problems associated with ‘big data’: ‘The process of interpretation, and the ways in which knowledge builds upon interpretations, has profound implications in scientific and managerial terms’.
There is a tendency for geomorphologists, as with other scientists, to ask, ‘what do you mean by…?’; questions of semantics and ontologies as well as semiotics. Entities (landforms, ‘processes’) in question are frequently of complex origin, even though a landform name is commonly accepted. An example is ‘tor’ and its nominal cognates [
14]. Tors are common landforms in many areas, not just uplands, and are frequently the
dramatis personae in recent compilations of ‘Landscapes and landforms’ [
12,
13,
64] and more popular collections [
65,
66]. Each landform is unique in location, and comparisons between forms in varied geologies are required for adequate discussion; georeferencing is required. For ‘explanation’ of a tor to help solve ‘the problem of tors’ [
67], we may also need to specify some properties at other locations, for example the Stiperstones [
68] or Swaziland [
69]. In general, the properties, ℙ, at a point are their material properties (M), the processes (P) involved, as well as the geometric (G) properties of the landform and a precise geolocation.
Zonal concepts, derived from biogeography and promoted especially in the Germanic geographical tradition, such as ‘periglacial’ and ‘paraglacial’, may be appended to landforms. Descriptions of tors are frequently used in a loose way and lack precision in meaning [
14] and are therefore of explanatory value and are not mappable on the Digital Earth. Periglacial is a concept dating to Lozinski in 1909 [
70], but has its roots in Alexander von Humbold’s approaches to science [
71] and has later implications for climatic geomorphology [
72].
As Brierley et al. [
73] (p. 1983) note regarding ‘naming conventions’ in geoconservation:
From an international geomorphological point of view, we do not consider the use of local names for landform types to be a positive step. Geomorphologists typically name and interpret landforms in relation to generally applicable physical principles, rather than their resemblance to any particular place.
Such problems are evident even before discussion about the ‘physical principles’ and ‘processes’. Marr [
74] suggested an inverted ‘caddy spoon’ to illustrate the asymmetric river drainage pattern of the English Lake District. Although recently used by Evans [
75] (p. 289), who reproduced Marr’s diagram, who, nowadays, knows what a caddy spoon looks like, even tea-loving drinkers?
Some problems can be rectified by adequate georeferencing, not just mapping, of features under discussion. Brierley et al. [
73] (p. 1981) also note that ‘Although official committees determine naming conventions for species identification or geological time periods, no formal procedures have been established for landscape types’. The simplest way to ‘show what we mean by …’ is to unambiguously geolocate them within the Digital Earth. This geolocation requirement applies to site/location references, particularly when images identify features [
62].
6. Digital Geolocation [dLL] and Storytelling on the Digital Earth
We now investigate ways of looking at data production and collection for use on Digital Earth to enhance ‘big data’ use and the possible employment of Large Language Models. The construction of digital landscapes enables digital storytelling and visualisation, which together provide insights into where we might, or should, be going in an age of relatively cheap computing and data storage and the use of personal digital devices. Data costs are most likely to be concerned with obtaining data rather than storage, and we should make the fieldwork and digitization as cost-effective as possible.
A simple geolocation annotation device lies at the heart of the ‘renegotiation’ of place and place labels in landscapes. Any location on the globe can be referenced in decimal degrees (DD), which is easier to use than degree-minute-second designations or national grid networks and is more precise than ‘What3Words’ and its 3 m × 3 m square. Placing a DD for latitude and longitude inside square brackets gives a decimal latitude longitude tuple. For example
SU[54.4478,-3.2247] is the summit of Scafell in the English Lake District. Evans [
75], in his recent survey of the landscapes of the English Lake District, uses a ‘caddy spoon’ analogy for a description of its drainage basin shape after Marr [
74] and identifies ‘SP’ (S for ‘Scawfell’ in Marr [74) (p 124), which is, presumably, Scafell Pike
SU[54.4542,-3.2115]: ‘Scafell Pike, The tallest hill in England’ [
76]. The dLL clearly distinguishes these two peaks (to four decimals) without the vagueness of names and spelling. The negative indicates west of the prime meridian in longitude and the southern hemisphere in latitude. This dLL usage provides compact, unambiguous locations for a map reference, geomorphological feature, or sample point. Importantly, the value can be pasted directed into Google Earth, GE, OpenStreetMap, and, in the UK, the British Geological Survey’s ‘BGS Viewer’. It can be used in Swisstopo’s ‘Journey through Time-Maps’ to see landscape changes over the time of Swiss cartographic expertise. This is especially useful to investigate glacier changes since the Little Ice Age maximum [
77].
Together with a dLL specification, additional information can be appended:
@ Date/time as dLL@2025; the date, for example, of GE imagery used.
xyz bearing-direction from location as
SU[54.4478,-3.2247]317, on which the Wasdale Head Inn is located. The digraph label
SU[54.4478,-3.2247] summit location, and
XO survey site (
Figure 2). Other examples of these geomorphological mapping digraphs are given in
Table 1 below.
The separation of the peaks Scafell and Scafell Pike (previously known as Scawfell and encompassing a wide area) is mentioned above. A visitor to northern England might examine the Wikipedia entry to gain some prior information and find there the coordinates as 54°26′53″ N 3°13′30″ W or the UK National Grid as NY206064; the latter, being designed for paper maps, is of limited use internationally or on the Digital Earth.
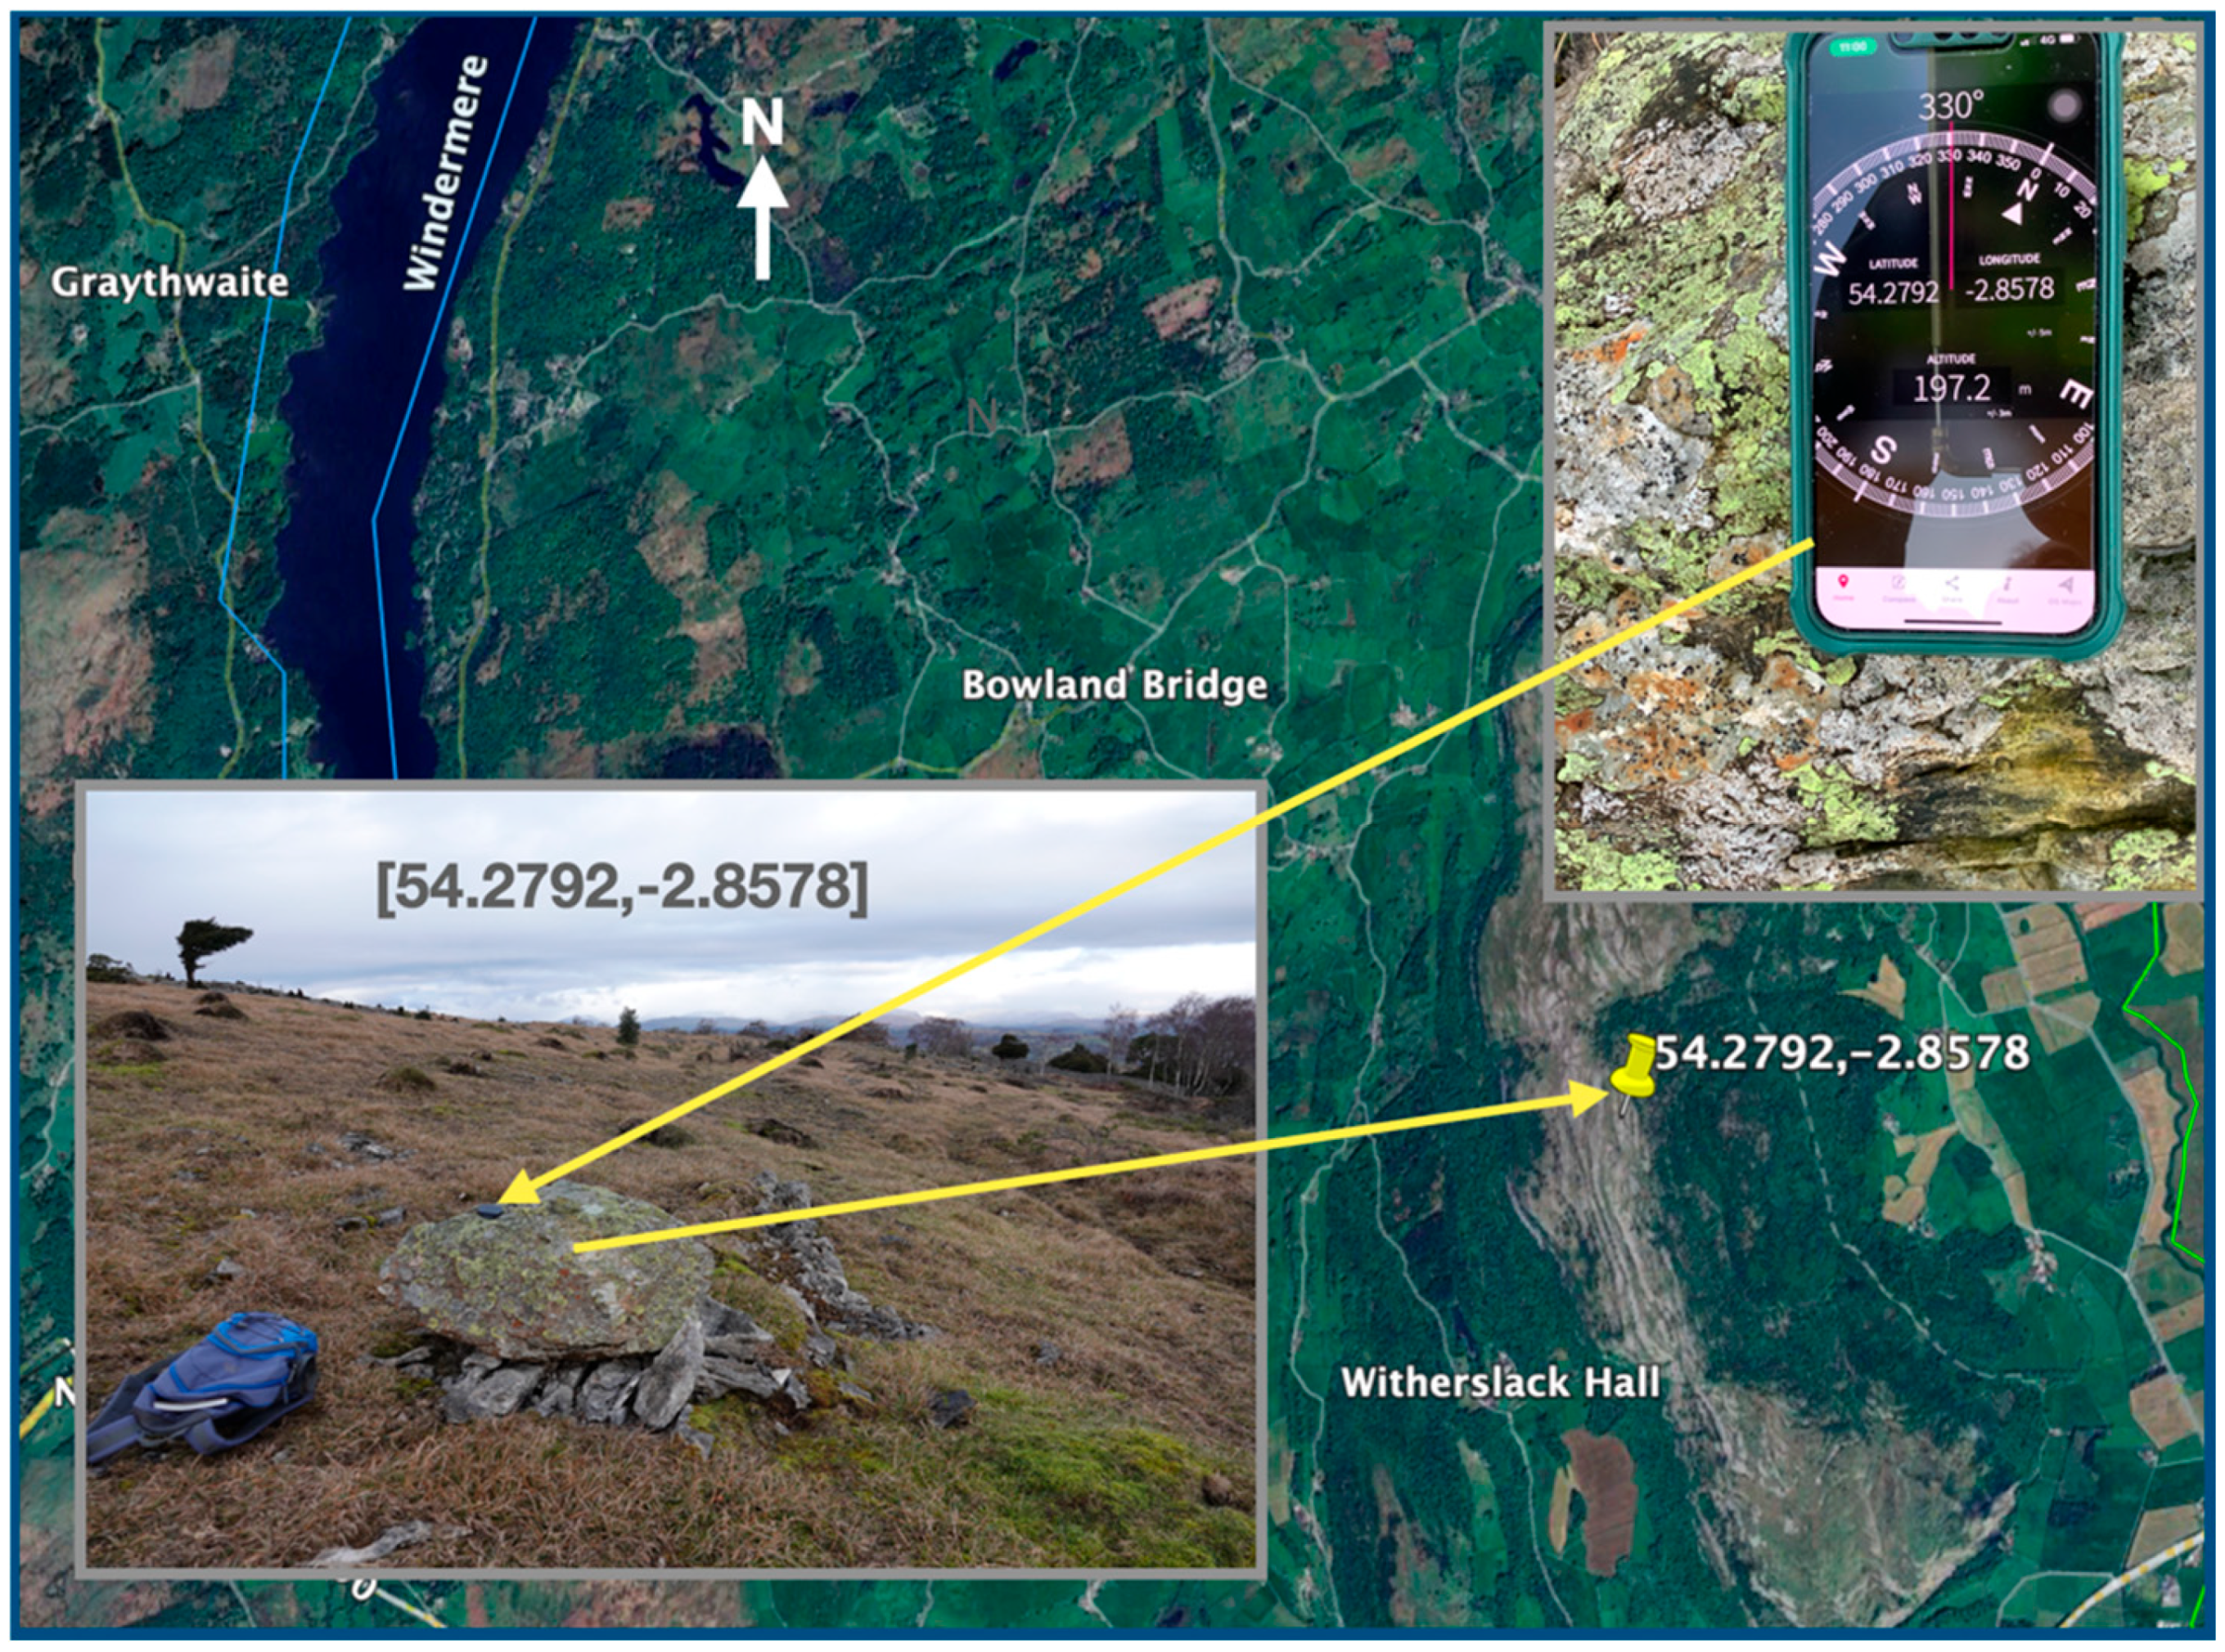
More precise identification can be obtained using dLL, even when using a personal digital device such as mobile (cell) phone. For example, the Borrowdale Volcanic Group erratic on the limestone of Whitbarrow
SU[54.2761,-2.8586], noted by Francis et al. [
78], can be identified at boulder discrimination level for ‘outcrop location’,
XL[54.2792,-2.8578], which is visible on GE. This precision was achieved with a hand-held iPad using the
OS Locate App (
Figure 3). Dedicated GPS hand-held devices may be required for some purposes, and surveying precision can achieve 6–7 decimal places. This may not be necessary for most circumstances, but fixing sampling sites for cosmogenic ratio measurements may require this precision. Results from expensive analyses should be tabled with dLL geolocation so the data become FAIR compatible: findable, accessible, interoperable, and reusable.
The dLL location in
Figure 2A was determined by retrospective examination via GE image using the map in King [
36]. The location in
Figure 3 was found using the
OS Locate app and checked with GE. However, many locations given in papers rarely provide precise geolocations and frequently only provide place names (toponyms). This is especially unfortunate if dated features are mentioned but are not geolocated. As an example, the detailed results presented by Winkler and Lambiel [
79] for rock glacier dating in New Zealand have a ‘sample ID’ but no geolocation. Barrell et al. [
80] provide tabulated deglaciation dates but with separate latitude and longitude (five decimal) values. Location should be
single value dLL, as with the tabulated analytical data for moraines in South Island New Zealand [
81]. Unfortunately, glacier dating on North Island [
82] has no geolocation. The adherence to FAIR data principles would benefit science in general. The significance is that the data are not just ‘dates’ but
dated locations. It is the location that gives the date (or other analytical data) meaning in relation to other locations. A related issue of dating a rock avalanche and rock slope failure brings into play the locality of boulders sampled for dating and their topographic position as part of the interpretation of an event [
83] at [54.49457,-2.89387]. The authors suggest that:
With the application of cosmogenic surface exposure dating to the Lake District RSFs (rock slope failures) now taking place we are at the beginning of a new and exciting chapter in the story of the local post-glacial geomorphology. However, it is a chapter that may well take a long time to write and it will undoubtedly undergo several revisions along the way. [
83] (p. 34).
This story is likely to be written in many other locations over the globe, not just in northern England. But as dating becomes cheaper, the mapping and re-sampling of deposits will need geolocated data to be recorded within Digital Earth. Furthermore, there is a local sampling problem, on a block of rock in the slope failure. ‘Surface exposure dating’ relates to a surface exposed to the atmosphere to accrue a ‘signal’ that decreases with depth. However, a block, say a metre cube, may have different exposed sides according to the final position on the slope and thus different ‘dates’. Precise dLL geolocation will be required to disentangle complex results. An example of the need for dLL specification of dated boulders or moraines is given in
Section 10.
A series of dated locations is a transect, as for example with Kaplan et al. [
81], and provides comparison with other transects perhaps related to climatic events. The same principles apply to, for example, tracking a flood wave down a river as the result of a weather event. The locations of gauging and sampling stations, sampling points in lakes, etc., are important to show climatic and anthropogenic influences on flooding [
84]. Enabling such (Lagrangian) tracking to be conducted digitally allows comparisons with other areas and systems such as kinematic waves and queueing theory [
85].
Transects and Linear and Areal Changes in Topography
The importance of transects in reconstructing beach histories and responses to climate and weather events was part of Cuchlaine King’s [
86] study at Marsden Bay, Northumberland, [54.978,-1.378], where a 3 decimal precision is sufficient for geolocation. Although King used a local fixed point for her repeat surveys, as far as is know, it is not possible to precisely geolocate her transect starting points. Beach profiling, now aided by GPS/GNSS and radar techniques, is still important for collecting storm-beach data as well as coastal erosion along beach cliffs [
87,
88]. dLL located traverses are one way in which long-term repeated surveys could be placed in the literature.
The potential repeatability of transects using UAVs (drones) is increasingly significant for many studies in steep and mountainous areas. Initial mapping can be used as a transect, with geolocated landforms being used for identification. Geolocation via dLL makes these techniques easier to employ, whether imagery is taken from GE, specialist satellites, InSAR flights, or repeated photography. Whalley [
89] used dLL as a basis for linking geomorphic information at a point as an ‘information tensor’. Changes in topography, processes, and materials can be recorded in this way.
The ‘erosion surface problem’ has long been part of interpreting the geomorphology and Tertiary geological history of the British Isles. That is, the determination of ancient erosion surfaces as part of a ‘denudation chronology’ approach. More generally, as Jonathan Phillips [
18] (p. 159) mentions:
Accordant summits have been viewed by some geologists, guided by a convergence plot of peneplanation, as evidence of uplifted former erosion surfaces. However, at least seven alternative explanations exist …
Cuchlaine King discussed some of these problems [
90]. She was an early adopter of quantitative methods [
91] and used ‘trend surface analysis’ for an exploration of the Askrigg and Alston Blocks in the Pennines in a later paper [
92]. It is interesting to note the collaboration here with John T. Andrews. One of her students at Nottingham, and then in Canada, he ran the program for her in Ottawa. An interest in trend surfaces to explore geomorphological data continued with work by Unwin [
93] on corries (cirques) as a way of quantifying glaciated mountain landscapes by looking at altitudes and orientations of 84 examples in North Wales. A counterpart in more recent mapping and morphometry is presented by Evans et al. [
94]. Unfortunately, none of the original data from these early cartographic experiments in evaluating large areas still exist, so it is not possible to re-run the data to examine information outliers. It would be possible to use digital elevation models (DEMs) to extract the data, add more information as tensors, and allow digital comparison with other areas. With individual data points, perhaps representing information surfaces such as altitude, it is possible to extend the types of analysis. Splines provide one way of smoothing trends [
95] and predicting time series [
96]. The acceptance and use of dLL locations by other disciplines could extend the utility of ‘traditional’ geographical investigations [
97]. For example, this might incorporate the investigation of plant community patterns [
98] alongside many other ‘variables’ and contexts [
99,
100]. One aspect of making geomorphology more scientific is ‘modelling’ in all its guises, but particularly processes modelling: deterministic, ‘statistical’, and via simulations. King collaborated with Michael McCullagh in the development of the computer simulation Spitsym [
101] to simulate the behaviour of Hurst Castle Spit,
CS[50.7063,-1.5502]. The use of data from field-approaches by dLL point sampling now starts to open areal analysis using graph theory and knowledge graphs [
102].
7. Areal Syntheses of Geomorphology: Information ‘Fields’ and Landscapes
Geomorphological texts have long been central to data collection. In glacial geomorphology, Böhm’s [
103] astonishing compilation of work on moraines contains 650 references, complete with definitions and cross-references. However, it lacks maps, diagrams, and photographs that would make temporal comparisons useful from times of near-Little Ice Age glacier extents. Cuchlaine King published the Northern England volume in the ‘Geomorphology of the British Isles’ series [
23]. King’s structural differentiation of Northern England used factor analysis of drainage development and denudation with trend surfaces in the central Pennines. More widely, in collating the information about the geomorphology, King [
23] also assembled the geological and geomorphological landscape information about the area—the landscape domain
. It is still the only geomorphological overview, although there have been sub-regional additions [
104,
105,
106] and the British Geological Survey’s Regional Geology guides [
107,
108] that need to be encompassed by any digital overview. Thus, an immediate question concerns the compilation of additional information made about landscapes in the north of England
in the 40 years since King’s compilation. Further, how might it be assimilated into all later information about geomorphological, earth, and soil science investigations? Unfortunately, none of the compilations and lists have digital georeferencing. Until we do, synthesised information lies outside the Digital Earth. There are difficulties incorporating past, non-digital, observations into a digital world associated with Large Language Models. The problems of ‘messy bundles’ of textbooks (or coffee table books) and their lack of geolocation have been mentioned above.
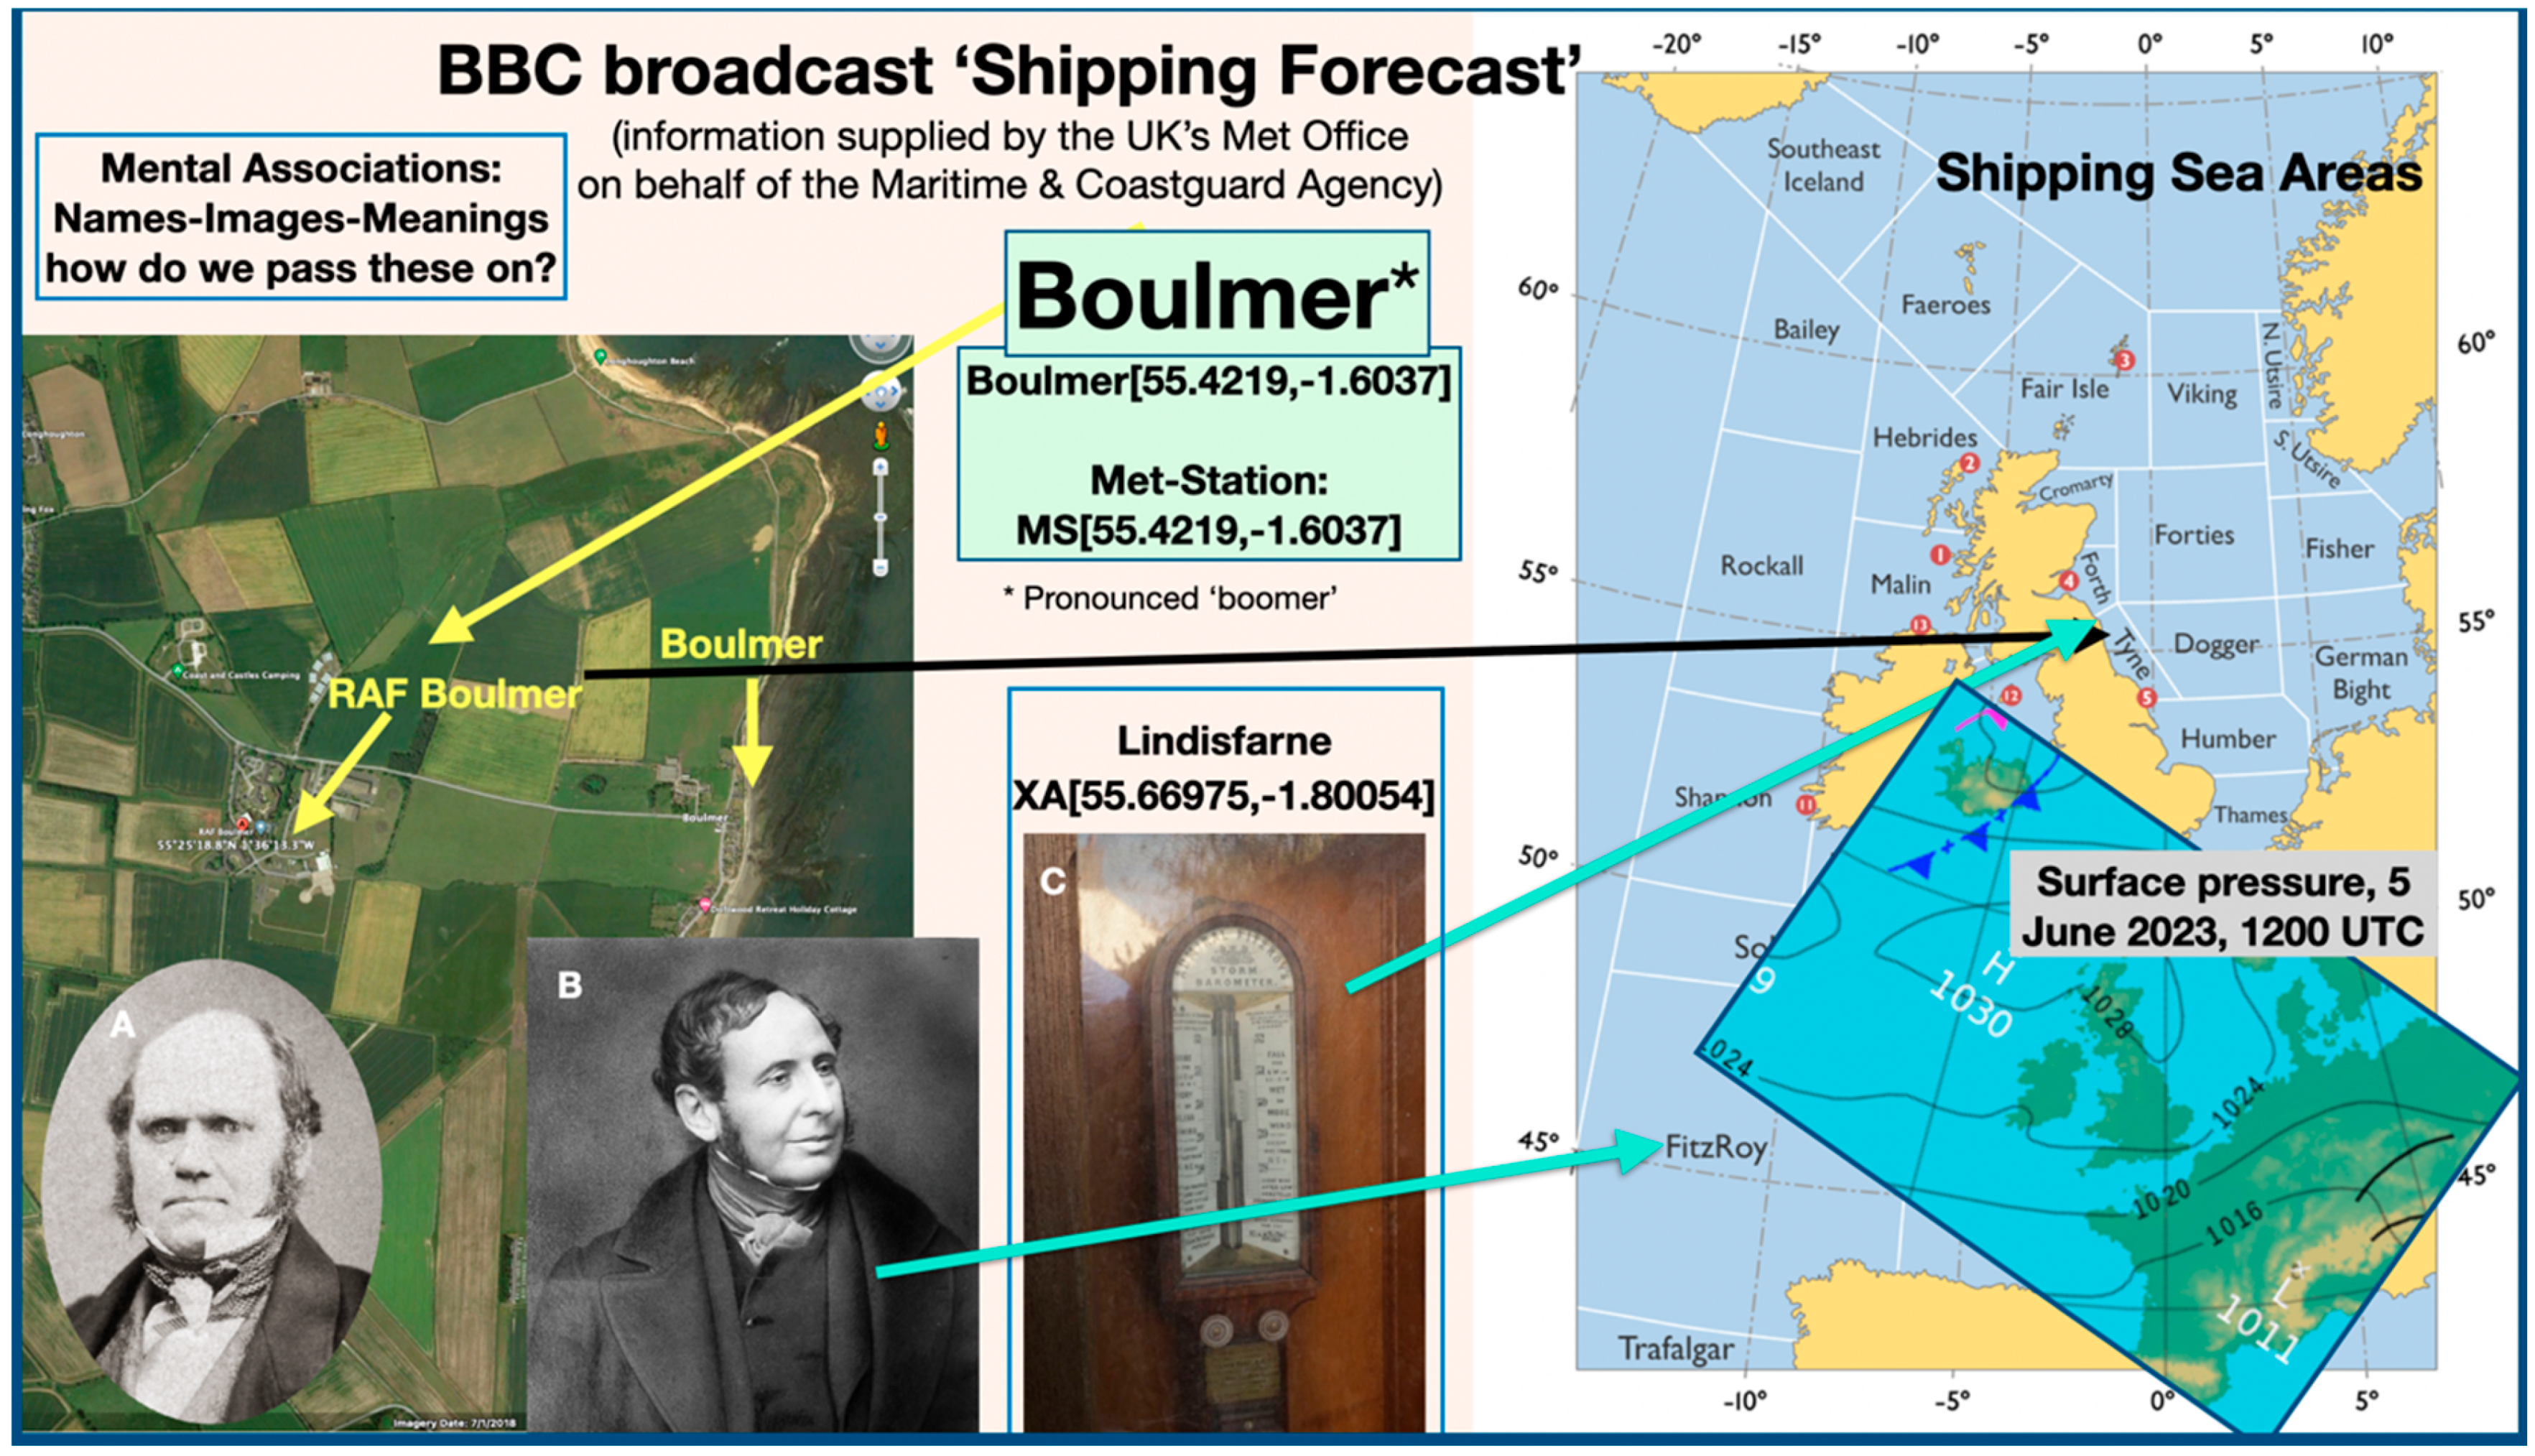
After graduation in 1943, Cuchlaine King became a member of the Women’s Royal Naval Service and was posted to Northern Ireland to assist with weather forecasting. As such, she would have been familiar with the UK BBC radio broadcast of the ‘Shipping Forecast’, colloquially known as ‘The Ships’, broadcast daily. It is a weather forecast for sea areas and coastal weather stations around the coastline of the British Isles. This is a daily audio story, saying what weather conditions were like at a given time and what the weather conditions are likely to be at a large scale (the sea areas) as well as around the coast. In concise form, this up-down scaling comes from atmospheric pressure data. Cuchlaine King would have been very familiar with forecasting from her knowledge and meteorology from her undergraduate degree and during the war. Meteorology and forecasting are part of her approach to ‘regional and continental scale studies’ in the text ‘Physical geography’ [
109].
Classical fields represent physical conditions that can be measured; pressures, temperatures, and tide heights are familiar examples. At a meteorological station, an earth surface point, scalar information is collected about the field of sea-level atmospheric pressures at known times. These specific values can be mapped to produce, e.g., a 500 hPa pressure, field, surface. Pressure, temperature, and rainfall are scalars and, when measured at a point, can be interpolated and mapped.
Gradients of the measured phenomena allow inferences to be made for large areas, such as winds for sea areas, to be predicted. These can be presented, in digital or symbol form, as a vector value at a point. Similarly, a borehole location gives (mappable) data about the soils, sediments, and solid geology of the location, which is then upscaled and interpolated to give an information field, e.g., of a soil horizon or unconformity. Each square metre can be represented by a unique, 6 figure (more/fewer) decimal, latitude and longitude dLL. The Boulmer Met station used in the shipping weather forecast is at MS[55.4219,-1.6037]. Information (such as air pressure at a specified time) can be allocated to each point (square). For the UK’s sea areas, this is much larger than a square metre, while for some purposes, such as particle tracking, it will be smaller. Use of dLL provides unique labelling, unlike place names (toponyms), for location of landforms and allows up-down scaling as appropriate.
Stories have been constructed between various aspects of the places mentioned by the ‘Shipping Forecast’ in paintings [
110], history and reminiscences of a BBC announcer [
111], and a wide variety of poems to the choral composition ’Shipping Forecast’ by Cecilia McDowall of 2011. In
Figure 4, some people and places are included in a constructed story.
These person-place involvements bring us back to ‘storytelling’, not by art or literature but by the geography and geomorphology and changing conditions on the face of the earth that satellite data now make relatively easy to predict. In general, we need to manage the data and information drawn from diverse datasets concerning diverse topics of interest. This aspect of information upscaling from point sources can be used to represent ‘information fields’.
As an example of merging various information points and fields together with ideas, we can use an example of a storyline from meteorology. Hannachi et al. [
112] examined northern hemisphere extra-tropical atmospheric, low frequency behaviour of climate to better understand predictability on intra-seasonal timescales. Concepts such as ‘teleconnections’, blocking systems, and ‘Grosswetterlagen’ have connections with the physical geographers in the UK in the years post-WW2. Meteorologists H.H. Lamb and Jean Grove (a contemporary of Cuchlaine King) and their studies into past climates have greatly influenced UK Quaternary Research. Gordon Manley worked on the late glacial climate of northwest England [
113] and the accumulation of ice and snow on broad summits such as Cross Fell
SU[54.7029,-2.4866] in the Central Pennines [
114]. This work also relates to the glaciation altitude concept developed by Gunnar Østrem [
115] in Scandinavia and British Columbia. The related effects of ‘continentality’ on glacier responses was investigated in Norway by Chorlton and Lister [
116], who, using stepwise regression techniques, found that glacier net budget and ablation gradients were strongly controlled by continentality, distance from ocean, as well as altitude and orientation. At a simple level, this shows the importance of using point, transect, and areal information for data analysis using interpolations of information and data. The significance of Grosswetterlagen in synoptic climate-glaciology using long-term data was proposed by Hoinkes [
117]. This diversity of temporo-spatial data and previous ideas, together with the recent availability of dealing with non-linear fields (phase-space), responses of glaciers to climate is ripe for renewed exploration in the Digital Earth. It is of direct relevance to the glacial history of northern England. For example, the transference of Manley’s ideas on plateau summits led to work on plateau glaciers in north Norway [
118] and back to associated views of glaciation in the English Lake District [
119].
In summary, treating spatial data as fields and linking to other variables such as ‘climate’ and its variability (for example over the LIA in Norway) and topographic controls (distance from the sea and continentality) can also be expanded within digital contexts to other mountain ranges, such as the Hindu-Kush Karakorum and monsoon tracks, or lack thereof, and glacier growth and decay [
120]. The data fields may be from meteorology, topography, or glacier size, but also relate to information in its widest sense. Placing all these data types in a digital setting in Digital Earth-Wikipedia will enable exploration, generate ideas, and formulate new data models. However, this will clearly be a formidable task without some form of digital automation.
8. Geomorphological Information at a Point
Within the landscape tradition of geomorphological approaches, there is no real geomorphological classification system, such as with stars in astronomical catalogues (where entities have location by declination and right-ascension). Morpho-climatic approaches to landscapes do not work; there are no unique mappings of landforms into climatic zones. Indeed, there is so much variability that any one landform identified may differ from a neighbour just a few tens of metres away [
14].
Landforms with their properties, ℙ, may be represented at a dLL point by a ‘geomorphic information tensor’ [
89]. A tensor can contain information about the materials M, processes P, Geometry G, and Biota B. Stress and strain tensors, typically used in soil and rock mechanics, are related to the materials and may show the effects of water pressure in the materials identified. Transects can be used to record landform changes, properties, and attributes. Materials of landform-landscapes respond to changing stress fields, especially water content, over varied time intervals. Landforms exist in meteorological fields (pressure), rock type, and soil water pressures. Combined, as with heavy rainfall followed as a storm, a stress deviator may be produced in the resistive material by rapid fluctuations in pore water pressures. Thus, field changes may produce geomorphological action at a point but have wide-area effect such as movement of a storm of a landscape. Variations in fields can thus have specific effects at landform points. We might also need to merge information at a point or in an area [
121].
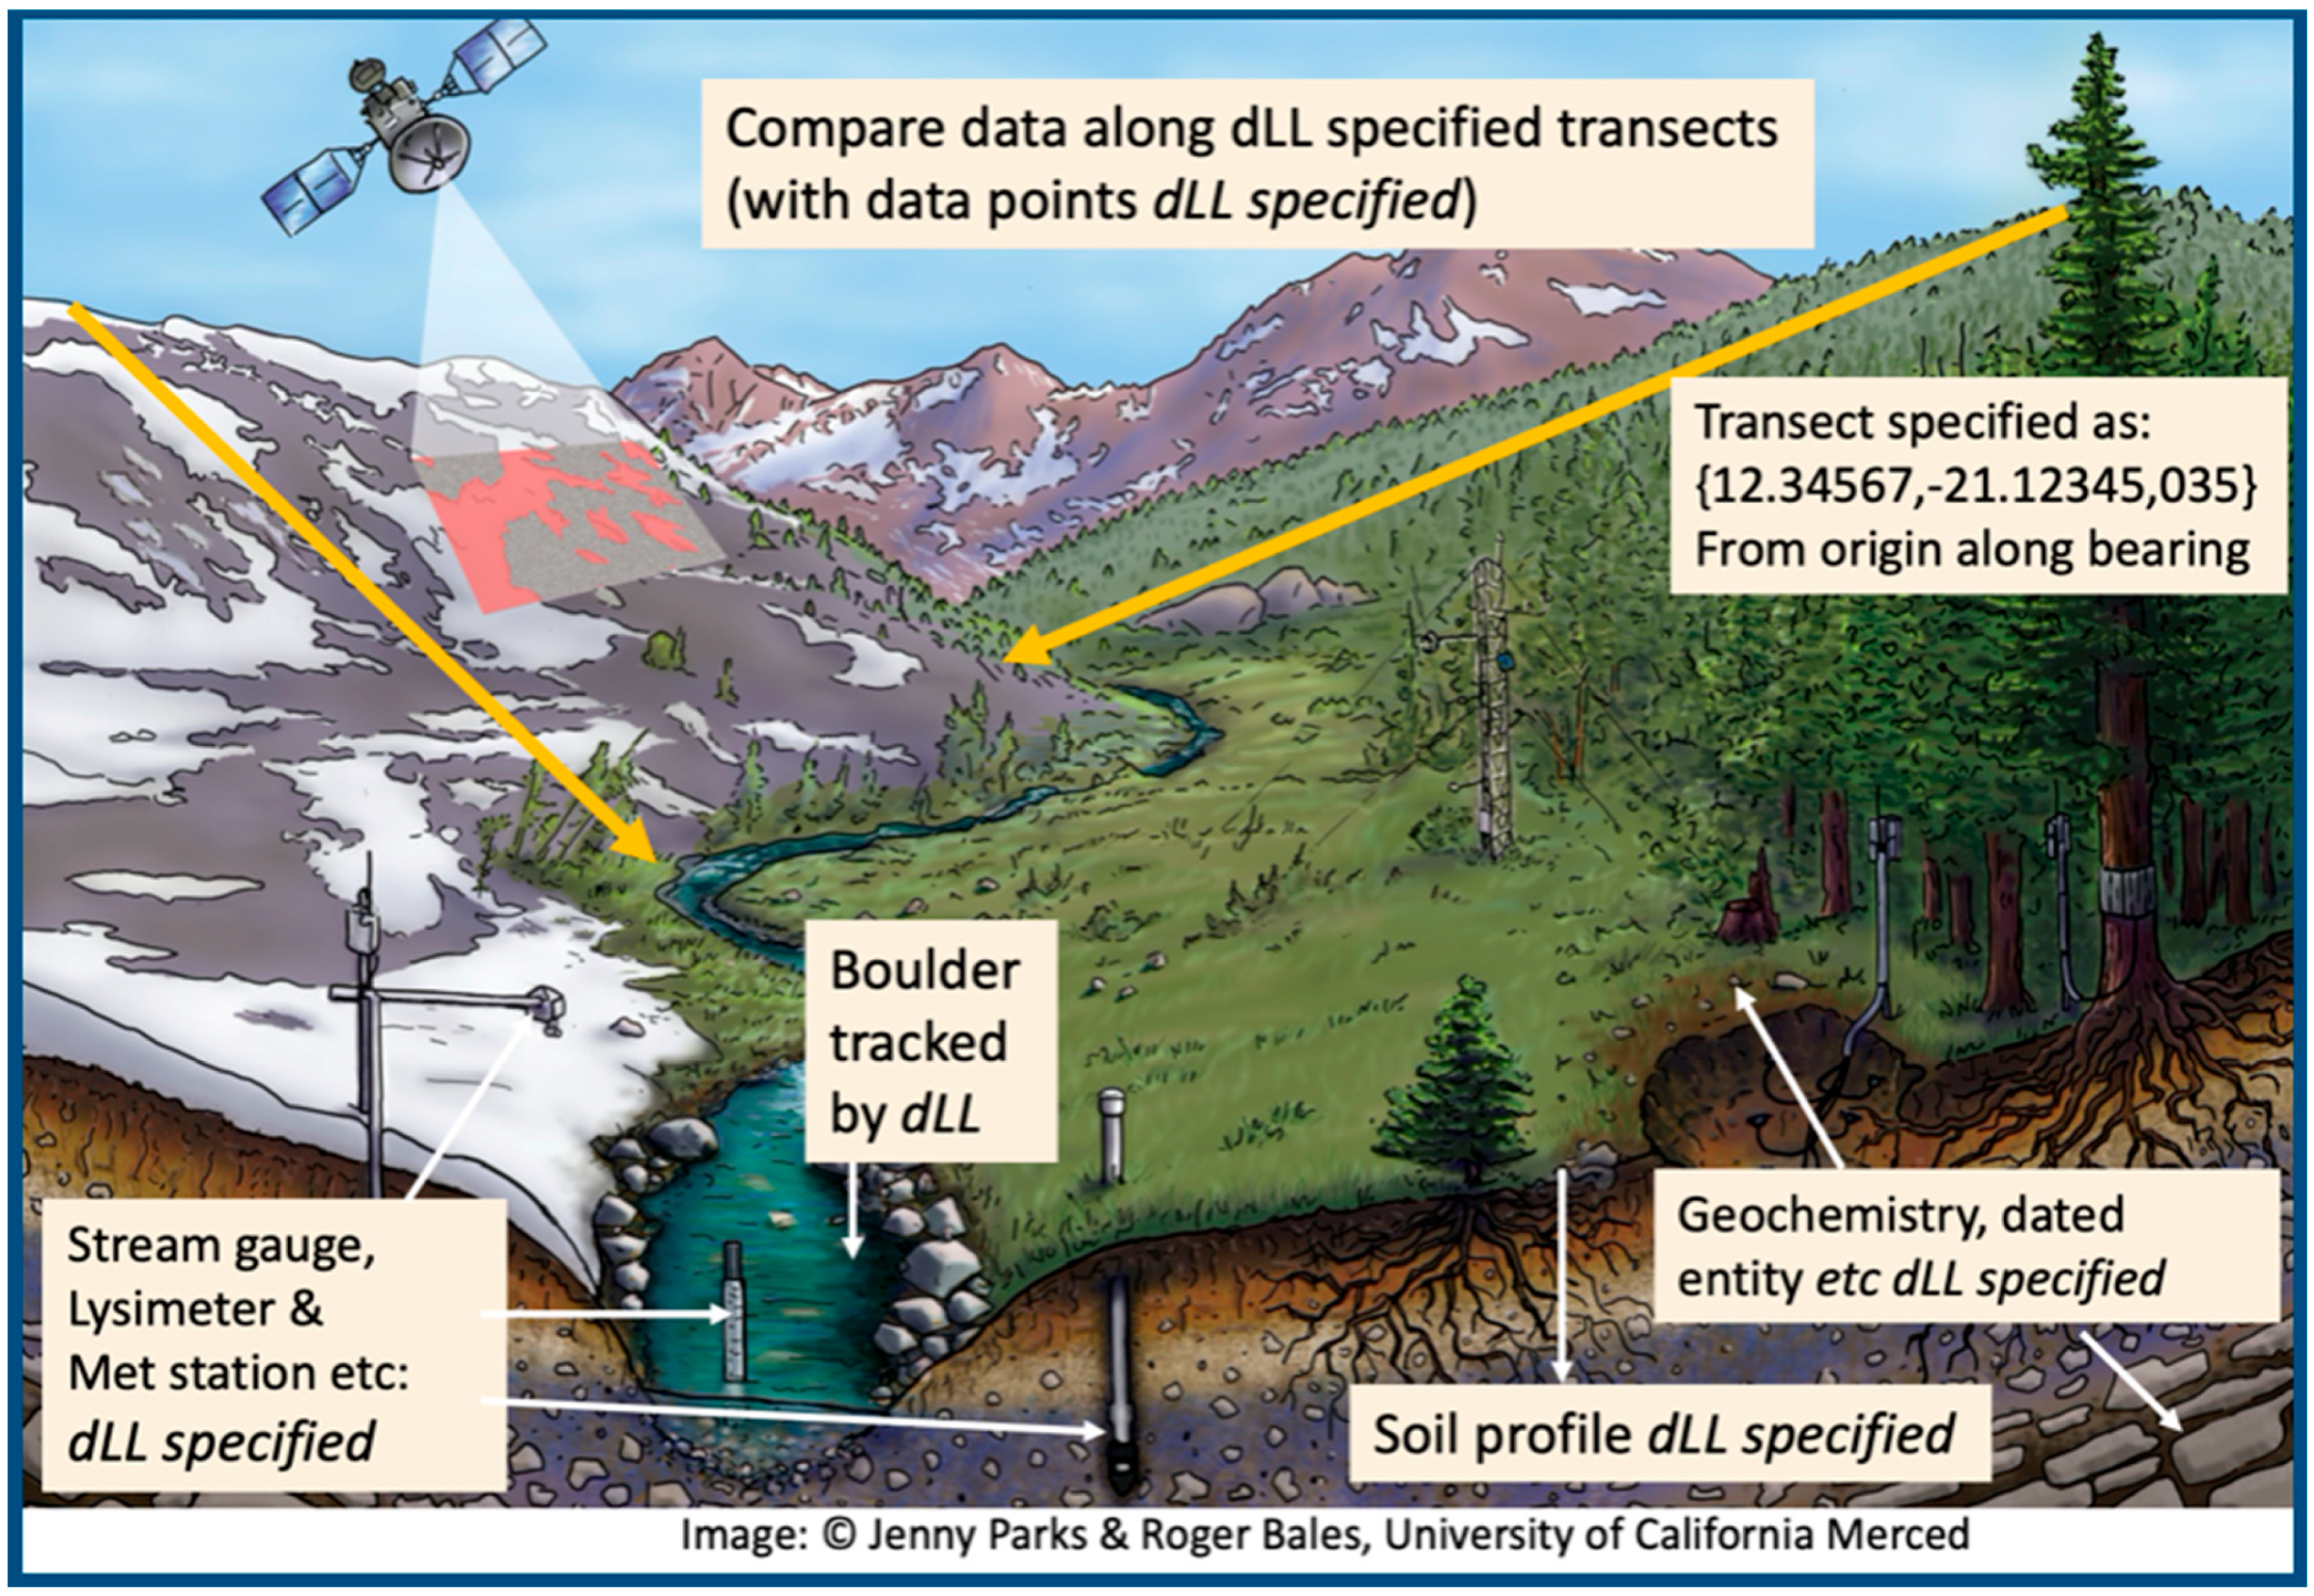
The critical zone is a set of ideas about the nature of the interconnectedness of the earth’s near surface (
Figure 5), being critical to life on earth [
122]. In
Figure 6, the schematic of
Figure 5 suggests ways that the ‘fundamental unit’ for geomorphological use of a metre square can be upscaled (areal view) or downscaled for detailed sampling. At each locus there will be a set of properties ℙ (data, information) associated with it; dLL (information of any kind).
Figure 6 indicates ways in which properties, ℙ, can be resolved spatially by geolocation. Geological mapping is a long-standing methodology. In a digital form, we might want to add data from many other information surfaces, and a dLL allows this to be achieved.
9. Digital Earth and ‘Geographic Integration’
In an attempt to promote ‘unifying geography’, the book by Matthews and Herbert [
123] suggests that:
‘It is argued that the differences in content and approach between physical and human geography, and within its subdisciplines, are often overemphasized. The result is that Geography is often seen as a diverse and dynamic subject, but also as a disorganised and fragmented one, without a focus’
Whatever the merits, or demerits, of the arguments in this book, there is no doubt that ‘the literature’, formal, academic, and popular, as well as various forms of visual and sonic art, have multiplied greatly in the last twenty years since its publication and extends beyond what has traditionally been ‘geographic’. In the schema proposed here, that of decimal geolocation in the Digital Earth, information at a point, the traditional subject boundaries become blurred, even though the dLL is essentially ‘geographical’. Location is important in the surveying and mapping techniques used by Cuchlaine King and the examples given above show that decimal georeferencing can be extended to the digital age. Making the geomorphological literature more searchable allows the community to operate on an information and data co-operative basis. This will allow the subject to grow and be the focus for other scientists, such as those working in the critical zone. In general, the aim is to move towards better data quality using the FAIR data principles.
9.1. Suggestions for Improving Literature Searches
The following are suggested to make geomorphology and geographical literature more searchable and better digitally integrated:
Use dLL format for geolocation when referring to places and locations, typically:
- (a)
Investigation sites (generally to four decimal places)
- (b)
In image caption and table metadata, especially of exposures, type sites
- (c)
In reference to exposures and boreholes and sampling point
- (d)
In data tables as the first (index) item in a list, e.g., cosmogenic data
- (e)
In titles, abstracts, and keywords or in a separate list for important locations
- (f)
For gauging, met stations, and other associated data recording sites, such as automatic, time-lapse, photography sites.
For inventories of features, use dLL as an integral part of the data as an identifier for the data and identifiable in the data set.
List locations referred to but not part of the site description, as for example in ‘previous work’ to aid cross-referencing together with citation and, if possible, DOI. These can be placed at the end of a document in a similar way to the traditional citation lists.
Data availability should include, if at all possible, a digitally searchable listing that is appended to the paper as with ‘Supplementary Material’. Geolocated point data should be dLL referenced and not solely as KMZ or shape files, although their inclusion should be beneficial.
The suggestions just given can also be used in bibliographies and compendia to make the collection of paper (i.e., bundles as used in the sense of a folder containing documents relevant to a legal case). The ‘messy bundles’ currently published can be made into digitally searchable bundles (DSB) by adding other digital properties to digital geolocation. Specification of a dLL geolocation is a digital token that provides significant information and the addition of a digraph token adds to this.
Although the foregoing is related to geomorphology and dLL application in the earth sciences [
124], the schema can be used more generally, for example telling geographical-geomorphological-geological-environmental stories in space and time. The information at a point is a data set associated with the location whose diversity is not just geotechnical or ecological. Point data can be represented as a property graph where nodes, dLL, represent entity data with properties that can be scalars, vectors, or tensors. Relationships can exist and be mapped between nodes. The dLL information set can be treated as a packet of information associated with the dLL. Thus, questions of ‘what do you mean by …?’ can be shown by example. In
Figure 1, a landform term query for mesa, butte, inselberg, table mountain, tor, tepui, tuya, koppie, monadnock query might be answered by the information set for a specific example such for a tor: {
TO[dLL], DOI of paper}. Enquiries into the literature might be used to produce such strings of specific interest for comparison or tabulation as an inventory.
Specified locations can move and be tracked to new locations; this is a Lagrangian point of view. An example would be a boulder moving on the surface of a glacier or deposited as a moraine at the terminus; Czuba [
125] has given an example from a gravel-bed river. Times can be located with points or interpolated from measured data. This complexity will be considered elsewhere in terms of connectivity and graph theoretical considerations.
The simple addition of a dLL, used in data collection and recording of places, landforms, and measurement sites, can be used in a variety of ways to enhance information about a point and to share it. If a dLL is given in a paper then it can be used in Google Earth, or even Google Mars for Martian geography (mdLL), to locate and view the feature. This search process assists interpretation and semantics problems (
Figure 1) but overall effectiveness depends upon the provision of dLL for present, past, and future observations and data recording.
9.2. Practical Use of Adding dLL to Place Labels
This paper shows that a unique form of georeferencing, decimal latitude/longitude (dLL), is necessary to geolocate places and features such that the literature can include such entities in ‘information space’. This needs to apply to present literature as well as the past to make best use of previous investigations in space and time; to make the literature more easily searched is to improve information connectivity. For example, to help answer the question ‘where is the place you mention?’. Thus, which pub called ‘The Robin Hood’ do you mean? Even adding ‘near Sheffield’ may be ambiguous given this is a common place name [
14]. Adding a dLL to the place label gives a basic information set: public house{Robin Hood[(53.2456,-1.5820]}. The dLL can be computer recognised and pasted directly into Google Earth, OpenStreetMaps, or many other applications. Further, information and directional connectivity can be added: public house{Robin Hood[(53.2456,-1.5820]}: public house{The Grouse[(53.2976,-1.6136]}. The importance of the integrity of {local label[dLL]} is clear. However, rather than maintain its {information content}, tokenisation for a LLM may want to break this down and this may not be helpful. At the very least, using a dLL should help to avoid interpretation errors.
10. Large Language (Geographical) Models
The previous sections have concentrated on the utility of decimal geolocation within the geographical literature, with specific examples from geomorphology. Typically searches may be conducted in Wikipedia or perhaps Google Scholar, but the volume and complexity of material not yet digitized presents a considerable challenge.
The dLL schema can also be considered in the development of large language models (LLM), especially in large language geographical models, where geographical here means identifiable by a dLL. In this context, large is currently rather small, but such models have to grow. A LLM is ‘trained’ on a large data set, usually internet text, so the model can ‘learn’ language patterns, grammar, and context. These are the ‘parameters’ of the model and define how it behaves. It is often the context that presents interpretational problems to produce ‘ghosts’, that is ‘hallucinated content’ or ‘phantom knowledge’, such as a non-existent research publication. The ‘transformer’ architecture has become a common LLM technique with the idea of ‘attention’. This allows a large amount of parallelism in training and pre-training involving encoding and then decoding information. Tokenisation is the general process of splitting or breaking down text into manageable units, as numerical tokens that are fed into LLMs as ‘features’. Statements about particular LLMs may state that they are trained on ‘1T tokens and feature 2B parameters’, where T is a trillion (1012) and B a billion (109). Tokens and parameters might be dLL entities that can be recognised within information input streams. For geomorphology and other surface features, digraphs might be another token. This would be especially useful for the incorporation of images into LLMs. The use of dLL in LLMs has yet to be explored but might go hand in hand with geospatial digitization of the geomorphic literature. Geographic large language models need to include Vision Language Models (VLMs), which contain components that have:
An ‘Image Model’—responsible for extracting meaningful visual information
A ‘Text Model’—to process and understand natural language processing
A ‘Fusion Mechanism’ or strategy—to combine the representations from image and text models.
Both image and text models need to be trained with data that are dLL geolocated.
Geospatial digitization and organisation of information and data is now part of storytelling, as exemplified in the use of some of Cuchlaine King’s research and textbooks outlined here. The importance of practical knowledge transfer and structures and epistemology has been illustrated by Valleriani [
126] across a wide variety of areas. Geospatial referencing has a wide potential, for example in archaeological landscape studies [
127] that are largely location-based rather than spatially referenced but where digital and spatial referencing techniques promise improved modelling [
128] outside ‘traditional’ geographic methods. Gattiglia [
53] pointed out the need to accommodate ‘big data’, as noted previously. Data acquisition techniques, especially those acquiring large amounts of digital data, will assist digital storytelling in many areas. The simple expedient of dLL implementation will assist such moves, especially within the use of Large Language Models. Valleriani [
129] made a recent plea for responsible use of LLMs, particularly in the ‘landscape of historical research’, where it is time ‘to build public, open-access LLMs for the humanities’. Valleriani [
129] indicates concerns related to:
- (a)
opacity: we often lack insight into training data and embedded biases,
- (b)
instability: access terms and capabilities may change without notice, and
- (c)
inequity: many researchers, especially in less-resourced contexts, are excluded.
Establishment of Large Language Geographical Models to encourage information connectivity and Bayesian techniques [
130] and modelling confidence [
131] with reference to the FAIR data principles should help with these aspirations.
Using Data Storage with [dLL] and Geomorphological Questions in Practice
Bowden [
131] (p. 157–158) states:
Models are required, ‘because we do not have complete knowledge, in time or space, of the system of interest. Models are constructed in an attempt to represent the system and its behaviour based on interpretation of observations and measurements (samples) of the system, combined with informed judgement (expert opinion) and, generally, constrained for convenience by the limitations of the modelling medium.
‘Big data’ are needed to evaluate complex models. For geomorphic models with changes in space and time over areas from metres to hundreds of kilometres and times ranging from seconds to millions of years, we clearly need better devices, not of measurements so much as data storage and availability, FAIR data, but also cost-effectiveness of the data once produced. Only when this data/information is available for populating not only Digital Earth and Wikipedia but specifically geographic LLMs can much headway be made in producing better models. However, papers that contain geomorphic data are rarely, if ever, cross-referenced.
Table 1,
Table 2 and
Table 3 shows how this might be accomplished.
Kaplan et al. [
81] (Table S1) with samples also from Irishman basin [
79] provide cosmogenic data for the same area, as in
Table 3, but which again is not geospatially resolved for the dates given but again relies on sample numbers, rather than [dLL], as row headers.
Table 1.
Example of using [dLL] in tabulated data by recording and linking [dLL] to DOI. A feature with a Scottish toponym can be identified by a [dLL] and associated with published papers that refer to it by author/date but also, and particularly, by DOI.
Table 1.
Example of using [dLL] in tabulated data by recording and linking [dLL] to DOI. A feature with a Scottish toponym can be identified by a [dLL] and associated with published papers that refer to it by author/date but also, and particularly, by DOI.
| [dLL] | Location | Authors | DOI | Mapping Entity Label | Comment |
|---|
| [55.8798,-6.0241] | Beinn Shiantadh, Jura, Scotland | Dawson, 1977 [132] | 10.1144/sjg13010037 | RG/RF | Rock glacier RG, fossil forms? Possible rockfall/slide RF |
| Dawson and Ballantyne 2021 [133] | 10.1007/978-3-030-71246-4_11 |
| Whalley, 2024 [14] | 10.1002/ppp.2217 (t001) |
| Information set 1 | What is at?: [55.8798,-6.0241]{RG/RF, 10.1144/sjg13010037, 10.1007/978-3-030-71246-4_11, 10.1007/978-3-030-71246-4_11 (t001)} |
| Information set 2 | Feature known as rock glacier or rockfall: RF/RG{[55.8798,-6.0241]10.1144/sjg13010037, 10.1007/978-3-030-71246-4_11, 10.1007/978-3-030-71246-4_11 (t001)} |
| Comment | DOIs located via Crossref. Table001 = t001 allocated as a term to the paper’s DOI, e.g., PLoS ONE |
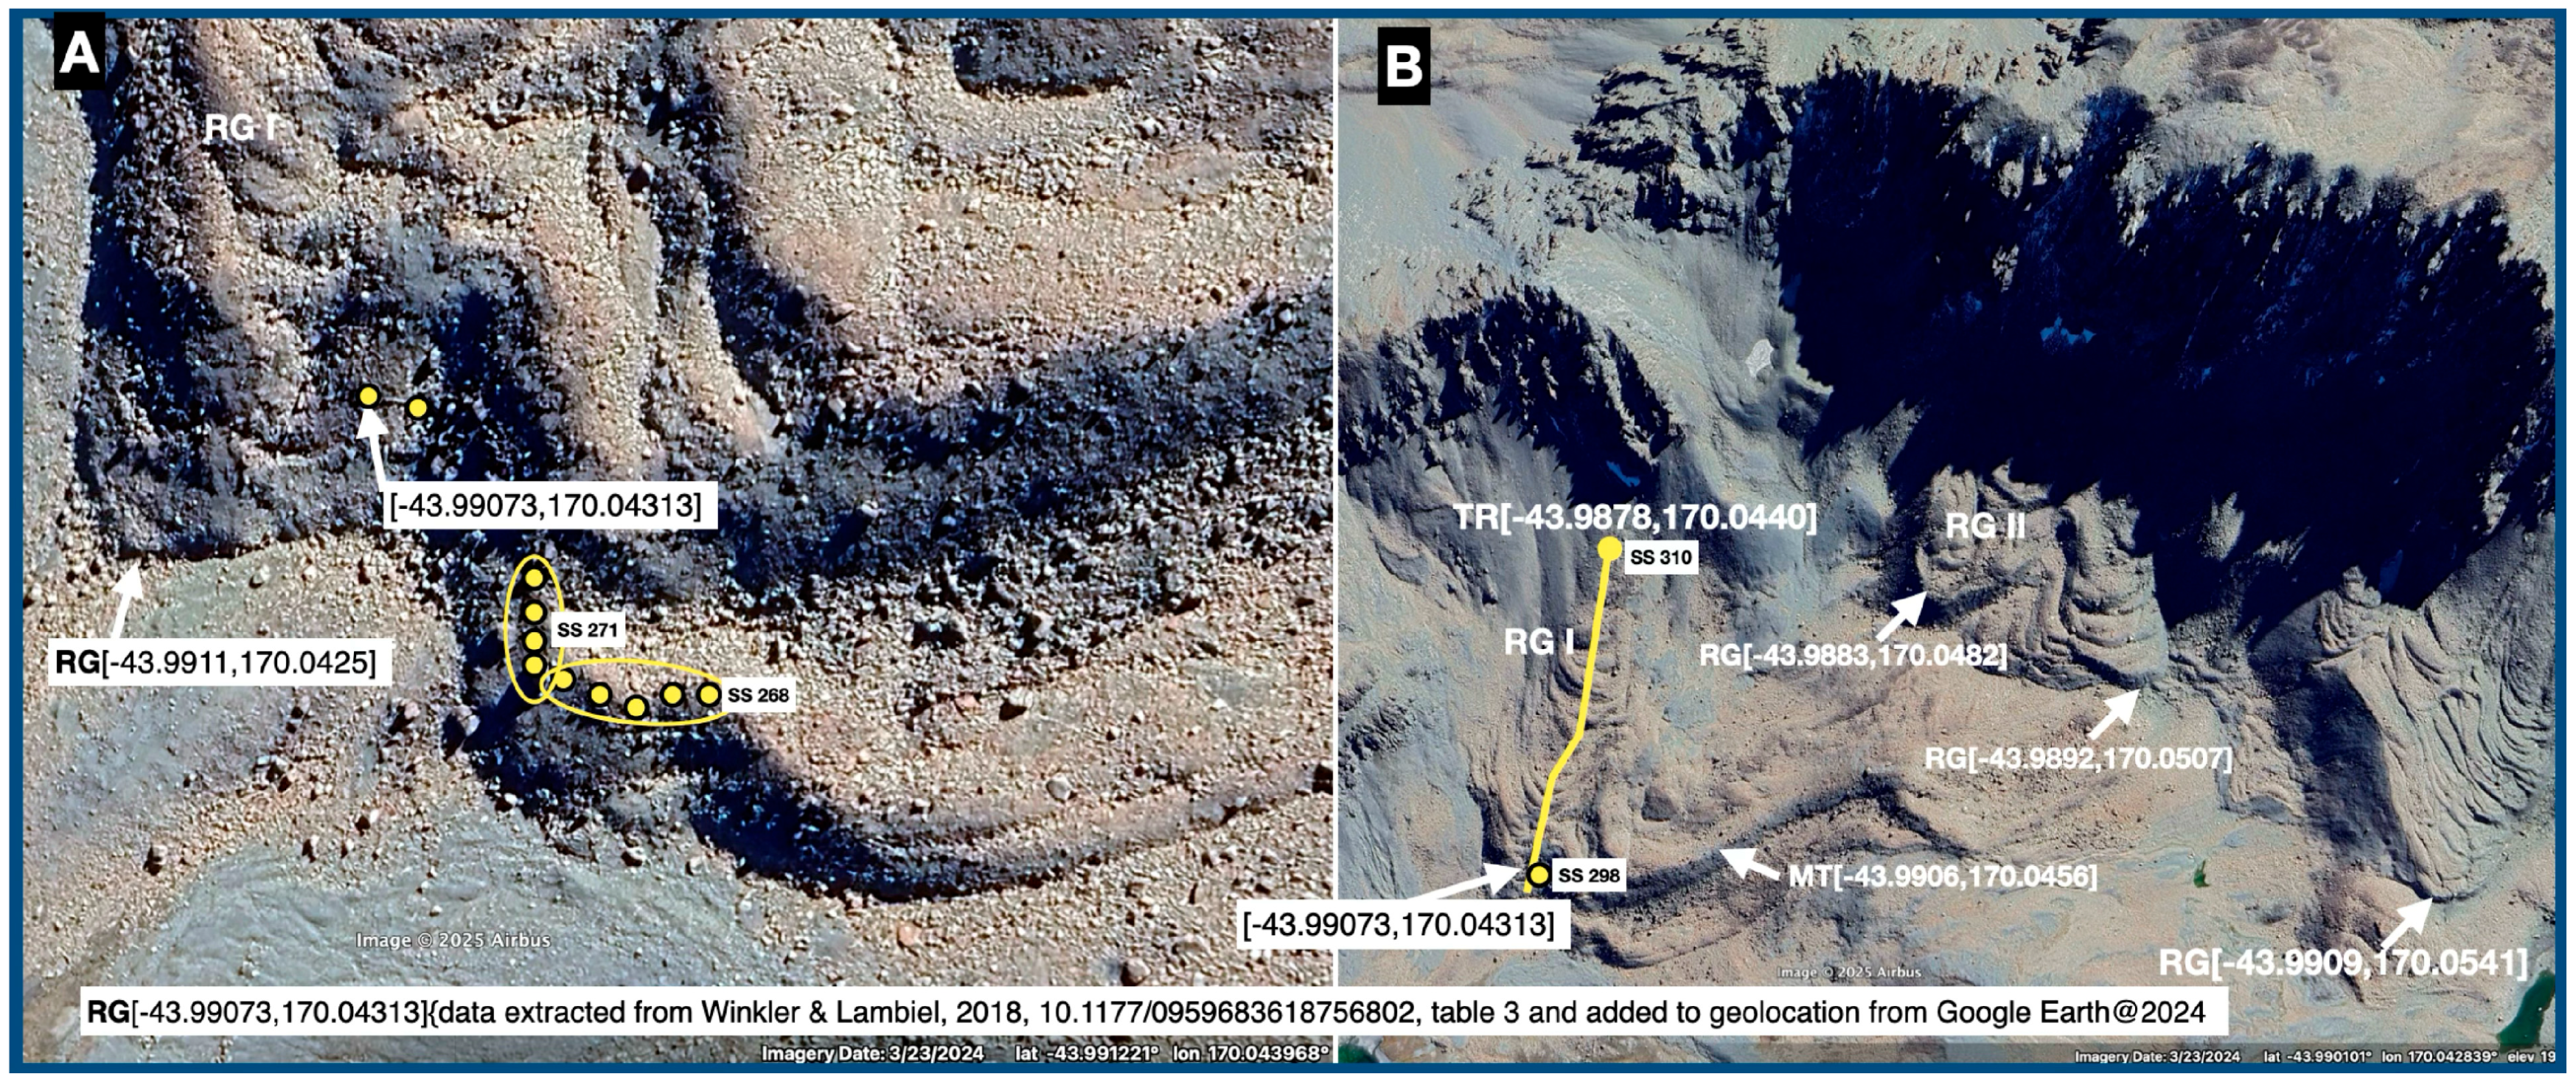
Table 2.
Adding [dLL] to provide locational information can be attached to a DOI. Tabulated data from Winkler and Lambiel [
79] has a sample ID as the row header but with no geolocation (top). Below is a row to which [dLL] has been added. This was derived (as an estimated [dLL]) by reading from GE as in
Figure 7. The comments suggest ways in which data can be made into a data/information set.
| As in Winkler and Lambiel [79] Table 3 | ID | Site | R-value | σc | N boulders | |
| SS 298 | Ridge 1 | 55.58 ± 1.90 | 9.54 | 100 | |
| |
| [dLL] added | dLL | ID | Site | R-value | σ c | N boulders |
| | [-43.99073,170.04313] | SS 298 | Ridge 1 | 55.58 ± 1.90 | 9.54 | 100 |
| Comment | [dLL] added from Google Earth inspection (Figure 7) and now provides an information tensor:
[-43.99073,170.04313]{ SS 298, Ridge 1, 55.58 ± 1.90, 9.54, 100}
that can be compared digitally to other locations and traverses, see Figure 7. |
Table 3.
Adding and converting temporal data. In the cosmogenic ratio data in Barrell et al. [
80] (
Table 1) has separate latitude and longitude values associated with sample numbers, but [
80] (
Table 2) has ages associated with the sample numbers (top). The lower part has these brought together using a unified, and therefore more tractable, [dLL] as row header.
| Data From Barrell et al., 2019 [80] doi.org/10.1016/j.quascirev.2018.11.003 |
|---|
| [80] Table 1, first four columns | [80] Table 2, first three columns |
| Sample ID | Lat (dd) | Long (dd) | Elev S (m) | Sample ID | Original Age | Original age error | New Age |
| BD1 | -43.60983 | 170.87189 | 552 | BD1 | 18900 | 900 | 18606 |
| |
| dLL | Elev S (m) | Original Age | Original age error | New Age | Sample ID |
| [-43.60983,170.87189] | 552 | 18900 | 900 | 18606 | BD1 |
The sample ID is of little value for data processing and it is not relatable to any other data. It is more useful to publish (and thus have available) the location/time data together.
The [dLL] as row header produces a location/age information tensor that can be related to other data:
XD[-43.60983,170.87189]{552, 18900, 900, 18606} |
11. Conclusions
Fieldwork, feet on the ground, as with earth, archaeological, and environmental sciences in general, will remain vital for geomorphology and physical geography, other field sciences, and their roles in policy and decision-making as well as traditional areal explorations. Such approaches are also valid for writing, photographs, and observations. Data are theory laden, and both need interpretation by new data responding to older models, formulations, and data. The fieldwork of Cuchlaine King’s research era still continues and is built upon and appended by remote sensing and dating technologies that generate ever more data points. Such data do not come cheaply, so they must be utilized as effectively, and cost effectively, as possible. To this end, using dLL geolocations allows existing data points to be re-examined as theory changes and new data points can be generated for improved sampling. This is implicit in the FAIR data principles and the generation of ‘big data’ sitting within manifestations of Digital Earth. Individual scientists and research teams can and should add [dLL] to their papers. The data collective, applied to landscapes as a whole, should be able to help solve longstanding problems of landform inheritance. The ‘old’ data are priors and need to be used in model building. The interpretation of detailed mechanisms linked to the ‘critical zone’ and inter-connections with scientists on policy makers and enforcers need these data. Searchable data banks, most probably held in the cloud, together with Large Language Models and new data analysis techniques will help to provide not only ‘better’ geomorphological models and explanations but improved ways of communicating with the public generally.
The ideas associated with the need in geomorphology specifically and in geographical sciences more generally can be used as a general tool for exploring data of any kind. The investigations of geomorphological concepts and geolocation within Large Language Models has yet to be explored but promises to be important, not least from graphical analysis methods that extend beyond the traditional bivariate methodologies.
Although there are substantial data, image preservation and curation problems with existing data, as pointed out in 2012 with reference to Digital Earth by Goodchild et al. [
134] and in the framework for managing interdisciplinary ‘big data’ envisioned by Parsons et al. [
135], the use of the dLL schema should assist data availability and use.


