
The Importance of the Census of Anthropogenic Cavities in the Mitigation Geological Hazards: The Case of Grotte di Castro (Italy)


Abstract
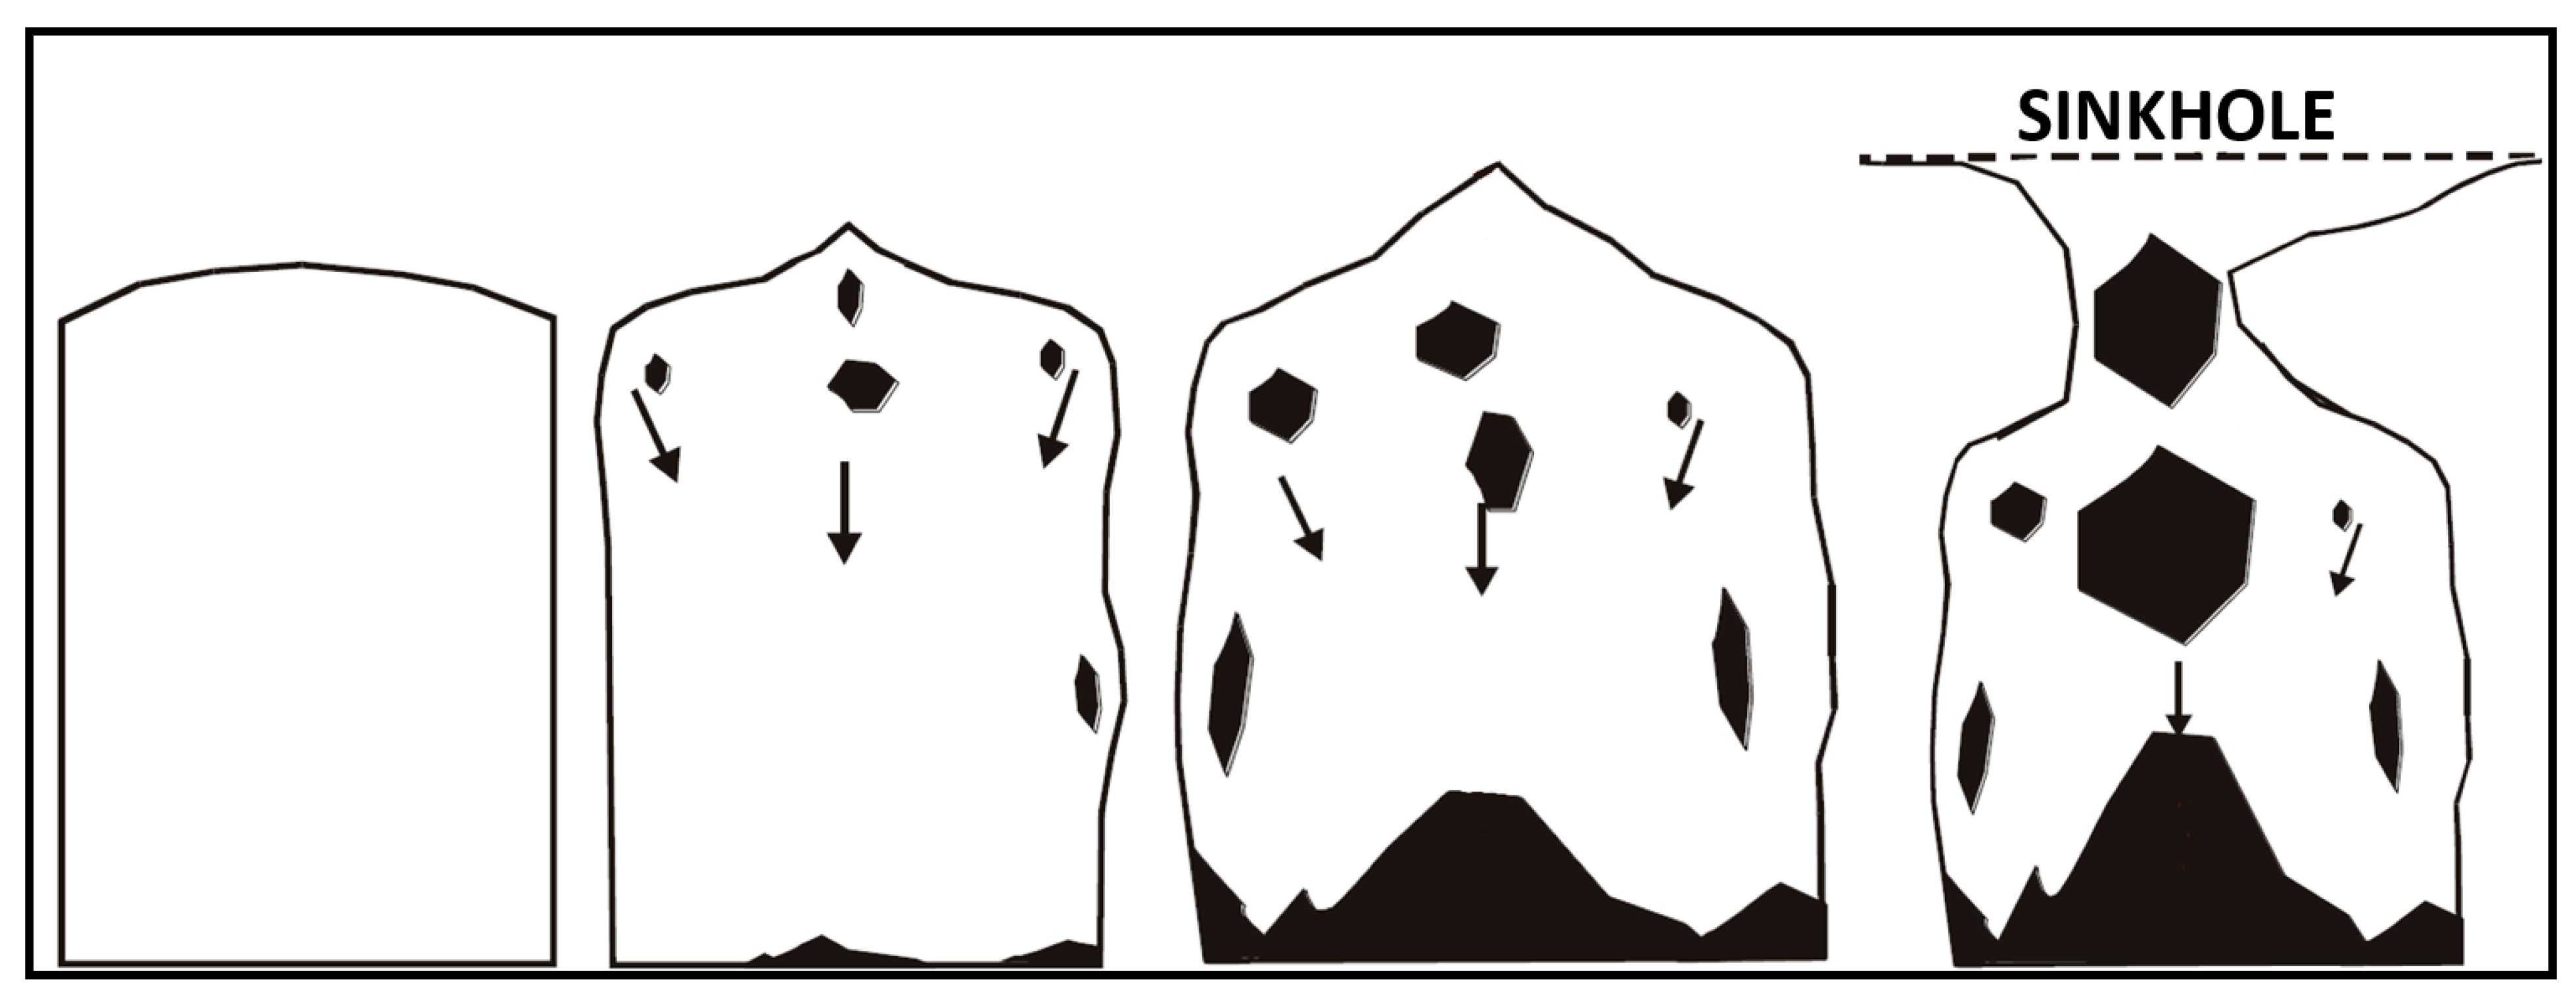
1. Introduction
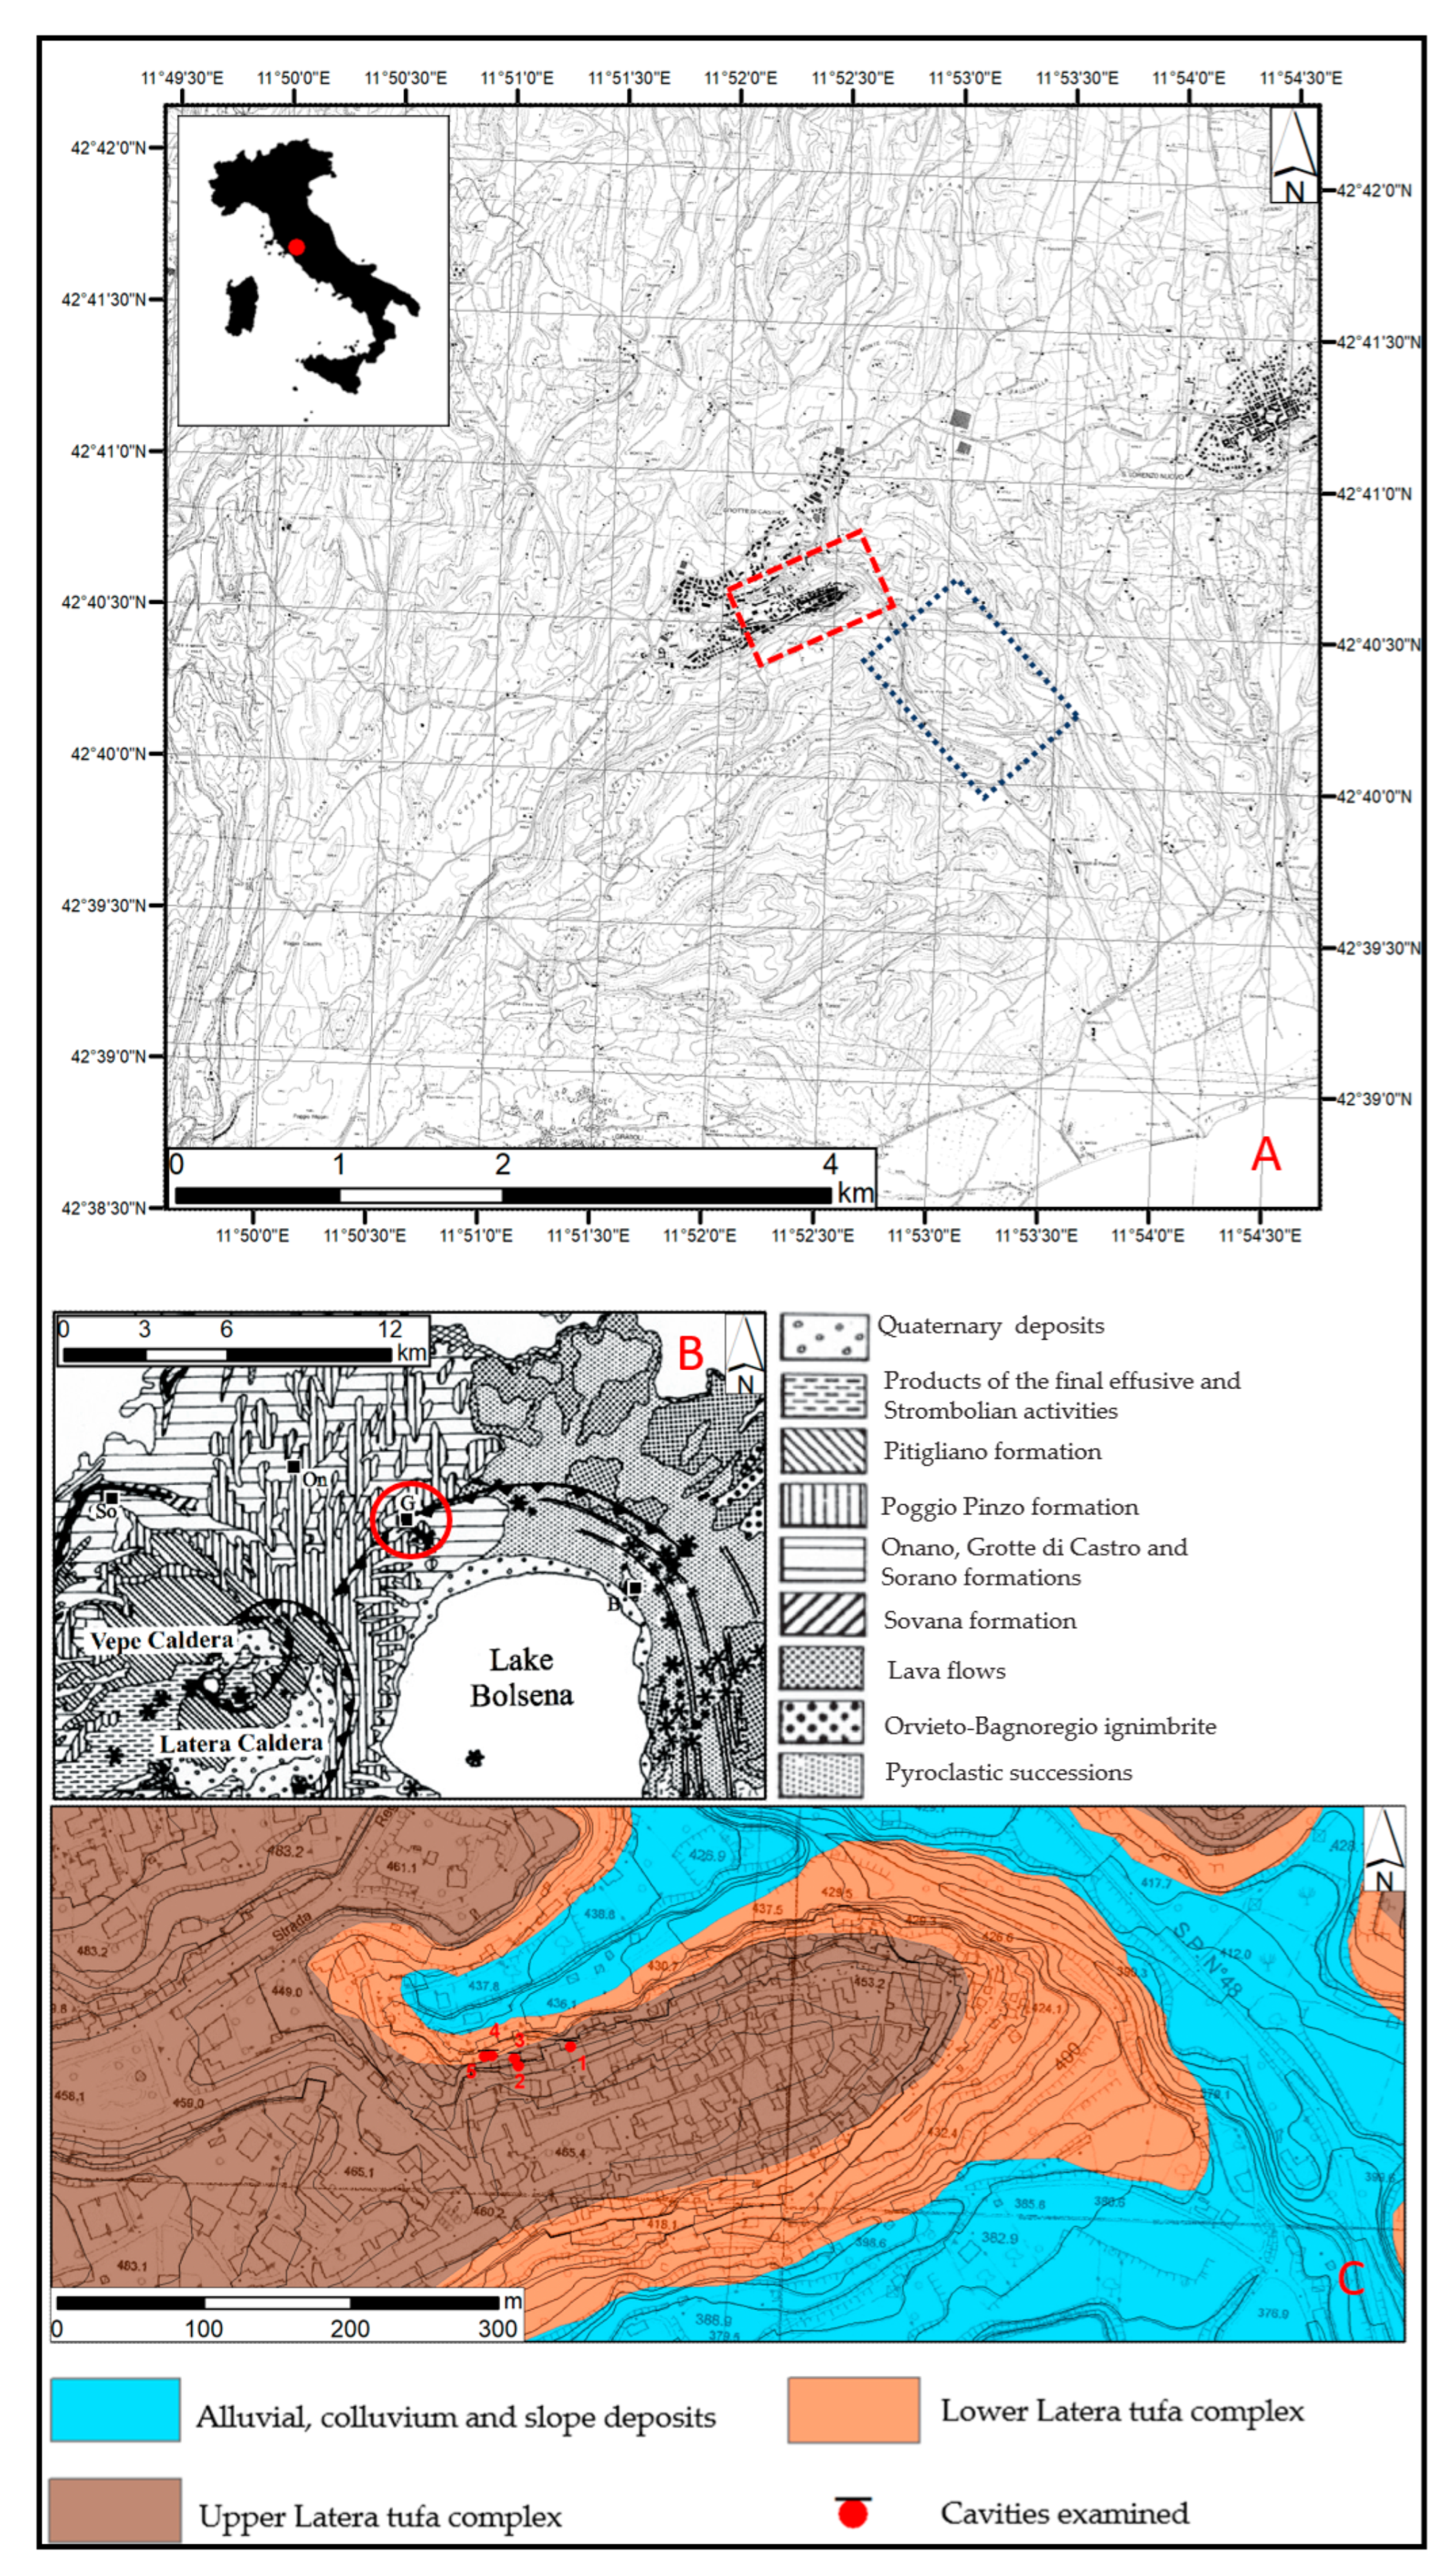
2. Study Area
2.1. Geological and Geomorphological Settings
2.2. Historical Notes on the Evolution of Grotte di Castro and Its Cavities
2.3. Climatic Notes
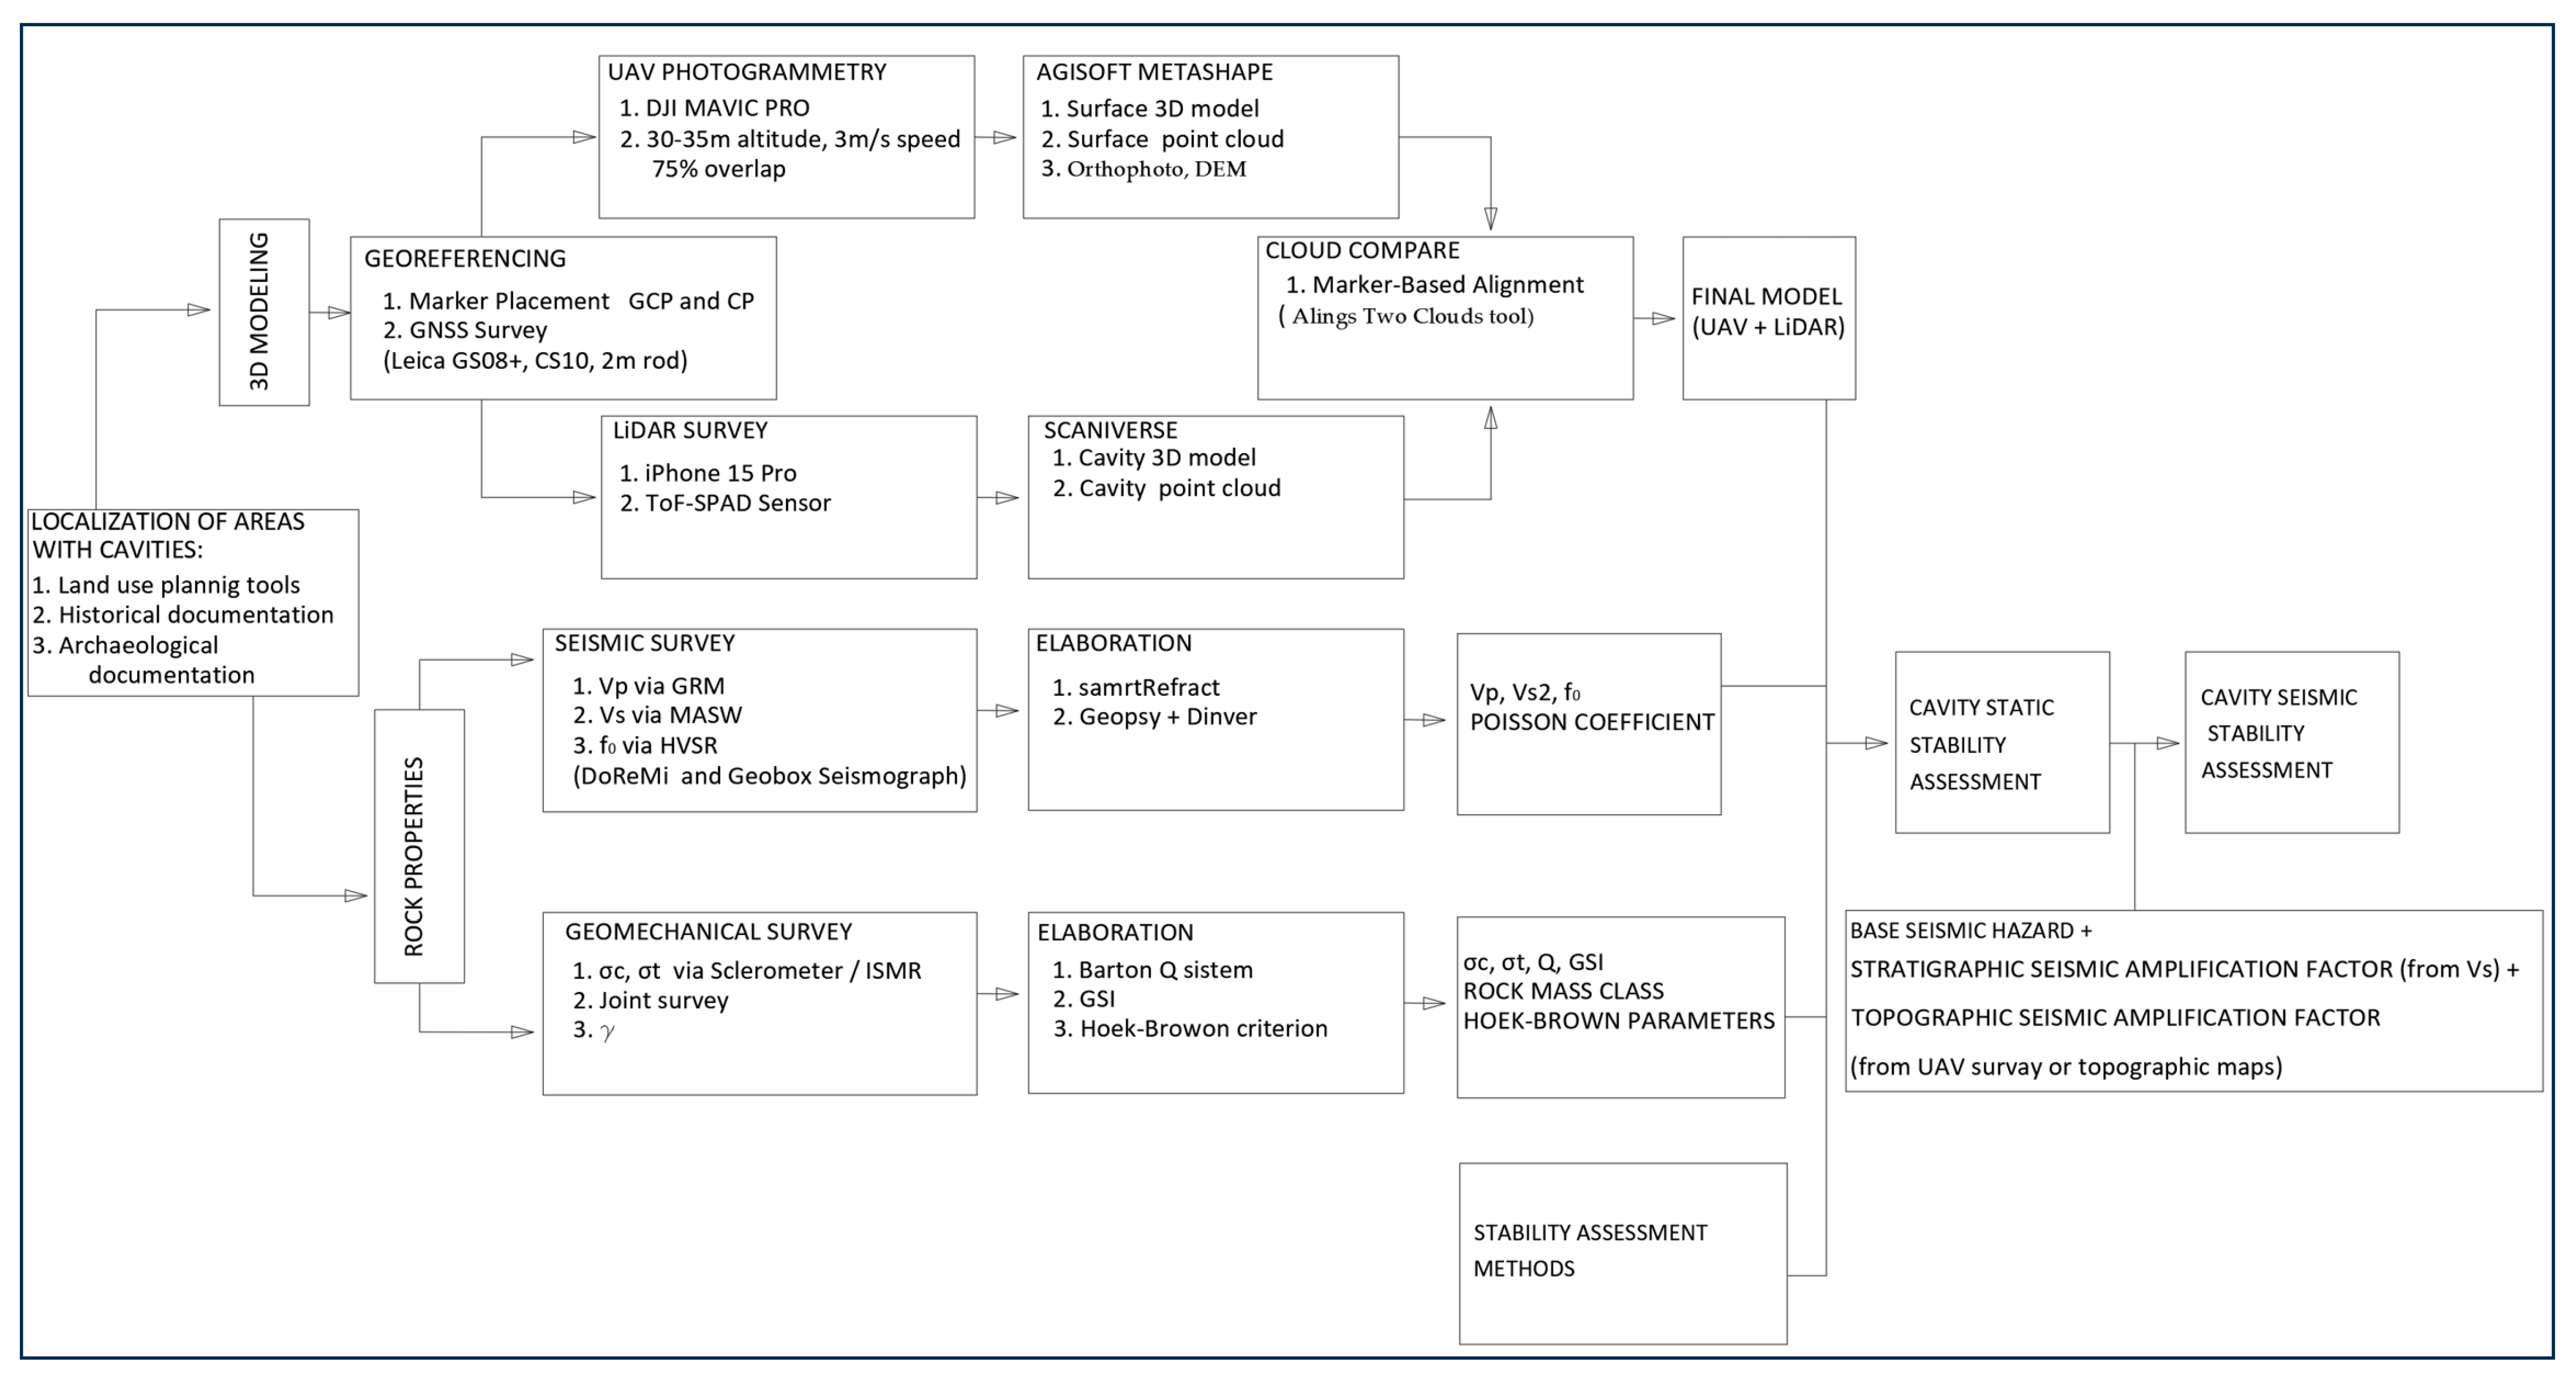
3. Materials and Methods
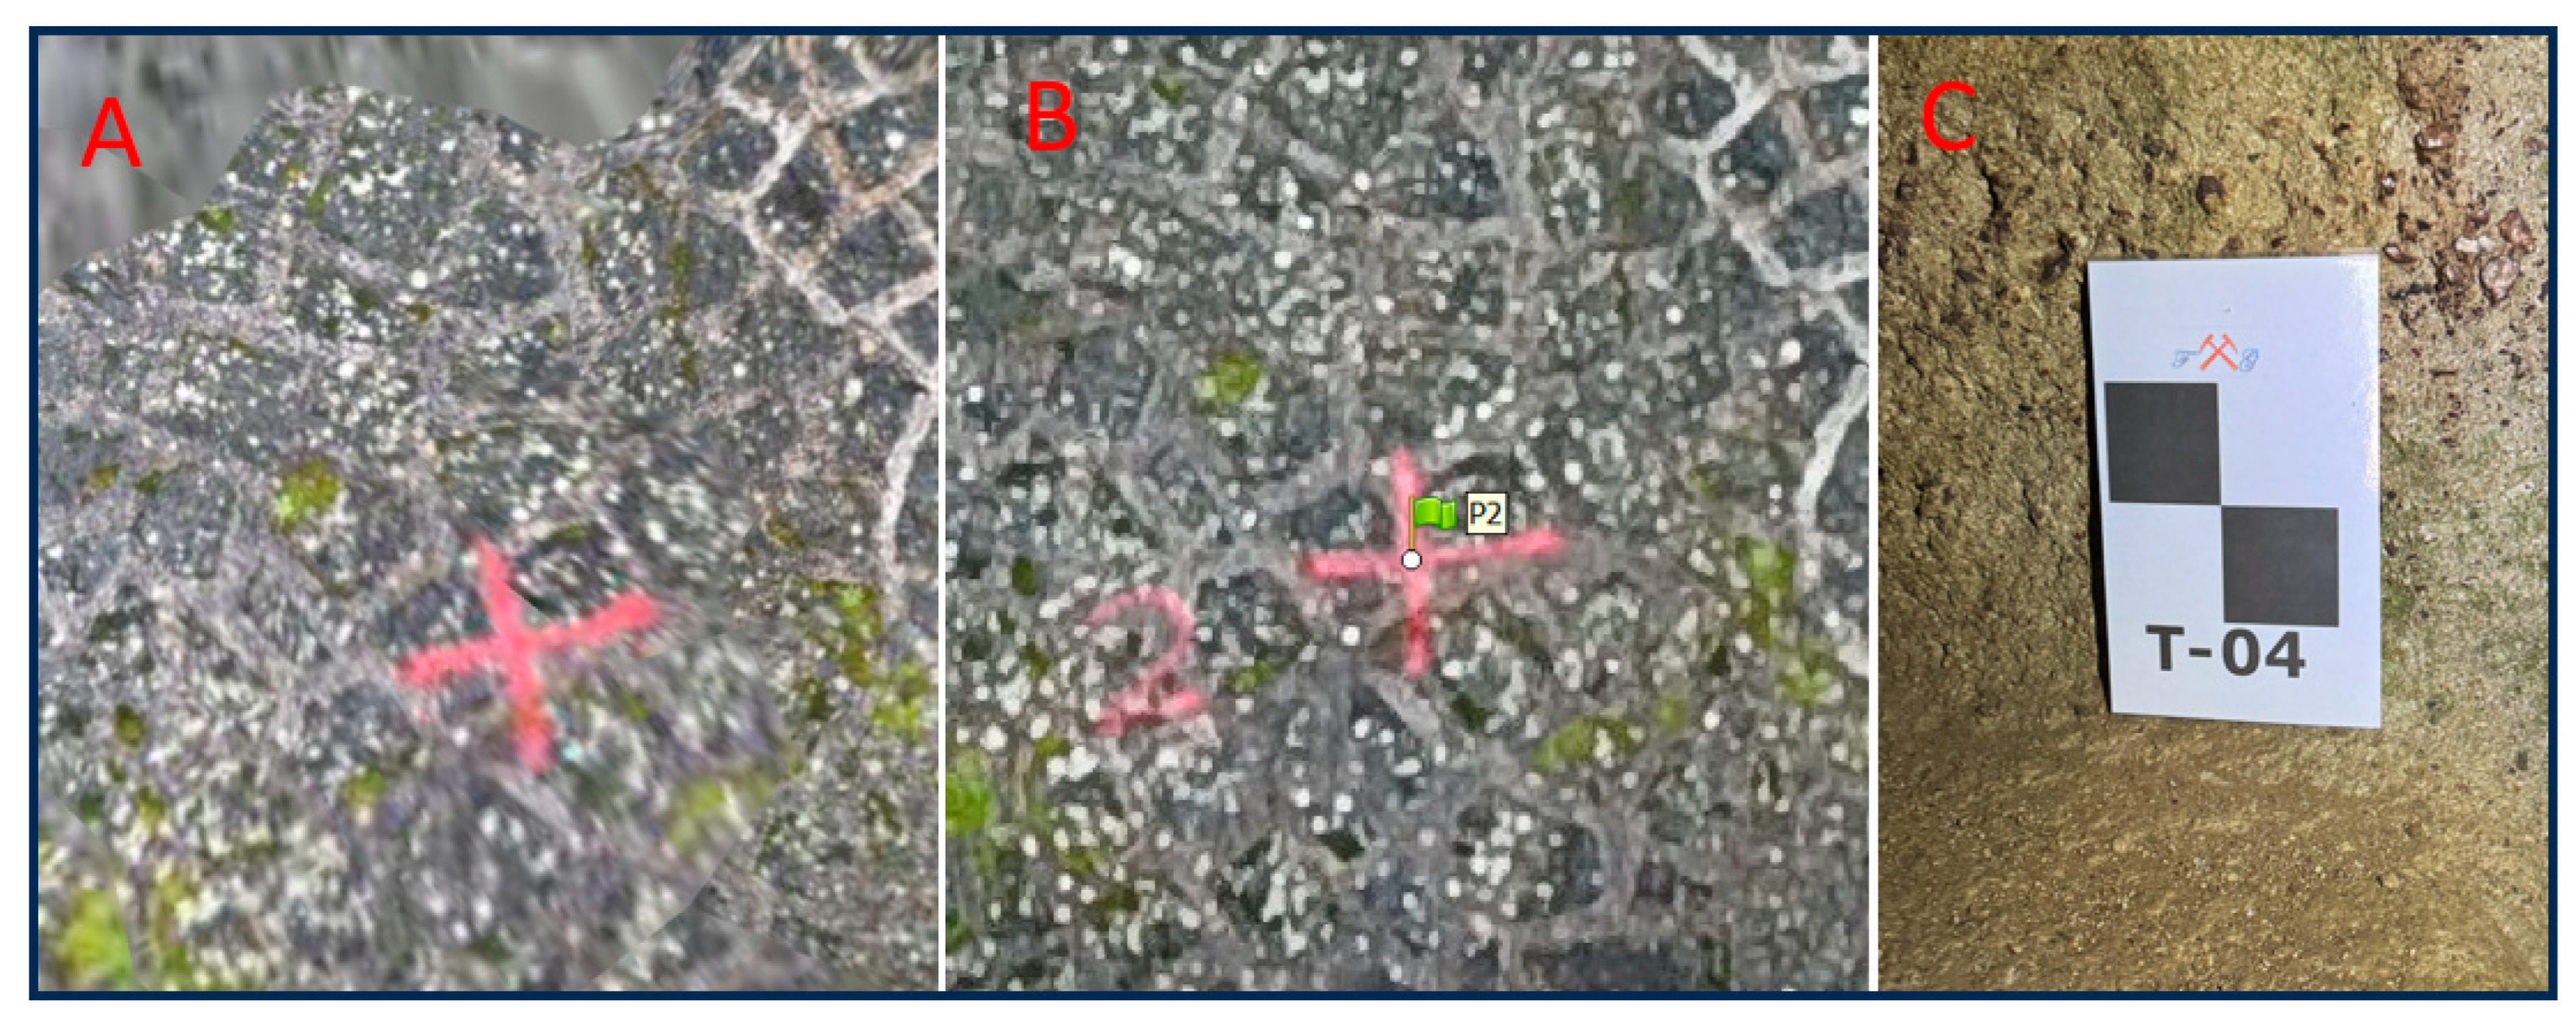
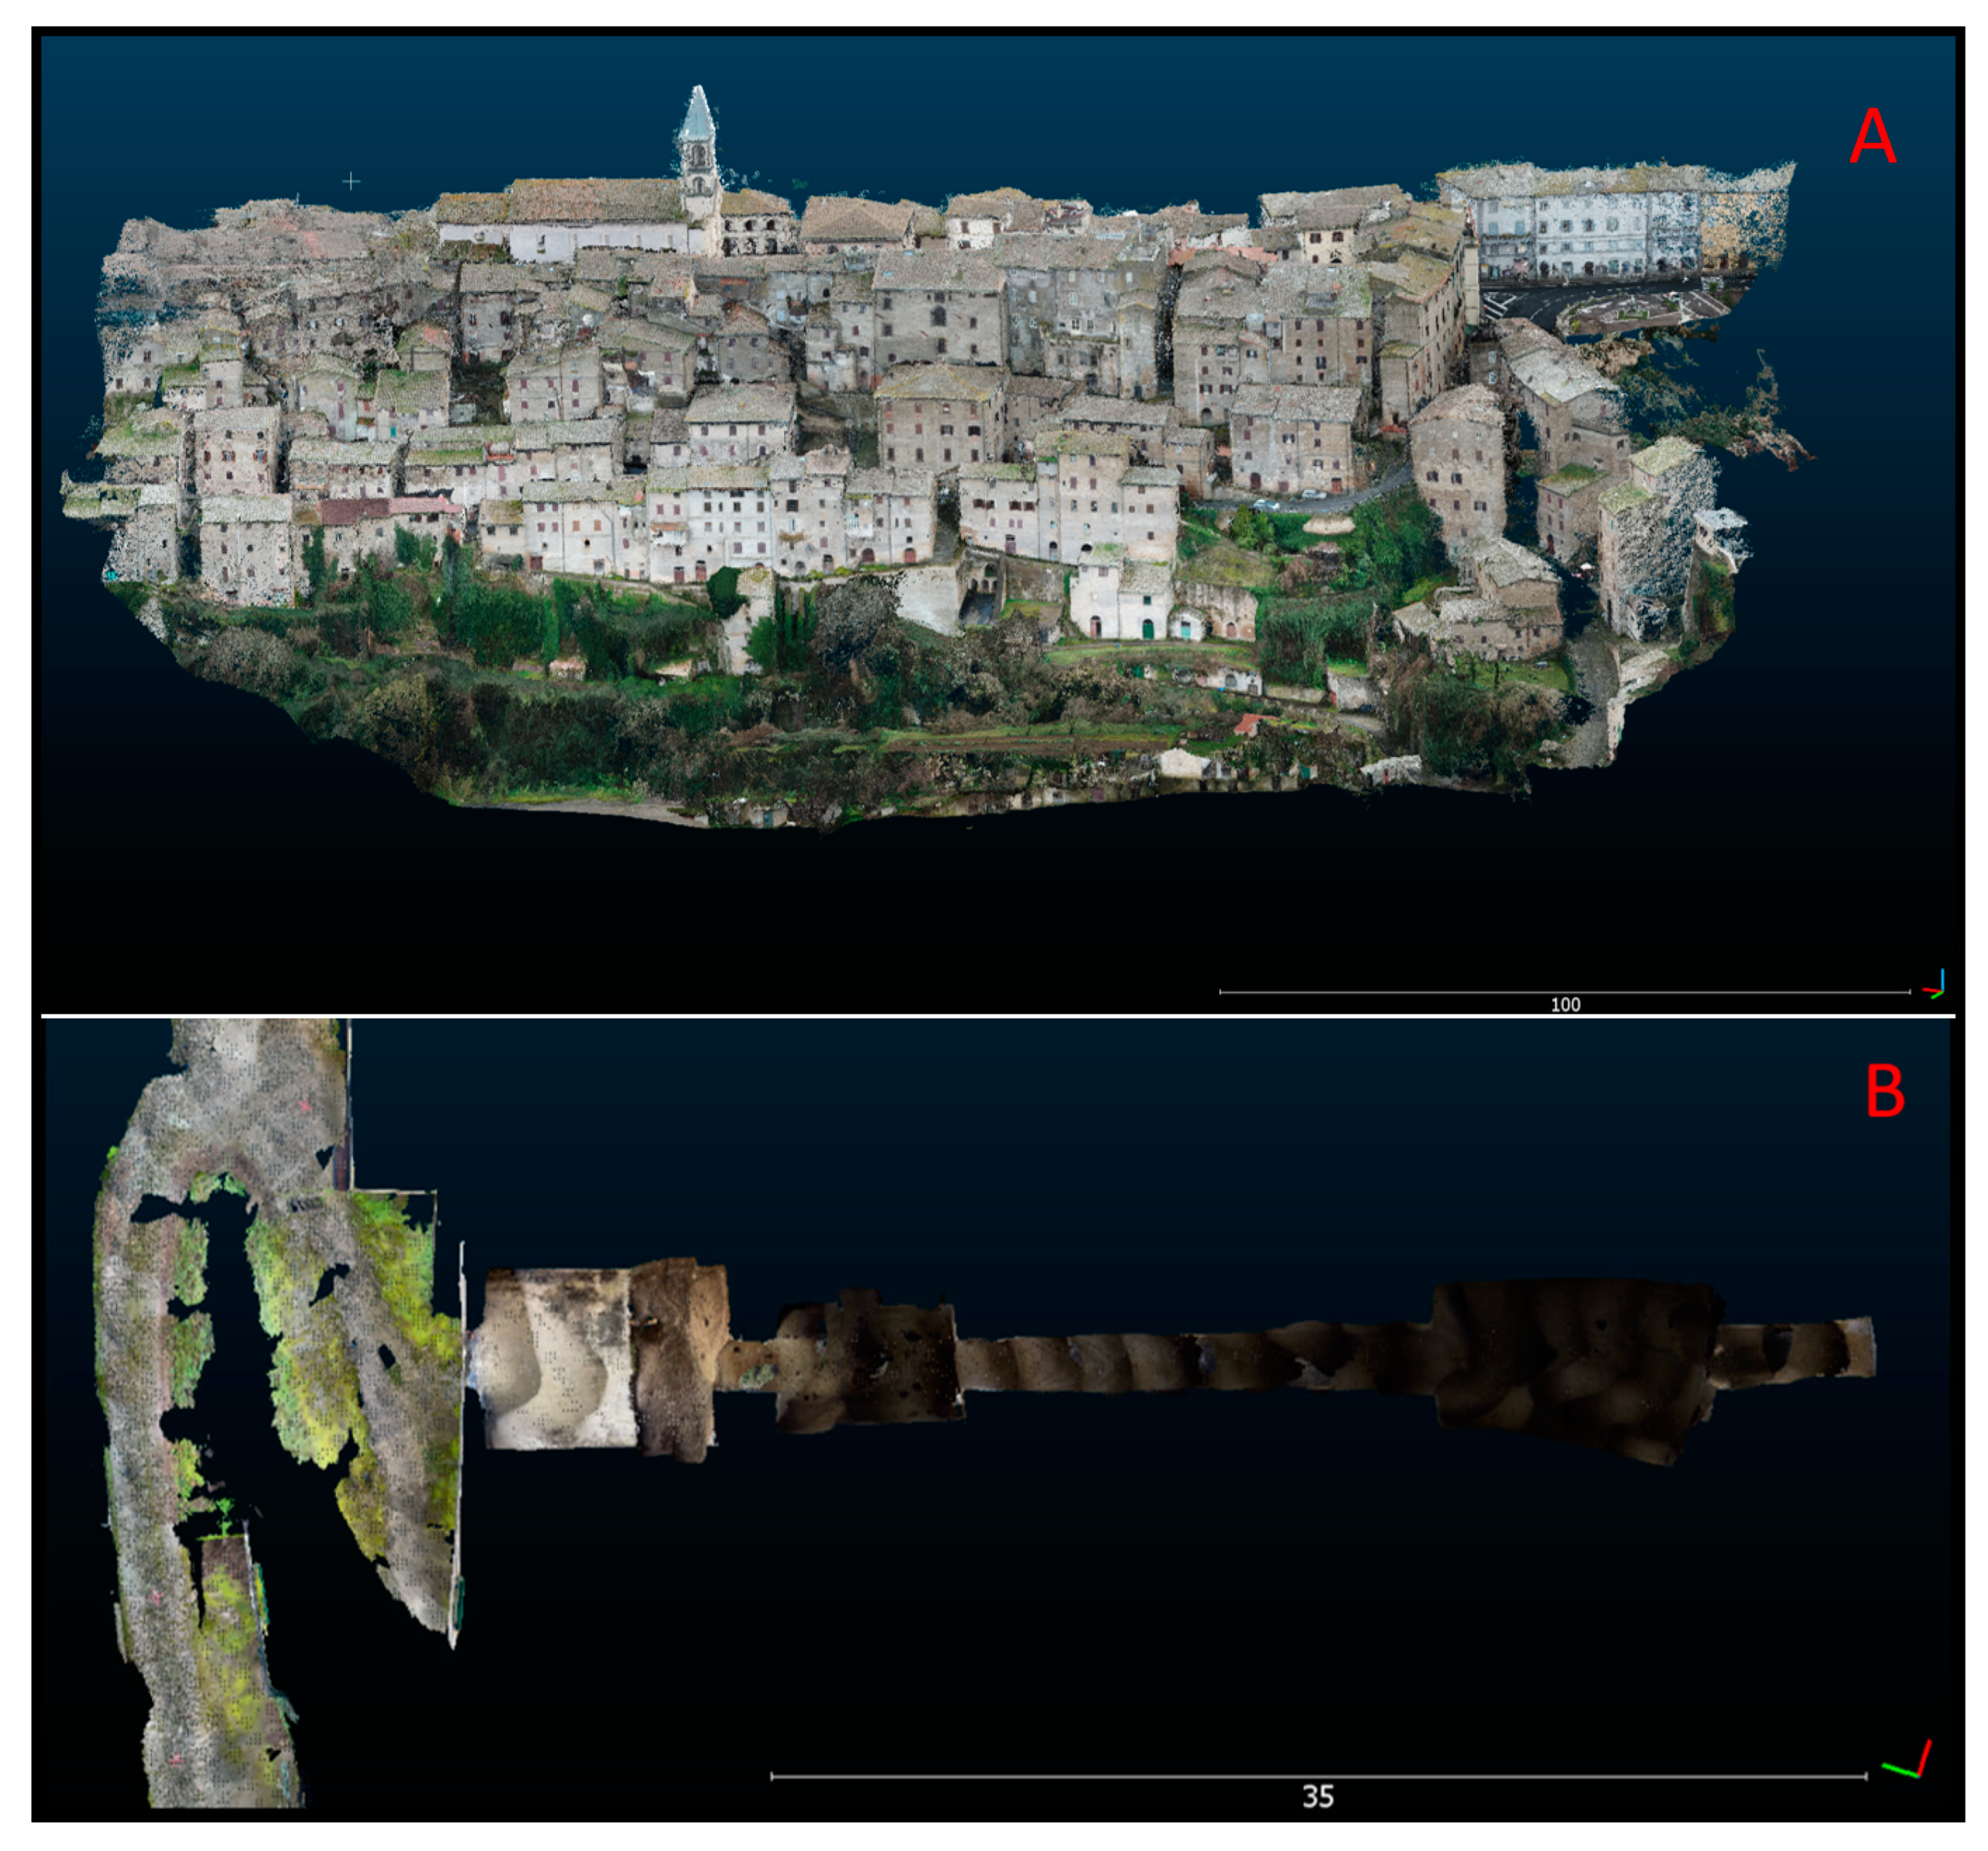
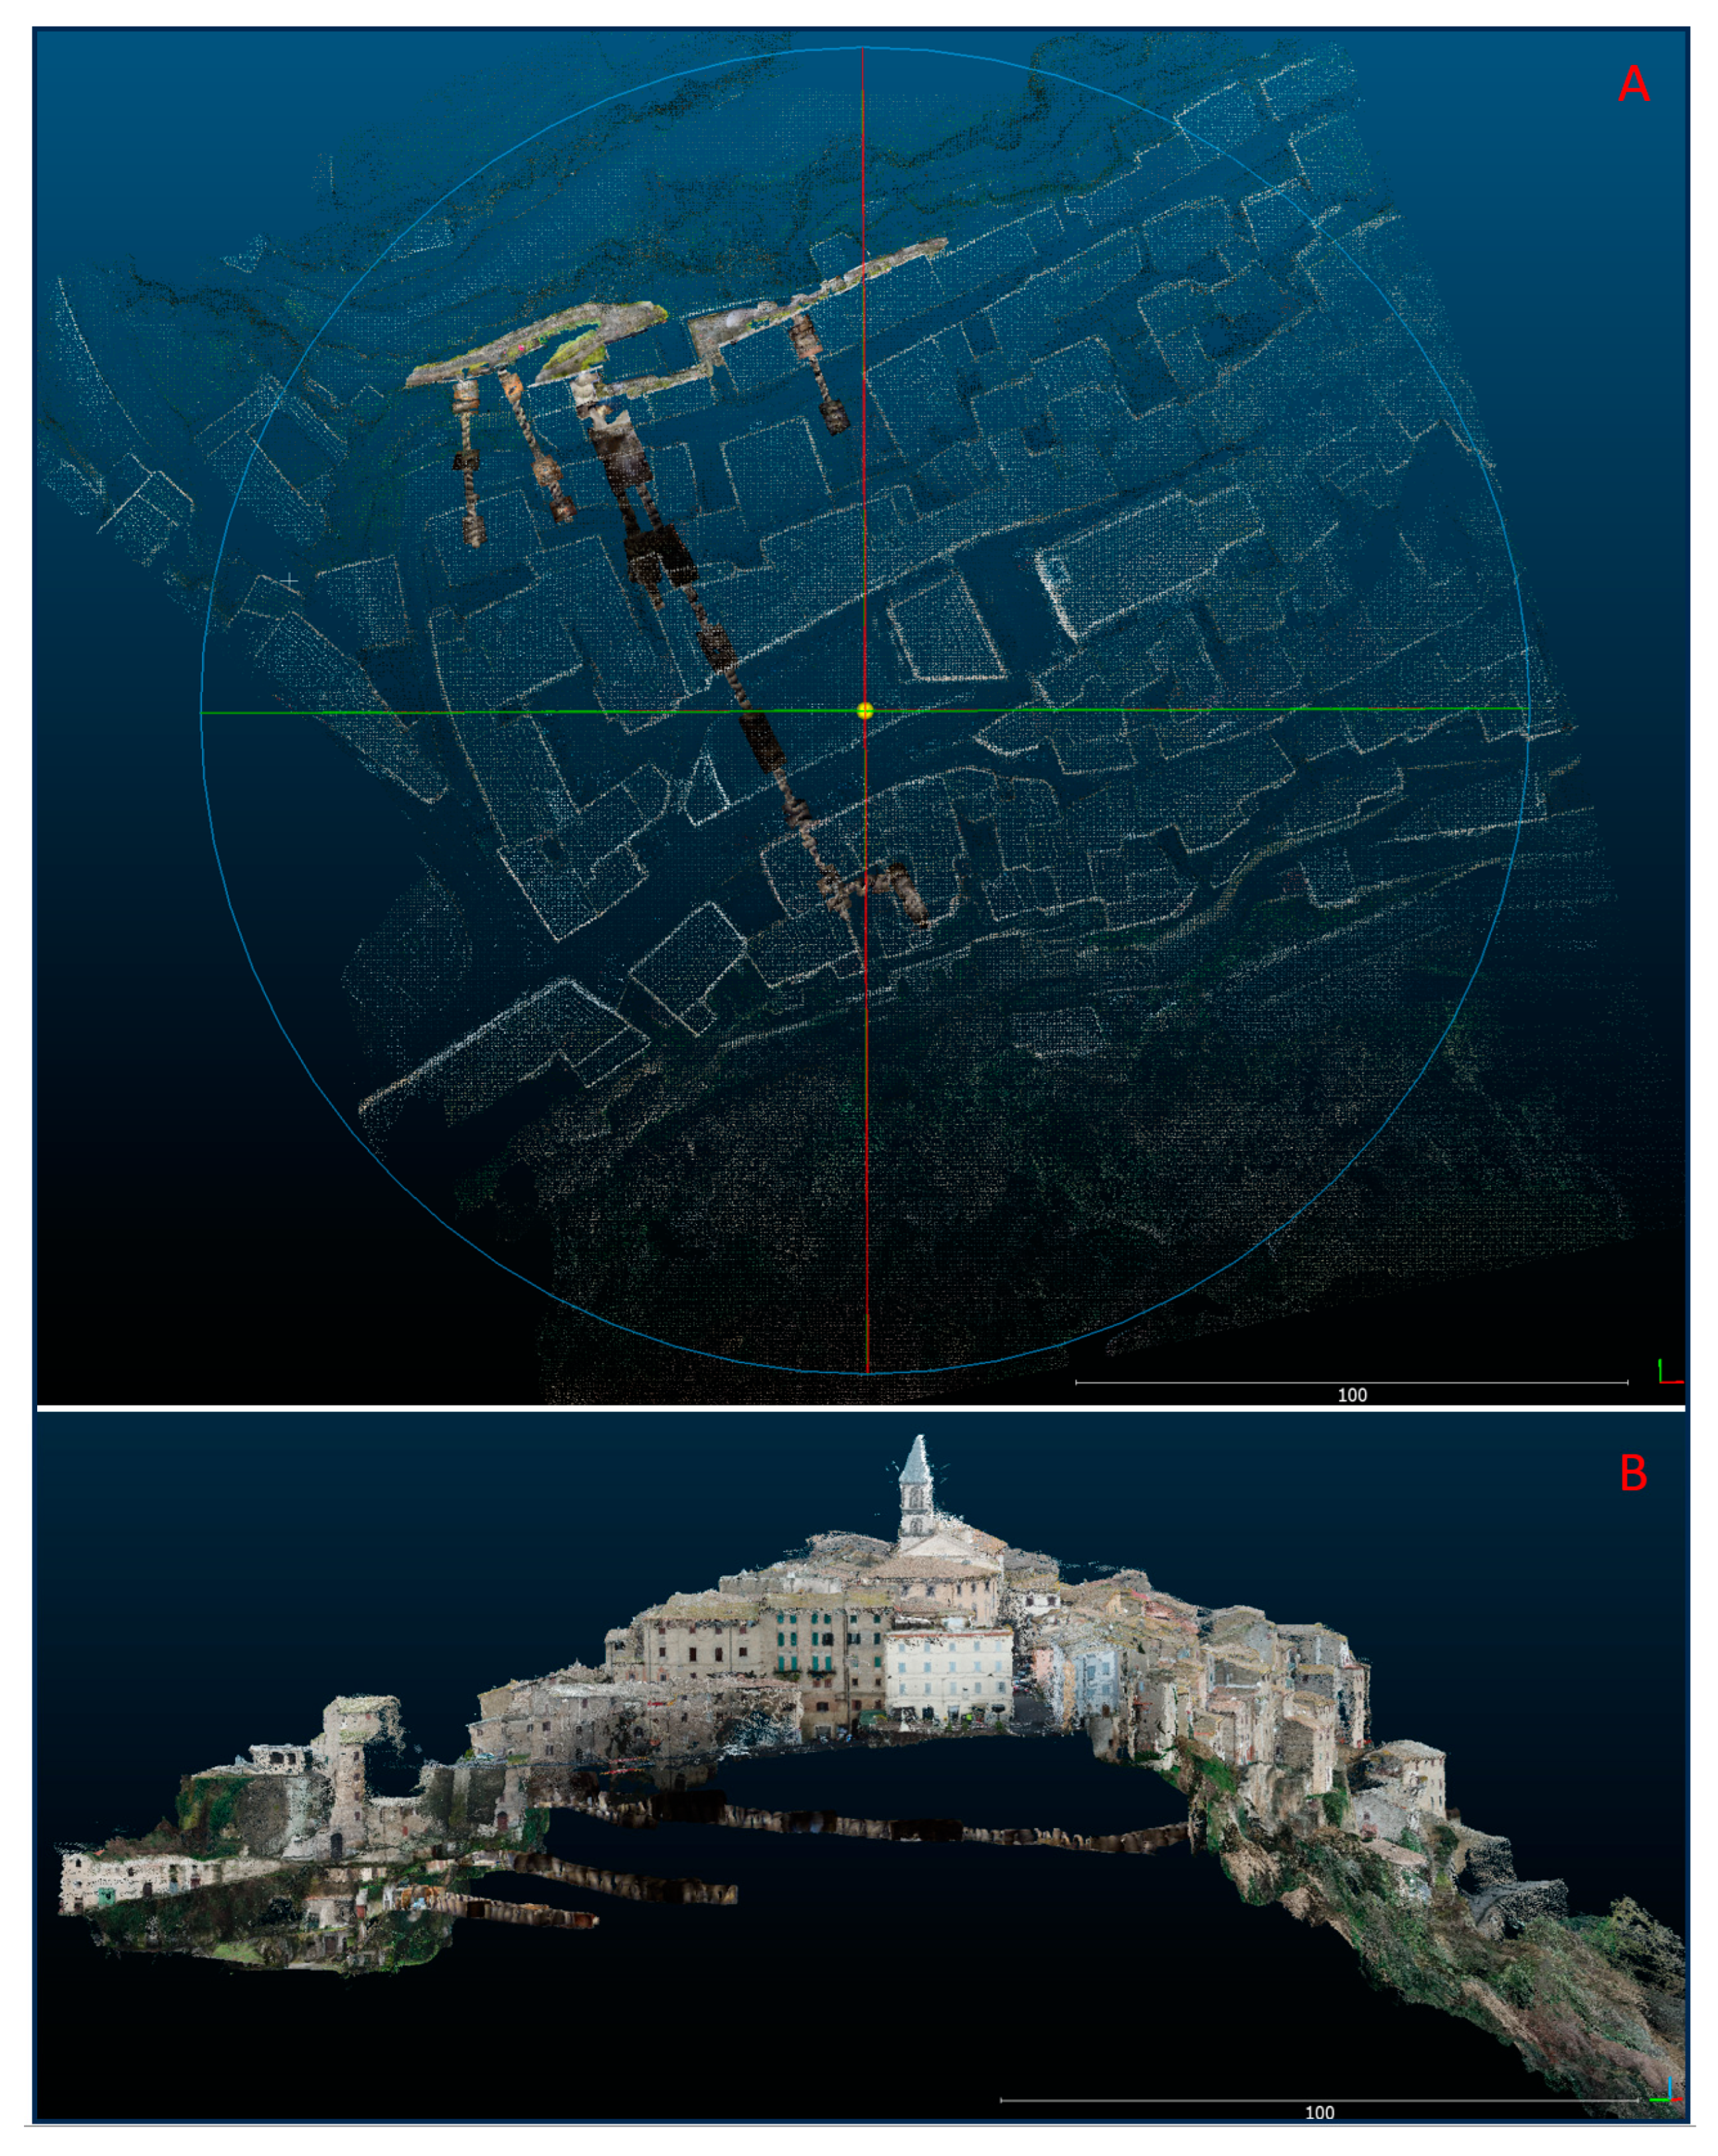
3.1. Photogrammetric and LiDAR Surveys
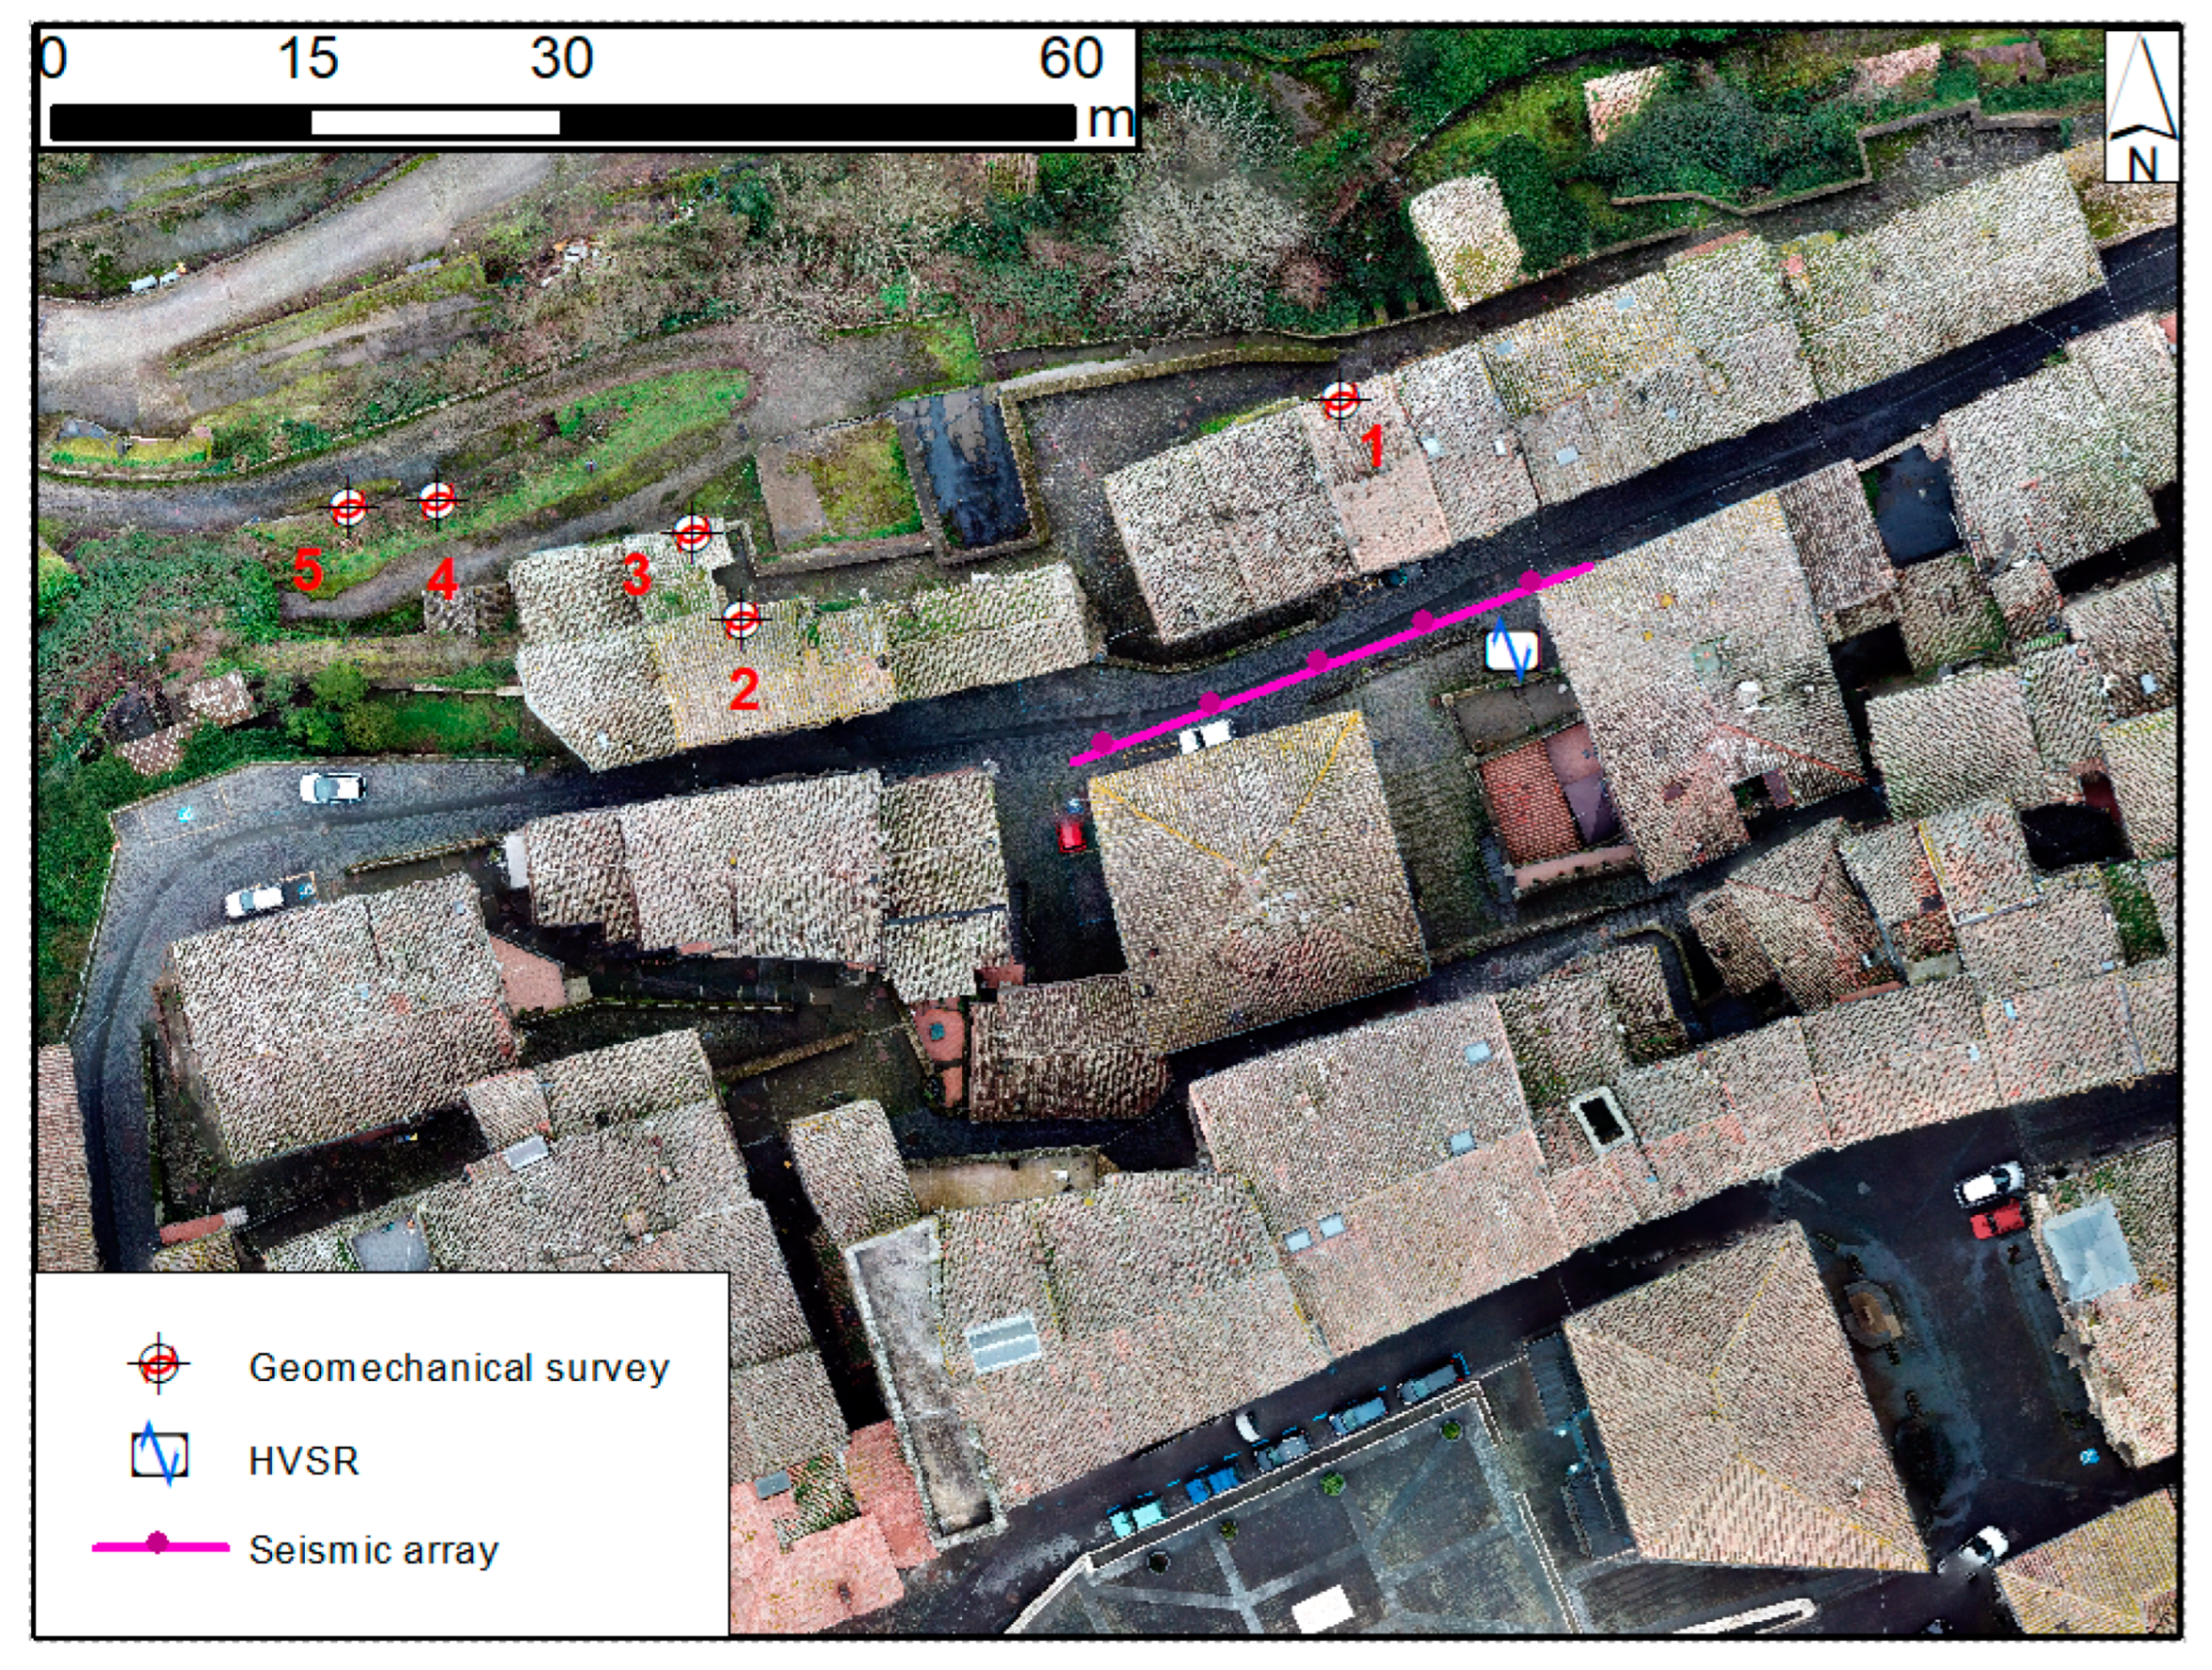
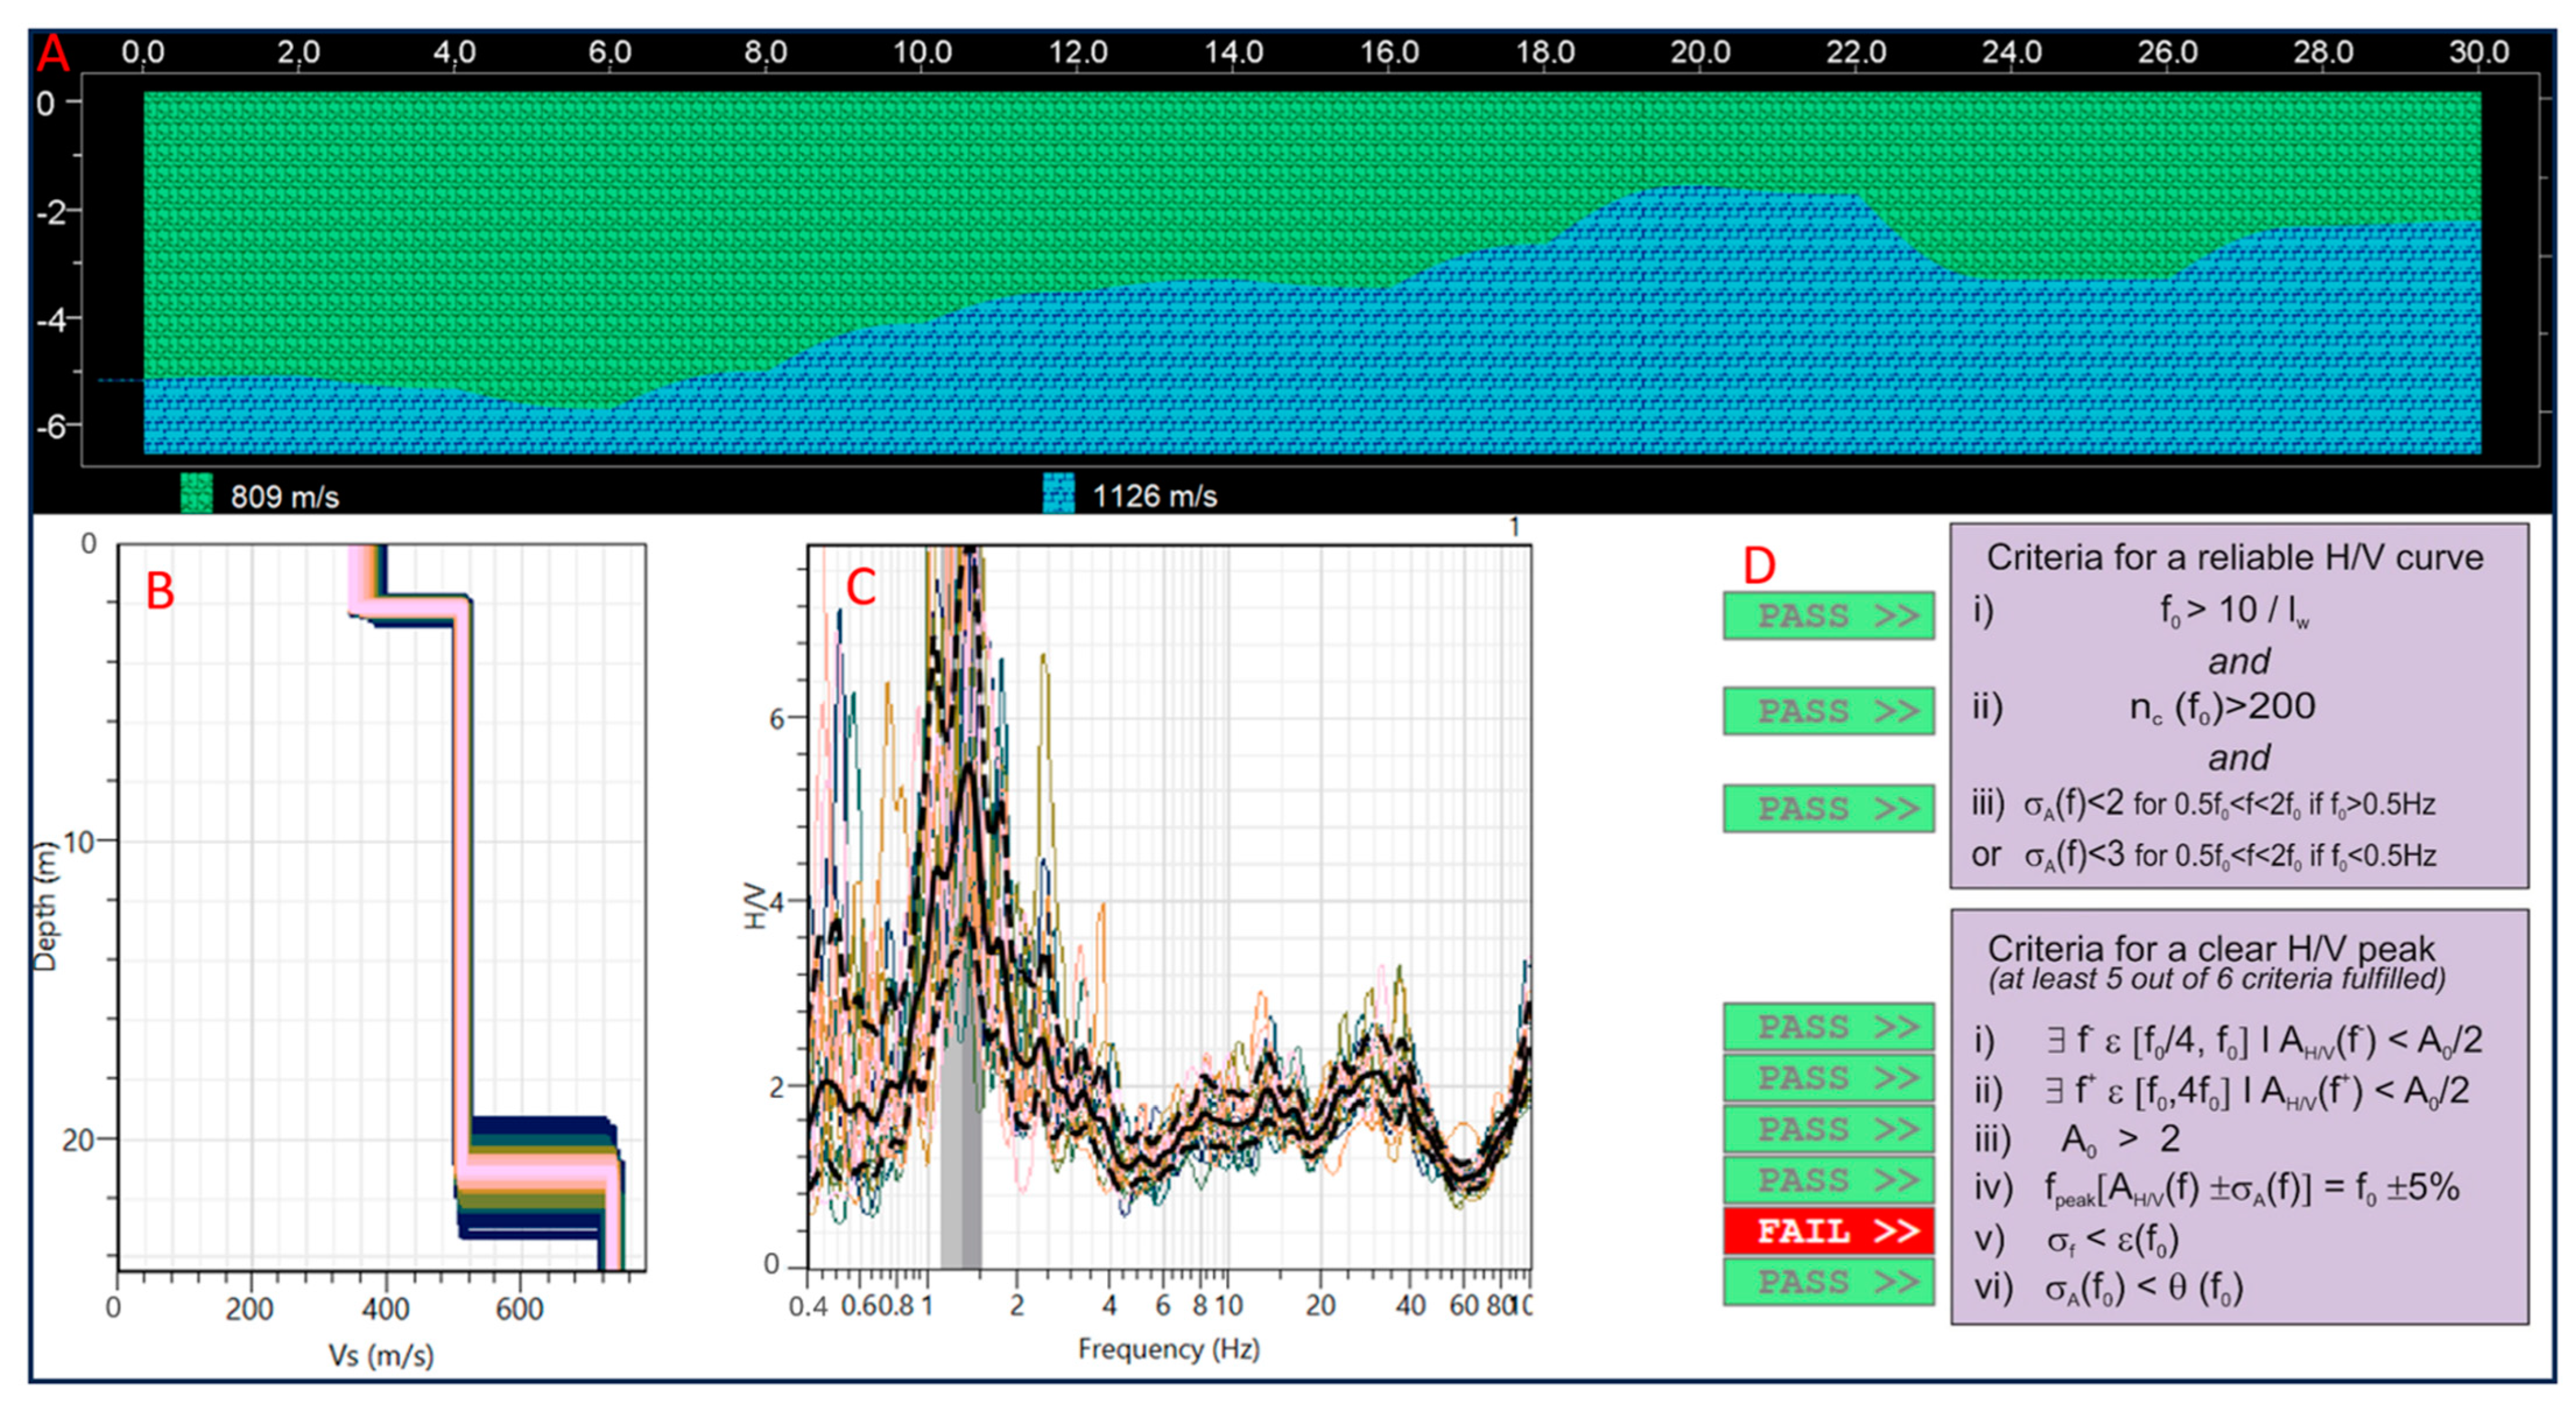
3.2. Seismic Surveys
- Refraction Seismic. Generalised Reciprocal Method (GRM) [36] was used to measure Vp. The instrument used was the seismograph model DoReMi from Sara Elettronic Instruments, equipped with 16 vertical 4.5 Hz geophones, with an intergeophonic distance of 2 m. Seven bursts were made, using a 5 kg sledgehammer on a steel plate as energiser. Burst distances were set, relative to the first geophone of the array at −5 m, −1 m, 5 m, 15 m, 25 m, 31 m, and 36 m. The open-source software smartRefract 2017 was used for interpretation.
- MASW. The Multi-channel Analysis of Surface Waves [37] method was used to measure Vs using the same instrument, array, and energisation mode. The burst distance was set at 3 m, 5 m, and 7 m from the first geophone, and the different acquisitions were compared to each other after processing using the open-source software Geopsy and Dinver [38], versions 3.4.0 [35].
- HVSR. The Horizontal to Vertical Spectral Ratio method [38] was used to measure the site frequency f0 using the 3-channel Geobox seismograph from Sara Elettronic Instruments with 4.5 Hz geophones. The instrument is north-facing and levelled, and the acquisition of microtremors lasted for 25 min. The test processing was carried out using the open-source software Geopsy (version 3.4.). All windows with anthropogenic noise and disturbed signal were removed during the processing.
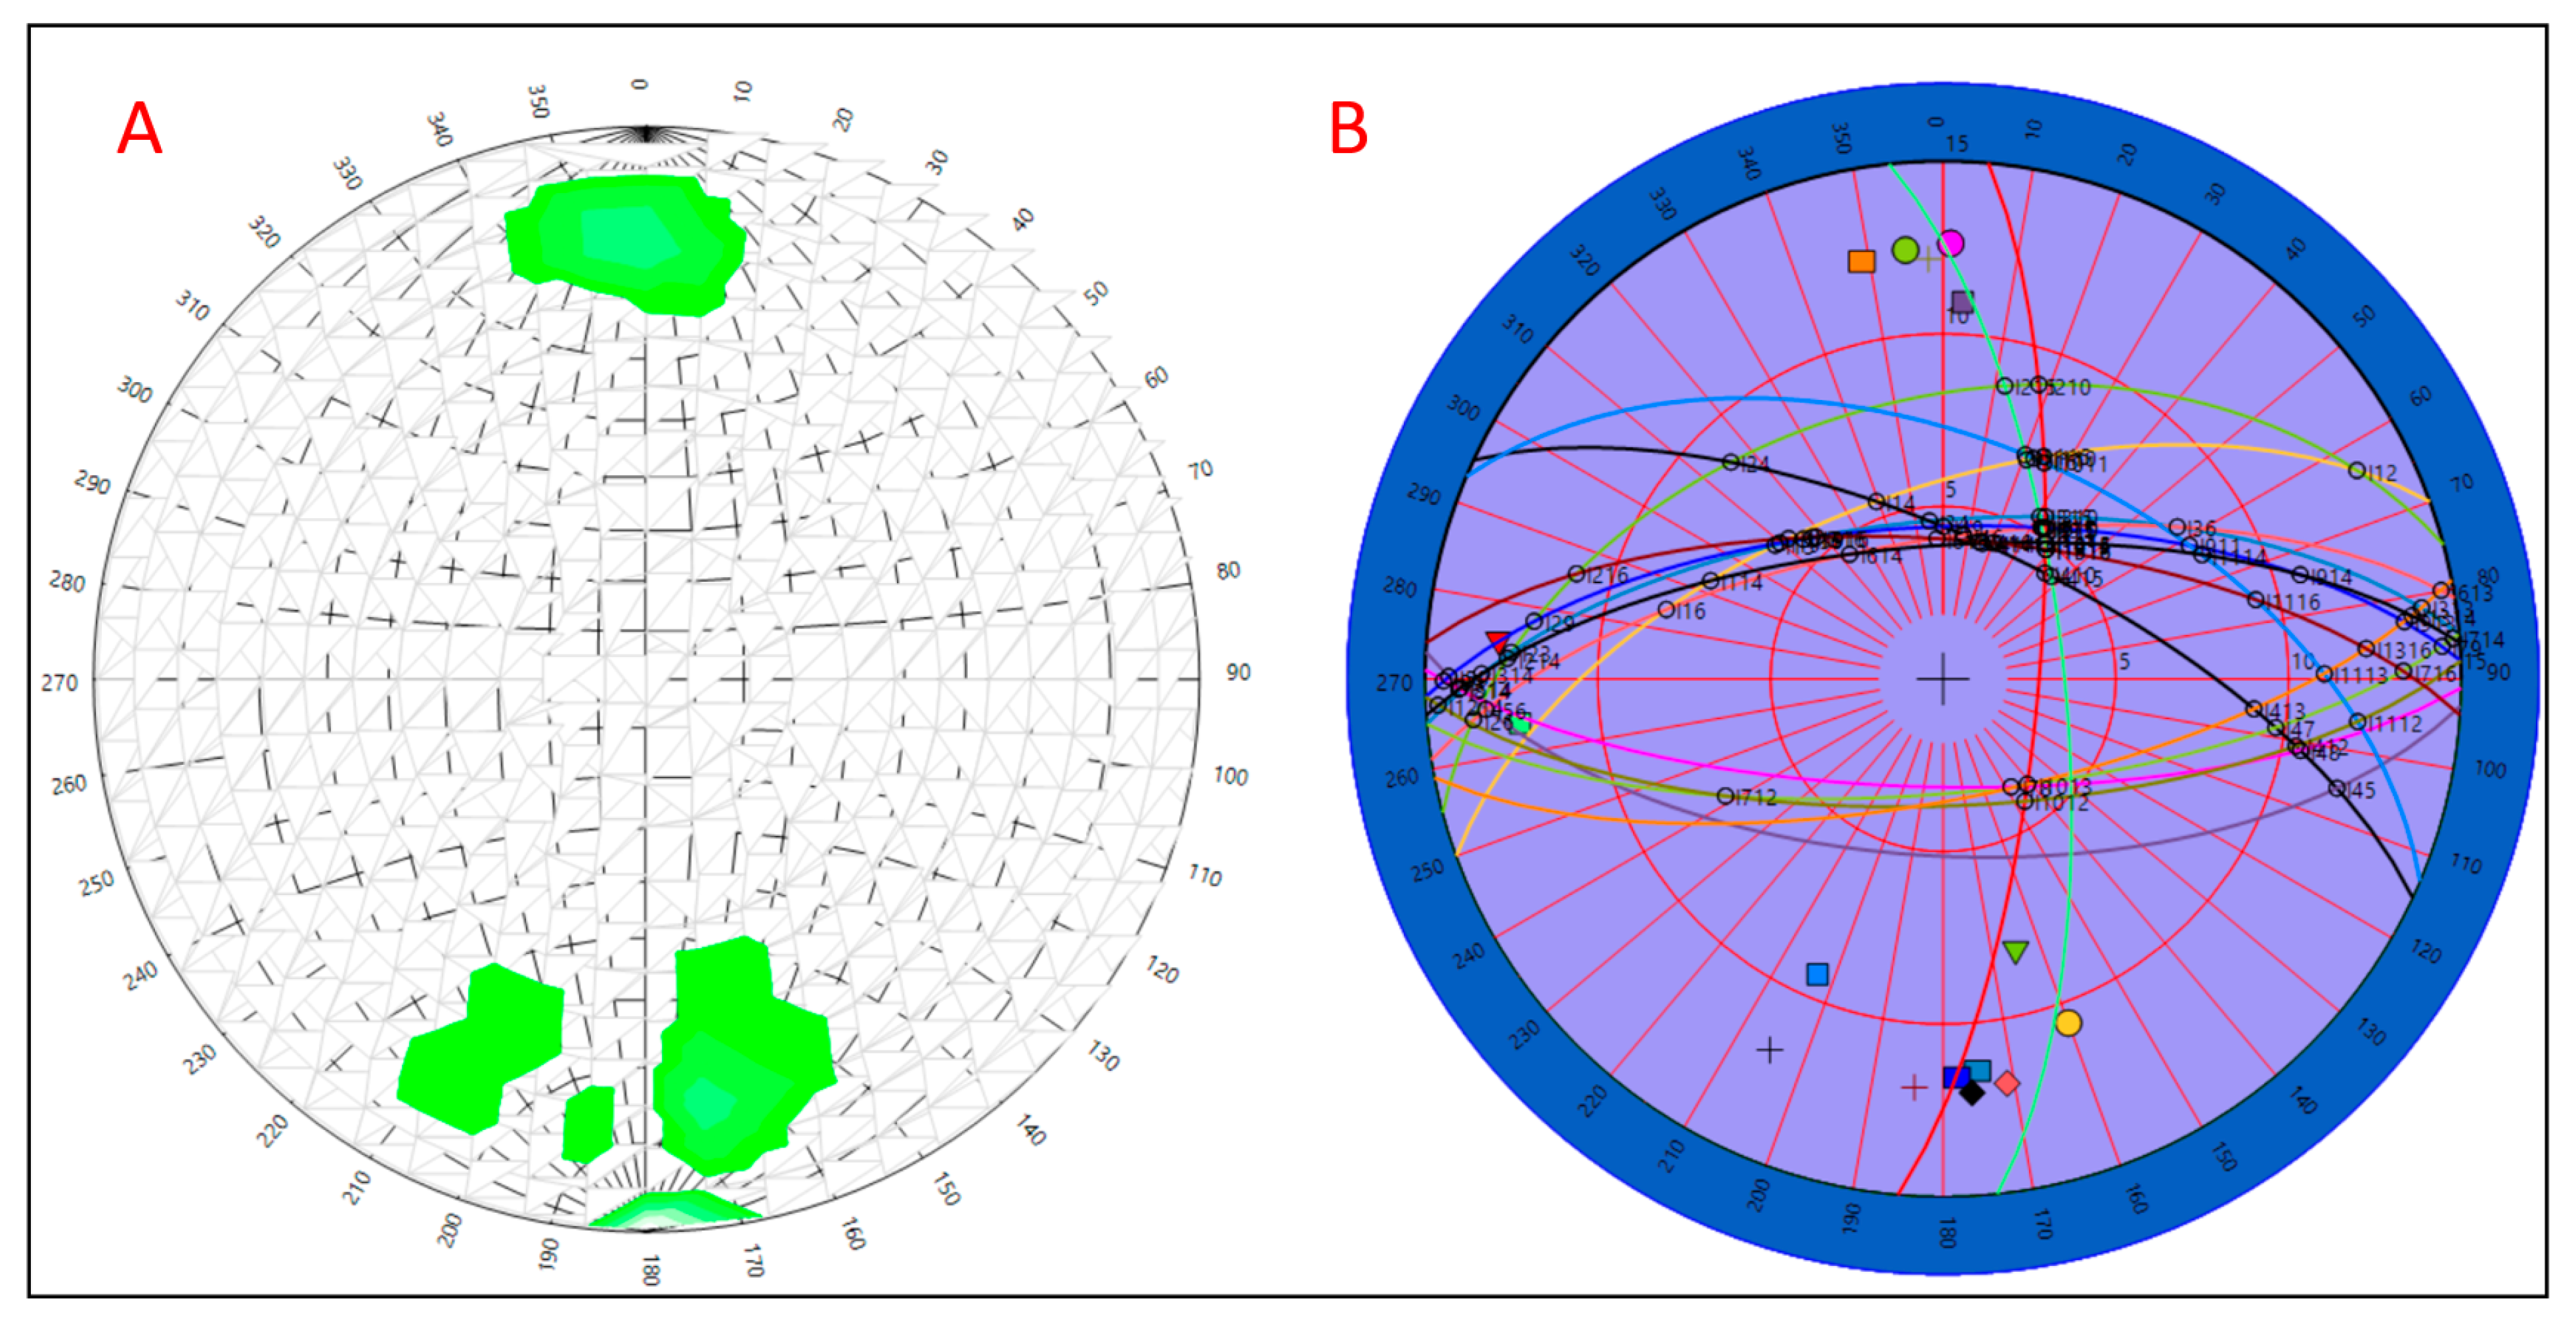
3.3. Geomechanical Surveys and Rock Mass Classification
- RQD (rock quality designation) considers the rock mass’s subdivision;
- Jn (joint set number) depends on the number of joint families present in the rock mass;
- Jr (joint roughness number) depends on the roughness of the most unfavourable family;
- Ja (joint alteration number); depends on the degree of fracture alteration, thickness and nature of the fill, and which is also determined by the most unfavourable family;
- Jw (joint water number) wich depends on hydrogeological conditions;
- SRF (stress reduction factor) is a function of the stress state in massive rocks or tectonic disturbance
3.4. Stability Assessment
- Critical Scaled Crow Span Method. The method proposed by Carter [46,47] proposes to assess the stability of a cavity vault by calculating the scaled crow span Cs, which if it is greater than critical span Sc then unstable conditions exist. The parameters are calculated according to the following equations:
- S = clear span of the vault in metres;
- L = length of the vault in metres;
- T = thickness of the vault in metres;
- γ = specific gravity of the rock mass (17–18 kN/m3);
- θ = deep direction of the stratification.
- Harp and Noble method. It examines the propensity for slope collapse in a seismic event with M > 5 [48]. The methodology is based on Barton Q parameter, modified by the following equation:
- Jv: are number of joints per m3;
- AF: considers the discontinuity’s opening.
- γz is the lithostatic load;
- L is the length of the vault;
- h is the rock layer thicknesses.
4. Results
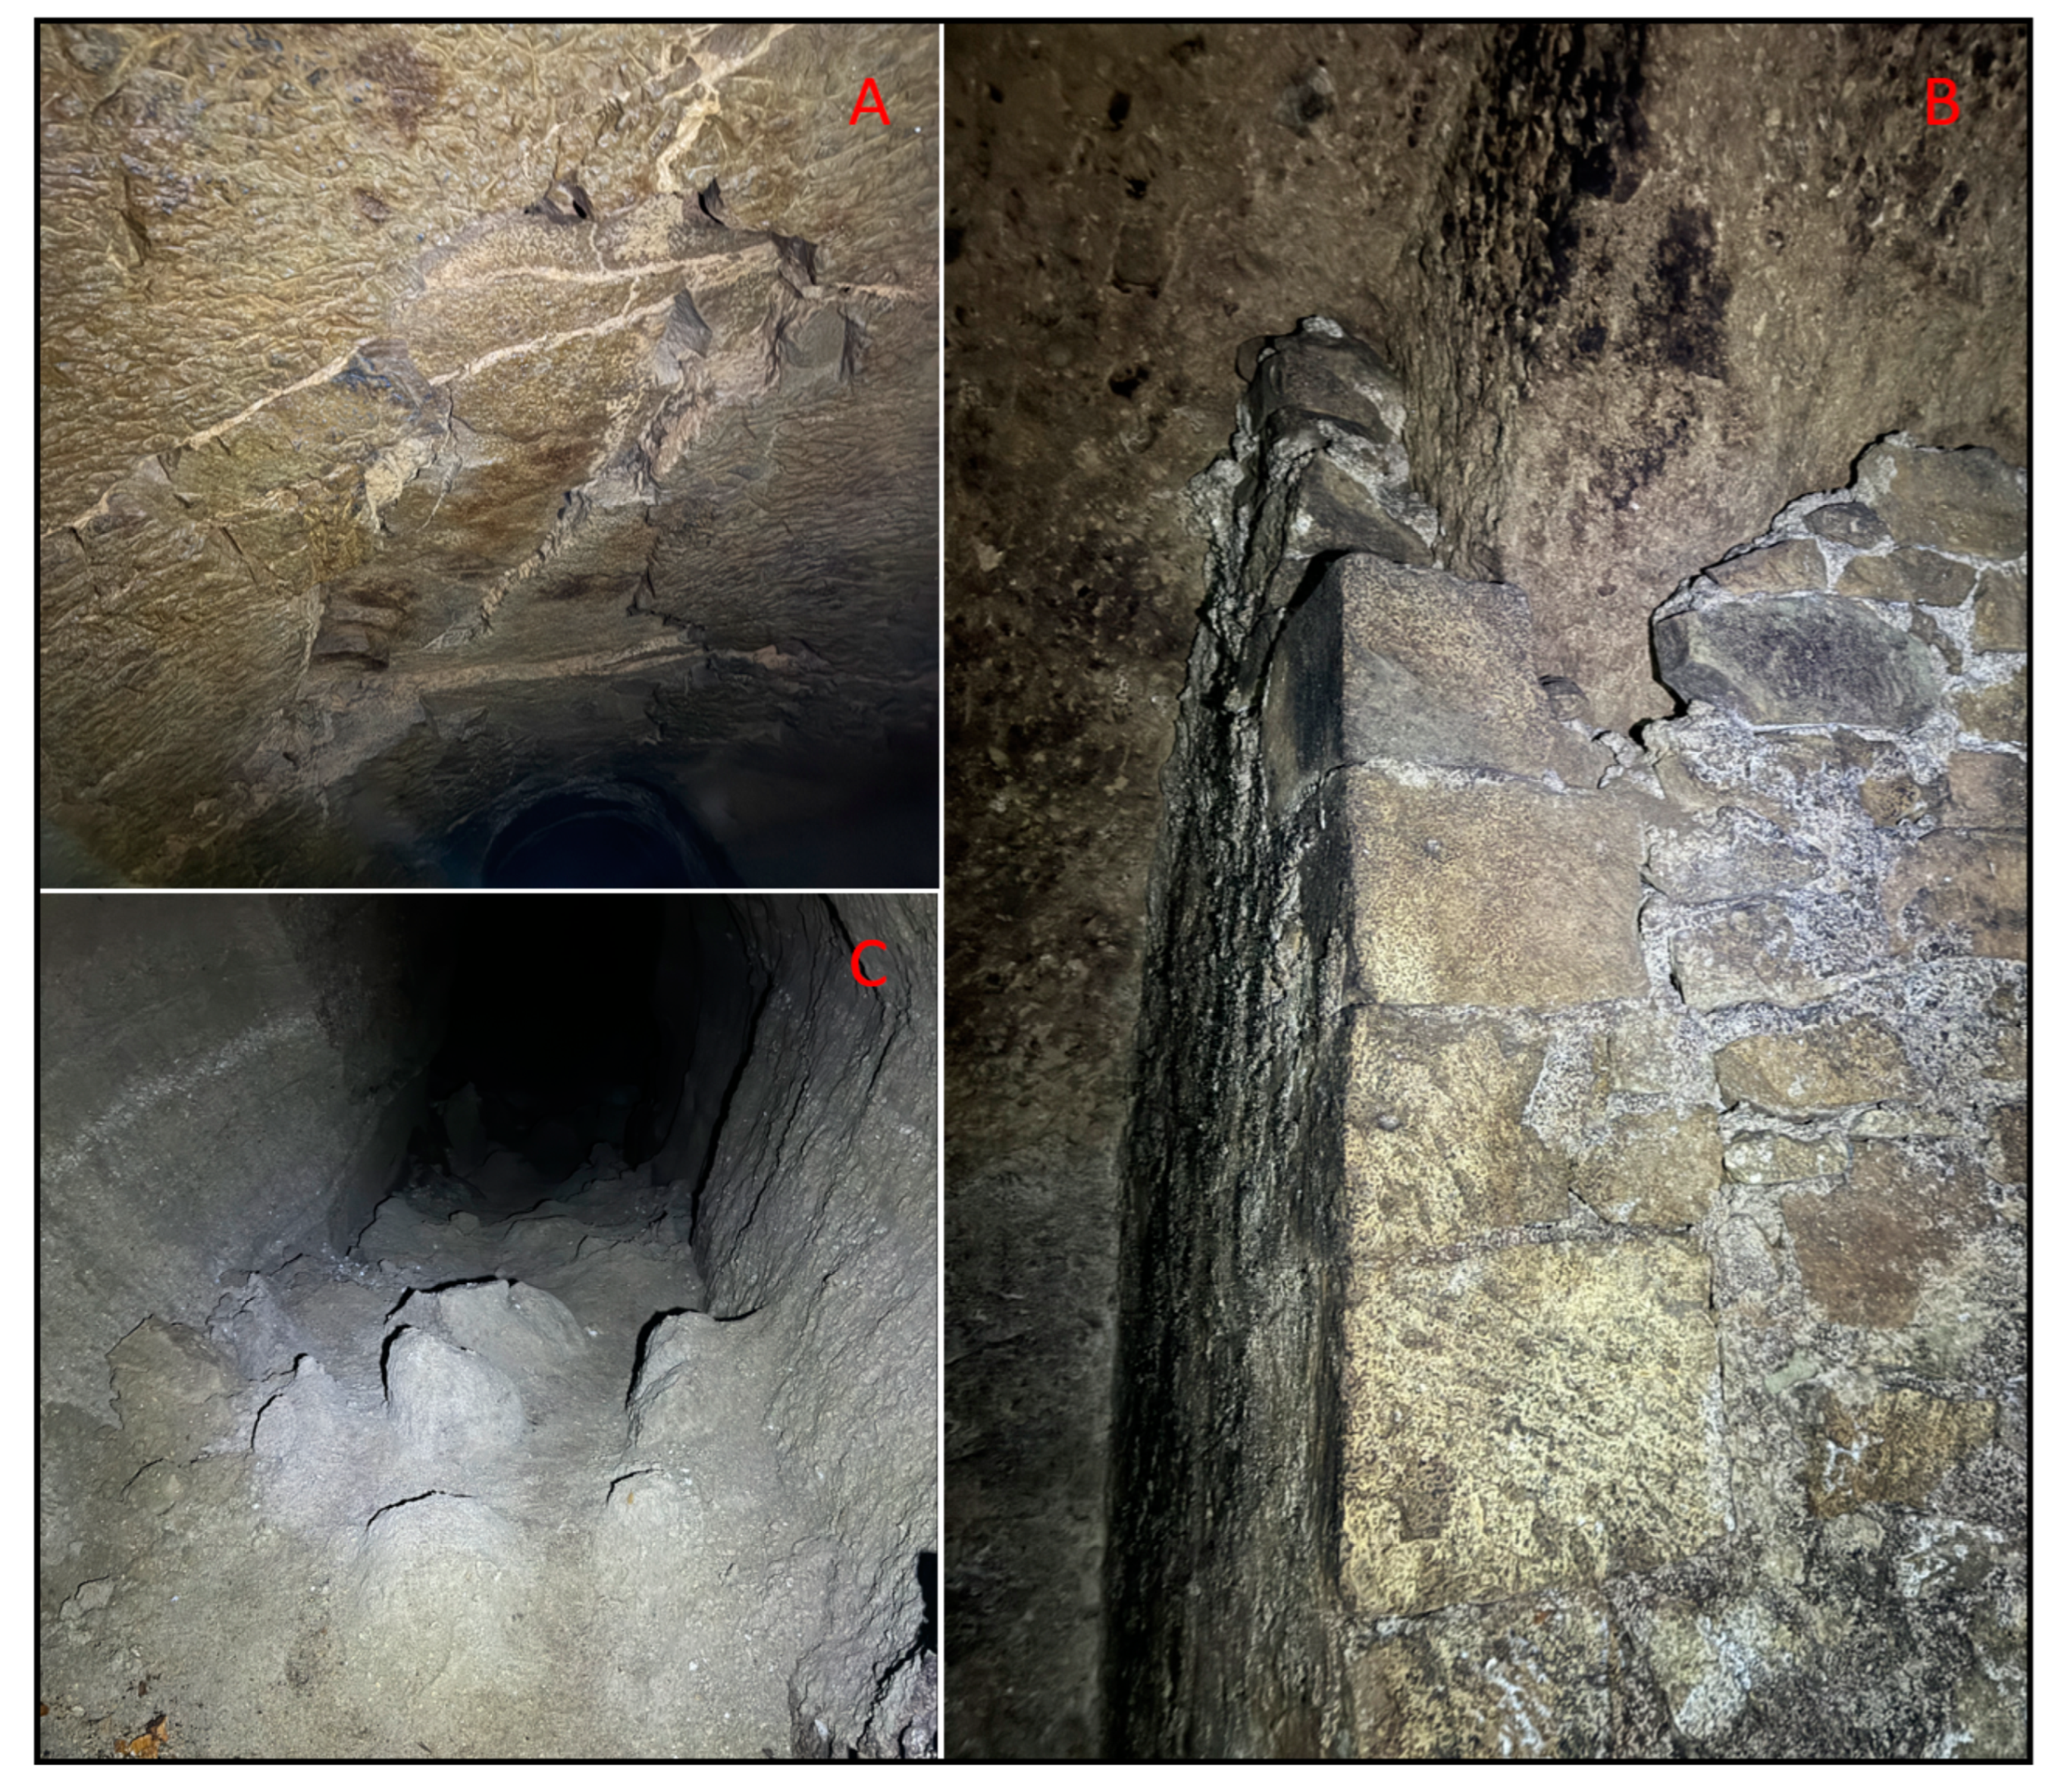
4.1. LiDAR and Photogrammetric Surveys
4.2. Seismic Surveys
4.3. Geomechanical Surveys and Rock Mass Classification
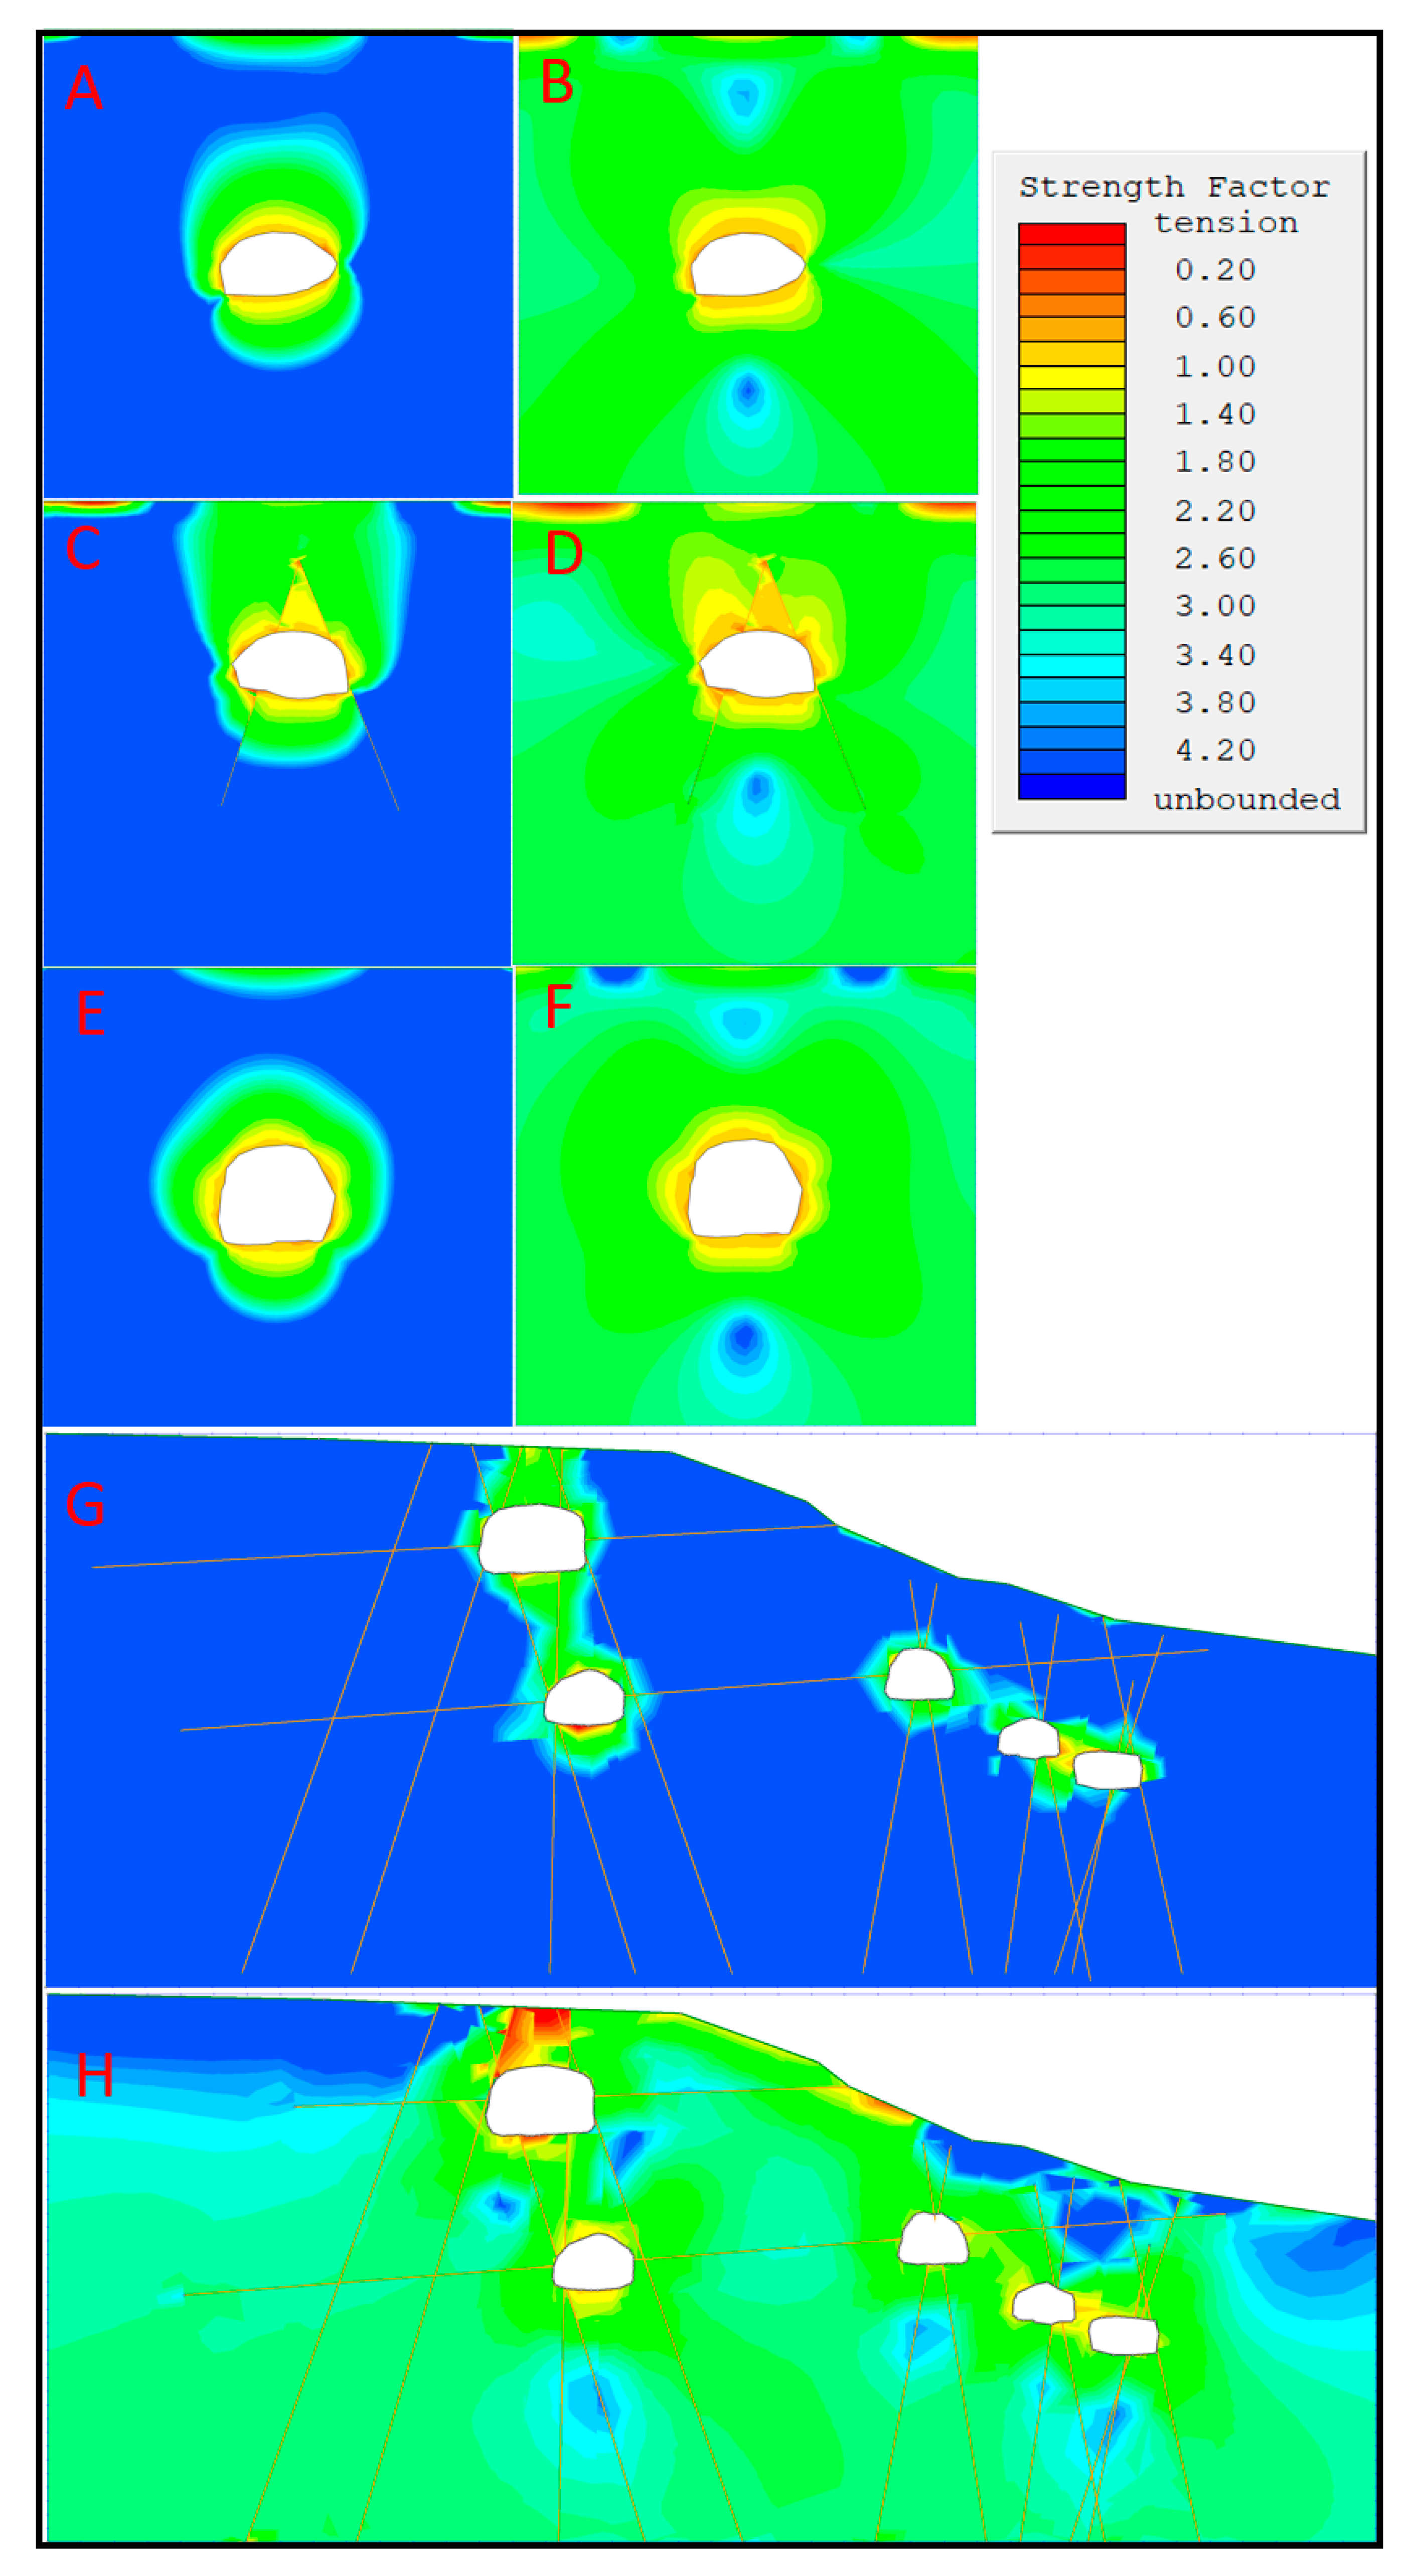
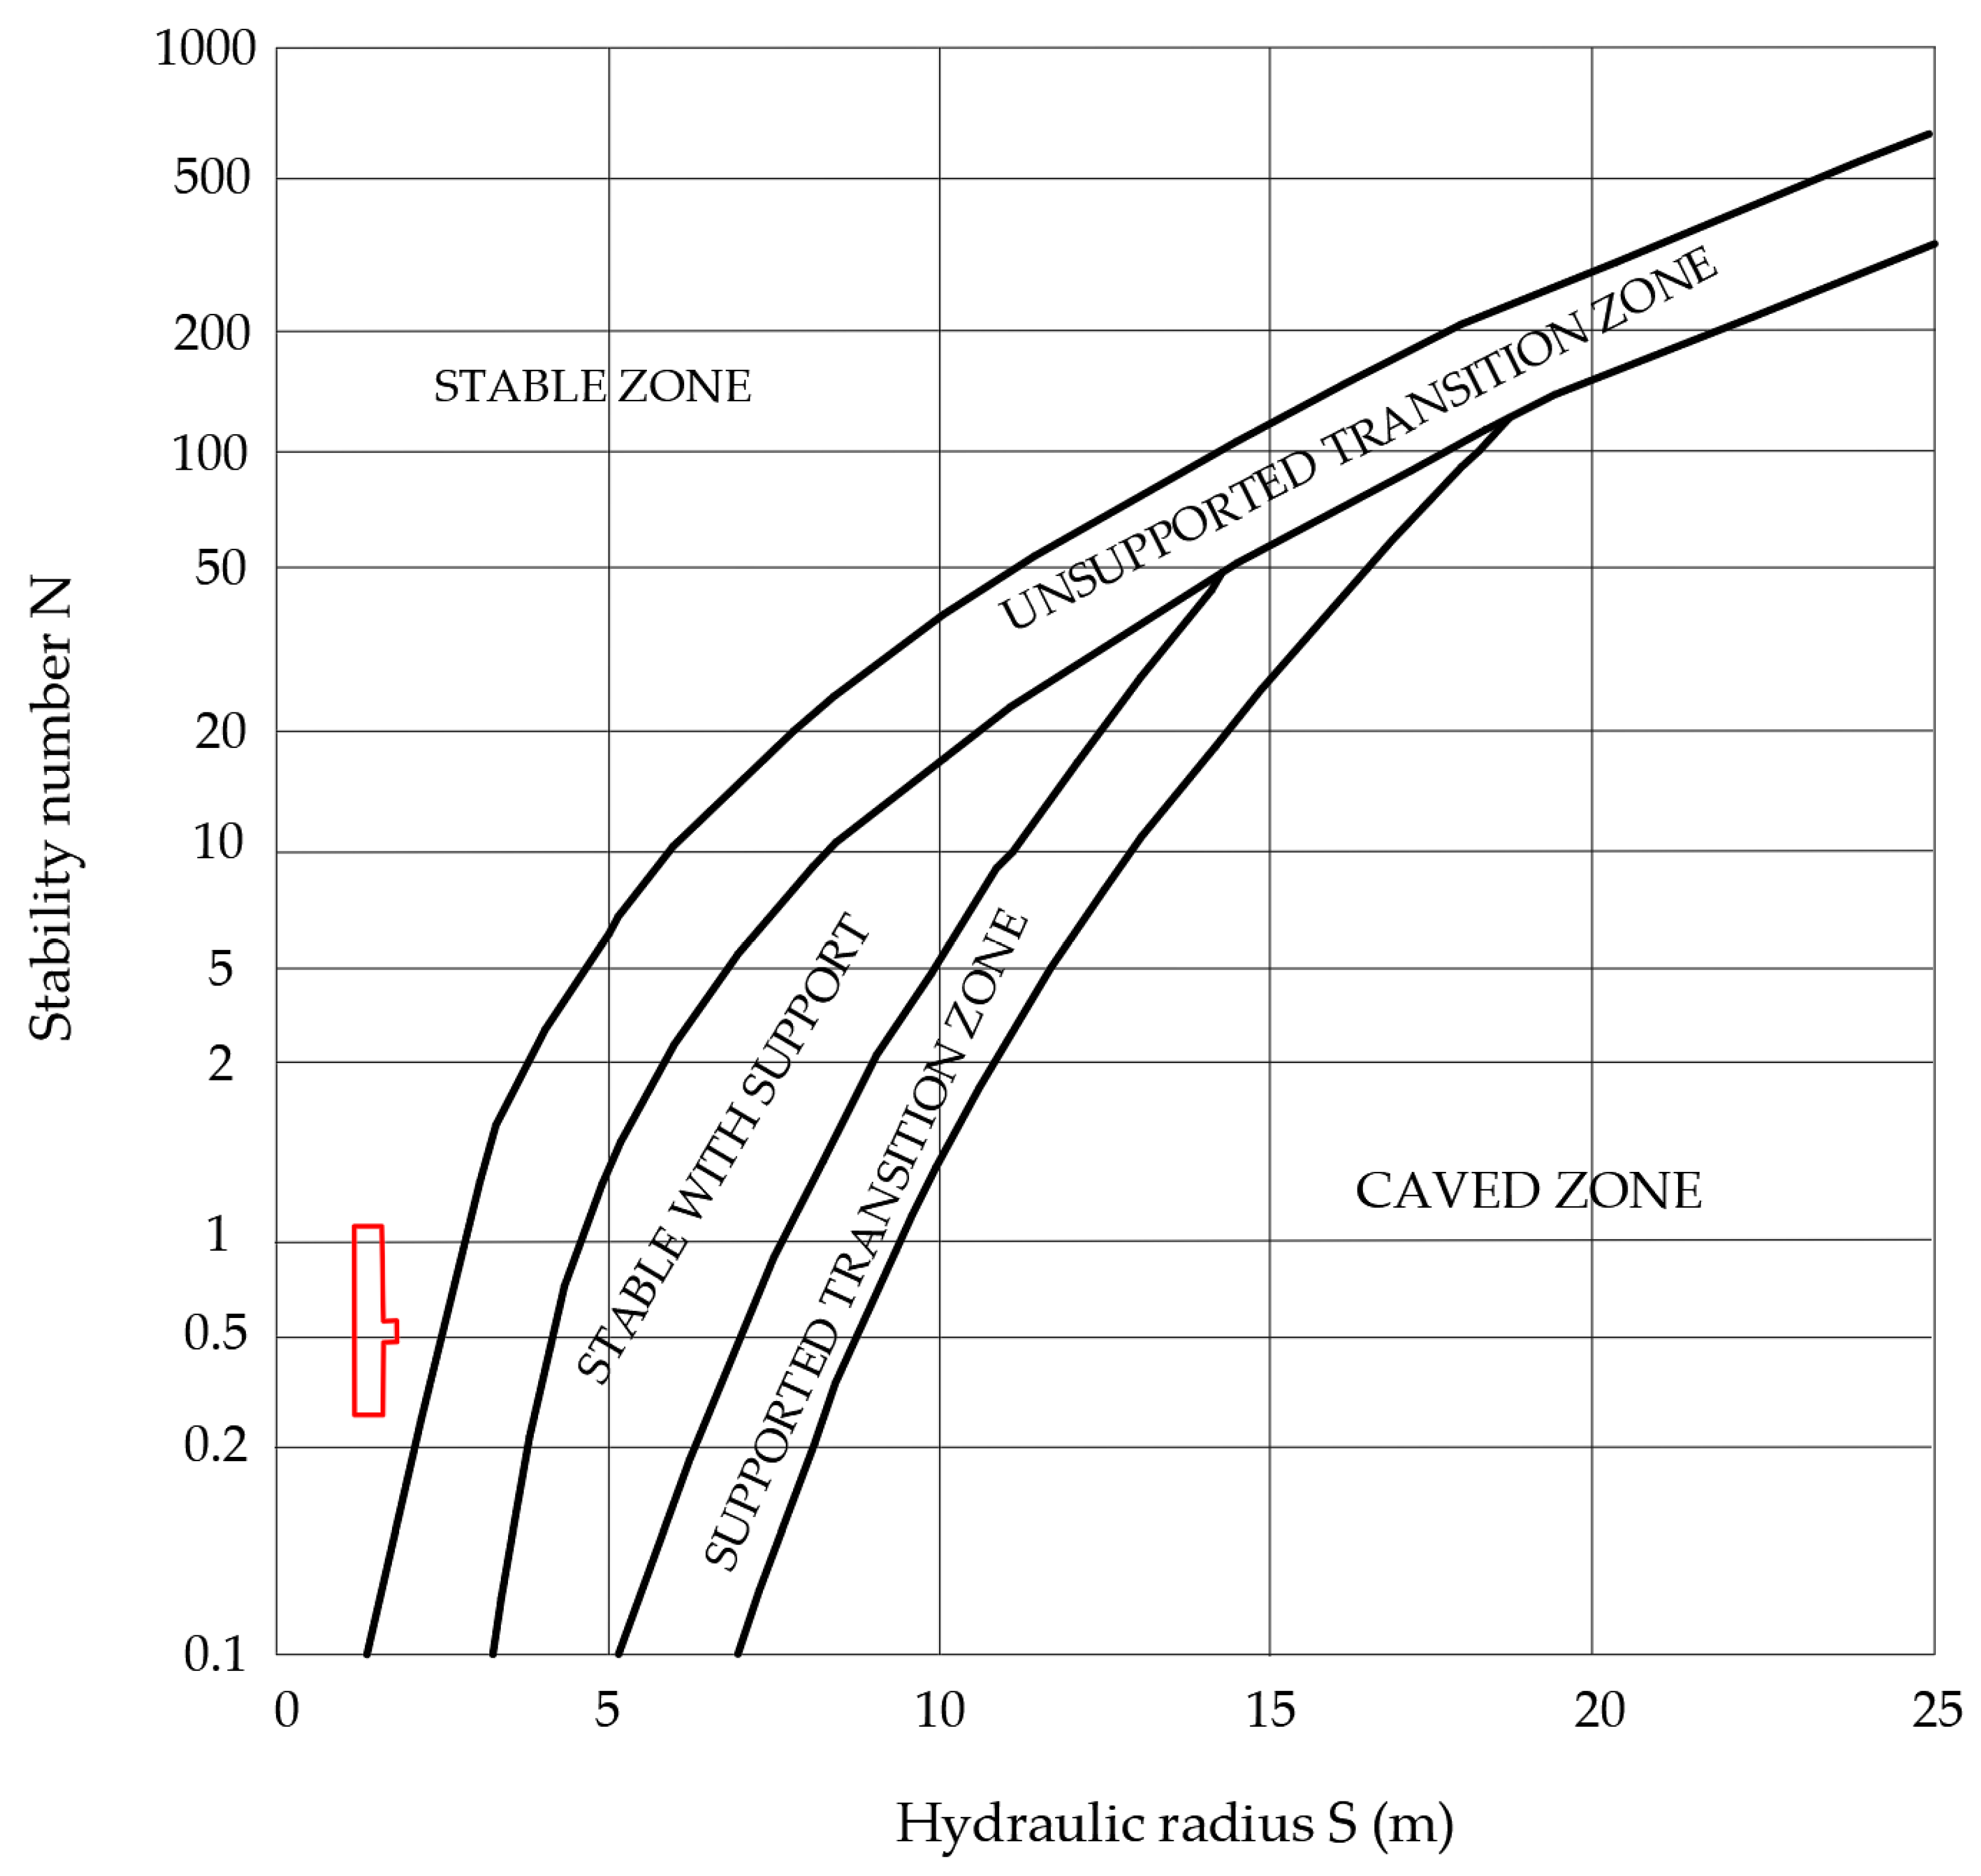
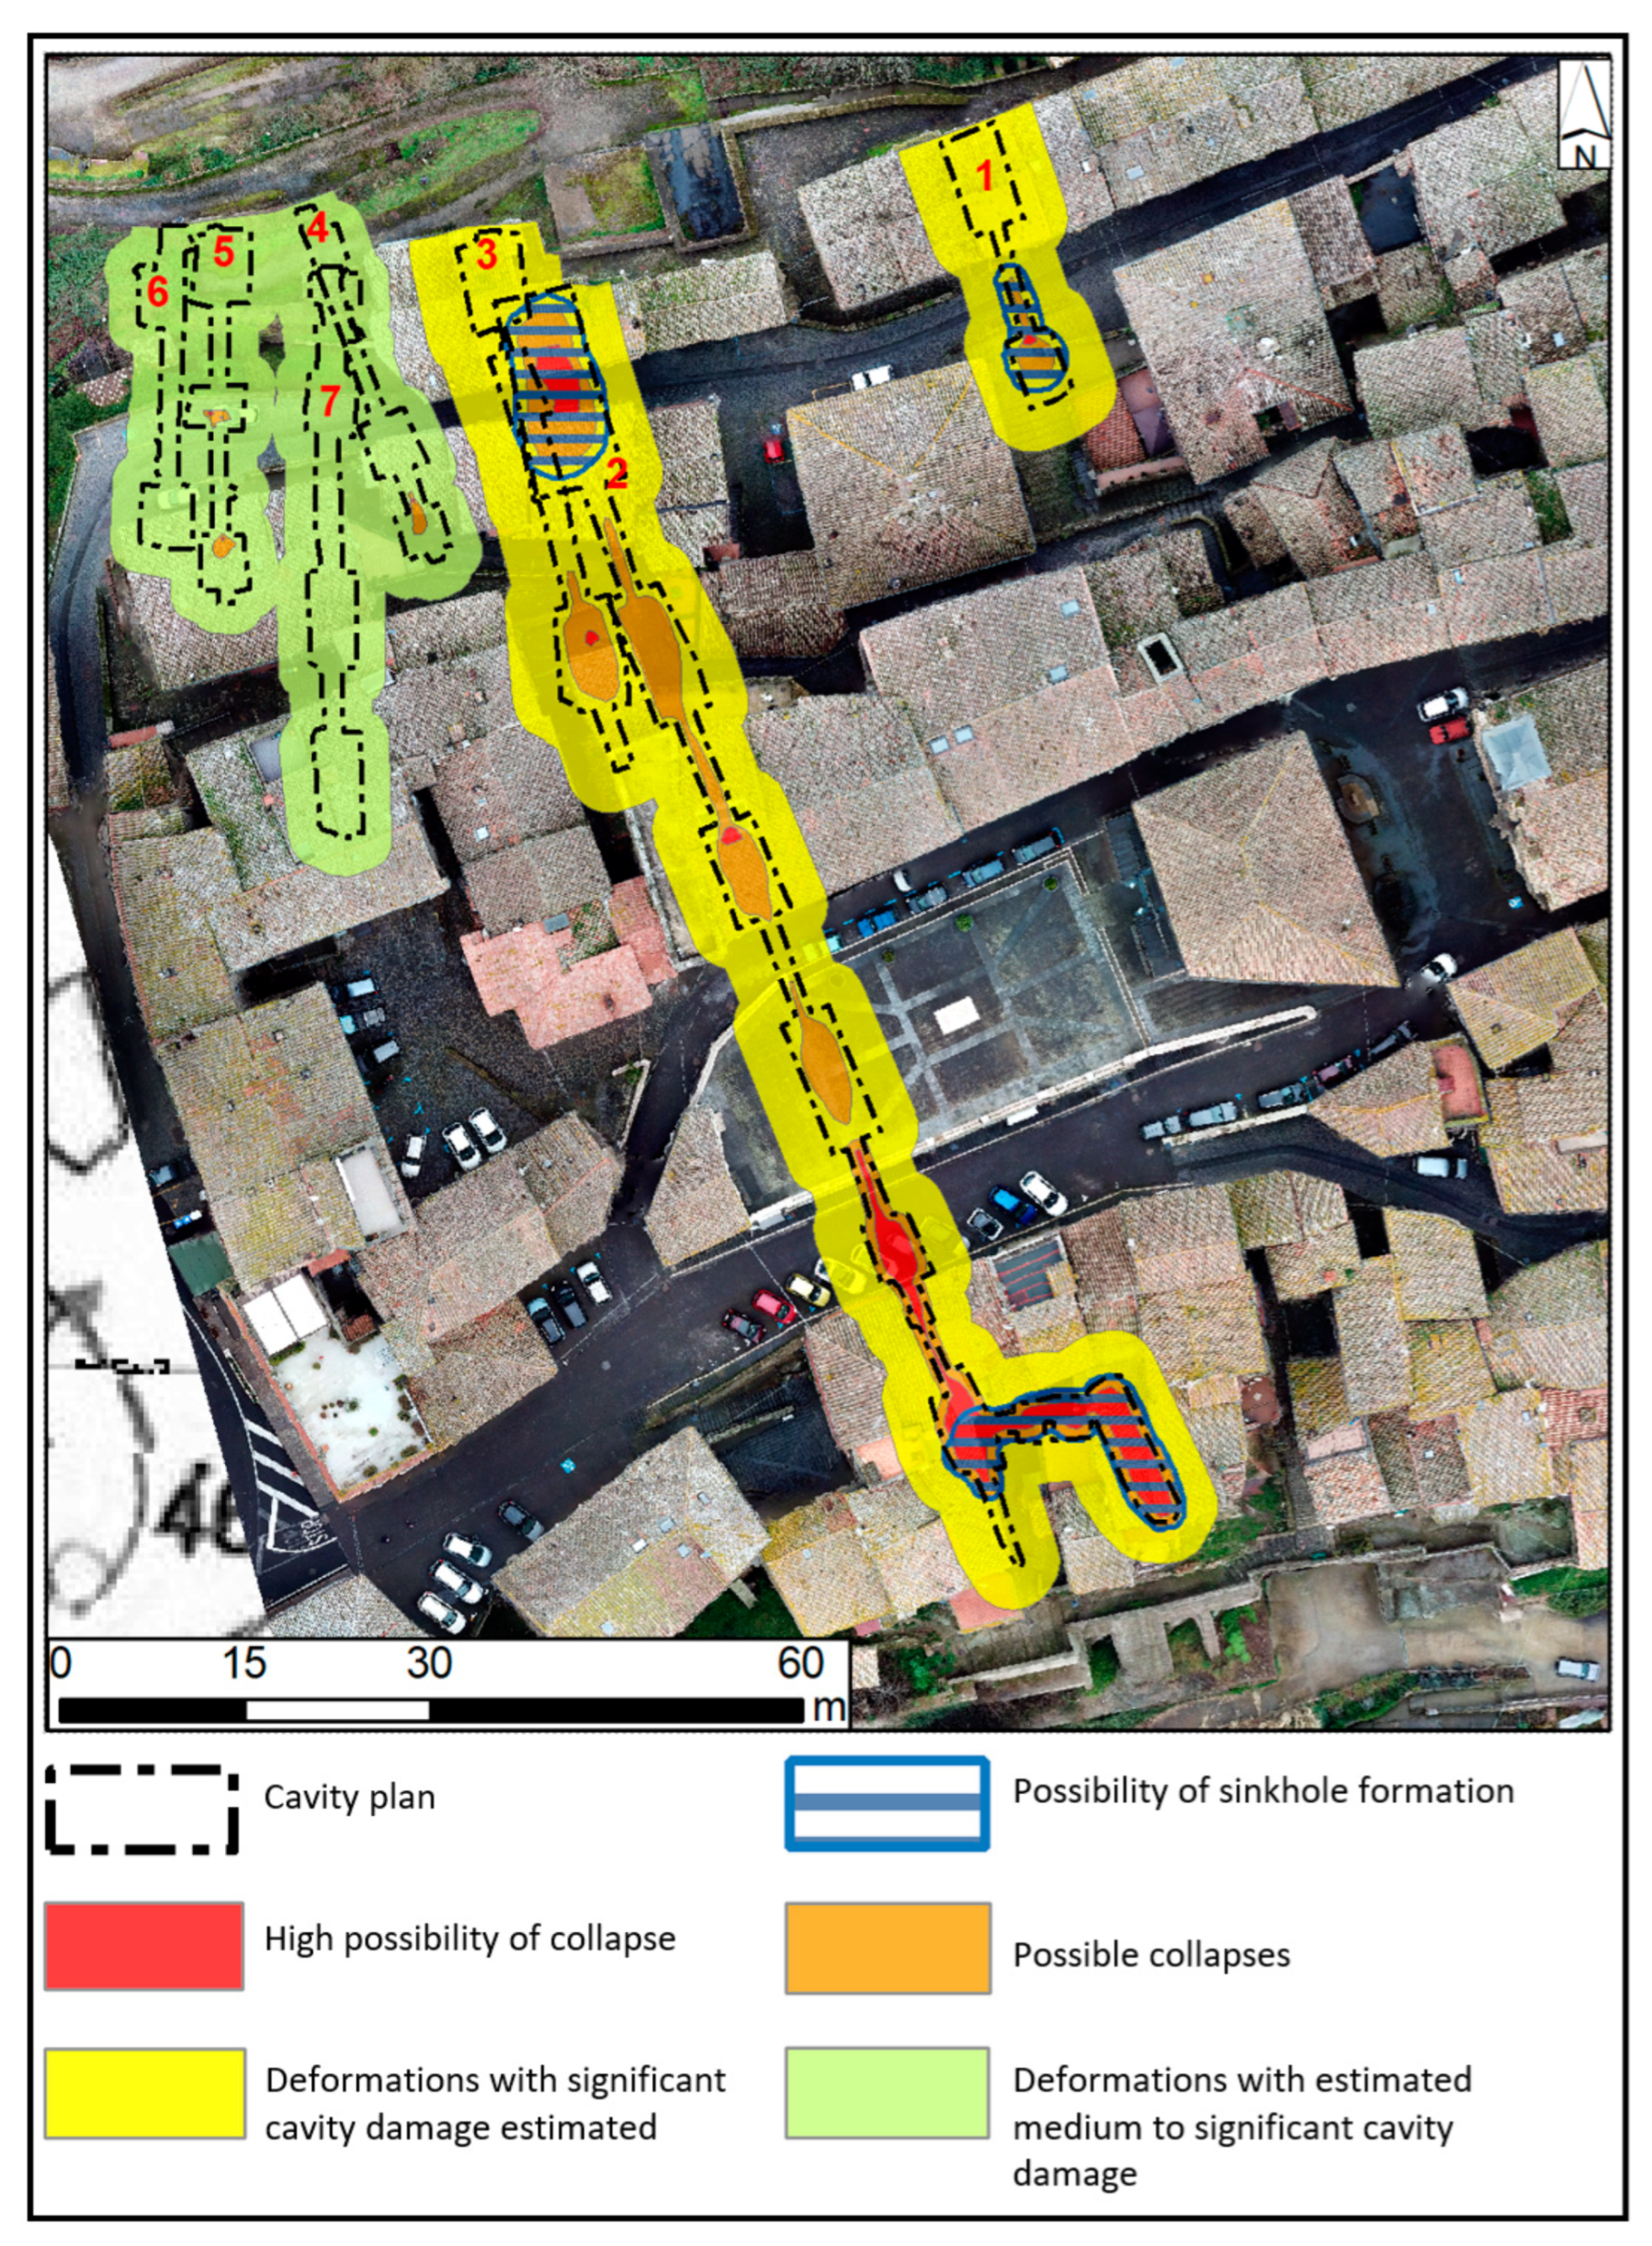
4.4. Stability Assessment
5. Discussion
6. Conclusions
Author Contributions
Funding
Data Availability Statement
Conflicts of Interest
References
- Ministero delle Infrastrutture e dei Trasporti. Norme Tecniche per le Costruzioni (NTC 18). Decreto Ministeriale 17 Gennaio 2018. Available online: https://www.mit.gov.it/ (accessed on 15 February 2025).
- Fairbridge (1968)—The Encyclopedia of Geomorphology; Reinhold: New York, NY, USA, 1968; p. 1295.
- Nisio, S. The sinkholes: Teminological problmes, genetic mechanism, classification. Mem. Descr. Carta Geol. D’it. 2008, 85, 17–32. [Google Scholar]
- Bonamini, M.; Di Maggio, C.; Lollino, P.; Madonia, G.; Parise, M.; Vattano, M. Sprofondamenti di origine antropica nell’area di Marsala (Sicilia occidentale) analizzati mediante rilievi in sito e analisi numerica dei processi di instabilità nelle cave sotterranee. Mem. Descr. Carta Geol. D’italia 2013, 93, 105–120. [Google Scholar]
- Parise, M.; De Pascalis, A.; De Pascalis, F.; Donno, G.; Inguscio, S. Cavita sotterranee a fini estrattivi, e loro connessione con fenomeni di sprofondamento e subsidenza in agro di Cutrofiano (Lecce). Atti Spelaion 2006 Borgo San Celano FG 2008, 55–69. [Google Scholar]
- Madonna, S.; Nisio, S.; Finocchiaro, G.; Gentili, F. Le cavità antropiche presenti nel sottosuolo di Bolsena. Mem. Descr. Carta Geol. D’it. 2020, 107, 383–396. [Google Scholar]
- Madonna, S.; Nisio, S.; Vessella, F. Primo contributo al censimento delle cavità sotterranee di Viterbo. Mem. Descr. Carta Geol. D’it. 2021, 108, 339–352. [Google Scholar]
- Madonna, S.; Gentili, F.; Mattioli, M.; Scatolini, A.; Pendola, V.; Monaldi, G.G.; Monaldi, G. Survey techniques integrating smartphone LiDAR and UAV photogrammetry: The example of the anthropic underground cavities of Montefiascone (Viterbo, Central Italy). Rend. Online Soc. Geol. It. 2024, 64, 26–34. [Google Scholar] [CrossRef]
- Gentili, F.; Madonna, S. Photogrammetry from UAV and Low-Cost LiDAR for Sinkhole Hazard Mitigation in Urban Areas: Applications and Evaluations. Geographies 2024, 4, 343–362. [Google Scholar] [CrossRef]
- Sapia, V.; Materni, V.; Florindo, F.; Marchetti, M.; Gasparini, A.; Voltattorni, N.; Civico, R.; Giannattasio, F.; Miconi, L.; Marabottini, M.F.; et al. Imaging multiparametrico di tombe a camera etrusche: Caso di studio Grotte Di Castro (Italia). Appl. Sci. 2021, 11, 7875. [Google Scholar] [CrossRef]
- Autorità di Bacino Distrettuale Appennino Centrale Piano di Assetto Idrogeologico Autorità di Bacino Distrettuale Appennino Centrale. Available online: https://aubac.it (accessed on 15 February 2025).
- Washington, H.S. The Roman Comagmatic Region; Carnegie Institute Washington: Washington, DC, USA, 1906; Volume 36, pp. 1–220. [Google Scholar]
- Locardi, E.; Lombardi, G.; Funiciello, R.; Parotto, M. The main volcanic groups of the Latium (Italy): Relations between structural evolution and petrogenesis. Geol. Romana 1976, 16, 279–300. [Google Scholar]
- Sparks, R.S.J. Stratigraphie et géologie des ignimbrites du volcan Vulsini, Italie centrale. Geol. Rundsch. 1975, 64, 497–523. [Google Scholar] [CrossRef]
- Nappi, G.; Renzulli, A.; Santi, A. Geological evolution and geochronology of the Vulsini volcanic district (central Italy). Boll. Soc. Geol. Ital. 1995, 114, 599–613. [Google Scholar]
- Acocella, V.; Palladino, D.; Cioni, R.; Russo, P.; Simei, S. Caldera structure, amount of collapse, and erupted volumes: The case of Bolsena caldera, Italy. Geol. Soc. Am. Bull. 2012, 124, 1562–1576. [Google Scholar] [CrossRef]
- Cifani, G.; Tamburini, P.; Della Giovompaola, I.; Ceccarelli, L. La Civita di Grotte di Castro. Ricognizioni ed Indagini di Scavo, 1st ed.; Edizioni Quasar Roma-Autori e Edizioni Quasar di Severino Tognon srl: Via Ajaccio 41-43, Roma, Italy, 2024; pp. 7–99. [Google Scholar]
- Tamburini, P. La Civita di Grotte di Castro. Materiali inediti per uno studio dell’insediamento. In Annali Facoltà di Lettere e Filologia dell’Università degli Studi di Perugia, XVIII; Aracne: Paris, France, 1981; pp. 119–138. [Google Scholar]
- Tamburini, P. La Civita di Grotte di Castro. Note e documenti su di un insedia mento del territorio volsiniese. In Annali della Fondazione per il Museo «Claudio Faina» II; Edizioni Quasar: Roma, Italy, 1985; pp. 182–206. [Google Scholar]
- Timperi, A. Nuove acquisizioni dai territori di Bolsena e Grotte di Castro. In Archeologia del Sottosuolo (atti del 1° Congresso Nazionale di Archeologia del Sottosuolo, Bolsena 2005); Basilico, R., Bavagnoli, Del Lungo, S., Padovan, G., Wilke, K.P., Eds.; Archaeopress: Oxford, UK, 2007; pp. 197–222. [Google Scholar]
- Salamone, F. La Civita di Grotte di Castro. Carta Archeologica; Università la Sapienza: Roma, Italy, 2011; pp. 20–36. [Google Scholar]
- Marabottini, M.F.; Tamburini, P. Grotte di Castro: Il Territorio, il Paese, il Museo; Sistema Museale del Lago di Bolsena: Quaderno, Italy, 2007; pp. 7–31. [Google Scholar]
- Tamburini, P. Contributi per la storia del territorio volsiniese, I. I cippi funerari e l’onomastica. MEFRA 1987, 99, 635–659. [Google Scholar]
- Fiumi, L. Codice diplomatico della Città di Orvieto. Firenze 1884. Available online: https://archive.org/details/codicediplomatic00fumiuoft (accessed on 1 January 2025).
- Peel, M.C.; Finlayson, B.L.; McMahon, T.A. Updated world map of the Köppen-Geiger climate classification. Hydrol. Earth Syst. Sci. 2007, 11, 1633–1644. [Google Scholar] [CrossRef]
- Colomina, I.; Molina, P. Unmanned aerial systems for photogrammetry and remote sensing: A review. ISPRS J. Photogramm. Remote Sens. 2014, 92, 79–97. [Google Scholar] [CrossRef]
- Pingel, T.J.; Saavedra, A.; Cobo, L. Deriving Land and Water Surface Elevations in the Northeastern Yucatán Peninsula Using PPK GPS and UAV-Based Structure from Motion. Pap. Appl. Geogr. 2021, 7, 294–315. [Google Scholar] [CrossRef]
- Puzzilli, L.; Ruscito, V.; Madonna, S.; Gentili, F.; Ruggiero, L.; Ciotoli, G.; Nisio, S. Natural sinkhole monitoring and characterization: The case of Latera sinkhole (Central Italy). Geosciences 2024, 14, 18. [Google Scholar] [CrossRef]
- Agisoft LLC. Agisoft Metashape (Version 1.6.3) [Software]. 2020. Available online: https://www.agisoft.com (accessed on 16 July 2021).
- Monsalve, A.; Yager, E.M.; Tonina, D. Evaluating Apple iPhone LiDAR measurements of topography and roughness elements in coarse bedded streams. J. Ecohydraul. 2023, 1–11. [Google Scholar] [CrossRef]
- King, F.; Kelly, R.; Fletcher, C.G. New opportunities for low-cost LiDAR-derived snow depth estimates from a consumer drone-mounted smartphone. Cold Reg. Sci. Technol. 2023, 207, 103757. [Google Scholar] [CrossRef]
- Jerjomina, A.; Varbla, S. Advantages of low-cost LiDAR sensors in surveying underground utility networks. Tunn. Undergr. Space Technol. 2025, 157, 106325. [Google Scholar] [CrossRef]
- Cloud Compare (Version 2.1) [GPL Software]. 2024. Available online: http://www.cloudcompare.org/ (accessed on 10 February 2025).
- Gruppo di Lavoro. Linee Guida per le Buone Pratiche dell’Analisi delle onde Superficiali; CNR Edizioni: Rome, Italy, 2021; p. 135. [Google Scholar]
- SESAME Team. Guidelines for the Implementation of the H/V Spectral Ratio Technique on Ambient Vibrations: Measurements, Processing and Interpretation; (Deliverable No. D23.12), WP12. 2004 SESAME European Research Project; European Commission: Brussels, Belgium, 2004. [Google Scholar]
- Palmer, D.L. The Generalized Reciprocal Method of Seismic Refraction Interpretation; Society of Exploration Geophysicists: Tulsa, OK, USA, 1980. [Google Scholar] [CrossRef]
- Park, C.B.; Miller, R.D.; Xia, J. Multichannel analysis of surface waves. Geophysics 1999, 64, 800–808. [Google Scholar]
- Nakamura, Y. A Method for Dynamic Characteristics Estimation of Subsurface Using Microtremor on the Ground Surface. Railw. Tech. Res. Inst. Q. Rep. 1989, 30, 25–33. [Google Scholar]
- Coco, G.; Corrao, M. Geofisica Applicata; Dario Flaccovio Editore: Palermo, Italy, 2008. [Google Scholar]
- Barton, N.; Lien, R.; Lunde, J. Engineering classification of rock masses for the design of tunnel support. Rock Mech. 1974, 6, 188–236. [Google Scholar]
- I.S.R.M. (International Society for Rock Mechanics). Basic geotechnical description of rock masses. Int. Journ Rock Mech. Min. Sci. Geom. Abstr. 1981, 18, 85–110. [Google Scholar]
- I.S.R.M. (International Society for Rock Mechanics). Rock Characterization, Testing and Monitoring; Brown, E.T., Ed.; Pergamon Press: Oxford, UK, 1981; p. 211. [Google Scholar]
- Hoek, E.; Brown, E.T. Empirical Strength Criterion for Rock Masses. J. Geotech. Eng. 1980, 106, 1013–1035. [Google Scholar]
- Hoek, E.; Brown, E.T. The Hoek-Brown Failure Criterion—A 1988 Update. In Proceedings of the 15th Canadian Rock Mechanics Symposium, Toronto, ON, Canada, 3–4 October 1988; University of Toronto: Toronto, ON, Canada, 1988; pp. 31–38. [Google Scholar]
- Hoek, E. Strength of rock and rock masses. ISRM News J. 1994, 2, 4–16. [Google Scholar]
- Carter, T.G. A new approach to surfacecrown pillar design. In Proceedings of the 16th Canadian Rock Mechanics Symposium, Sudbury, ON, Canada, 16–19 June 1992; pp. 75–83. [Google Scholar]
- Carter, T.G. Guidelines for Use of the Scaled Span Method for Surface Crown Pillar Stability Assessment; Ontario Ministry of Northern Development and Mines: Sudbury, ON, Canada, 2014; pp. 1–34. [Google Scholar]
- Harp, E.L.; Noble, M.A. An Engineering Rock Classification to Evaluate Seismic Rock-Fall Susceptibility and its Application to the Wasatch Front. Environ. Eng. Geosci. 1993, 30, 293–319. [Google Scholar]
- Diederichs, M.S.; Kaiser, P.K. Stability of large excavations in laminated hard rock masses: The voussoir analogue revisited. Int. J. Rock Mech. Min. Sci. 1999, 36, 97–117. [Google Scholar]
- Diederichs, M.S.; Kaiser, P.K. Tensile strength and abutment relaxation as failure control mechanisms in underground excavations. Int. J. Rock. Mech. Min. Sci. 1999, 36, 69–96. [Google Scholar]
- Barton, N.; Choubey, V. The shear strength of rock joints in theory and practice. Rock Mech. 1977, 10, 1–54. [Google Scholar] [CrossRef]
- Stucchi, M.; Meletti, C.; Montaldo, V.; Crowley, H.; Calvi, G.M.; Boschi, E. Seismic Hazard Assessment (2003–2009) for the Italian Building Code. Bull. Seismol. Soc. Am. 2011, 101, 1885–1911. [Google Scholar] [CrossRef]
- Available online: https://esse1-gis.mi.ingv.it/ (accessed on 23 February 2025).
- Deliberazione Giunta Regionale del Lazio 17 giugno 2014 n363. Approvazione delle “Linee Guida per la Pianificazione Comunale o Intercomunale di Emergenza in Materia di Protezione Civile”; Bollettino Ufficiale della Regione Lazio n.52 del 1/07/2014; Regione Lazio: Rome, Italy, 2014. [Google Scholar]
- Albarello, D.; Cesi, C.; Eulilli, V.; Guerrini, F.; Lunedei, E.; Paolucci, E.; Pileggi, D.; Puzzilli, L.M. The contribution of the ambient vibration prospecting in seismic microzoning: An example from the area damaged by the 26th April 2009 l’Aquila (Italy) earthquake. Boll. Geofis. Teor. Appl. 2010, 52, 513–538. [Google Scholar]
- QGIS Development Team. QGIS Geographic Information System. Version 3.16. Open Source Geospatial Foundation Project. Available online: https://qgis.org (accessed on 10 January 2024).
- Madonna, S.; Nisio, S.; Gentili, F.; Vessella, F.; Scardozzi, G.; Romagnoli, G.; Di Nezza, M.; Di Filippo, M.; Pelorosso, M.; Pagano, G. The role of historical-archaeological sources integrated into the GIS environment with geological and geophysical data in the mitigation of geological risks in some urban areas. Rend. Online Soc. Geol. It. 2023, 61, 50–57. [Google Scholar] [CrossRef]
- Potvin, Y.; Milne, D. Empirical cable bolt support design. In Rock Support in Mining and Underground Construction. In Proceedings of the 16th Canadian Rock Mechanics Symposium, Sudbury, ON, Canada, 16–19 June 1992; Kaiser, P.K., McCreath, D.R., Eds.; Balkema: Rotterdam, The Netherlands, 1992. [Google Scholar]
- Bernabini, M. Un esempio di applicazione dei metodi sismici allo studio del comportamento statico dei pilastri in sotterraneo. In Proceedings of the Symposium AMS, Cagliari, Italy, 26–29 July 1965. [Google Scholar]
- Bernabini, M.; Esu, F.; MartinettiI, S.; Ribacchi, R. On the stability of the pillars in a underground quarry worked through soft pyroclastic rocks. In Proceedings of the 1st ISRM Congress, Lisbon, Portugal, 25 September–1 October 1966; pp. 285–291. [Google Scholar]


| Cavity | Error (RMS cm) | Scale Factor |
|---|---|---|
| 1 | 1.6 | 0.996 |
| 2 | 3.1 | 1.004 |
| 3 | 2.1 | 0.999 |
| 4 | 2.3 | 0.998 |
| 5 | 2.1 | 1.001 |
| Quality Level | Q | Class | GSI | σc (MPa) | σt (MPa) |
|---|---|---|---|---|---|
| 1 | 2.43 | Poor | 53 | 8 | 1.6 |
| 2 | 7.51 | Fair | 58 | 10 | 2 |
| 3 | 0.45 | Very poor | 50 | 5 | 1 |
| Cavity | Part | Cs | Sc | Stability (Cs < Sc) |
|---|---|---|---|---|
| 1 | Connection 1 | 0.67 | 5.09 | Yes |
| Room 1 | 1.87 | 5.09 | Yes | |
| 2 | Room 1 | 5.00 | 5.09 | Yes (limit) |
| Connection 1 | 1.06 | 5.09 | Yes | |
| Room 2 | 2.88 | 5.09 | Yes | |
| Connection 2 | 0.90 | 5.09 | Yes | |
| Room 3 | 2.27 | 5.09 | Yes | |
| Connection 3 | 0.66 | 2.35 | Yes | |
| Room 4 | 1.76 | 2.35 | Yes | |
| Connection 4 | 0.70 | 2.35 | Yes | |
| Room 5 | 1.57 | 2.35 | Yes | |
| Connection 5 | 0.84 | 2.35 | Yes | |
| Room 6 | 2.88 | 2.35 | No | |
| Room 7 | 2.37 | 2.35 | No | |
| Room 8 | 2.78 | 2.35 | No | |
| 3 | Connection 1 | 1.03 | 7.93 | Yes |
| Room 2 | 2.07 | 7.93 | Yes | |
| 4 | Room 1 | 3.73 | 7.93 | Yes |
| Connection 1 | 1.36 | 7.93 | Yes | |
| Room 2 | 2.02 | 7.93 | Yes | |
| Connection 2 | 0.87 | 7.93 | Yes | |
| Room 3 | 1.62 | 7.93 | Yes | |
| 5 | Room 1 | 3.73 | 7.93 | Yes |
| Connection 1 | 1.36 | 7.93 | Yes | |
| Room 2 | 2.02 | 7.93 | Yes | |
| Connection 2 | 0.87 | 7.93 | Yes | |
| Room 3 | 1.62 | 7.93 | Yes |
| Class (Q) | Q″ | Susceptibility |
|---|---|---|
| Poor | 9.7 | Medium |
| Fair | 5.8 | Medium |
| Very poor | 2.2 | Medium |
| Cavity | Part | σs (MPa) | σt (MPa) | SF (σt/σs) |
|---|---|---|---|---|
| 1 | Room 1 | 0.57 | 1.60 | 2.82 |
| 2 | Room 1 | 1.11 | 1.60 | 1.45 |
| Room 2 | 1.44 | 1.60 | 1.11 | |
| Room 3 | 1.34 | 1.60 | 1.19 | |
| Room 4 | 1.85 | 1.00 | 0.54 | |
| Room 5 | 0.81 | 1.00 | 1.24 | |
| Room 6 | 1.35 | 1.00 | 0.74 | |
| Room 7 | 1.20 | 1.00 | 0.84 | |
| Room 8 | 1.11 | 1.00 | 0.90 | |
| 3 | Room 1 | 1.07 | 2.00 | 1.86 |
| 4 | Room 1 | 0.15 | 2.00 | 13.20 |
| Room 2 | 0.30 | 2.00 | 6.70 | |
| Room 3 | 0.27 | 2.00 | 7.28 | |
| 5 | Room 1 | 0.31 | 2.00 | 6.45 |
| Room 2 | 0.94 | 2.00 | 2.12 | |
| Room 3 | 0.63 | 2.00 | 3.17 |
| Cavity | SF < 1 (Static) | SF < 1 (Seismic) |
|---|---|---|
| 1 | 2.6% | 4.4% |
| 2 | 12.3% | 26.3% |
| 3 | 2.5% | 3.9% |
| 4 | 1.6% | 2.8% |
| 5 | 1.8% | 3.3% |
Disclaimer/Publisher’s Note: The statements, opinions and data contained in all publications are solely those of the individual author(s) and contributor(s) and not of MDPI and/or the editor(s). MDPI and/or the editor(s) disclaim responsibility for any injury to people or property resulting from any ideas, methods, instructions or products referred to in the content. |
© 2025 by the authors. Licensee MDPI, Basel, Switzerland. This article is an open access article distributed under the terms and conditions of the Creative Commons Attribution (CC BY) license (https://creativecommons.org/licenses/by/4.0/).
Share and Cite
Gentili, F.; Madonna, S.; Nisio, S. The Importance of the Census of Anthropogenic Cavities in the Mitigation Geological Hazards: The Case of Grotte di Castro (Italy). Geographies 2025, 5, 19. https://doi.org/10.3390/geographies5020019
Gentili F, Madonna S, Nisio S. The Importance of the Census of Anthropogenic Cavities in the Mitigation Geological Hazards: The Case of Grotte di Castro (Italy). Geographies. 2025; 5(2):19. https://doi.org/10.3390/geographies5020019
Chicago/Turabian StyleGentili, Francesco, Sergio Madonna, and Stefania Nisio. 2025. "The Importance of the Census of Anthropogenic Cavities in the Mitigation Geological Hazards: The Case of Grotte di Castro (Italy)" Geographies 5, no. 2: 19. https://doi.org/10.3390/geographies5020019
APA StyleGentili, F., Madonna, S., & Nisio, S. (2025). The Importance of the Census of Anthropogenic Cavities in the Mitigation Geological Hazards: The Case of Grotte di Castro (Italy). Geographies, 5(2), 19. https://doi.org/10.3390/geographies5020019