Article

The Impact of Weather on the Spread of COVID-19: The Case of the Two Largest Cities in Greece

by
Despoina D. Tounta
1,*,
Panagiotis T. Nastos
1,
Dimitrios N. Paraskevis
2 and
Athanasios D. Sarantopoulos
3
1
Laboratory of Climatology and Atmospheric Environment, Department of Geology and Geoenvironment, National and Kapodistrian University of Athens, Campus, Zografou, 157 84 Athens, Greece
2
Department of Hygiene Epidemiology and Medical Statistics, Medical School, National and Kapodistrian University of Athens, Mikras Asias 75 Street, Goudi, 115 27 Athens, Greece
3
Hellenic National Meteorological Service, El. Venizelou 14, Elliniko, 167 77 Athens, Greece
*
Author to whom correspondence should be addressed.
Geographies 2025, 5(1), 5; https://doi.org/10.3390/geographies5010005
Submission received: 17 December 2024 / Revised: 27 January 2025 / Accepted: 30 January 2025 / Published: 3 February 2025

Abstract

:
The new global pandemic of COVID-19, declared on 11 March 2020 by the World Health Organization, has already had an unprecedented impact on health and socioeconomic activities worldwide. The second wave of the COVID-19 pandemic swept through the United States of America and Europe in late September 2020. Compared with other southern countries, such as Greece, where there was a significant increase in cases at the end of October 2020, Northern European countries (Germany, France, Austria, Finland, and Sweden) experienced this second wave of the pandemic earlier in September 2020. To understand the epidemiological behavior of the virus from an environmental perspective, we examined the effects of air temperature, humidity, and wind on the spread of COVID-19 in two of the largest population Regional Units (R.U.) of Greece, namely the R.U. of the Central Sector of Athens in Central Greece and the R.U. of Thessaloniki in Northern Greece. We applied Pearson correlation analysis and generalized linear models (GLM) with confirmed COVID-19 Intensive Care Unit (ICU) admissions from the National Public Health Organization as dependent variables and the corresponding air temperature, humidity, and wind speed from the Greek National Meteorological Service as independent covariates. The study focused on the period from 4 May 2020 to 3 November 2020 to investigate the impact of weather on the spread of COVID-19, in a period where human activities had partially returned to normal after the gradual lifting of the restrictive measures of the first lockdown (23 March 2020). The end date of the study period was set as the date of imposition of a new local lockdown in the R.U. of Thessaloniki (3 November 2020). Our findings showed that COVID-19 ICU admissions in both Regional Units decreased significantly with the temperature (T) and wind speed (WS) increase. In the R.U. of the Central Sector of Athens, this picture is reflected in both the single and cumulative lag effects of meteorological parameters. In the R.U. of Thessaloniki, this correlation was differentiated only in terms of the cumulative lag effect of the average daily temperature, where an increase (+17.6%) in daily confirmed COVID-19 ICU admissions was observed. On the other hand, relative humidity (RH) was significantly associated with an increase in cases in both R.U. This study, in addition to its contribution to the global research effort to understand the effects of weather on the spread of COVID-19, aims to highlight the need to integrate meteorological parameters as predictive factors in surveillance and early warning systems for infectious diseases. The combination of weather and climate factors (e.g., humidity, temperature, wind) and other contagious disease surveillance indicators (e.g., wastewater, geographic and population data, human activities) would make the early identification of potential epidemic risks more effective and would contribute to the immediate initiation of public health interventions and the more rational allocation of resources.

1. Introduction

The SARS-CoV-2 virus emerged in December 2019 in Wuhan, Hubei Province, China, and by 30 January 2020, had spread to 18 countries outside China. On 12 February 2020, the World Health Organization (WHO) announced that the disease caused by the virus would be named COVID-19, and a month later, considering the rapid increase in cases (over 118,000 cases in 114 countries and 4292 deaths), declared the disease a pandemic. SARS-CoV-2 has a positive-sense single-stranded RNA genome and a cellular structure consisting of structural proteins including spike (S), envelope (E), membrane (M), and nucleocapsid (N) and a non-structural polyprotein replicase. The S protein on the surface of SARS-CoV is involved in receptor recognition and the binding and entry of the virus into human cells [1,2].
The natural reservoir of SARS-CoV-2 is thought to be bats, and the intermediate host through which the virus mutated and was transmitted to humans is thought to be a species of pangolin [3]. However, the natural source of SARS-CoV-2 has not yet been confirmed, and therefore, the disease has been classified as an emerging infectious disease (EID) of possible animal origin [4].
The virus is transmitted through respiratory droplets produced by coughing or sneezing by individuals infected with SARS-CoV-2 [5] or through human contact or touching contaminated surfaces [6]. After an incubation period of 1–14 days [7], the virus causes a respiratory illness (COVID-19) with mild to very severe symptoms (cough, myalgia, fever, fatigue, and dyspnea), like those of the same family (Coronaviridae-b) coronaviruses SARS-CoV and MERS-CoV that caused epidemics in 2002 and 2012 [8,9,10]. The clinical picture of the disease ranges from asymptomatic or mild respiratory infection to uncontrolled pneumonia with acute respiratory distress syndrome, multiple organ failure, and death [11,12,13]. According to Datta et al. [14], complications following the acute phase of infection have been identified, such as a rare multisystem inflammatory disease that can occur in children and adults 2 to 5 weeks after the initial infection and can even affect different systems than those of the acute phase.
Symptoms may involve cardiovascular and gastrointestinal systems, with dermatological and mucosal manifestations like Kawasaki disease in children. SARS-CoV-2 is highly transmissible, as it manages to evade the host immune response [15] and mutate in its attempt to survive, resulting in the emergence of many alarming variants [16,17]. In addition, immunity and population density, the quality of health services, and meteorological factors play a strong role in the transmissibility of the virus and the rapid spread of COVID-19 [18].
COVID-19 spread rapidly through travel and trade around the world, and countries responded by adopting restrictive measures to prevent its spread.
In Greece, the first confirmed case of COVID-19 was reported on 26 February 2020. The country’s response was immediate, imposing a national lockdown on 23 March 2020. By that date, a total of 695 confirmed cases and 17 deaths had been recorded. On 5 May 2020, as the number of daily cases began to decline, the restrictive measures were gradually relaxed, and on 7 July 2020, flights from abroad were allowed to arrive.
Since early August 2020, the number of cases has been on an upward trend, with the country gradually entering the second wave of the pandemic. In the months of October–November, a rapid increase in cases was observed, and on 3 November 2020, a local lockdown was imposed in the Regional Unit of Thessaloniki, while four days later, on 7 November 2020, a new national lockdown was imposed. On 12 November 2020, the epidemiological curve peaked, reaching 3316 cases per day. After a gradual decrease in cases until 31 January 2021 (484 daily cases), the country entered the third wave of the pandemic in early February, and almost a month and a half later, the number of daily cases had tripled (16 March 2021: 1533 daily cases) [19].
The impacts of climate change and weather conditions on the spread of infectious diseases have been the subject of many studies [20,21]. Climate change contributes to the reduction in biodiversity, affects ecosystems, the life cycles of pathogens and vectors (insects, rodents, mammals), and their geographical distribution, and acts as a catalyst for the emergence of diseases.
For example, increasing temperatures contribute to the spread of infectious diseases (e.g., malaria, dengue fever, yellow fever, and Lyme disease) from lower to higher latitudes. On the other hand, heavy rainfall and flooding favor malaria and leptospirosis as environmental conditions (humidity, stagnant water) affect the reproduction of mosquitoes, which are the main cause of these diseases [22]. Malaria outbreaks in Asia and South America have been associated with widespread flooding [23], as has an outbreak of leptospirosis in Mumbai, India, in 2000 [24].
Furthermore, most viral respiratory diseases are characterized by seasonal behavior, such as the influenza virus, the spread of which is favored by cold and dry weather conditions [25,26] or even in temperate and tropical climates [27]. The SARS-CoV and MERS-CoV coronaviruses that emerged in 2002 and 2012, respectively, showed seasonal changes. For example, the results of the study by Tan et al. [28] showed that the increase in temperature contributed to the gradual attenuation of SARS-CoV and its complete disappearance in July 2003. Similarly, according to Chan et al. [29], weather conditions characterized by high humidity (RH) (>95%) and high temperature (e.g., 38 °C) contributed to the inactivation of SARS-CoV activity. Similarly, MERS-CoV transmissibility increased during the winter months, with a significant increase in low-temperature and -humidity conditions [30]. Weather conditions are thought to have a similar effect on the infectious behavior of SARS-CoV-2. Many studies have been conducted since the beginning of the COVID-19 pandemic to determine whether and how meteorological parameters are associated with the spread of the disease.
Moazeni et al. [31], in a literature review of studies conducted in various geographical locations (the USA, China, Pakistan, Iran, Bangladesh, Brazil, Italy, Spain, the United Kingdom), showed that temperature, among other climatic parameters (humidity, precipitation, solar radiation, and wind speed), was the most important factor influencing the COVID-19 pandemic. Conflicting conclusions emerged in this review as well, as many studies argued that hot and humid weather can reduce the spread of the disease and some others that warm climatic conditions favor the occurrence of COVID-19.
The negative association of temperature (T) and absolute humidity (AH) with the spread of the disease was supported not only by literature reviews but also by analyses conducted on a global scale, such as those by Wu et al. [32], Nottmeyer et al. [33], and Feurer et al. [34]. The study by Wu et al. [32] involving 166 countries worldwide showed that an increase in temperature T (+1 °C) was associated with a decrease in daily new cases (−3.08%) and deaths (−1.19%), while the impact of an increase in relative humidity (RH + 1%) on the spread of COVID-19 was similar (−0.85% daily new cases and −0.51% daily new deaths). Nottmeyer et al. [33], examining the association of meteorological parameters and COVID-19 cases (10.5 million) in 455 cities in 20 countries, found that low temperature (T: 7.5 °C) and low absolute humidity (AH: 6.0 g/m3) were associated with a higher risk of COVID-19 infection, while no evidence of association was found for RH. Feurer et al. [34], in their similar size analysis (96.1 million COVID-19 cases, 439 cities in 22 countries), found that low T (5 °C) and AH (5.0 g/m3) were associated with an increased risk of infection by 1.22 and 1.13, respectively. Increased risk was observed on days without precipitation, while RH and solar radiation showed no association.
A negative correlation of meteorological factors with the spread of the disease was also observed on the African continent, as shown by the study by Adekunle et al. [35] in 48 countries, where it was found that an increase in mean T (+1 °C) was associated with a decrease in COVID-19 cases (−25.44%), while an increase in mean WS by 1% was associated with an increase (+22.13%) in confirmed cases. Furthermore, due to the intense climatic variability (equatorial climate, monsoon, tropical, and subtropical) that Africa presents, the correlation (negative or positive) of meteorological variables (precipitation, temperature, humidity, and wind speed) with the spread of COVID-19 showed a strong spatial distribution in the study by Koanda et al. [36].
The heterogeneous effect of the environmental factor on the incidence of COVID-19 demonstrated the need to shift research to smaller areas, such as at the country, regional, or city level. These studies are argued to be more appropriate as the measured results contain smaller errors, while data such as high population density or human mobility can be observed and calculated with greater precision at smaller geographical scales [37]. Therefore, numerous research efforts have studied the correlation of weather to the spread of COVID-19, both at the country level and in smaller areas (regions, provinces, cities) within them.
For example, in China, Qi et al. [38] found that daily incidence decreased significantly when mean daily temperature and relative humidity increased. Similar negative associations were found in studies by Zomuanpuii et al. [39] in northeastern India and by Batool et al. [40] in Pakistan, where decreasing temperature and humidity contributed to increased COVID-19 transmission. The number of COVID-19 cases in 5 cities (Riyadh, Mecca, Jeddah, Medina, and Dammam) in Saudi Arabia increased when T, RH, and mean WS decreased [41]. Şahin et al. [42], studying the relationship between weather and the spread of the disease in 9 cities in Turkey, observed that temperature and humidity were negatively correlated with the number of COVID-19 cases, while average wind speed was strongly and positively correlated with the cumulative 14-day lag. In Hiroshima, Japan, the study by Hussain et al. [43] showed that wind speed was negatively associated with the incidence of COVID-19 and was the only one of all meteorological factors (cases, deaths, and incidence rate) that had the strongest correlation with the spread of the pandemic. A negative correlation between average wind speed and the spread of COVID-19 was also shown by the findings of the study [44] in 55 polluted cities in Italy (provincial capitals). Low-humidity conditions in the Catalonia region of Spain observed 3 to 5 days earlier were associated with an increase in infection rates several days later [45]. Similarly, in three neighboring countries (Colombia, Ecuador, and Peru) in tropical Andean South America, the presence of dry weather conditions led to an increase in SARS-CoV-2 transmissibility [46], while wind speed and temperature had a negligible effect on the spread of SAR-COV-2.
In Rio de Janeiro, Brazil, where tropical monsoon climate conditions prevail, it has been argued that high solar radiation is likely the main climatic factor suppressing the spread of COVID-19, and secondarily, temperature (maximum and average) and wind speed also showed a negative correlation [47].
Another parameter studied was the critical temperature, which led to a decrease in the exponential rate of disease transmission. At an ambient temperature of 30 °C, the basic reproduction rate (R0) was approximately 1, while it increased significantly (R0 ≅ 2.5) when the temperature reached 0 °C [48].
However, some studies have reached opposite conclusions. In Bangladesh, according to Islam et al. [49], a one-unit increase in mean temperature (MT), mean relative humidity (MRH), and rainfall in the simple lag was associated with an increase in COVID-19 cases of 26.5%, 11.39%, and 83.22%, respectively. The incidence of the disease was much higher in cumulative lags (46–54 days), as the corresponding increase in MT and AH was associated with an increase in infection rate of 77.54% and 67.77%, respectively. Similarly, positive associations were found in Southeast Asian (ASEAN) countries such as Thailand, Indonesia, and Malaysia. In Bangkok, Thailand, temperature (T), relative humidity (RH), absolute humidity (AH), and wind speed (WS) were strongly and positively associated with daily confirmed COVID-19 cases [50]. In Jakarta, Indonesia, the positive association was only for mean wind speed (WS), which was particularly strong in villages with high wind speeds, especially in coastal areas, which had previously experienced an increase in cases. Higher wind speed was associated with increased airborne virus, with individuals who did not follow health protocols bearing the greatest burden of COVID-19 [51]. Finally, in Malaysia, mean wind speed was positively associated with confirmed COVID-19 cases, while mean relative humidity and temperature (maximum, average, and minimum) were negatively associated [52].
In addition to the positive or negative impact of weather conditions on the spread of COVID-19, many studies have shown that temperature [53], humidity [54], and wind speed [39,54] have no effect on the progression of the disease.
Meteorological factors have also been associated with the severity of COVID-19 disease [55]. According to Mejdoubi et al. [56], increasing temperature led to a decrease in the severity of the disease in the Paris region, as daily ICU admissions and in-hospital deaths were strongly and negatively associated with ambient temperature (minimum, average, and maximum). In contrast, a decrease in temperature (close to 7.5 °C) and an increase in relative humidity (75%) led to an increase in admissions and deaths in French hospitals [57]. Similarly, Paireau et al. [58] found that the weekly number (R) of hospital admissions in France was lower in conditions of high temperature (22.6 °C) and high AH values (12.8 g/m3) and higher in environments of low temperature (8.1 °C) and low AH values (5.2 g/m3). In Spain, mean air temperature was inversely associated with the number of COVID-19 hospitalizations and mortality. According to Valero et al. [59], Spanish provinces with cold weather conditions (mean air temperature <10 °C) had a higher hospitalization rate and twice the mortality rate compared to provinces with warmer temperatures (>16 °C). In Dubai, the United Arab Emirates (UAE), hospitalized COVID-19 patients admitted to hospitals on days with higher temperatures, higher sunlight, and lower humidity were in more critical and severe condition, required ICU admission, and died of the disease. In contrast, those admitted to hospitals on days with lower temperatures and higher relative humidity had milder clinical outcomes, did not require ICU admission, and ultimately survived the disease [60].
Due to these conflicting results, many researchers argue that meteorological factors alone cannot reduce the spread of COVID-19 or prevent the re-emergence of new outbreaks without additional public health measures [61,62]. According to Oliveiros et al. [61], weather variables explain 18% of the variation in the disease doubling time, while the remaining 82% can be related to containment measures, general health policies, population density, transportation, or cultural aspects.
Many factors contribute to the observed heterogeneity of research results, such as geographical regions, climatic conditions, use of different methodological approaches and statistical analysis methods, the study period, different epidemiological and meteorological data, and whether or not to consider confounding factors (e.g., age, gender, mobility, population density, health policies, human behavior). The factors of heterogeneity of the research results compared in this study are presented in Tables S1 and S2 (Supplementary Materials).
The scope of the studies varies, as they refer to different regions and latitudes of the planet. For example, the global reviews by Wu et al. [32], Nottmeyer et al. [33], and the analysis by Feurer et al. [34] investigated the association of meteorological parameters with the spread of COVID-19 in 166, 20 (455 cities), and 22 (439 cities) countries, respectively. On the contrary, there are studies of smaller geographical scope, such as at the level of continents (Africa [35,36]), countries (Peru, Colombia, Ecuador [46], Bangladesh [49]), regions (Catalonia [45]), states (Malaysia [52]), provinces (China [38], Spain [59]), metropolitan areas (France [57,58]), and cities (Aizawl, N.E. India [39]; Bangkok, Thailand [50]; Jakarta, Indonesia [51]; Hiroshima, Japan [43]; 55 cities in Italy [44]; Paris, France [57]; Dubai, UAE [60]; 5 cities in Saudi Arabia [41]; 9 cities in Turkey [42].
These geographical areas are characterized by diverse climatic conditions (tropical, temperate, Mediterranean, continental), and the meteorological factors (temperature, humidity, wind, precipitation) associated with the climate of a region may also differ, affecting the spread of the pandemic on the planet in different ways.
At the outbreak of the pandemic, the highest incidence of the disease was recorded in dry temperate countries of the Northern Hemisphere (latitudes 30–50 degrees N), such as China, the United Kingdom, France, Spain, South Korea, Japan, and the USA, while in contrast, in countries near the equator and in countries of the Southern Hemisphere (Australia, Indonesia, South Africa, and South America), the incidence was much lower. At that time, the weather pattern of the Northern Hemisphere countries was characterized by a cold environment (average temperature 5–11 °C), low humidity (47–79%), and low wind movement that contributed to the rapid spread and higher severity of the disease, in contrast to the hot and humid weather conditions which prevailed in the Southern Hemisphere countries during the summer season [63].
The negative correlation of COVID-19 spread in cold and dry weather conditions could be explained by the weakening of the human immune system due to (a) the limited secretion of signal protein under low-temperature conditions, which protects the body from an increased risk of infections and (b) the reduction in the defense of the nasal airways under low-humidity conditions and their ability to remove foreign viral particles and regenerate virus-infected cells [64]. At the same time, lower winter temperatures enhance the survival of the virus in the atmosphere, as they favor the stability of its lipid envelope, thus increasing its transmissibility and the spread of COVID-19 disease. Furthermore, lower humidity favors faster evaporation of virus-infected airborne droplets, resulting in the formation of dry nuclei that have the ability to persist longer in the atmosphere and travel longer distances, thus enhancing the viability and transmissibility of SARS-CoV-2 [65]. In contrast, warm climates are argued to destabilize SARS-CoV-2 and attenuate its transmissibility [66,67], and humid climatic conditions enhance the weakened immune role of the nasal airways.
The high incidence of the disease observed in Northern Hemisphere countries at the beginning of the pandemic, in addition to cold and dry weather conditions, could also be related to the developed socioeconomic level of these regions, which implies better access to health services and greater availability of diagnostic tests for the virus [68]. Conversely, less mass diagnostic testing in many underdeveloped countries due to inadequate healthcare systems could have led to a lower number of confirmed cases and deaths, revealing a false picture of the true spread of COVID-19 [69].
Wind speed appears to play an important role in the spread of COVID-19. Researchers argue that in outdoor environments, higher wind speeds increase air circulation and contribute to the dilution and removal of infected droplets away from susceptible individuals, thereby reducing the potential for disease transmission [70]. In cities with high levels of air pollution, high wind speeds improve the dispersion and removal of particulate matter that carries various viral agents, such as SARS-CV-2, and mitigate disease transmission in the human population [71]. These claims could explain the results of studies in Italy [44] and Saudi Arabia [41]. In Southern Italy, high wind speeds in cities with low air pollution were associated with lower disease transmission, while low wind speeds in inland areas of Northern Italy with high levels of air pollution were associated with increased COVID-19 transmission. In Saudi Arabia, low wind speeds in crowded and densely populated cities such as Riyadh and Mecca enhanced disease transmission.
High rainfall increases relative humidity, which is associated with the destabilization of the coronavirus, whose survival is favored in dry and cold environments. Therefore, in countries with tropical climates and continuous rainfall, the spread of COVID-19 is much lower than in temperate countries [47]. We believe this claim justifies the reduction in the virus reproduction rate by 0.9% in tropical countries of South America (Colombia, Ecuador, and Peru) when humidity levels increased above 50% [46]. We also believe that the increase in COVID-19 transmissibility in the city of Aizawl in NE India [39] and in Pakistan [40] coincides with the onset of the winter monsoons during which temperatures drop, and rainfall is very limited, thus contributing to the reduction in atmospheric humidity, which favors the survival of the virus and justifies the increase in its infectious capacity. Another indirect effect of rainfall on the spread of COVID-19 is related to people staying at home during rainy days, which implies a reduction in social contacts and, therefore, less transmission of the disease [72].
As shown by various research studies, cold and dry weather conditions are not the only ones associated with the spread of the disease, as an increase in cases and deaths is also observed in countries with warmer and more humid climates. For example, the subtropical climate (mean temperature (MT) around 26.6 °C, mean relative humidity (MRH) 64%, and rainfall around 3 mm) in Bangladesh seems to have enhanced the spread of COVID-19, according to Islam et al. [49]. Similarly, in Southeast Asian countries (ASEAN) such as Bangkok, Thailand, Jakarta, Indonesia, and Malaysia, where tropical climatic conditions prevail, a positive correlation of meteorological parameters with the incidence of COVID-19 was found [50,51,52]. One explanation is that the increase in temperature may be associated with increased human mobility outdoors, with large-scale recreational activities increasing the population’s exposure to the virus [73]. In addition, the high urban density (e.g., Jakarta: 15.9564 inh/km2, Bangladesh: 5.758 inh/km2) and intense tourist and commercial activity (e.g., Bangkok) of some cities could have played a crucial role in the frequency of COVID-19 transmission. Densely populated areas are argued to be more affected by epidemics due to higher contact rates, increased human mobility, recreational concentrations, public transportation, and intense economic activity [74]. Another critical parameter that enhances the population density of an area and, by extension, contributes to the spread of COVID-19 in it, is the number of foreign tourists visiting it [75].
The size of the affected population is also considered to contribute to the heterogeneity of the results of research studies. This review reveals a significant variation between the various geographical areas examined, as this size ranges from 405,000 inhabitants at the city level (Aizawl N.E India) to 1.5 billion inhabitants at the continental scale (Africa).
On the other hand, the application of different models and statistical analysis methods to evaluate the impact of weather conditions on the spread of COVID-19 may contribute to the extraction of different results. Basically, the analysis methods are based on generalized additive or linear models, regression models, machine learning models and Spearman, Pearson, and Kendall statistical analyses. The models and statistical analysis methods for each research examined in this study are shown in Tables S1 and S2 (Supplementary Materials).
In addition, another important parameter is how extensive or limited the study period is, the scope of which may affect the heterogeneity of the results. The study period in the examined geographical areas varies from 1 month (Africa [35], Turkey [42], and Brazil [47]) to 2.5 years (global study [34]). Finally, a significant contribution to the extracted results of the studies is played by the different epidemiological data, the meteorological parameters examined, as well as the inclusion or not of confounding factors (e.g., demographic data, health policies, human behavior). These parameters for each research examined in this study are shown in Tables S1 and S2 (Supplementary Materials). Despite the large number of studies that have been carried out on meteorological factors that contribute to the spread of the disease, the environmental component still remains unclear.
Research-based on data on admissions to COVID-19 ICUs, which are strong and reliable indicators of the epidemiological evolution of the disease, is more limited compared to that based on numerical data on daily cases and deaths. Also, many studies do not include in their analyses the cumulative lag effect of meteorological parameters on the incidence of COVID-19. Therefore, the present study seeks to fill these gaps with the aim of enriching the existing research information on the effect of weather on the spread and severity of COVID-19.
In our study, we investigated the individual and cumulative effects of air temperature (T), relative humidity (RH), and wind speed (WS) on COVID-19 Intensive Care Unit (ICU) admissions in two Regional Units (R.U.) in Greece with similar population, namely the R.U. of the Central Sector of Athens, in Central Greece and the R.U. of Thessaloniki in Northern Greece, which are characterized by different climatic patterns, in order to examine the effect of weather on the incidence of COVID-19.

2. Materials and Methods

2.1. Study Area

The R.U. of Central Sector of Athens is based in Athens, the capital of Greece, and consists of 8 municipalities covering an area of 87.27 km2. Its population is 1,002,212 (2021 census of the Hellenic Statistical Authority), and the population density is 11.48 inhabitants/km2. According to the Köppen–Geiger climate classification, the climate of the region is classified as Csa, representative of a warm Mediterranean summer climate. Summers are usually characterized by frequent sunshine and dry conditions, with any precipitation occurring mainly as showers or thunderstorms from cumulonimbus clouds. Daytime temperatures tend to be warm, as are the nights. Although heat waves may occur, they are usually mild in coastal areas due to the moderating influence of the relatively cool seas and sea breezes. Winters are generally wet, and snowfall is short-lived, especially on south-facing slopes. Rainfall during winter is often continuous.
The R.U. of Thessaloniki, based in Thessaloniki, consists of 14 municipalities and covers an area of 3682.9 km2. Its population is 1,092,919 (2021 census of the Hellenic Statistical Authority), and the population density is 296.76 inhabitants/km2. The climate of the region is classified as BSk, which represents a cold semi-arid climate. The region is influenced by both the Mediterranean (Csa) and the humid subtropical (Cfa) climates. The presence of the Pindos Mountain range contributes significantly to the overall aridity of the region by effectively drying out the westerly winds. Winters tend to be relatively dry, with occasional morning frosts. Although snowfalls occur regularly during the winter, snow cover usually lasts only a few days. During the coldest winters, the temperature can drop as low as −10 °C [76].

2.2. Data Collection

The COVID-19 datasets used in the analysis concern daily COVID-19 ICU admissions in hospitals in the Central Region of Athens and the Thessaloniki Region, which were obtained from the National Public Health Organization. Daily average, maximum, and minimum values of air temperature, relative humidity, and wind speed were obtained from the National Meteorological Service (Hellenic station for Athens and Macedonia station for Thessaloniki).
In our study, epidemiological and meteorological data were retrieved for a period from 26 February 2020 (date of appearance of the first case in Greece) to 17 March 2021 (date of data availability). On 23 March 2020, a month after the first case was reported in the country, a general lockdown was imposed that lasted until 4 May 2020. Therefore, data from 26 February 2020 to 4 May 2020 were excluded from the research, as they related to a period when the spread of the pandemic had just begun to become apparent (26 February 2020–23 March 2020: 695 confirmed cases and 17 deaths) but also with a period (23 March 2020–4 May 2020) when there was a general lockdown in the country and the population was under house arrest. Also, data from 3 November 2020 onwards were excluded from the scope of our study, as on that date, a local lockdown was imposed in the Thessaloniki Regional Government, and on 7 November 2020, a general lockdown was imposed in the country. Our study was limited to the period from 4 May 2020 to 3 November 2020, which was characterized by the partial return to normality of human activities after the lifting of the first general lockdown, the low immunity of the human population, and the controlled start of the tourist season. The end of the study period was set on the date of imposition of a new local lockdown in the R.U. of Thessaloniki (3 November 2020), a few days before the start of the second general lockdown (7 November 2020) in Greece. In conclusion, this period was chosen to investigate the correlation of weather with the spread of COVID-19 in a population that was not under house arrest. In our study, we considered the incubation period, that is, the time from a person’s exposure to the virus to the onset of symptoms and the median time from the onset of symptoms to admission to the ICU. According to various studies, the incubation period ranges from 1 to 14 days, with most cases occurring approximately four to five days after exposure [7,11]. The median time from symptom onset to admission to a COVID-19 ICU ranges from 6 to 12 days, with a mean of 10 days [11].

2.3. Statistical Analysis

Therefore, we focused on the effects of air temperature, humidity, and wind speed on COVID-19 ICU admissions with a lag of 0 to 14 days, i.e., for a period that included the mean incubation period (4 days) and the median time from symptom onset to ICU admission (10 days). Each meteorological variable was calculated for single and cumulative lags.
We performed the statistical analysis within the period from 4 May 2020 (partial suspension of the traffic ban and opening of shopping centers and restaurants) to 3 November 2020 (imposition of a new local lockdown in Thessaloniki); Figure 1.
Therefore, in our research, the effects of weather on the spread of COVID-19 were estimated by applying the GLM with a Poisson distribution [77]. In the process of fitting the model, daily measurements of COVID-19 in the ICU were used as the dependent variable, while the aforementioned meteorological parameters were used as independent covariates.
In our study, we chose to use the GLM rather than another model, such as the Generalized Additive Model (GAM), as its use in epidemiological studies offers several advantages, particularly in terms of simplicity, interpretability, and robustness. More specifically, GLMs are simpler to specify, fit, and interpret, requiring fewer technical decisions (e.g., no need to select smoothness parameters), and the GLM coefficients have direct and easily interpretable meanings (e.g., rate ratios, odds ratios, or risk differences). In epidemiology, practitioners often need to report simple measures of association, such as relative risks or odds ratios, which are directly derived from GLMs. GAMs introduce smooth functions that can make it harder to clearly articulate the exact relationship between predictors and outcomes. GLMs are more suited for hypothesis-driven research where the primary goal is to test specific, predefined relationships (e.g., the association between exposure and outcome), and they do not rely on smoothing or regularization, which can introduce bias or overfitting when choosing smooth terms in GAMs. Further, GLMs are less prone to overfitting compared to GAMs because they rely on linear predictors, making them more robust in smaller datasets or when there are fewer events, meaning that they are less sensitive to data sparsity or variability, making them more reliable in studies with limited sample sizes or rare events. GLMs are particularly effective for isolating the effect of a primary exposure variable, which is often the focus of epidemiology.
The goodness of fit of the models was assessed through deviance residuals [77]. Single lag and cumulative lag estimates were calculated as the exponential form of the regression coefficients (i.e., exp(β) for each of the meteorological factors), which were reported as frequency rate ratios (IRRs), along with corresponding p values to show importance. The Poisson distribution was used to estimate the Incidence Rate Ratio (IRR) of COVID-19 ICU admissions according to air temperature, relative humidity, and wind speed.
In GLMs, the IRR is derived from a Poisson regression model or a negative binomial regression model when modeling count data. The formula for the IRR in this context is
IRR = eβ
β: The coefficient of the independent variable (exposure or predictor) from the regression model.
eβ: The exponentiation of β gives the IRR, which represents the relative change in the incidence rate for a one-unit increase in the predictor variable.
The dependent variable in the model is typically the count of events (e.g., new cases of a disease).
The log link function is used to model the natural logarithm of the incidence rate as a linear function of the predictors: log(λ) = β0 + β1 × 1 + β2 × 2 + …

3. Results

The strongest frequency of the IRR relative risk was estimated for individual and cumulative (in parentheses) effects of each meteorological parameter (air temperature, relative humidity, and wind speed) for both regions of the present study. Changes in IRR and statistical significance (p < 0.05) for COVID-19 ICU admissions versus delay values (single and cumulative) are shown in Figure 2 for R.U. of the Central Sector of Athens and Figure 3 for R.U. of Thessaloniki.
For the R.U. of the Central Sector of Athens, the strongest estimated IRR (p < 0.05) from the effect of air temperature was observed at lag 7 (lag11) (Figure 2a,b), and that of relative humidity was observed at lag 3 (lag13) (Figure 2c,d). A statistically significant IRR appeared only at lag 13 for the wind speed single lag effect (Figure 2e).
Specifically, each 1 unit increase in the mean daily air temperature was significantly associated with a decrease of −3.6% (−5.1%) in the daily confirmed ICU of patients with COVID-19.
RH was significantly associated with an increase of +2.6% (+4.7%) in the daily confirmed ICU stay of patients with COVID-19. WS was significantly associated with a decrease of −14.6% in the daily confirmed ICU stay of patients with COVID-19.
Regarding R.U. of Thessaloniki, the strongest estimated IRRs (p < 0.05) were observed at lag11 (lag14), lag5 (lag14), and lag7 (lag4) for the single and cumulative (in parentheses) effects of air temperature (Figure 2b, Figure 3a), relative humidity (Figure 2d, Figure 3c), and wind speed, respectively (Figure 2f, Figure 3e).
Specifically, each 1-unit increase in the mean daily air temperature was significantly associated with a decrease of −7.4% in the single lag 11 cohort and an increase of +17.6% in the cumulative lag 14 cohort of daily confirmed ICUs for COVID-19. RH was significantly associated with an increase of +6.2% (+21%) in the daily confirmed ICU stay of patients with COVID-19. WS was significantly associated with a decrease of −20.7% (−26.8%) in the daily confirmed ICU stay of patients with COVID-19.

4. Discussion

4.1. Comparison of Study Results with Another Researchs

Our findings showed that COVID-19 ICU admissions in both Regional Units decreased significantly with the increase in mean temperature (T) and wind speed (WS). In the R.U. of the Central Sector of Athens, this picture was reflected in both the single and cumulative lagged effects of these two meteorological parameters. In the R.U. of Thessaloniki, this correlation was differentiated only in terms of the cumulative lagged effect of the mean daily temperature (T), where an increase (+17.6%) in daily confirmed COVID-19 ICU admissions was observed. On the other hand, relative humidity (RH) was significantly associated with an increase in cases in both R.U., both in the single and cumulative lagged effects.
Assuming that the increase or decrease in serious epidemiological indicators of the pandemic (hospitalizations, ICU admissions, deaths) is related to the exacerbation or de-escalation of the disease, we can reach some conclusions regarding the correlation of meteorological factors in the spread of the disease as derived from the present study.
First, by comparing our study with corresponding studies that have been conducted for various regions of the planet with different climatic patterns, we could, at first glance, claim that our findings are sometimes consistent and sometimes contradict the results of these studies.
The results of our study in Athens seem to be in agreement with those of the studies by Mejdoubi et al. [56] and d’Albis et al. [57], which were conducted in hospitals in France, as well as with those of Valero et al. [59] in Spain. The negative association of temperature and humidity with hospital admissions in France found by Paireau et al. [58] is consistent with our findings regarding the effect of temperature, but not humidity, as our study showed a positive association of this meteorological parameter with daily COVID-19 ICU admissions. Our findings also completely diverge from those of the study for Dubai, the UAE, by Hachim et al. [60]. In Thessaloniki, the observed positive association of temperature in the cumulative 14-day lag with the increase in COVID-19 ICU admissions seems to coincide with the results of the study by Hachim et al. [60].
Negative associations between temperature and daily cases and deaths have been observed at the city level in several countries around the world [33,34], in China [38], in Africa [35], in Saudi Arabia [41], in Turkey [42] and in a global review of 166 countries [31]. The conclusions of these studies are consistent with our findings. On the other hand, strong positive associations between temperature and daily COVID-19 case numbers were seen in studies in Bangladesh [49] and Bangkok [50]. These findings are in stark contrast to our findings for Athens but consistent with our findings for Thessaloniki regarding the positive effect of temperature on the cumulative 14-day lag in increasing COVID-19 patient admissions to the ICU.
Regarding the effect of humidity, the results of Islam et al. [49] and Sangkham et al. [50] are fully consistent with our study, as they showed a positive significant association between humidity and daily case numbers. However, our findings are in contrast to previous studies that showed that low humidity was positively associated with SARS-CoV-2 transmission [39,41,45] and that increasing humidity led to a decrease in cases, as shown in studies in Turkey [42] and mainland China [38]. Our research is consistent with previous studies on the impact of wind, such as those conducted in Rio de Janeiro [47] and Italy [44], which showed that high wind speeds contributed to a decrease in the spread of COVID-19. On the other hand, there are studies that completely contradict our findings, as they showed that high wind speeds had a significant positive correlation with the daily number of COVID-19 cases, such as in Malaysia [52], Hiroshima, Japan [43], and Turkey [42]. Furthermore, a study in Saudi Arabia [60] revealed that low wind speed was associated with a significant increase in cases, especially in densely populated areas (Riyadh and Mecca).

4.2. Case Study and Justification of Results

The start of the study period coincided with the end of the general lockdown in Greece, and therefore, during that time period, there were few cases, deaths, or admissions to hospitals and Intensive Care Units.
The population had adapted to social distancing measures and health protocols, while commercial, business, and tourism activities gradually returned to normal under strict protocols and personal protection measures.
During the study period (4 May 2020–3 November 2020), in the Athens Central Sector, a total of 9362 COVID-19 cases, 188 deaths, and 135 admissions to ICUs were recorded, while in the Thessaloniki Central Sector, the corresponding data were 3874 cases, 65 deaths, and 37 admissions to ICUs. The spread of COVID-19 during this period follows two stages: one in which a recession of the epidemiological curve is observed and one in which a rapid deterioration of the epidemiological indicators of the pandemic is recorded (Figure 1).
1st Stage: 4 May 2020–1 August 2020
-
R.U. of the Central Sector of Athens: cases: 266, deaths: 23, and admissions to ICU: 16;
-
R.U. of Thessaloniki: cases: 99, deaths: 0, and admissions to ICU: 1.
2nd Stage 1 August 2020–3 November 2020
-
R.U. of the Central Sector of Athens: 8974 cases, 188 deaths, and 135 admissions to ICU;
-
R.U. of Thessaloniki: 3654 cases, 58 deaths, and 39 admissions to ICU.
Our research was conducted during the summer season when the climate in both P.Es is characterized by hot and dry weather conditions. Therefore, we believe that the increase in temperature contributed to the destabilization and attenuation of SARS-CoV-2 transmissibility [67,68], which justifies our finding of a negative correlation between temperature and the number of COVID-19 ICU admissions. We also hypothesize that the observed increase in wind speed in both regions, which are characterized by high levels of air pollution, could have contributed to the removal of particulate pollutants that transport SARS-CoV-2 over long distances, thus mitigating virus transmission in the human population [33,70]. On the other hand, the increase in relative humidity and its positive correlation with the number of admissions to the ICU in both regions is inconsistent with the dry weather conditions that characterize the summer climate of these regions but also with the claim that low humidity values favor the survival and spread of the virus in the atmosphere. Our finding gives another dimension to the role that this meteorological parameter can play in the transmission of the disease, and we believe that further analysis could help in the identification and better understanding of this role.
However, apart from the weather conditions that seem to be related to the spread of COVID-19 in the two P.E.s, we estimate that the rapid increase in cases, deaths, and admissions to Intensive Care Units observed from the beginning of August onwards may also be due to a series of other factors, such as the increase in human mobility outdoors during the summer season, the resumption of commercial, business, entertainment and other activities, the opening of tourism which strengthened the high population density by receiving tourist flows from abroad, the relaxation of the population from and the non-compliance with the protection measures that were meticulously observed during the quarantine.
In the period after the end of the study period, i.e., from 3 November 2020, when a local lockdown was imposed in Thessaloniki and a second national lockdown on 7 November 2020, a significant deterioration in the epidemiological indicators of the pandemic was observed with an increase in cases, deaths, and admissions to ICUs, as reflected in Figure 1. In our opinion, this rapid development is due to the start of the winter season, which led to cold and chilly weather conditions in the ICUs, the start of the second wave of the pandemic in Greece in early November, to the increased transmission observed from early August onwards which subsequently translated into an increase in admissions to ICUs and deaths, but also to the non-immunization of the population as the first vaccinations in the country began in early 2021.

4.3. Strength and Limitations

Our study has several strengths but also limitations. Its advantages are summarized as follows:
-
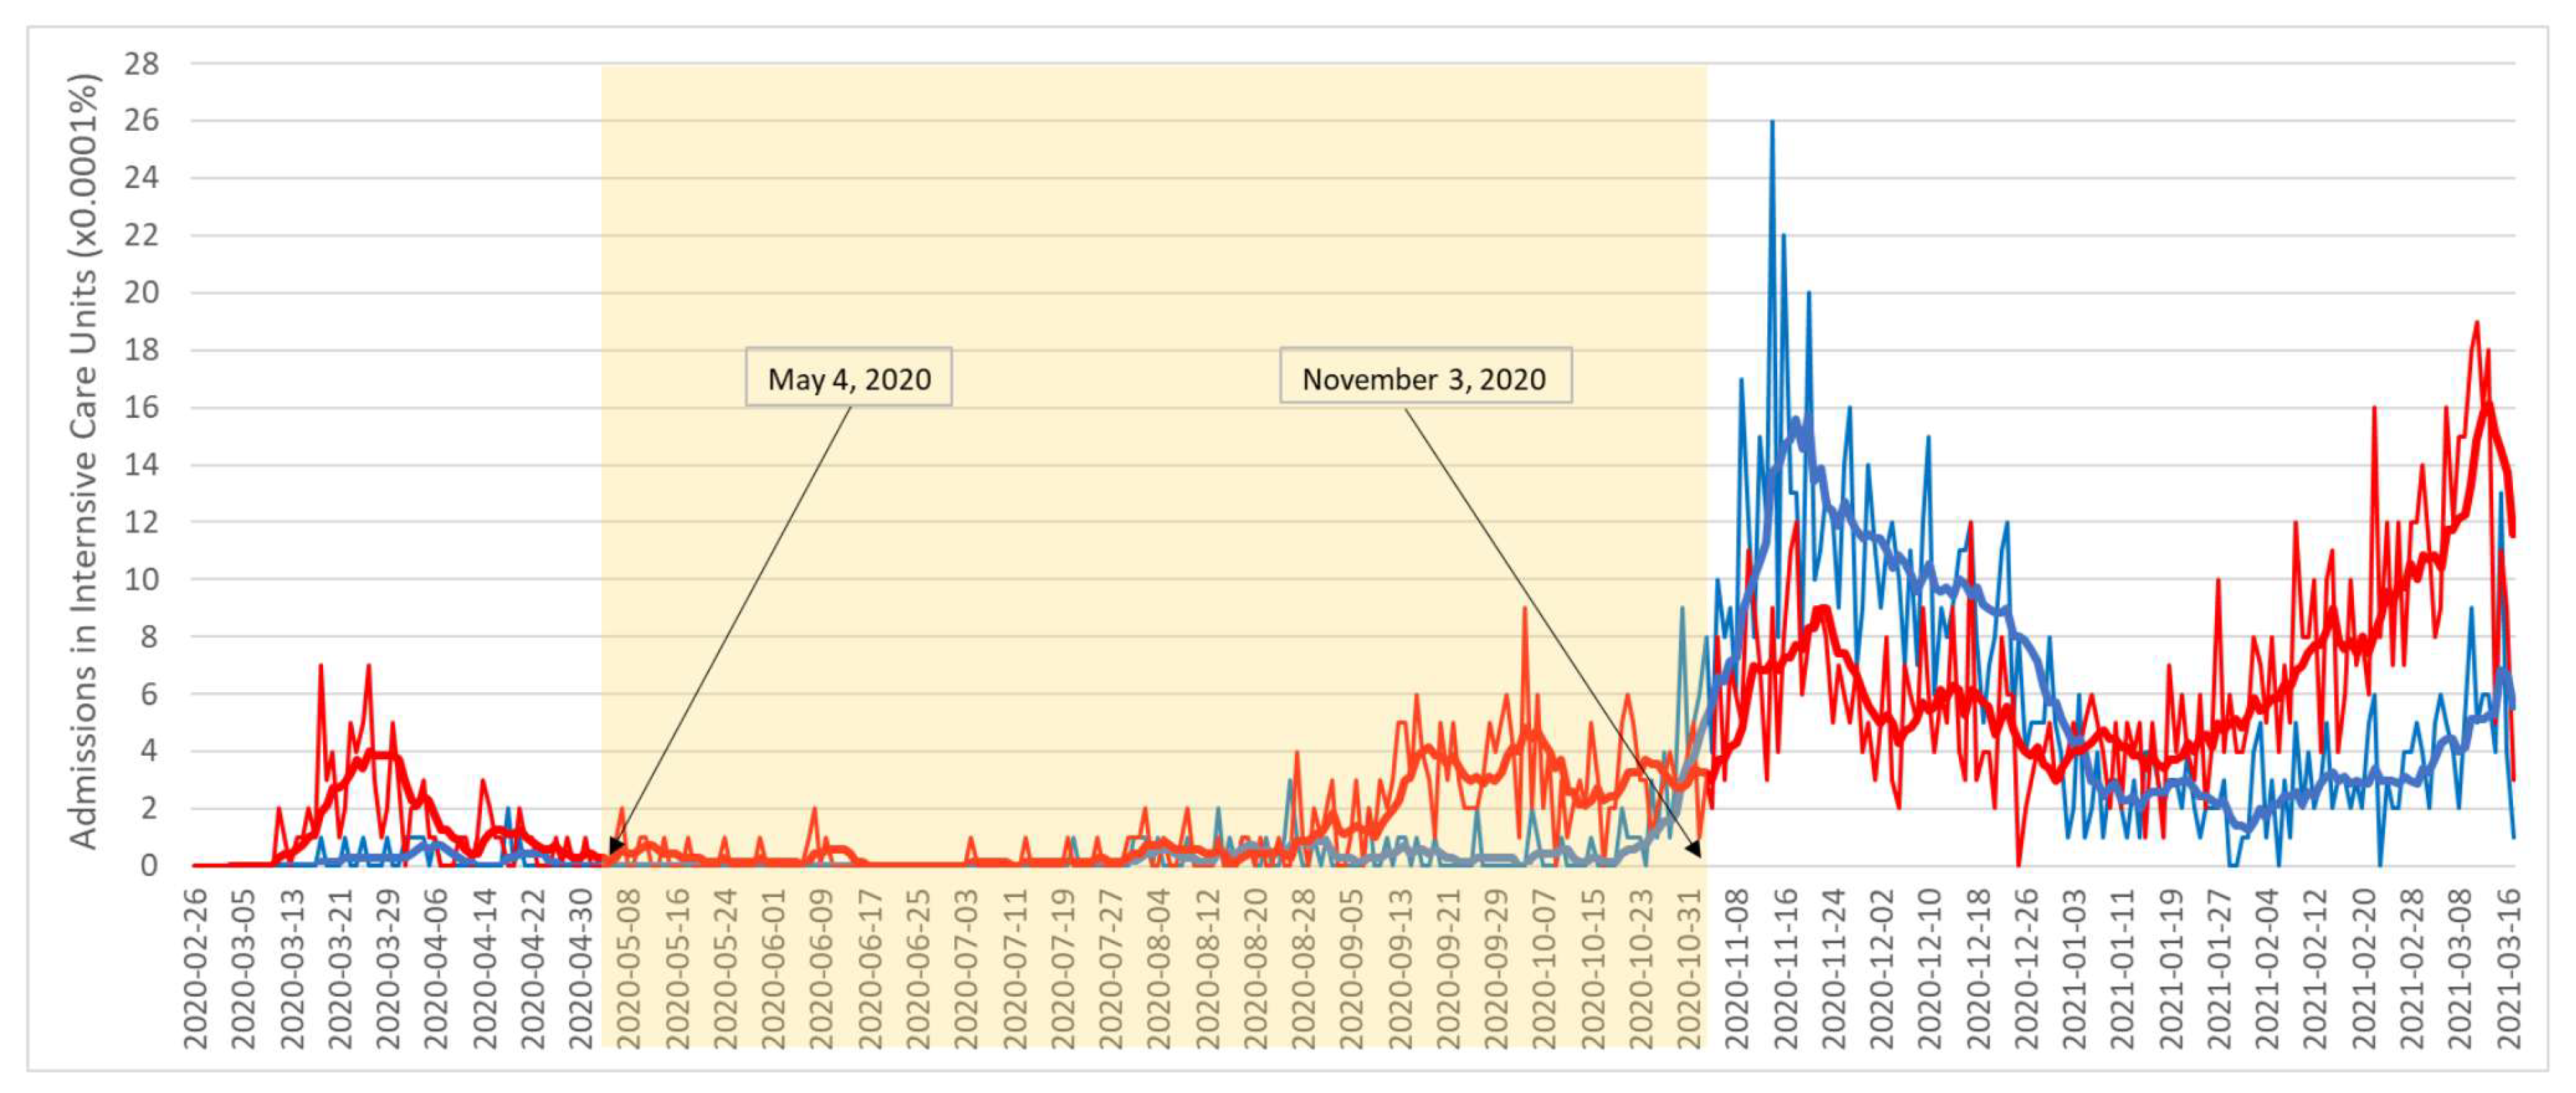
The study covered a long period of six months (4 May–3 November) and was characterized by a large seasonal range (summer–autumn) with isolated fluctuations in meteorological (temperature, humidity, wind speed) and epidemiological data (e.g., COVID-19 ICU admissions). A period when restrictive measures were gradually being lifted, the tourist season was opening in Greece, the population was mobile, and commercial and tourist activities were returning.
-
We used the number of daily COVID-19 ICU admissions, in contrast to other studies that were based on daily numbers of cases and deaths. An increase or decrease in the number of COVID-19 ICU admissions is associated with an exacerbation or de-escalation of the disease. Therefore, this number is an important indicator of the epidemiological evolution of the disease. Deaths or admissions to Intensive Care Units (ICUs) are more reliable epidemiological data to capture the true picture of the pandemic than daily cases, as the number of asymptomatic patients contributing to the transmission of the disease is difficult to identify [56].
-
The incubation period and the median time from the onset of symptoms to ICU admission were considered to study the effect of meteorological parameters up to 14 days before ICU admission for COVID-19.
Our study has the following limitations, which were not considered:
-
Age, gender, and comorbidities of individuals admitted to the ICU with COVID-19 are factors that some researchers have suggested are associated with disease severity and ICU admission [78,79].
-
Data such as length of stay, number of direct ICU admissions, and number of patients admitted to the ICU from other hospital departments (e.g., Emergency Department) or after hospitalization were unavailable.
-
Other meteorological parameters, such as air pollution, UV radiation, precipitation, and other factors, may affect SARS-CoV-2 transmission.
-
Public health policies for surveillance and containment, social isolation strategies, human behavior, such as adherence to hygiene measures, personal hygiene, use of disinfectants, resistance to the virus, mobility, and population density.

5. Conclusions

In conclusion, one could hypothesize that the cumulative IRR lag effect appears stronger than the single-lagged IRR effect for all meteorological parameters examined. Cold and humid weather for central Athens and warm and humid weather for Thessaloniki appear to be associated with increased ICU admissions for COVID-19. Another finding is the notable effect of wind on reducing ICU admissions in both cities.
However, further analysis is needed to better understand the effects of weather on the spread of COVID-19, in addition to protective measures, and for the possible future integration of meteorological parameters into surveillance and early warning systems for infectious diseases. The integration of these parameters could allow for better surveillance and prediction of the pandemic dynamics, as demonstrated in the present study by the evolution of the number of admissions to Intensive Care Units. Given the time lag of the effect of meteorological factors on COVID-19 ICU admissions, as strongly demonstrated by our findings, weather forecasting would serve to predict future disease outbreaks as well as the potential pressure on the health system on ICU beds two to three weeks in advance.
This system can be operated and updated daily using temperature, humidity, wind, and precipitation forecasts provided by the National Meteorological Service of Greece. Monitoring weather patterns related to COVID-19 transmission could help to initiate public health interventions and allocate resources more efficiently, as well as inform the population about preventive measures, such as during periods of cold and dry weather.
Global warming and changing weather patterns have led to an increase in the spread of climate-sensitive diseases (e.g., malaria, dengue fever, Zika virus) in many parts of the world. This trend is expected to continue to worsen in the coming decades as global warming continues at a rapid pace.
Research into the relationship between weather and the emergence and spread of infectious diseases, such as COVID-19, is an important factor in the effort to predict and mitigate risks to human health. Therefore, we hope that this study contributes to the global research effort by enhancing knowledge of the role of weather in the impact of COVID-19.

Supplementary Materials

The following supporting information can be downloaded at: https://www.mdpi.com/article/10.3390/geographies5010005/s1, Table S1: Global bibliographic Reports and analyses; Table S2: Spatial Studies.

Author Contributions

Conceptualization, D.D.T. and P.T.N.; writing—review and editing, D.D.T. and P.T.N.; material preparation and data collection, D.D.T., D.N.P. and A.D.S.; analysis and research, P.T.N. All authors have read and agreed to the published version of the manuscript.

Funding

This research received no external funding.

Data Availability Statement

The meteorological/climatic data used in the study are available upon request from the Hellenic National Meteorological Service www.emy.gr (accessed on 17 March 2021). The COVID-19 data used in the study are available upon request from the National Public Health Organization https://eody.gov.gr/ (accessed on 17 March 2021).

Acknowledgments

We especially thank the National Public Health Organization and the Hellenic National Meteorological Service for their important contributions to this research.

Conflicts of Interest

The authors declare no conflicts of interest.

References

  1. Carfì, A.; Bernabei, R.; Landi, F.; for the Gemelli Against COVID-19 Post-Acute Care Study Group. Persistent Symptoms in Patients After Acute COVID-19. JAMA 2020, 324, 603. [Google Scholar] [CrossRef] [PubMed]
  2. del Rio, C.; Collins, L.F.; Malani, P. Long-Term Health Consequences of COVID-19. JAMA 2020, 324, 1723. [Google Scholar] [CrossRef] [PubMed]
  3. Hu, B.; Guo, H.; Zhou, P.; Shi, Z.-L. Characteristics of SARS-CoV-2 and COVID-19. Nat. Rev. Microbiol. 2021, 19, 141–154. [Google Scholar] [CrossRef] [PubMed]
  4. Haider, N.; Rothman-Ostrow, P.; Osman, A.Y.; Arruda, L.B.; Macfarlane-Berry, L.; Elton, L.; Thomason, M.J.; Yeboah-Manu, D.; Ansumana, R.; Kapata, N.; et al. COVID-19—Zoonosis or Emerging Infectious Disease? Front. Public Health 2020, 8, 596944. [Google Scholar] [CrossRef] [PubMed]
  5. Dhand, R.; Li, J. Coughs and Sneezes: Their Role in Transmission of Respiratory Viral Infections, Including SARS-CoV-2. Am. J. Respir. Crit. Care Med. 2020, 202, 651–659. [Google Scholar] [CrossRef] [PubMed]
  6. van Doremalen, N.; Bushmaker, T.; Morris, D.H.; Holbrook, M.G.; Gamble, A.; Williamson, B.N.; Tamin, A.; Harcourt, J.L.; Thornburg, N.J.; Gerber, S.I.; et al. Aerosol and Surface Stability of SARS-CoV-2 as Compared with SARS-CoV-1. N. Engl. J. Med. 2020, 382, 1564–1567. [Google Scholar] [CrossRef]
  7. WHO Coronavirus Disease (COVID-19). How Long Does It Take to Develop Symptoms? Updated 13 May 2021. Available online: https://www.who.int/emergencies/diseases/novel-coronavirus-2019/question-and-answers-hub/q-a-detail/coronavirus-disease-covid-19 (accessed on 12 May 2021).
  8. Mousavizadeh, L.; Ghasemi, S. Genotype and Phenotype of COVID-19: Their Roles in Pathogenesis. J. Microbiol. Immunol. Infect. 2021, 54, 159–163. [Google Scholar] [CrossRef] [PubMed]
  9. Docea, A.; Tsatsakis, A.; Albulescu, D.; Cristea, O.; Zlatian, O.; Vinceti, M.; Moschos, S.; Tsoukalas, D.; Goumenou, M.; Drakoulis, N.; et al. A New Threat from an Old Enemy: Re-emergence of Coronavirus (Review). Int. J. Mol. Med. 2020, 45, 1631–1643. [Google Scholar] [CrossRef]
  10. Chen, N.; Zhou, M.; Dong, X.; Qu, J.; Gong, F.; Han, Y.; Qiu, Y.; Wang, J.; Liu, Y.; Wei, Y.; et al. Epidemiological and Clinical Characteristics of 99 Cases of 2019 Novel Coronavirus Pneumonia in Wuhan, China: A Descriptive Study. Lancet 2020, 395, 507–513. [Google Scholar] [CrossRef]
  11. Guan, W.; Ni, Z.; Hu, Y.; Liang, W.; Ou, C.; He, J.; Liu, L.; Shan, H.; Lei, C.; Hui, D.S.C.; et al. Clinical Characteristics of Coronavirus Disease 2019 in China. N. Engl. J. Med. 2020, 382, 1708–1720. [Google Scholar] [CrossRef]
  12. Huang, C.; Wang, Y.; Li, X.; Ren, L.; Zhao, J.; Hu, Y.; Zhang, L.; Fan, G.; Xu, J.; Gu, X.; et al. Clinical Features of Patients Infected with 2019 Novel Coronavirus in Wuhan, China. Lancet 2020, 395, 497–506. [Google Scholar] [CrossRef]
  13. Wang, D.; Hu, B.; Hu, C.; Zhu, F.; Liu, X.; Zhang, J.; Wang, B.; Xiang, H.; Cheng, Z.; Xiong, Y.; et al. Clinical Characteristics of 138 Hospitalized Patients With 2019 Novel Coronavirus–Infected Pneumonia in Wuhan, China. JAMA 2020, 323, 1061. [Google Scholar] [CrossRef] [PubMed]
  14. Datta, S.D.; Talwar, A.; Lee, J.T. A Proposed Framework and Timeline of the Spectrum of Disease Due to SARS-CoV-2 Infection: Illness Beyond Acute Infection and Public Health Implications. JAMA 2020, 324, 2251. [Google Scholar] [CrossRef]
  15. Beyer, D.K.; Forero, A. Mechanisms of Antiviral Immune Evasion of SARS-CoV-2. J. Mol. Biol. 2022, 434, 167265. [Google Scholar] [CrossRef]
  16. Escalera, A.; Gonzalez-Reiche, A.S.; Aslam, S.; Mena, I.; Laporte, M.; Pearl, R.L.; Fossati, A.; Rathnasinghe, R.; Alshammary, H.; Van De Guchte, A.; et al. Mutations in SARS-CoV-2 Variants of Concern Link to Increased Spike Cleavage and Virus Transmission. Cell Host Microbe 2022, 30, 373–387.e7. [Google Scholar] [CrossRef] [PubMed]
  17. Kumar, S.; Thambiraja, T.S.; Karuppanan, K.; Subramaniam, G. Omicron and Delta Variant of SARS-CoV-2: A Comparative Computational Study of Spike Protein. J. Med. Virol. 2022, 94, 1641–1649. [Google Scholar] [CrossRef]
  18. Mecenas, P.; Bastos, R.T.D.R.M.; Vallinoto, A.C.R.; Normando, D. Effects of Temperature and Humidity on the Spread of COVID-19: A Systematic Review. PLoS ONE 2020, 15, e0238339. [Google Scholar] [CrossRef]
  19. EODY. Daily Report of Epidemiological Surveillance of New Coronavirus Infection (COVID-19). Available online: https://eody.gov.gr/wp-content/uploads/2021/03/covid-gr-daily-report-20210316.pdf (accessed on 16 March 2021).
  20. Anwar, A.; Anwar, S.; Ayub, M.; Nawaz, F.; Hyder, S.; Khan, N.; Malik, I. Climate Change and Infectious Diseases: Evidence from Highly Vulnerable Countries. Iran. J. Public Health 2019, 48, 2187–2195. [Google Scholar] [CrossRef] [PubMed]
  21. Bezirtzoglou, C.; Dekas, K.; Charvalos, E. Climate Changes, Environment and Infection: Facts, Scenarios and Growing Awareness from the Public Health Community within Europe. Anaerobe 2011, 17, 337–340. [Google Scholar] [CrossRef] [PubMed]
  22. Harvell, C.D.; Mitchell, C.E.; Ward, J.R.; Altizer, S.; Dobson, A.P.; Ostfeld, R.S.; Samuel, M.D. Climate Warming and Disease Risks for Terrestrial and Marine Biota. Science 2002, 296, 2158–2162. [Google Scholar] [CrossRef] [PubMed]
  23. Kovats, R.S.; Bouma, M.J.; Hajat, S.; Worrall, E.; Haines, A. El Niño and Health. Lancet 2003, 362, 1481–1489. [Google Scholar] [CrossRef] [PubMed]
  24. Karande, S. An Observational Study to Detect Leptospirosis in Mumbai, India, 2000. Arch. Dis. Child 2003, 88, 1070–1075. [Google Scholar] [CrossRef] [PubMed]
  25. Lowen, A.C.; Mubareka, S.; Steel, J.; Palese, P. Influenza Virus Transmission Is Dependent on Relative Humidity and Temperature. PLoS Pathog. 2007, 3, e151. [Google Scholar] [CrossRef] [PubMed]
  26. Shaman, J.; Kohn, M. Absolute Humidity Modulates Influenza Survival, Transmission, and Seasonality. Proc. Natl. Acad. Sci. USA 2009, 106, 3243–3248. [Google Scholar] [CrossRef] [PubMed]
  27. Tamerius, J.D.; Shaman, J.; Alonso, W.J.; Bloom-Feshbach, K.; Uejio, C.K.; Comrie, A.; Viboud, C. Environmental Predictors of Seasonal Influenza Epidemics across Temperate and Tropical Climates. PLoS Pathog. 2013, 9, e1003194. [Google Scholar] [CrossRef]
  28. Tan, J.; Mu, L.; Huang, J.; Yu, S.; Chen, B.; Yin, J. An Initial Investigation of the Association between the SARS Outbreak and Weather: With the View of the Environmental Temperature and Its Variation. J. Epidemiol. Community Health 2005, 59, 186–192. [Google Scholar] [CrossRef] [PubMed]
  29. Chan, K.H.; Peiris, J.S.M.; Lam, S.Y.; Poon, L.L.M.; Yuen, K.Y.; Seto, W.H. The Effects of Temperature and Relative Humidity on the Viability of the SARS Coronavirus. Adv. Virol. 2011, 2011, 1–7. [Google Scholar] [CrossRef] [PubMed]
  30. Gardner, E.G.; Kelton, D.; Poljak, Z.; Van Kerkhove, M.; von Dobschuetz, S.; Greer, A.L. A Case-Crossover Analysis of the Impact of Weather on Primary Cases of Middle East Respiratory Syndrome. BMC Infect. Dis. 2019, 19, 113. [Google Scholar] [CrossRef] [PubMed]
  31. Moazeni, M.; Rahimi, M.; Ebrahimi, A. What Are the Effects of Climate Variables on COVID-19 Pandemic? A Systematic Review and Current Update. Adv. Biomed. Res. 2023, 12, 33. [Google Scholar] [CrossRef] [PubMed]
  32. Wu, Y.; Jing, W.; Liu, J.; Ma, Q.; Yuan, J.; Wang, Y.; Du, M.; Liu, M. Effects of Temperature and Humidity on the Daily New Cases and New Deaths of COVID-19 in 166 Countries. Sci. Total Environ. 2020, 729, 139051. [Google Scholar] [CrossRef]
  33. Nottmeyer, L.; Armstrong, B.; Lowe, R.; Abbott, S.; Meakin, S.; O’Reilly, K.M.; Von Borries, R.; Schneider, R.; Royé, D.; Hashizume, M.; et al. The Association of COVID-19 Incidence with Temperature, Humidity, and UV Radiation—A Global Multi-City Analysis. Sci. Total Environ. 2023, 854, 158636. [Google Scholar] [CrossRef]
  34. Feurer, D.; Riffe, T.; Kniffka, M.S.; Acosta, E.; Armstrong, B.; Mistry, M.; Lowe, R.; Royé, D.; Hashizume, M.; Madaniyazi, L.; et al. Meteorological Factors, Population Immunity, and COVID-19 Incidence: A Global Multi-City Analysis. Environ. Epidemiol. 2024, 8, e338. [Google Scholar] [CrossRef] [PubMed]
  35. Adekunle, I.A.; Tella, S.A.; Oyesiku, K.O.; Oseni, I.O. Spatio-Temporal Analysis of Meteorological Factors in Abating the Spread of COVID-19 in Africa. Heliyon 2020, 6, e04749. [Google Scholar] [CrossRef] [PubMed]
  36. Koanda, O.; Yonaba, R.; Tazen, F.; Karoui, H.; Sidibé, M.L.; Lèye, B.; Diop, M.; Andrianisa, H.A.; Karambiri, H. Climate and COVID-19 Transmission: A Cross-Sectional Study in Africa. Sci. Rep. 2023, 13, 18702. [Google Scholar] [CrossRef] [PubMed]
  37. Bhaskaran, K.; Gasparrini, A.; Hajat, S.; Smeeth, L.; Armstrong, B. Time series regression studies in environmental epidemiology. Int. J. Epidemiol. 2013, 42, 1187–1195. [Google Scholar] [CrossRef] [PubMed]
  38. Qi, H.; Xiao, S.; Shi, R.; Ward, M.P.; Chen, Y.; Tu, W.; Su, Q.; Wang, W.; Wang, X.; Zhang, Z. COVID-19 Transmission in Mainland China Is Associated with Temperature and Humidity: A Time-Series Analysis. Sci. Total Environ. 2020, 728, 138778. [Google Scholar] [CrossRef]
  39. Zomuanpuii, R.; Lalrohlua, P.C.; Lalbiakmawia, B.; Chawngthu, Z.; Hmar, L.; Roy, S.; Laldinmawii, G.; Zohmingthanga, J.; Kumar, N.S.; Zothanzama, J.; et al. Meteorological Impact on the Incidence of COVID-19 and SARS-CoV-2 Variants in Mizoram, Northeast India. Environ. Sustain. 2023, 6, 455–464. [Google Scholar] [CrossRef]
  40. Batool, H.; Tian, L. Correlation Determination between COVID-19 and Weather Parameters Using Time Series Forecasting: A Case Study in Pakistan. Math. Probl. Eng. 2021, 2021, 1–9. [Google Scholar] [CrossRef]
  41. Alkhowailed, M.; Shariq, A.; Alqossayir, F.; Alzahrani, O.A.; Rasheed, Z.; Al Abdulmonem, W. Impact of Meteorological Parameters on COVID-19 Pandemic: A Comprehensive Study from Saudi Arabia. Inform. Med. Unlocked 2020, 20, 100418. [Google Scholar] [CrossRef] [PubMed]
  42. Şahin, M. Impact of Weather on COVID-19 Pandemic in Turkey. Sci. Total Environ. 2020, 728, 138810. [Google Scholar] [CrossRef]
  43. Hussain, M.R.A.; Shaba, S.S.E.; Bunthen, E.; Eity, K.F.; Roshid, M.M.; Kuddus, M.A. The Dynamics of COVID-19 in Hiroshima Prefecture Compared to Japan and Its Association With Meteorological Factors: A Comparative Analysis. Cureus 2024, 16, e57708. [Google Scholar] [CrossRef]
  44. Coccia, M. How do low wind speeds and high levels of air pollution support the spread of COVID-19? Atmos. Pollut. Res. 2021, 12, 437–445. [Google Scholar] [CrossRef] [PubMed]
  45. Planella-Morató, J.; Pelegrí, J.L.; Martín-Rey, M.; Olivé Abelló, A.; Vallès, X.; Roca, J.; Rodrigo, C.; Estrada, O.; Vallès-Casanova, I. Environmental Predictors of SARS-CoV-2 Infection Incidence in Catalonia (Northwestern Mediterranean). Front. Public Health 2024, 12, 1430902. [Google Scholar] [CrossRef]
  46. Colston, J.M.; Hinson, P.; Nguyen, N.-L.H.; Chen, Y.T.; Badr, H.S.; Kerr, G.H.; Gardner, L.M.; Martin, D.N.; Quispe, A.M.; Schiaffino, F.; et al. Effects of Hydrometeorological and Other Factors on SARS-CoV-2 Reproduction Number in Three Contiguous Countries of Tropical Andean South America: A Spatiotemporally Disaggregated Time Series Analysis. IJID Reg. 2023, 6, 29–41. [Google Scholar] [CrossRef]
  47. Rosario, D.K.A.; Mutz, Y.S.; Bernardes, P.C.; Conte-Junior, C.A. Relationship between COVID-19 and Weather: Case Study in a Tropical Country. Int. J. Hyg. Environ. Health 2020, 229, 113587. [Google Scholar] [CrossRef] [PubMed]
  48. Livadiotis, G. Statistical Analysis of the Impact of Environmental Temperature on the Exponential Growth Rate of Cases Infected by COVID-19. PLoS ONE 2020, 15, e0233875. [Google Scholar] [CrossRef] [PubMed]
  49. Islam, A.R.M.T.; Hasanuzzaman, M.; Shammi, M.; Salam, R.; Bodrud-Doza, M.; Rahman, M.M.; Mannan, M.A.; Huq, S. Are Meteorological Factors Enhancing COVID-19 Transmission in Bangladesh? Novel Findings from a Compound Poisson Generalized Linear Modeling Approach. Environ. Sci. Pollut. Res. 2021, 28, 11245–11258. [Google Scholar] [CrossRef] [PubMed]
  50. Sangkham, S.; Thongtip, S.; Vongruang, P. Influence of Air Pollution and Meteorological Factors on the Spread of COVID-19 in the Bangkok Metropolitan Region and Air Quality during the Outbreak. Environ. Res. 2021, 197, 111104. [Google Scholar] [CrossRef]
  51. Susanna, D.; Saputra, Y.A.; Poddar, S. Analysis of the Effect of Wind Speed in Increasing the COVID-19 Cases in Jakarta. F1000Res 2023, 12, 145. [Google Scholar] [CrossRef]
  52. Ng, K.Y.; Hasan, M.Z.; Rahman, A. Examining the Roles of Meteorological Variables in COVID-19 Spread in Malaysia. Aerobiologia 2024, 40, 129–144. [Google Scholar] [CrossRef]
  53. Haq, F.U.; Abduljaleel, Y.; Ahmad, I. Effect of Temperature on Fast Transmission of COVID-19 in Low per Capita GDP Asian Countries. Sci. Rep. 2023, 13, 21165. [Google Scholar] [CrossRef]
  54. Maleki, A.; Aboubakri, O.; Rezaee, R.; Alahmad, B.; Sera, F. Seasonal Variation of COVID-19 Incidence and Role of Land Surface and Air Temperatures: A Case Study in the West of Iran. Int. J. Environ. Health Res. 2024, 34, 1342–1354. [Google Scholar] [CrossRef] [PubMed]
  55. Asem, N.; Ramadan, A.; Hassany, M.; Ghazy, R.M.; Abdallah, M.; Ibrahim, M.; Gamal, E.M.; Hassan, S.; Kamal, N.; Zaid, H. Pattern and Determinants of COVID-19 Infection and Mortality across Countries: An Ecological Study. Heliyon 2021, 7, e07504. [Google Scholar] [CrossRef] [PubMed]
  56. Mejdoubi, M.; Kyndt, X.; Djennaoui, M. ICU Admissions and In-Hospital Deaths Linked to COVID-19 in the Paris Region Are Correlated with Previously Observed Ambient Temperature. PLoS ONE 2020, 15, e0242268. [Google Scholar] [CrossRef]
  57. d’Albis, H.; Coulibaly, D.; Roumagnac, A.; de Carvalho Filho, E.; Bertrand, R. Quantification of the Effects of Climatic Conditions on French Hospital Admissions and Deaths Induced by SARS-CoV-2. Sci. Rep. 2021, 11, 21812. [Google Scholar] [CrossRef]
  58. Paireau, J.; Charpignon, M.-L.; Larrieu, S.; Calba, C.; Hozé, N.; Boëlle, P.-Y.; Thiebaut, R.; Prague, M.; Cauchemez, S. Impact of Non-Pharmaceutical Interventions, Weather, Vaccination, and Variants on COVID-19 Transmission across Departments in France. BMC Infect. Dis. 2023, 23, 190. [Google Scholar] [CrossRef] [PubMed]
  59. Valero, C.; Barba, R.; Riancho, J.A.; Santurtún, A. Influence of Meteorological Factors on the Severity of COVID-19 in Spain: Observational Ecological Study. Med. Clin. 2023, 160, 327–332. [Google Scholar] [CrossRef]
  60. Hachim, M.Y.; Hachim, I.Y.; Naeem, K.; Hannawi, H.; Al Salmi, I.; Hannawi, S. Higher Temperatures, Higher Solar Radiation, and Less Humidity Is Associated with Poor Clinical and Laboratory Outcomes in COVID-19 Patients. Front. Public Health 2021, 9, 618828. [Google Scholar] [CrossRef] [PubMed]
  61. Oliveiros, B.; Caramelo, L.; Ferreira, N.C.; Caramelo, F. Role of Temperature and Humidity in the Modulation of the Doubling Time of Covid-19 Cases. JBGSR 2021, 6. [Google Scholar] [CrossRef]
  62. Paraskevis, D.; Kostaki, E.G.; Alygizakis, N.; Thomaidis, N.S.; Cartalis, C.; Tsiodras, S.; Dimopoulos, M.A. A Review of the Impact of Weather and Climate Variables to COVID-19: In the Absence of Public Health Measures High Temperatures Cannot Probably Mitigate Outbreaks. Sci. Total Environ. 2021, 768, 144578. [Google Scholar] [CrossRef] [PubMed]
  63. Menhat, M.; Ariffin, E.H.; Dong, W.S.; Zakaria, J.; Ismailluddin, A.; Shafril, H.A.M.; Muhammad, M.; Othman, A.R.; Kanesan, T.; Ramli, S.P.; et al. Rain, Rain, Go Away, Come Again Another Day: Do Climate Variations Enhance the Spread of COVID-19? Glob. Health 2024, 20, 43. [Google Scholar] [CrossRef]
  64. Sun, Z.; Thilakavathy, K.; Kumar, S.S.; He, G.; Liu, S.V. Potential Factors Influencing Repeated SARS Outbreaks in China. Int. J. Environ. Res. Public Health 2020, 17, 1633. [Google Scholar] [CrossRef]
  65. Aboubakr, H.A.; Sharafeldin, T.A.; Goyal, S.M. Stability of SARS-CoV-2 and other coronaviruses in the environment and on common touch surfaces and the influence of climatic conditions: A review. Transbounding Emerg. Dis. 2021, 68, 296–312. [Google Scholar] [CrossRef]
  66. De Ángel Solá, D.E.; Wang, L.; Vázquez, M.; Méndez-Lázaro, P.A. Weathering the pandemic: How the Caribbean Basin can use viral and environmental patterns to predict, prepare, and respond to COVID-19. J. Med. Virol. 2020, 92, 1460–1468. [Google Scholar] [CrossRef]
  67. Moriyama, M.; Hugentobler, W.J.; Iwasaki, A. Seasonality of Respiratory Viral Infections. Annu. Rev. Virol. 2020, 7, 83–101. [Google Scholar] [CrossRef]
  68. Ahmadi, M.; Sharifi, A.; Dorosti, S.; Jafarzadeh Ghoushchi, S.; Ghanbari, N. Investigation of effective climatology parameters on COVID-19 outbreak in Iran. Sci. Total Environ. 2020, 729, 138705. [Google Scholar] [CrossRef]
  69. Kaye, A.D.; Okeagu, C.N.; Pham, A.D.; Silva, R.A.; Hurley, J.J.; Arron, B.L.; Sarfraz, N.; Lee, H.N.; Ghali, G.E.; Gamble, J.W.; et al. Economic impact of COVID-19 pandemic on healthcare facilities and systems: International perspectives. Best. Pract. Res. Clin. Anaesthesiol. 2021, 35, 293–306. [Google Scholar] [CrossRef] [PubMed]
  70. Clouston, S.A.P.; Morozova, O.; Meliker, J.R. A wind speed threshold for increased outdoor transmission of coronavirus: An ecological study. BMC Infect. Dis. 2021, 21, 1194. [Google Scholar] [CrossRef] [PubMed]
  71. Coccia, M. Factors determining the diffusion of COVID-19 and suggested strategy to prevent future accelerated viral infectivity similar to COVID. Sci. Total Environ. 2020, 729, 138474. [Google Scholar] [CrossRef]
  72. Menebo, M.M. Temperature and precipitation associate with COVID-19 new daily cases: A correlation study between weather and COVID-19 pandemic in Oslo, Norway. Sci. Total Environ. 2020, 737, 139659. [Google Scholar] [CrossRef]
  73. Vandelli, V.; Palandri, L.; Coratza, P.; Rizzi, C.; Ghinoi, A.; Righi, E.; Soldati, M. Conditioning factors in the spreading of COVID-19—Does geography matter? Heliyon 2024, 10, e25810. [Google Scholar] [CrossRef] [PubMed]
  74. Smith, T.P.; Flaxman, S.; Gallinat, A.S.; Kinosian, S.P.; Stemkovski, M.; Unwin, H.J.T.; Watson, O.J.; Whittaker, C.; Cattarino, L.; Dorigatti, I.; et al. Temperature and population density influence SARS-CoV-2 transmission in the absence of nonpharmaceutical interventions. Proc. Natl. Acad. Sci. USA 2021, 118, e2019284118. [Google Scholar] [CrossRef] [PubMed]
  75. Tantrakarnapa, K.; Bhopdhornangkul, B.; Nakhaapakorn, K. Influencing factors of COVID-19 spreading: A case study of Thailand. J. Public Health 2022, 30, 621–627. [Google Scholar] [CrossRef] [PubMed]
  76. Hellenic National Meteorological Service Climatic Data by City. Available online: www.emy.gr (accessed on 4 March 2021).
  77. McCullagh, P.; Nelder, J.A. Generalized Linear Models, 2nd ed.; Routledge: London, UK, 2019; ISBN 978-0-203-75373-6. [Google Scholar]
  78. Cardoso, F.S.; Papoila, A.L.; Machado, R.S.; Fidalgo, P. Age, Sex, and Comorbidities Predict ICU Admission or Mortality in Cases with SARS-CoV2 Infection: A Population-Based Cohort Study. Crit. Care 2020, 24, 465. [Google Scholar] [CrossRef]
  79. Rainer, L.; Bachner, F.; Eglau, K.; Ostermann, H.; Siebert, U.; Zuba, M. Comorbidities and COVID-19 Hospitalization, ICU Admission and Hospital Mortality in Austria: A Retrospective Cohort Study. Wien. Klin. Wochenschr. 2022, 134, 856–867. [Google Scholar] [CrossRef] [PubMed]
Figure 1. Time series of COVID-19 admissions (% over 106 population) in Intensive Care Units (ICUs) for the R.U. of the Central Sector of Athens (red curve) and R.U. of Thessaloniki (blue curve), from 26 February 2020 to 16 March 2021. The frame indicates the period used in the study.
Geographies 05 00005 g001
Figure 2. Single lag effect [left graphs (a,c,e)] and cumulative lag effect [right graphs (b,d,f)] of IRR for air temperature (upper), relative humidity (middle), and wind speed (lower) on the COVID-19 ICU, for Regional Unit of the Central Sector of Athens. Highlighted bars (green for negative and yellow for positive correlations) indicate statistical significance at p < 0.05.
Geographies 05 00005 g002
Figure 3. Single lag effect [left graphs (a,c,e)] and cumulative lag effect [right graphs (b,d,f)] of IRR for air temperature (upper), relative humidity (middle), and wind speed (below) on COVID-19 ICU, for R.U. of Thessaloniki. Highlighted bars (green for negative and yellow for positive correlations) indicate statistical significance at p < 0.05.
Geographies 05 00005 g003
Disclaimer/Publisher’s Note: The statements, opinions and data contained in all publications are solely those of the individual author(s) and contributor(s) and not of MDPI and/or the editor(s). MDPI and/or the editor(s) disclaim responsibility for any injury to people or property resulting from any ideas, methods, instructions or products referred to in the content.

