
Trihalomethane Formation from Soil-Derived Dissolved Organic Matter During Chlorination and Chloramination: A Case Study in Cedar Lake, Illinois


Abstract
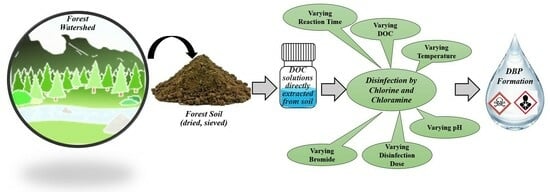
1. Introduction
2. Materials and Methods
2.1. Study Area
2.2. Soil Sample Preparation
2.3. Water Quality Parameters
2.4. Disinfection Process
2.5. THM Analysis
3. Results and Discussion
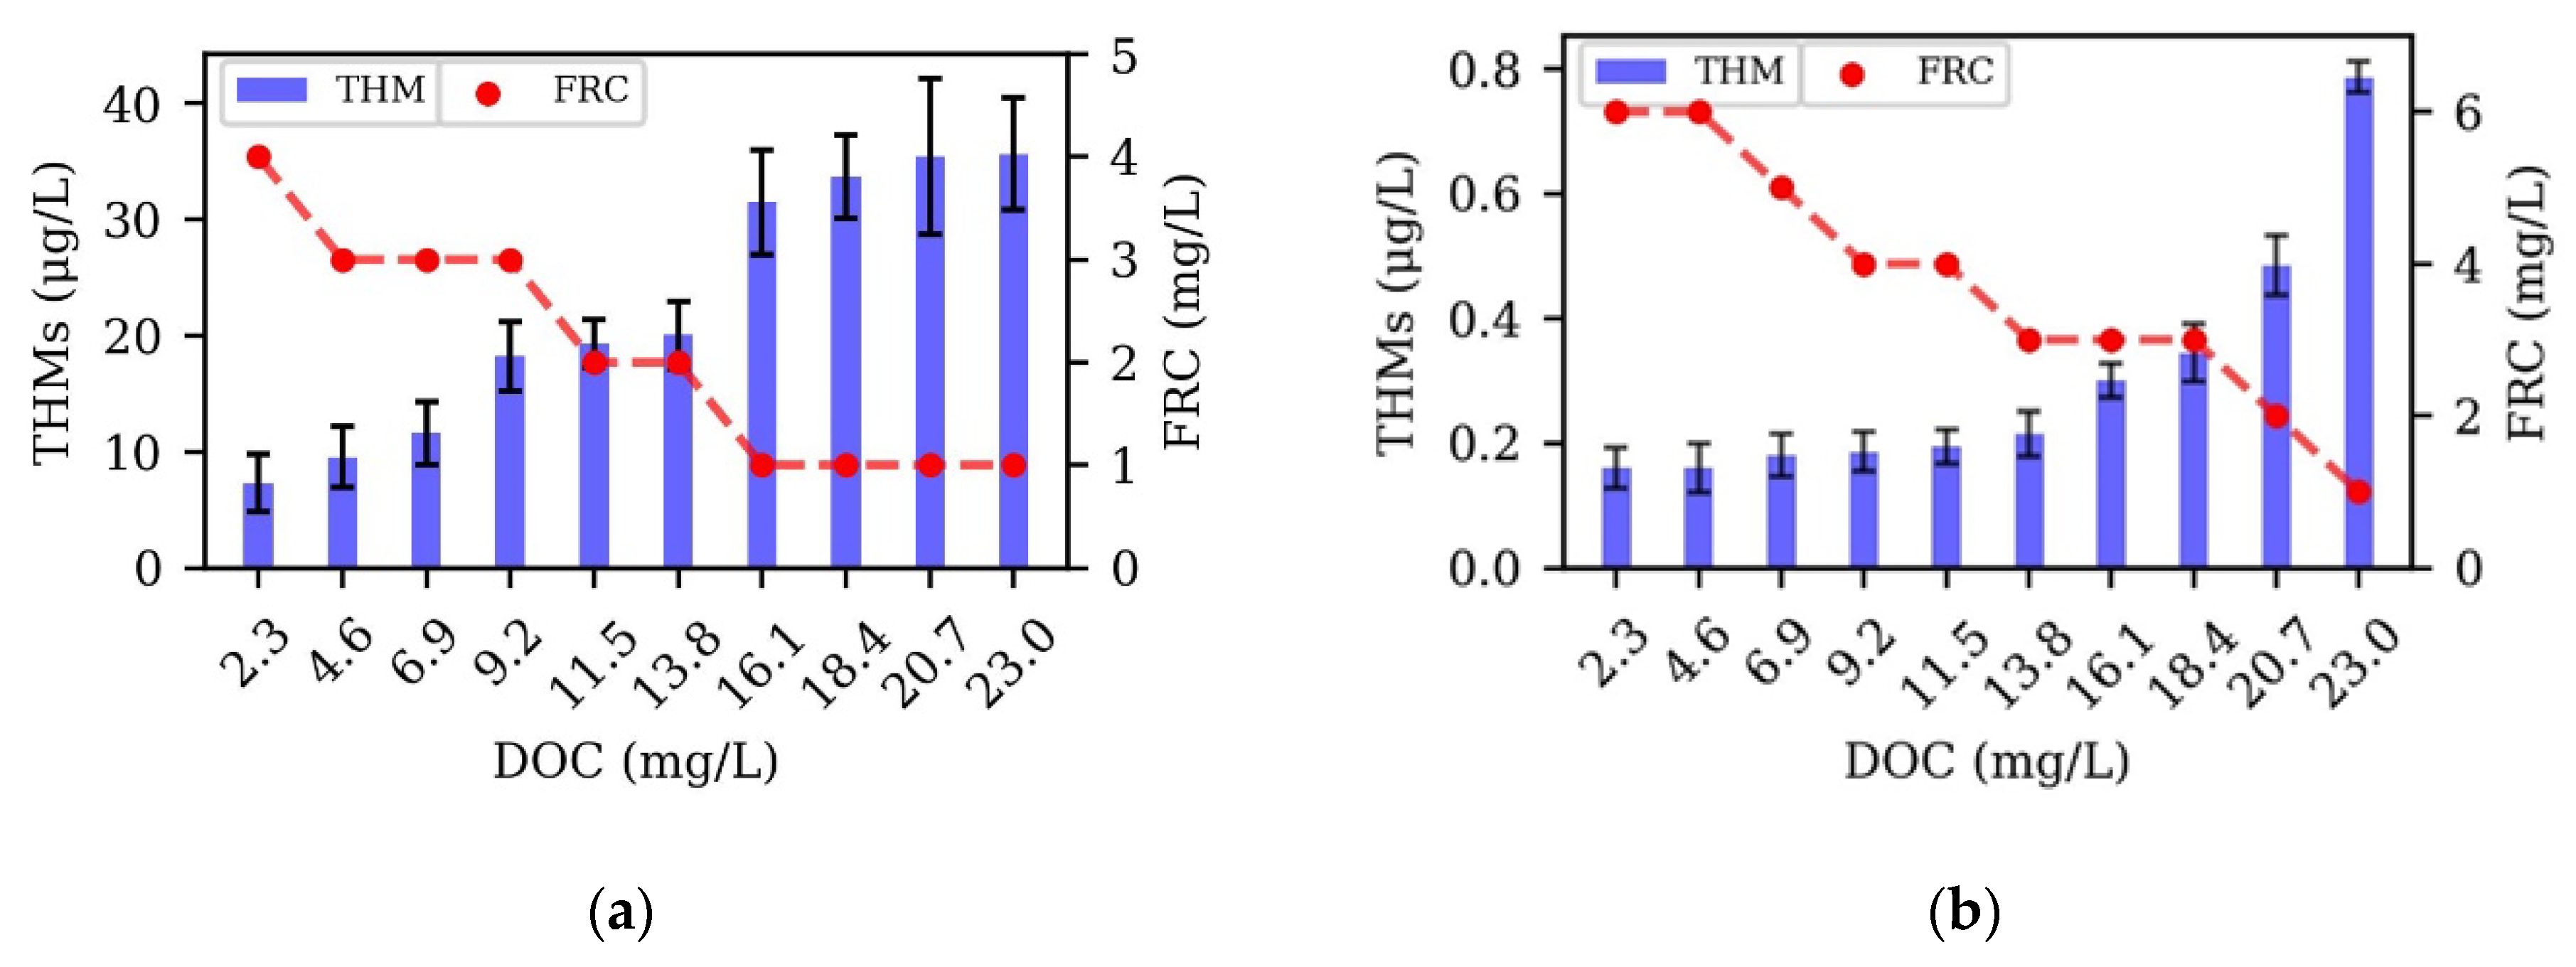
3.1. DOC Variation
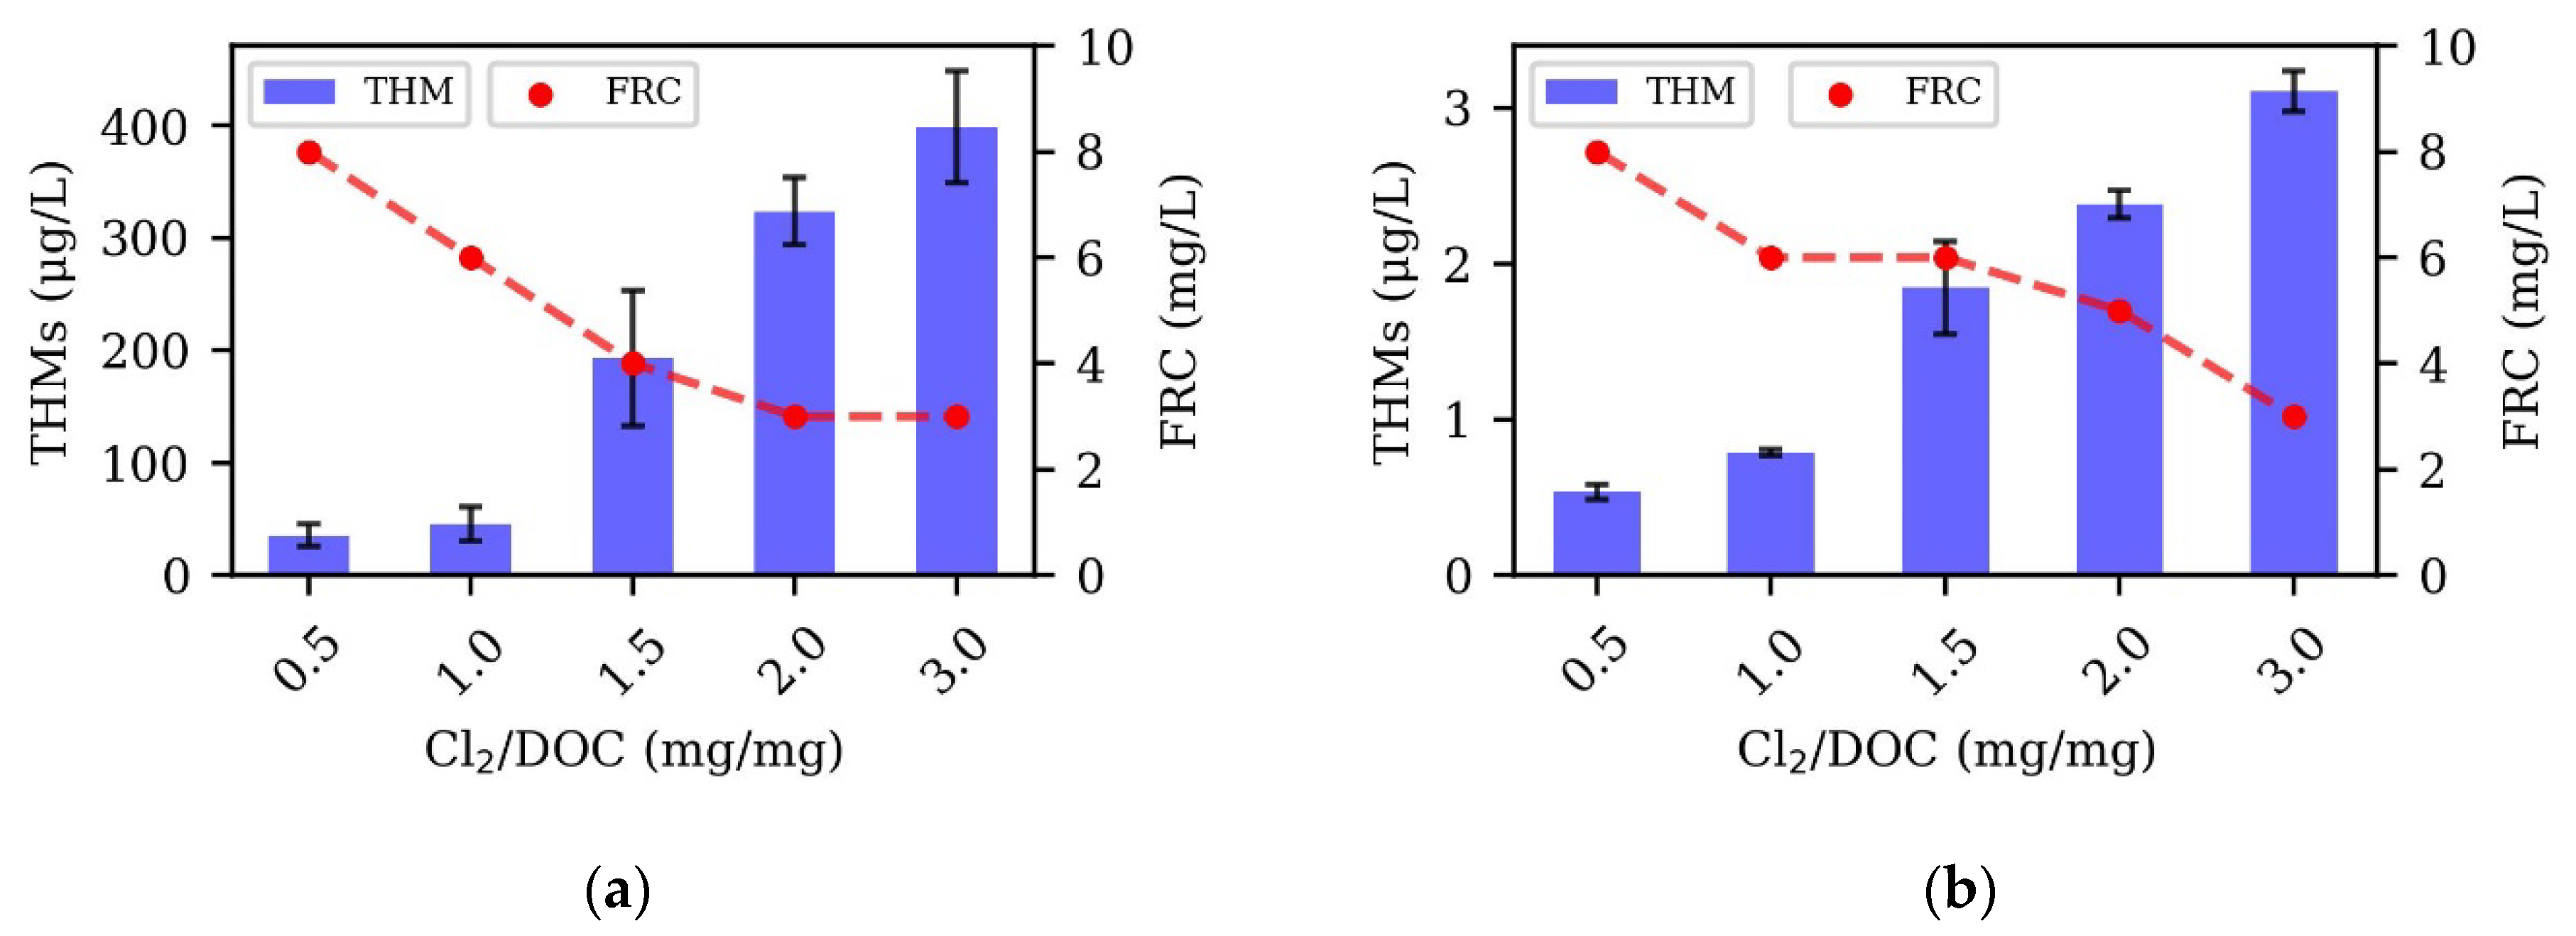
3.2. Disinfectant Dose Variation
3.3. Reaction Time Variation
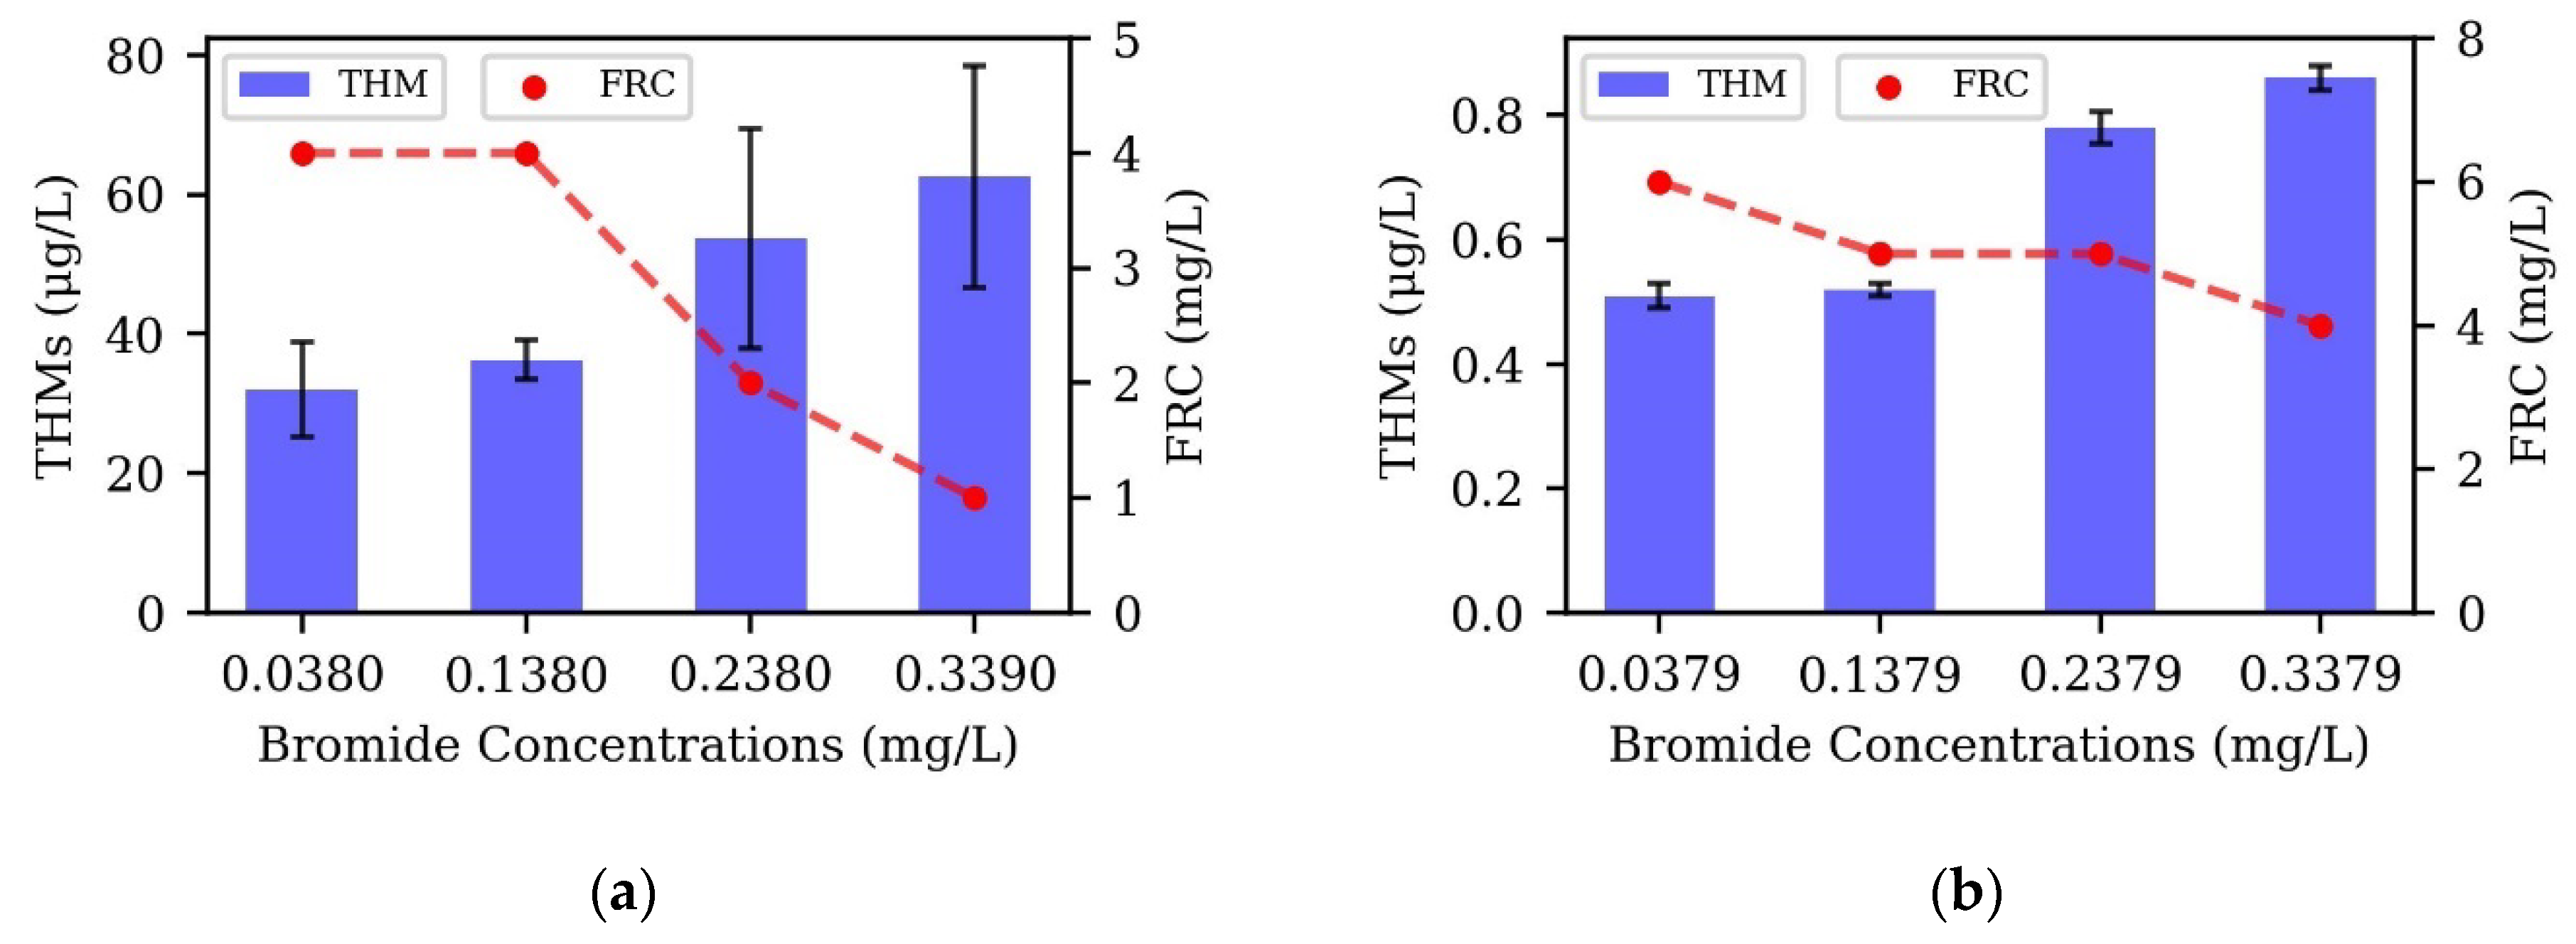
3.4. Bromide Variation
3.5. Temperature Variation
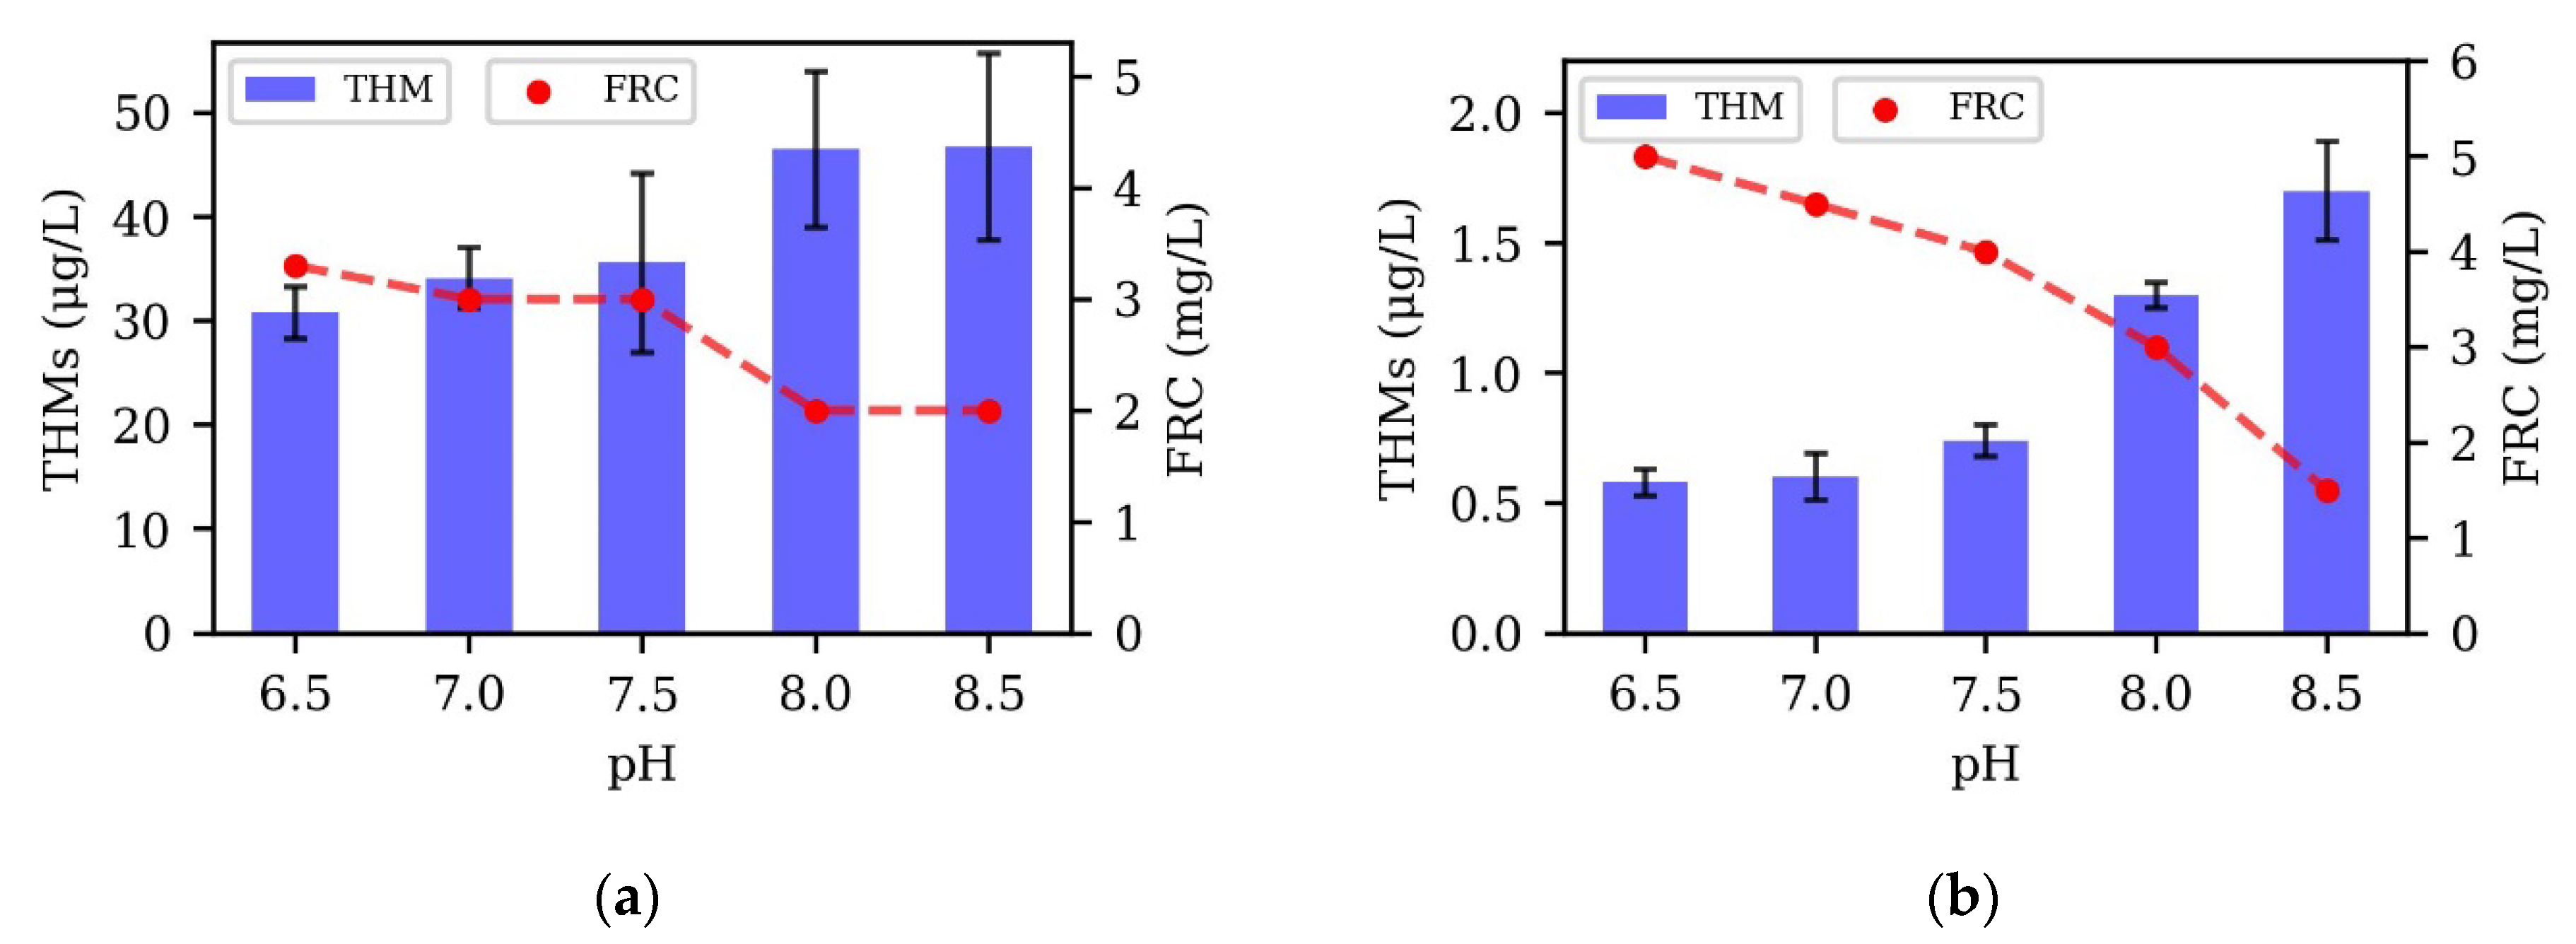
3.6. pH Variation
3.7. Correlation Between THMs and Water Quality Parameters
3.8. Broader Implications for Other Regions and Alternative Treatment Methods
4. Conclusions
Author Contributions
Funding
Data Availability Statement
Acknowledgments
Conflicts of Interest
References
- Ramírez-Castillo, F.Y.; Loera-Muro, A.; Jacques, M.; Garneau, P.; Avelar-González, F.J.; Harel, J.; Guerrero-Barrera, A.L. Waterborne pathogens: Detection methods and challenges. Pathogens 2015, 4, 307–334. [Google Scholar] [CrossRef] [PubMed]
- Hurst, C.J. Understanding and Estimating the Risk of Waterborne Infectious Disease Associated with Drinking Water. In The Connections Between Ecology and Infectious Disease; Springer: Berlin/Heidelberg, Germany, 2018; Volume 5. [Google Scholar]
- Mazhar, M.A.; Khan, N.A.; Ahmed, S.; Khan, A.H.; Hussain, A.; Rahisuddin, N.; Changani, F.; Yousefi, M.; Ahmadi, S.; Vambol, V. Chlorination disinfection by-products in municipal drinking water—A review. J. Clean. Prod. 2020, 273, 123159. [Google Scholar] [CrossRef]
- Barancheshme, F.; Keen, O.S. Effect of intracellular algal organic matter and nitrate on disinfection byproduct formation in chlorinated water after UV/H2O2 and UV/Cl2 advanced oxidation processes. Environ. Sci. Water Res. Technol. 2025, 11, 494–507. [Google Scholar] [CrossRef]
- Tomar, G.; Kumar, V. Water Disinfectant and Its Health Hazards to Every Form of Life. In Emerging Contaminants in Water and Wastewater; Gupta, H., Madhav, S., Dhiman, S., Mishra, R., Eds.; Environmental Science and Engineering; Springer: Cham, Switzerland, 2025; pp. 133–150. [Google Scholar]
- Dalvi, V.; Ansari, A.; Kalia, S.; Gaur, R.; Lew, B.; Khan, A.A. Detection and Measurement of Disinfection By-Products in Drinking Water. In Drinking Water Disinfection By-Products; Madhav, S., Mazhar, M.A., Ahmed, S., Kumar, P., Mishra, P.K., Eds.; Springer: Cham, Switzerland, 2024. [Google Scholar]
- Sinha, R.; Gupta, A.K.; Ghosal, P.S. A review on Trihalomethanes and Haloacetic acids in drinking water: Global status, health impact, insights of control and removal technologies. J. Environ. Chem. Eng. 2021, 9, 106511. [Google Scholar] [CrossRef]
- Fabris, R.; Chow, C.W.K.; Drikas, M.; Eikebrokk, B. Comparison of NOM character in selected Australian and Norwegian drinking waters. Water Res. 2008, 42, 4188–4196. [Google Scholar] [CrossRef]
- Meyn, T.; Leiknes, T. Comparison of optional process configurations and operating conditions for ceramic membrane MF coupled with coagulation/flocculation pre-treatment for the removal of NOM in drinking water production. J. Water Supply Res. Technol. Aqua 2010, 59, 81–91. [Google Scholar] [CrossRef]
- Liu, C.; Ersan, M.S.; Plewa, M.J.; Amy, G.; Karanfil, T. Formation of regulated and unregulated disinfection byproducts during chlorination of algal organic matter extracted from freshwater and marine algae. Water Res. 2018, 142, 313–324. [Google Scholar] [CrossRef]
- Richardson, S.D.; Postigo, C. Formation of DBPs: State of the Science; ACS Publications: Washington, DC, USA, 2015; Volume 1190. [Google Scholar]
- Padhi, R.K.; Subramanian, S.; Satpathy, K.K. Formation, distribution, and speciation of DBPs (THMs, HAAs, ClO2, and ClO3) during treatment of different source water with chlorine and chlorine dioxide. Chemosphere 2018, 218, 540–550. [Google Scholar] [CrossRef]
- Koltsova, E. Prediction of THMs Formation Potential in Disinfection of Drinking Water; Uorwegian University of Life Sciences: Akershus, Norway, 2019. [Google Scholar]
- Hua, G.; Reckhow, D.A. Comparison of disinfection byproduct formation from chlorine and alternative disinfectants. Water Res. 2007, 41, 1667–1678. [Google Scholar] [CrossRef]
- Lee, J.; Kim, E.S.; Roh, B.S.; Eom, S.W.; Zoh, K.D. Occurrence of disinfection by-products in tap water distribution systems and their associated health risk. Env. Monit. Assess. 2013, 185, 7675–7691. [Google Scholar] [CrossRef]
- Zhang, K.; Qiu, C.; Cai, A.; Deng, J.; Li, X. Factors affecting the formation of DBPs by chlorine disinfection in water distribution system. Desalination Water Treat. 2020, 205, 91–102. [Google Scholar] [CrossRef]
- Zhang, N.; Ma, B.; Li, J.; Zhang, Z. Factors affecting formation of chemical by-products during ballast water treatment based on an advanced oxidation process. Chem. Eng. J. 2013, 231, 427–433. [Google Scholar] [CrossRef]
- Moody, C.S.; Worrall, F.; Evans, C.D.; Jones, T.G. The rate of loss of dissolved organic carbon (DOC) through a catchment. J. Hydrol. 2013, 492, 139–150. [Google Scholar] [CrossRef]
- Zhang, Q.; Kuang, W.F.; Liu, L.Y.; Li, K.; Wong, K.H.; Chow, A.T.; Wong, P.K. Trihalomethane, haloacetonitrile, and chloral hydrate formation potentials of organic carbon fractions from sub-tropical forest soils. Hazard. Mater. 2009, 172, 880–887. [Google Scholar] [CrossRef]
- Valjarevic, A.D.; Morar, C.; Bosanac, L.B.; Mitrovic, T.C.; Djekic, T.; Mihajlovic, M.D.; Milevski, I.; Calafic, G.; Lukovic, M.; Niemets, L.; et al. Sustainable land use in Moldova: GIS & remote sensing of forests and crops. Land Use Policy 2025, 152, 107515. [Google Scholar] [CrossRef]
- Liu, Y.; Liu, K.; Plewa, M.J.; Karanfil, T.; Liu, C. Formation of regulated and unregulated disinfection byproducts during chlorination and chloramination: Roles of dissolved organic matter type, bromide, and iodide. Environ. Sci. 2022, 117, 151–160. [Google Scholar] [CrossRef]
- Chow, A.T.; Dahlgren, R.A.; Harrison, J.A. Watershed sources of disinfection byproduct precursors in the Sacramento and San Joaquin Rivers, California. Sci. Technol. 2007, 41, 7645–7652. [Google Scholar] [CrossRef]
- Anderson, L.E.; DeMont, I.; Dunnington, D.D.; Bjorndahl, P.; Redden, D.J.; Brophy, M.J.; Gagnon, G.A. A review of long-term change in surface water natural organic matter concentration in the northern hemisphere and the implications for drinking water treatment. Sci. Total Environ. 2023, 585, 159699. [Google Scholar] [CrossRef]
- Asadollahi, A.; Magar, B.A.; Poudel, B.; Sohrabifar, A.; Kalra, A. Application of Machine Learning Models for Improving Discharge Prediction in Ungauged Watershed: A Case Study in East DuPage, Illinois. Geographies 2024, 4, 363–377. [Google Scholar] [CrossRef]
- Groenigen, K.J.V.; Qi, X.; Osenberg, C.W.; Luo, Y.; Hungate, B.A. Faster decomposition under increased atmospheric CO₂ limits soil carbon storage. Science 2014, 344, 508–509. [Google Scholar] [CrossRef]
- Lee, D.; Cojocariu, C. A Consolidated Method for the Analysis of VOCs in Soil by HS-GC-MS in Analytical Testing Laboratories; Thermoscientific: Waltham, MA, USA, 2020. [Google Scholar]
- Asadollahi, A.; Sohrabifar, A.; Ghimire, A.B.; Poudel, B.; Shin, S. The Impact of Climate Change and Urbanization on Groundwater Levels: A System Dynamics Model Analysis. Environ. Prot. Res. 2024, 4, 1–15. [Google Scholar] [CrossRef]
- Brooks, E.; Freeman, C.; Gough, R.; Holliman, P.J. Tracing dissolved organic carbon and trihalomethane formation potential between source water and finished drinking water at a lowland and an upland UK catchment. Sci. Total Environ. 2015, 537, 203–212. [Google Scholar] [CrossRef] [PubMed]
- Liu, X.; Chen, L.; Yang, M.; Tan, C.; Chu, W. The occurrence, characteristics, transformation and control of aromatic disinfection by-products: A review. Water Res. 2020, 184, 116076. [Google Scholar] [CrossRef] [PubMed]
- Szczuka, A. Emerging Technology Integration for Improving Water REUSE Treatment. Ph.D. Thesis, Stanford University, Stanford, CA, USA, 2020. [Google Scholar]
- Zhang, H.; Zheng, Y.; Wang, X.C.; Zhang, Q.; Dzakpasu, M. Photochemical behavior of constructed wetlands-derived dissolved organic matter and its effects on Bisphenol A photodegradation in secondary treated wastewater. Sci. Total Environ. 2022, 845, 157300. [Google Scholar] [CrossRef]
- Illinois Environmental Protection Agency. Cedar Lake Watershed TMDL Report; Illinois Environmental Protection Agency: Spring Field, IL, USA, 2008. [Google Scholar]
- Illinois Environmental Protection Agency. South Fork Saline—Lake Egypt Watershed TMDL Report; Illinois Environmental Protection Agency: Spring Field, IL, USA, 2008. [Google Scholar]
- Peterson, K. An Exploratory Analysis of Thihalomethane and Haloacetic Acid Formation Potential Modeling of Cedar Lake; Southern Illinois Unicersity Carbondale: Carbondale, IL, USA, 2019. [Google Scholar]
- Rumpel, C.; Baumann, K.; Remusat, L.; Dignac, M.F.; Barré, P.; Deldicque, D.; Glasser, G.; Lieberwirth, I.; Chabbi, A. Nanoscale evidence of contrasted processes for root-derived organic matter stabilization by mineral interactions depending on soil depth. Soil Biol. Biochem. 2015, 85, 82–88. [Google Scholar] [CrossRef]
- Hua, G.; Reckhow, D.A.; Abusallout, I. Correlation between SUVA and DBP formation during chlorination and chloramination of NOM fractions from different sources. Chemosphere 2015, 130, 82–89. [Google Scholar] [CrossRef]
- U.S. Environmental Protection Agency. Disinfectants and Disinfection Byproducts Rules (Stage 1 and Stage 2); U.S. Environmental Protection Agency: Washington, DC, USA, 2020. [Google Scholar]
- Chow, A.T.S.; Ulus, Y.; Huang, G.; Kline, M.A.; Cheah, W.Y. Challenges in quantifying and characterizing dissolved organic carbon: Sampling, isolation, storage, and analysis. Environ. Qual. 2022, 51, 837–871. [Google Scholar] [CrossRef]
- Yang, X.; Shang, C.; Westerhoff, P. Factors affecting formation of haloacetonitriles, haloketones, chloropicrin and cyanogen halides during chloramination. Water Res. 2007, 41, 1193–1200. [Google Scholar] [CrossRef]
- Hong, H.; Xiong, Y.; Ruan, M.; Liao, F.; Lin, H.; Liang, Y. Factors affecting THMs, HAAs and HNMs formation of Jin Lan Reservoir water exposed to chlorine and monochloramine. Sci. Total Environ. 2013, 444, 196–204. [Google Scholar] [CrossRef]
- Doederer, K.; Gernjak, W.; Weinberg, H.S.; Farré, M.J. Factors affecting the formation of disinfection by-products during chlorination and chloramination of secondary effluent for the production of high quality recycled water. Water Res. 2014, 48, 218–228. [Google Scholar] [CrossRef]
- Korshin, M.V.; Wu, W.W.; Benjamin, M.M.; Hemingway, O. Correlations between differential absorbance and the formation of individual DBPs. Water Res. 2002, 36, 3273–3282. [Google Scholar] [CrossRef] [PubMed]
- Georgia, A. The Behaviour of Haloacetic Acids in Distribution Zones in Scotland; Cranfield University: Bedford, UK, 2014. [Google Scholar]
- MacKeown, H.; Gunten, U.V.; Criquet, J. Iodide sources in the aquatic environment and its fate during oxidative water treatment—A critical review. Water Res. 2022, 215, 118417. [Google Scholar] [CrossRef]
- Evlampidou, I.; Font-Ribera, L.; Rojas-Rueda, D.; Gracia-Lavedan, E.; Costet, N.; Pearce, N.; Vineis, P.; Jaakkola, J.J.K.; Delloye, F.; Makris, K.C.; et al. Trihalomethanes in Drinking Water and Bladder Cancer Burden in the European Union. Environ. Health Perspect. 2020, 128, 17001. [Google Scholar] [CrossRef] [PubMed]
- Sarker, M.S.; Shoily, U.R.; Chowdhury, N.A.; Ahmad, R.; Ahmed, A. Environmental Monitoring at and around the Matuail Landfill Site of Dhaka City using Remote Sensing. J. Eng. Sci. 2022, 12, 127–138. [Google Scholar] [CrossRef]
- Levesquea, S.; Rodriguezb, M.J.; Serodesc, J.; Beaulieua, C.; Proulx, F. Effects of indoor drinking water handling on trihalomethanes and haloacetic acids. Water Res. 2006, 40, 2921–2930. [Google Scholar] [CrossRef]
- Hung, Y.C.; Waters, B.W.; Yemmireddy, V.K.; Huang, C.H. pH effect on the formation of THM and HAA disinfection byproducts. J. Integr. Agric. 2017, 16, 2914–2923. [Google Scholar] [CrossRef]
- Aleid, M.K.; Alharbi, K.N.; Aljufareen, M.A.; Aloliwi, A.S.; Almutairi, A.K.; Alsaif, R.S.; Alshayeb, N.K.; Almoiqli, M.S. Evaluation of water quality via determination of trihalomethanes in water distribution networks of Riyadh city in Kingdom of Saudi Arabia. Arab. J. Chem. 2024, 17, 105431. [Google Scholar] [CrossRef]
- Nikiema, J.; Asiedu, Z. A review of the cost and effectiveness of solutions to address plastic pollution. Environ. Sci. Pollut. Res. 2022, 29, 24547–24573. [Google Scholar] [CrossRef]


| Parameter | Baseline Condition | Condition |
|---|---|---|
| DOC concentration | 22.97 mg/L | 0% DI to 90% DI |
| Reaction time | 24 h | 0, 2, 12, 24, 48, 96, and 168 h |
| Bromine level | Ambient (0.038 mg/L) | 0.038, 0.18, 0.28, and 0.38 mg/L |
| pH | 7.5 | 6.5, 7, 7.5, 8, 8.5 |
| Chlorine to DOC ratio | 1:1 | 0.5:1, 1:1, 1.5:1, 2:1, 3:1 |
| Temperature | Room temperature (22 °C) | 22 °C, 25 °C, 30 °C |
| Chlorination | Chloramination |
|---|---|
|
|
Disclaimer/Publisher’s Note: The statements, opinions and data contained in all publications are solely those of the individual author(s) and contributor(s) and not of MDPI and/or the editor(s). MDPI and/or the editor(s) disclaim responsibility for any injury to people or property resulting from any ideas, methods, instructions or products referred to in the content. |
© 2025 by the authors. Licensee MDPI, Basel, Switzerland. This article is an open access article distributed under the terms and conditions of the Creative Commons Attribution (CC BY) license (https://creativecommons.org/licenses/by/4.0/).
Share and Cite
Asadollahi, A.; Sohrabifar, A.; Fakhraei, H. Trihalomethane Formation from Soil-Derived Dissolved Organic Matter During Chlorination and Chloramination: A Case Study in Cedar Lake, Illinois. Geographies 2025, 5, 15. https://doi.org/10.3390/geographies5010015
Asadollahi A, Sohrabifar A, Fakhraei H. Trihalomethane Formation from Soil-Derived Dissolved Organic Matter During Chlorination and Chloramination: A Case Study in Cedar Lake, Illinois. Geographies. 2025; 5(1):15. https://doi.org/10.3390/geographies5010015
Chicago/Turabian StyleAsadollahi, Amin, Asyeh Sohrabifar, and Habibollah Fakhraei. 2025. "Trihalomethane Formation from Soil-Derived Dissolved Organic Matter During Chlorination and Chloramination: A Case Study in Cedar Lake, Illinois" Geographies 5, no. 1: 15. https://doi.org/10.3390/geographies5010015
APA StyleAsadollahi, A., Sohrabifar, A., & Fakhraei, H. (2025). Trihalomethane Formation from Soil-Derived Dissolved Organic Matter During Chlorination and Chloramination: A Case Study in Cedar Lake, Illinois. Geographies, 5(1), 15. https://doi.org/10.3390/geographies5010015