Article

Adding Gusts to a Mobile Wind Tunnel: Experimental Setup and Effect of Simulated Gusts on Horizontal Transport

Department of Physical Geography, Trier University, Universitätsring 15, 54296 Trier, Germany
Geographies 2024, 4(2), 203-215; https://doi.org/10.3390/geographies4020013
Submission received: 14 December 2023 / Revised: 13 March 2024 / Accepted: 20 March 2024 / Published: 23 March 2024

Abstract

:
Wind erosivity has an intermittent character due to complicated interactions between air streams, surface characteristics, and sediment particles. To experimentally investigate the effect of a sudden and local gust on sediment entrainment, a simple setup was installed in a mobile wind tunnel. One, three, and five consecutive gusts were applied and compared with standard test conditions with steady wind. The applied wind was characterized by total test duration (s), duration of gust (s), mean velocity, peak velocity (m s−1), gust factor, and transport capacity based on sediment-specific threshold velocity. The eroded material was collected by sediment containers. The results suggest that 1. the application of gusts inside the mobile wind tunnel setup is feasible but related to uncertainty concerning the applied wind conditions, and 2. the horizontal transport rate increased with the number of applied gusts. While the highest rates were measured during five gusts on sand, the relative effect of gusts was most accentuated in the comparison of one gust to no gust on loam. The findings highlight how temporally and spatially limited gust impact causes extreme particle entrainment. These particles may subsequently either start erosion or enter vertical dust transport.

1. Introduction

The entrainment of sediment by wind depends on a multitude of characteristics of particles, surface, and air stream and interactions between them. While high-resolution measurements give detailed insights into the processes of detachment and transport, the actual determination of wind-driven soil erosion is still associated with great uncertainties [1]. One factor of uncertainty is the non-linearity of entrainment and transport. Another factor is the characteristic intermittency of erosive processes and measured eroded material [2]. While wind erosion models and wind tunnel tests mostly work with a concept of uniform wind velocity (e.g., [3,4]), a steady wind is rarely found in nature [5].
These natural fluctuations are not consistently defined in the literature and comprise a range of amplitudes and periods. In the atmospheric boundary layer, three-dimensional turbulences transfer heat, momentum, and particles between surface and atmosphere, as well as generating wind gusts [6]. The highest gust velocities are produced by convective winds. The highest measured velocities reach 67 m s−1 and are assumed to be much higher, but measurements are not always available [7]. Other origins of gusts are extra-tropical cyclones, which are generally associated with lower velocities but have a greater spatial expansion. The World Meteorological Organization defines a gust as a maximum wind speed compared with an average velocity during the given sampling interval and recommends the 3 s average of a 10 min sampling period [8]. This definition underlines the relative character of a gust. To approach a characterization of the wind’s gustiness, the gust factor G is derived by dividing the maximum velocity by the mean velocity [9].
The wind-driven motion of sand-sized grains generates dust emissions by bombardment and in-air collision [10,11]. (Large) convective turbulences in the atmospheric boundary layer are also considered a trigger for patchy entrainment of dust [12]. The transferred momentum fluxes to the surface may be local but many times the average, thus potentially influencing sediment relocation and matter transport on larger scales. In field studies, natural wind and naturally entrained particles are measured to gain information on the relationship between velocity (peaks) and horizontal flux [13,14,15,16,17,18] or suspended particulate matter [19]. Since most studies show a strong correlation between wind gusts and horizontal flux, wind tunnel studies relying on a steady velocity may underestimate potential total soil erosion.
Fluid impact-induced particle entrainment and transport are highly dependent on small-scale pressure gradients and turbulences [20,21]. Sand entrainment by wind has been found proportional to the near-surface shear stress τ, which is the product of air density (kg m−3) and the square of friction velocity u* (m s−1) [22]. The respective surface-dependent threshold values τt and u*t characterize an erosive wind [23,24], but in the case of intermittent erosion, sediment transport should not be described solely on the basis of mean friction velocity [25]. To approach the high temporal variability of velocity in these tests, the weighted transport capacity of a wind is used to define potentially erodible sequences from a set of wind velocity measurements based on a sediment specific threshold velocity ut [26].
Apart from the relative velocity peak, another crucial criterion for gust characterization is the suddenness of velocity increase described by the variation of velocity between the peak and the average of at least 5.00 m s−1 during a short period (maximum 20 s) lasting for 3 s [27]. This intrinsic character of a gust has not been addressed in wind erosion studies but is a prerequisite for the creation of gusts in this study.
The first research aim was to modify the field test procedure of the Trier mobile wind tunnel. A simple technique for gust generation was tested for feasibility of implementation during field tests. The test included the quality, reliability, and interpretability of gusts generated under field conditions. The produced gusts should meet criterions concerning the definition of a gust, the reproducibility of velocity sequences, actual impact on the collected eroded sediment, and operability during field tests.
The second research aim was the investigation of the impact of gusts on the entrainment of two sediments. The relationship between wind fluctuations and sand entrainment has been investigated in high temporal resolution [28,29], but these fluctuations do not meet both criterions of gusts. This study aims at the investigation of sediment entrainment by a strong, defined gust including a fast velocity increase of at least 5.00 m s−1. Furthermore, the sediments investigated until now have been sands, but there is no information about the response of finer grain sizes of a more natural soil sediment. The test setup included a cohesionless sandy sediment and a partly aggregated loam.

2. Materials and Methods

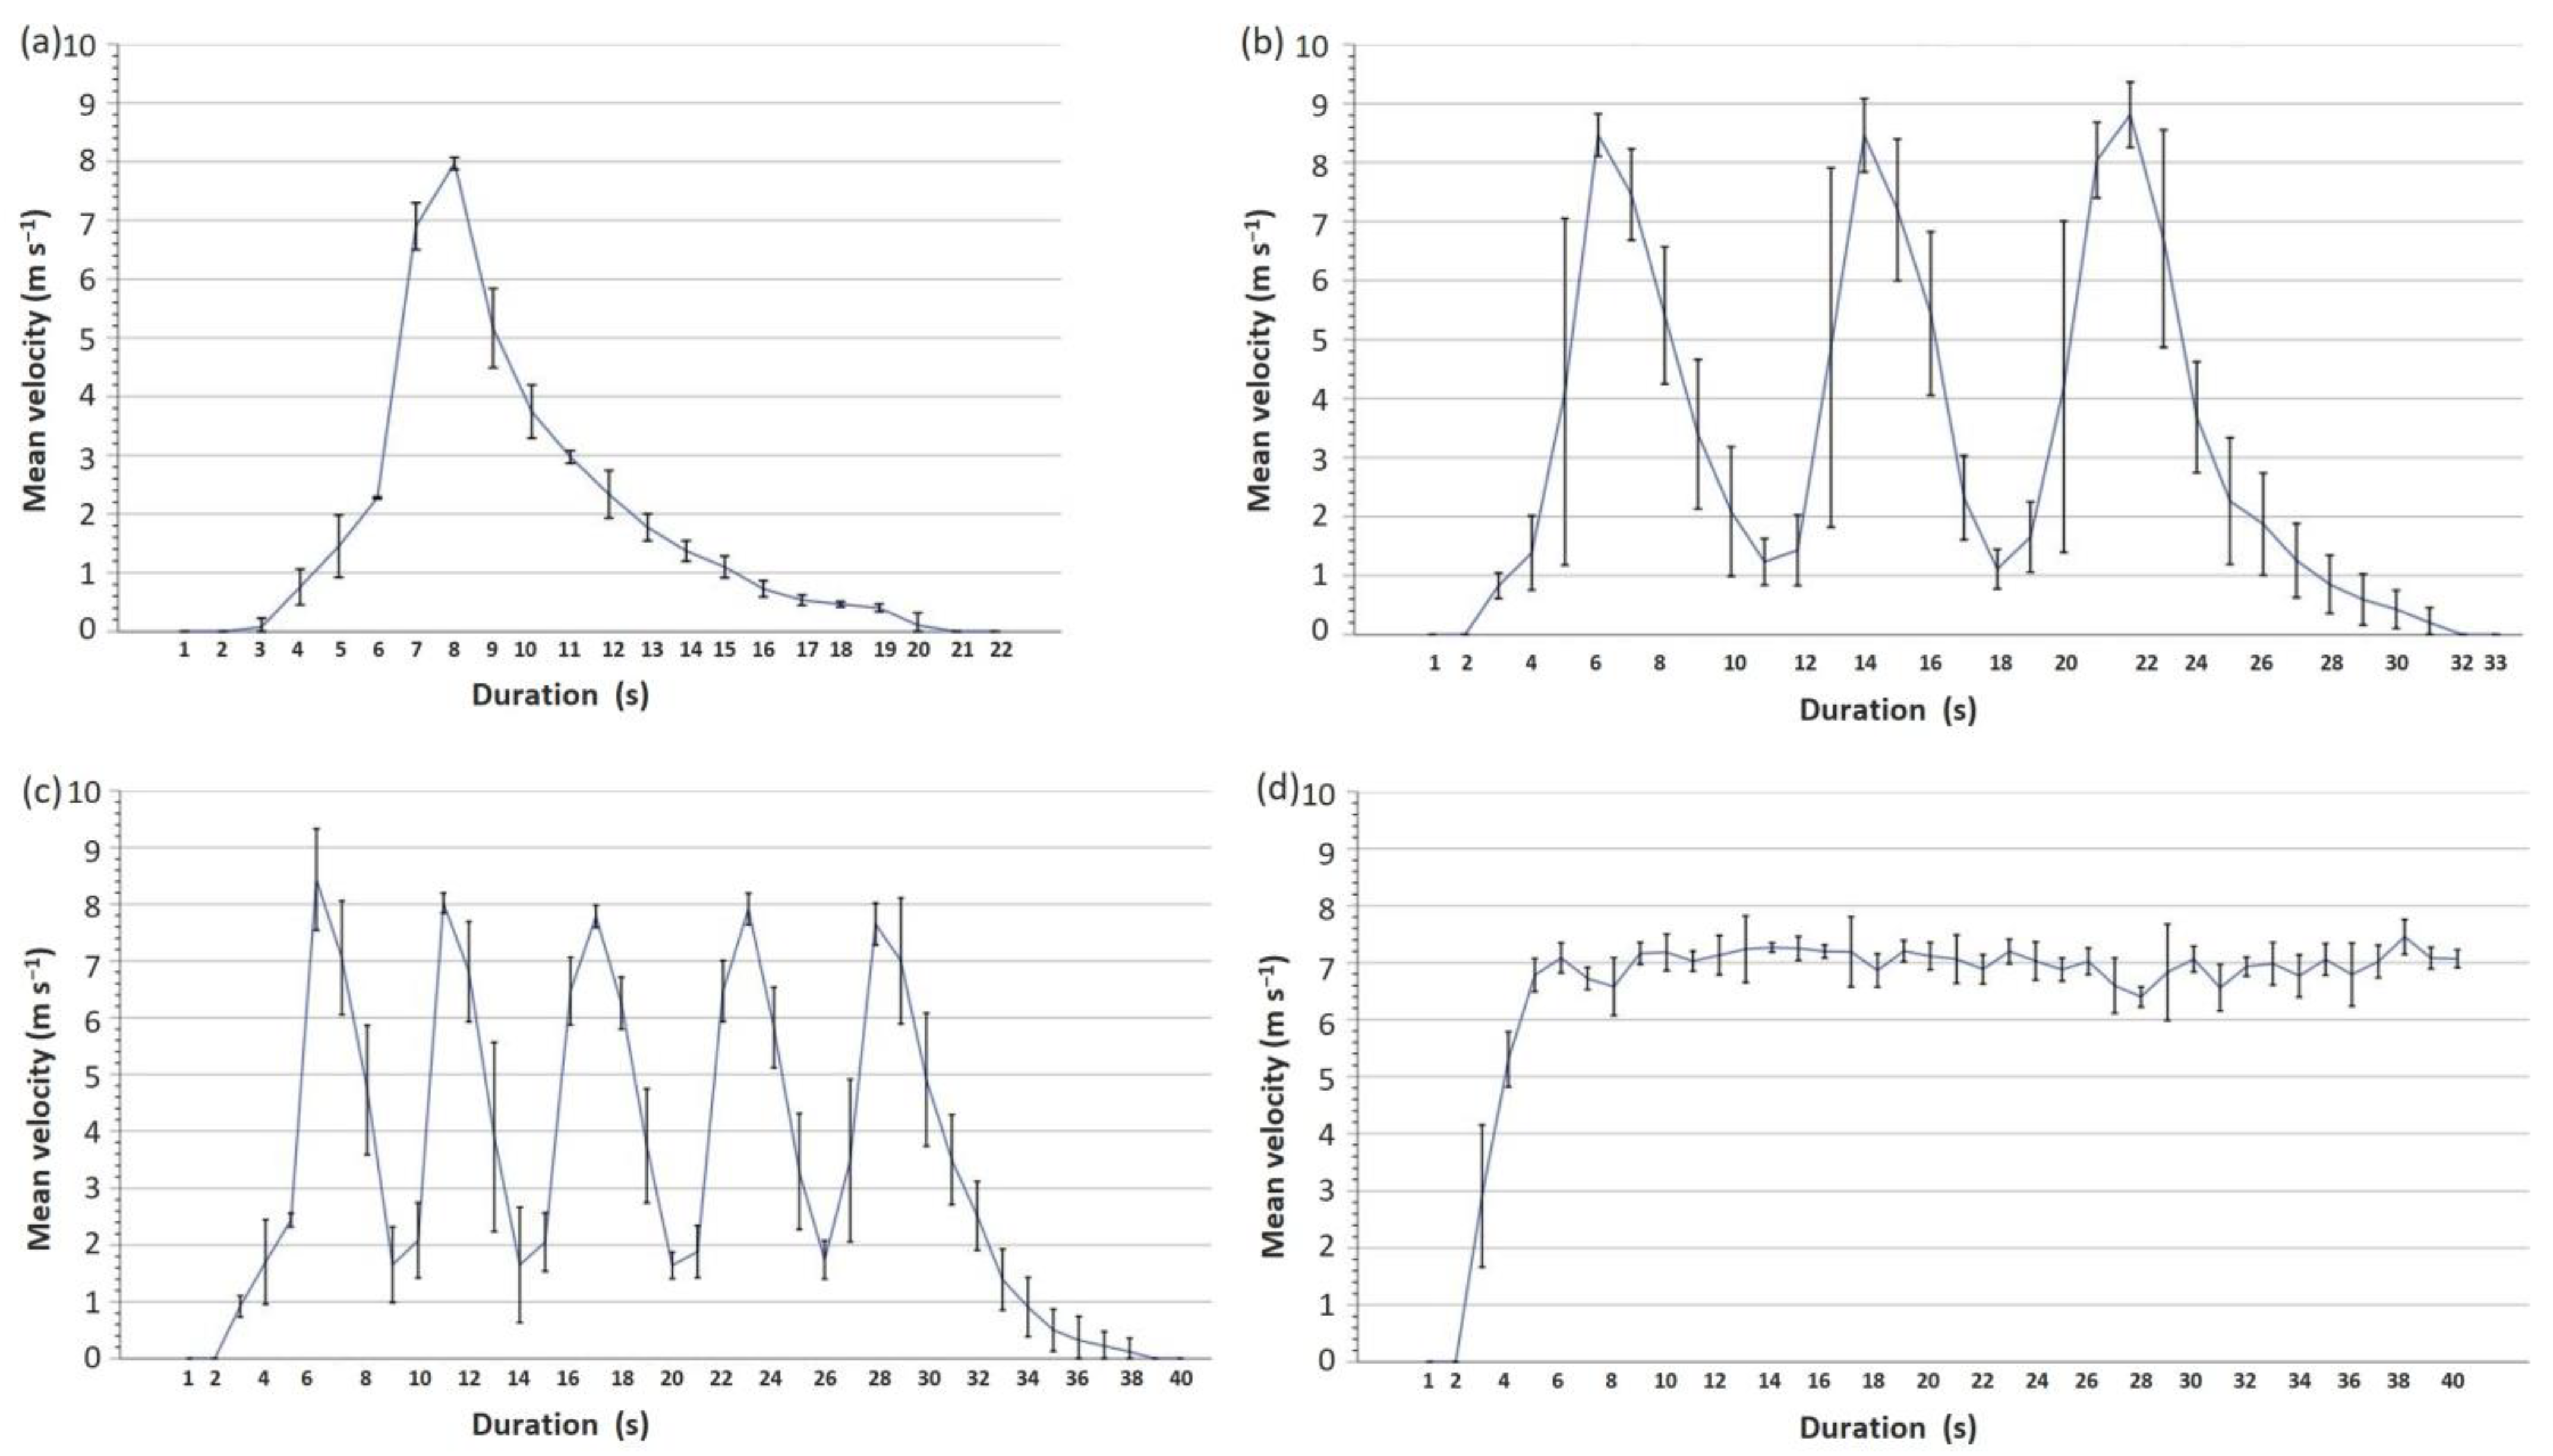
2.1. Generation of Gusts and Steady Air Stream

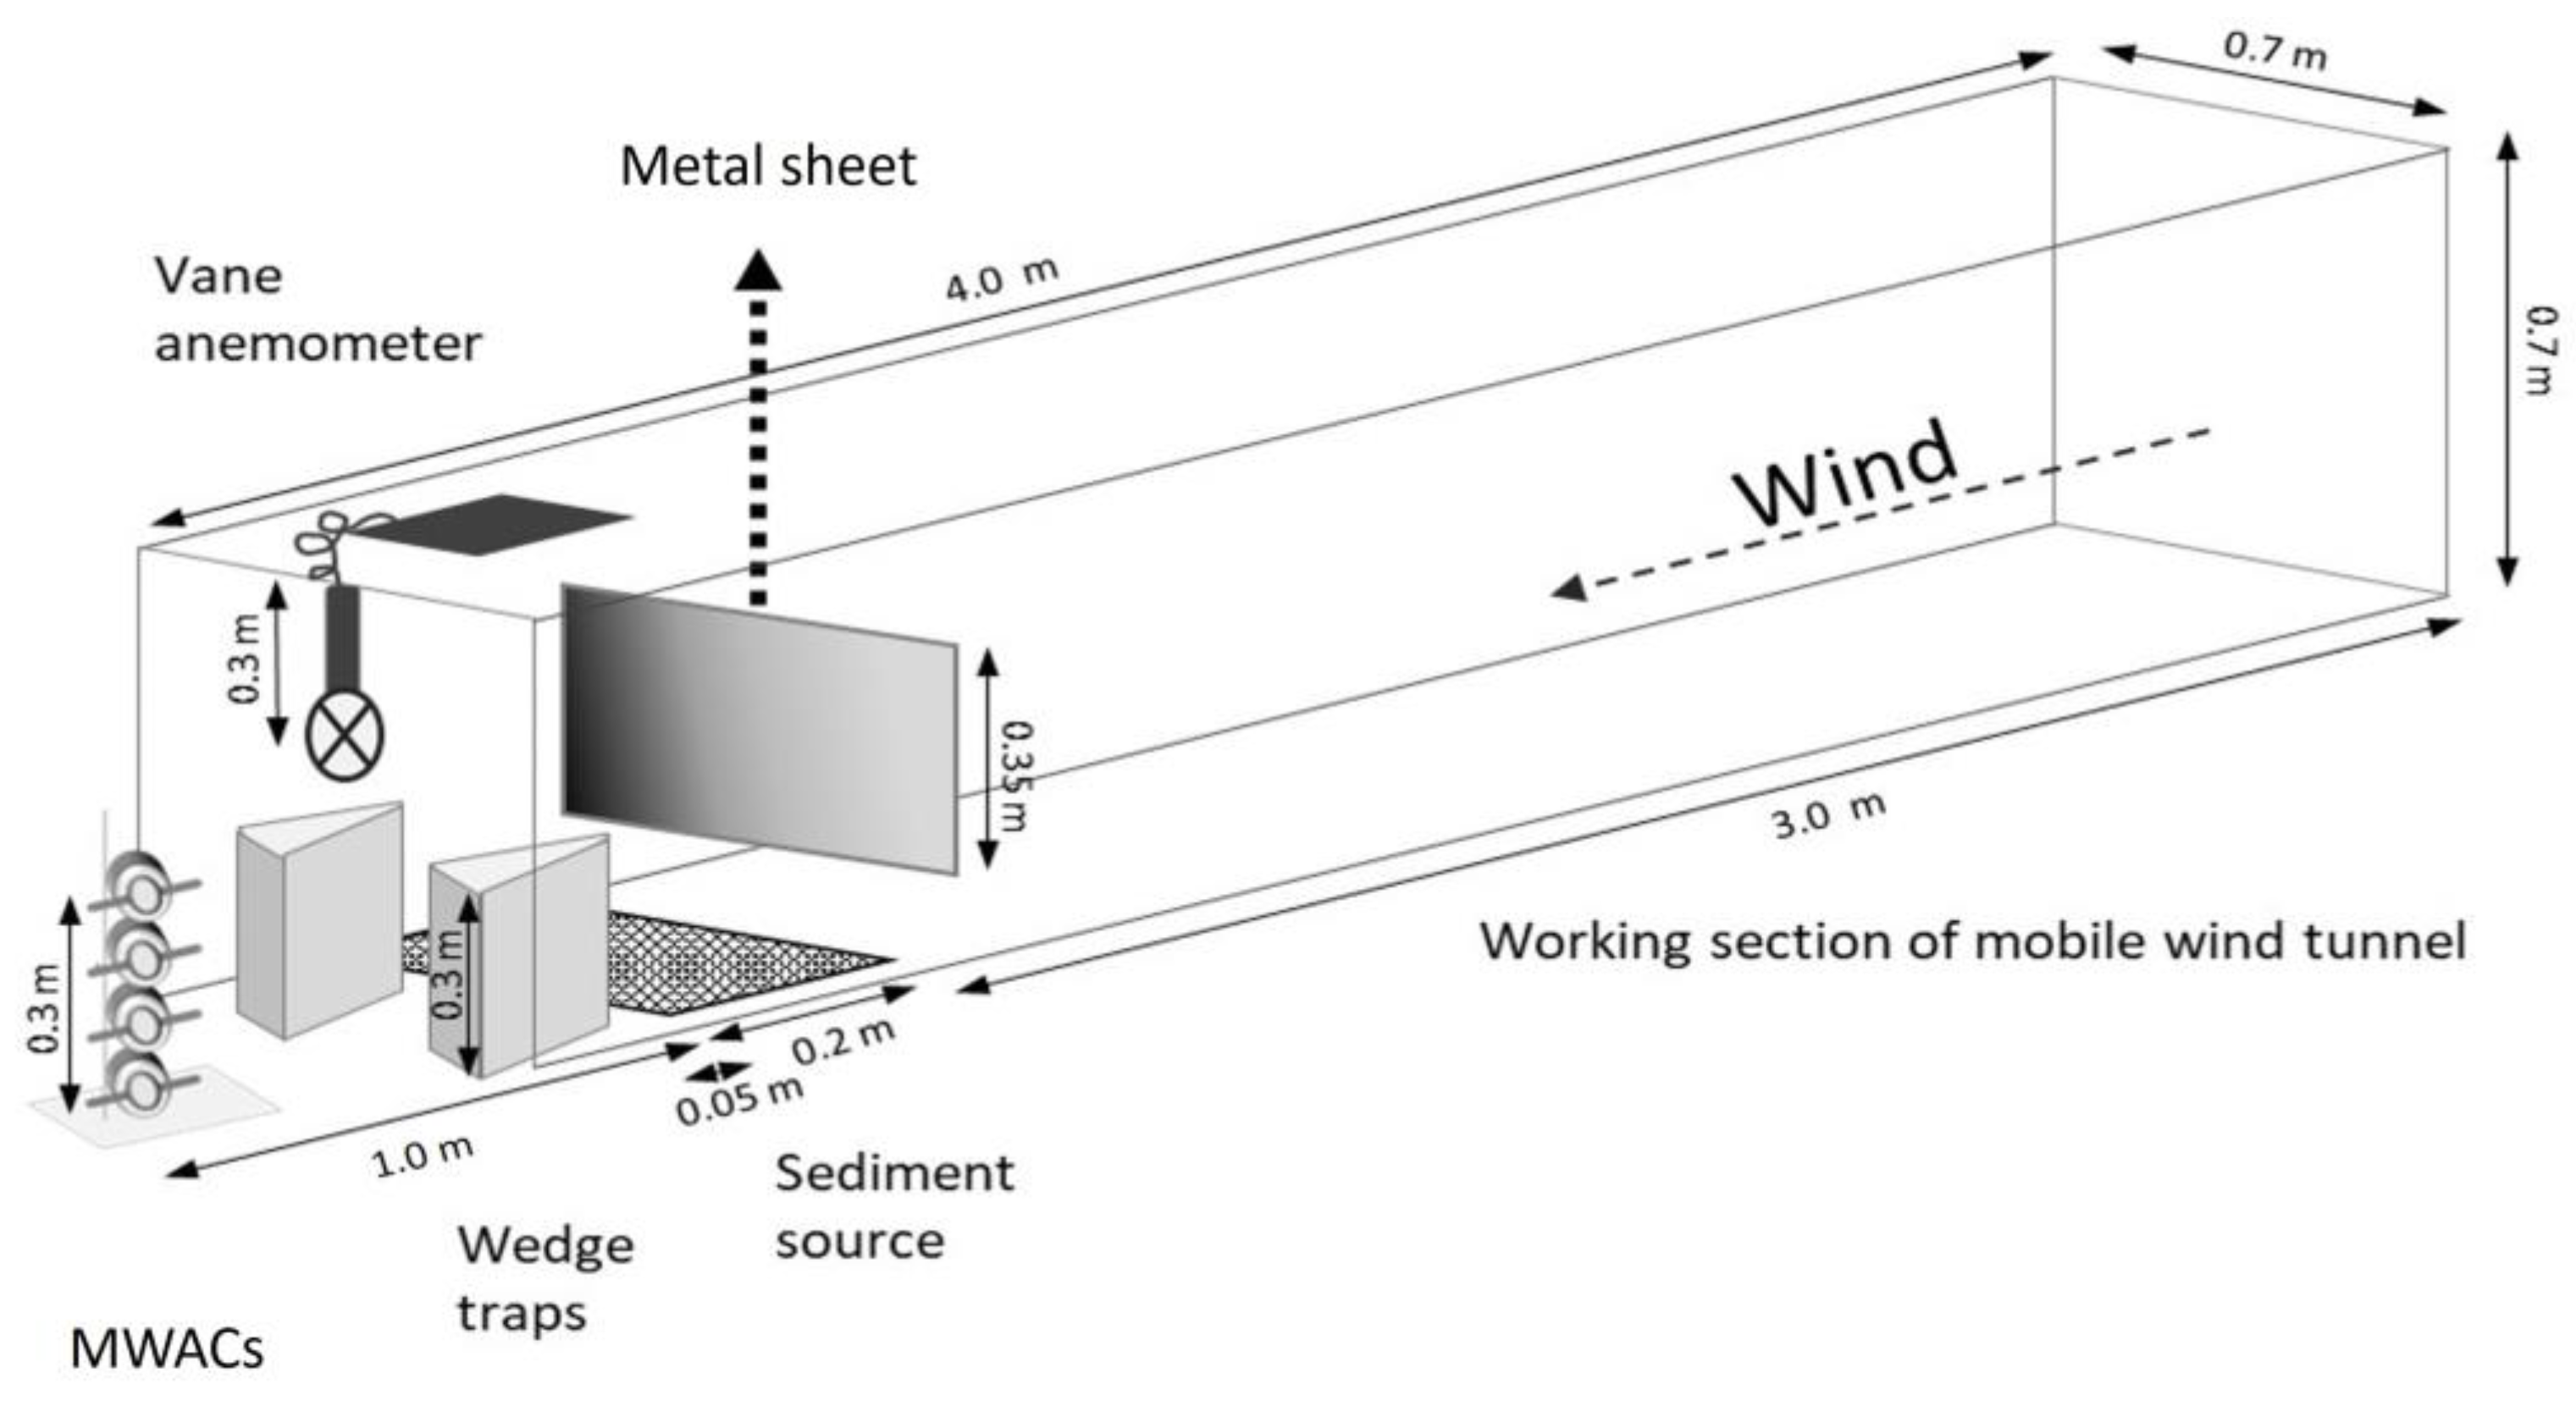
2.1.1. Experimental Setup

The test setup was included in the working section of the Trier mobile wind tunnel (Figure 1). The Trier mobile wind tunnel has been used in a range of environments to study and compare erodibility on site [30,31,32]. The air stream was generated by a rotor-type fan led through a 4.00 m long transition section and through a honeycomb to generate a quasi-laminar air stream. The relatively stable air stream included a logarithmic wind-velocity profile up to 0.15 m height [33,34]. The experimental setup’s physical limitations concerning reliability, validity, and upscaling of the experimental setup and the adequate application of experimentally derived results were addressed in [35,36].
To generate gusts, the motor of the fan was controlled manually. Turning the motor-driven fan on was not sufficient to create the needed rapid and sharp increase in wind velocity. Hence, a metal sheet was inserted before the start of the fan and pulled up after the start of the fan simultaneously to the manual motor control. When inserted, it blocked the lower half of the tunnel cross-section. After the start of the fan, it took two seconds to reach the highest running velocity (7 m s−1). When this velocity was reached, the metal sheet was pulled up to generate a sudden velocity peak which was followed immediately by the turning down of the fan. In the case of more than one gust, instead of turning the fan off completely, the velocity was reduced to the lowest possible value (between 1.20 and 1.80 m s−1) and the metal sheet was inserted again. After that, a new gust was created by this method in a periodic rhythm.

2.1.2. Characterization of Wind and Wind Erosivity

The test duration started and ended with the fan-generated airstream and changed with the applied sequence. Five sequences per applied gust were measured in a 1 s resolution during tests by means of a vane anemometer. Mean values with standard deviation were calculated. To homogenize the measurement of velocities U concerning strongly differing test durations (according to gust sequence), the mean velocity of one test was calculated by measurement duration plus 2 s with 0.00 m s−1 velocity prior and after the test. To characterize the specific gustiness of air stream, the gust factor G was calculated by dividing the peak velocity Umax for one test by the mean velocity Umean of the test duration: G = Umax/Umean. To compare the potential erosivity of the airstream per test, the weighted transport capacity Q was calculated Q = (U − Ut) × U2 based on the velocity measurements per s−1 and threshold velocity Ut (at 35 cm height) = 4.00 m s−1 for the sand sediment and Ut = 6.00 m s−1 for the loam sediment [26,37].

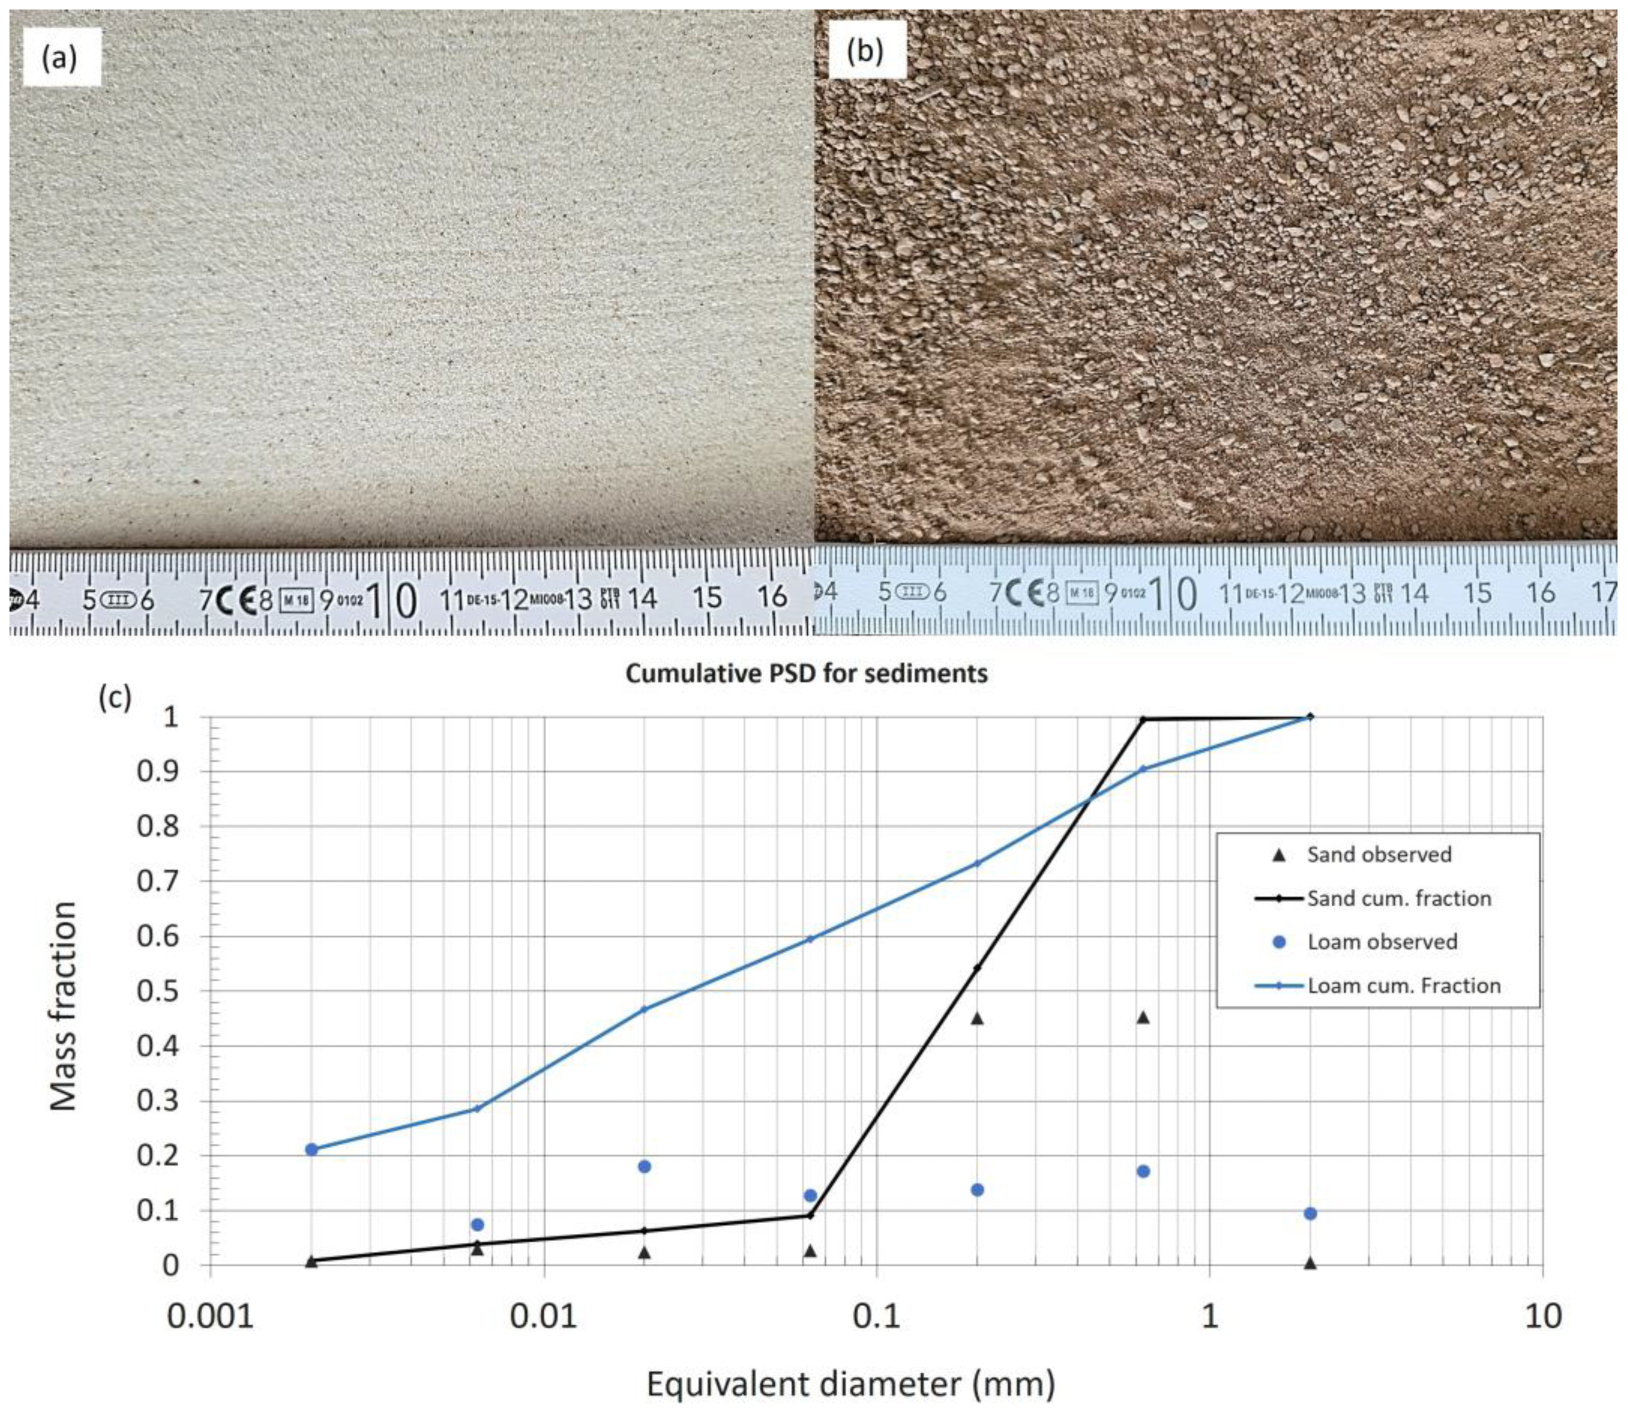
2.2. Sediment Source and Sediments

Two substrates were applied on the tunnel floor without a tray on an area 0.70 wide, 0.20 m long, and 0.02 m high. It was positioned at 3.00 m downwind directly behind the metal sheet. A very narrow sediment source was used to prevent the complicated interactions of an increasingly saturated saltation layer and the surface particles with distance downwind [38]. The two applied sediments were sand and loam < 2 mm (Figure 2). The homogeneous, cohesionless dry sand with a mass median diameter (d50) of 0.18 (fine sand) was characterized by a high content of easily erodible fine sand (45%) and medium sand (45%) with a minor content of other grain sizes. The erodible fraction determined by dry sieving (0.85 mm mesh) was 100%. The dry aggregated loam had a d50 of 0.03 (coarse silt) analyzed after the destruction of aggregates by Köhn analysis including pretreatment with Na4P2O7, [39]. The wind-erodible fraction was 57.2% of the total material.
The sand sediment had a largely uniform grain size distribution. The loam sediment had a much more complex structure with a broad range of particle sizes and aggregates. Sediment supply limitation was a likely a factor for the loam rather than for the sand sediment.

2.3. Eroded Sediment Collection

2.3.1. Horizontal Transport

Two wedge traps [33] with an opening of 0.02 m × 0.30 m were applied on each side of the tunnel outlet to collect wind-eroded sediment (Figure 1). The two samples were pooled for each test run. One test setup included a combination of a sediment (sand/loam) with a respective number of gusts (1, 3, 5) with five repetitions. During 30 tests with applied gusts, a total of 60 samples were collected on sand and loam and pooled to one sample per test, thus generating 30 samples with 15 samples per sediment for analysis. During 10 tests without gusts with 10 min duration, a total of 10 pooled samples were collected accordingly with 5 samples per sediment. The samples were stored >24 h in a thermo-constant room and weighed by means of precision scales. The eroded material (g) was calculated by subtracting the weight of the container before the experiment from the weight after the experiment. Horizontal transport rates (g min−1) were calculated based on the measured material (g) and the mean duration of the respective test.

2.3.2. Vertical Distribution

Of the 40 tests, 22 tests were conducted with additionally installed modified Wilson and Cooke samplers (MWACs, [40,41,42]) on a beam at 1.00 m distance from the sediment source to collect wind-eroded sediment at heights of 0.03, 0.10, 0.20, and 0.30 m. Three repetitions were conducted per test set with each respective sediment (sand/loam) and number of applied gusts (1, 3, 5). During 18 tests with applied gusts, a total of 72 samples were collected from sand and loam sediment (36 samples each). During 4 tests without gusts with 10 min duration, a total of 16 samples was collected (=4 heights × 4 tests × 2 sediments). The collected material was stored in the collectors (PET bottles) > 24 h in a thermo-constant room and weighed by means of precision scales. The eroded material (g) was calculated subtracting the weight of the collector before the experiment from the weight after the experiment. Erosion rates (g min−1) per height were calculated based on the measured material (g) and the mean duration of respective test. The data were primarily used to evaluate the vertical transport pattern during gusts.

2.4. Statistical Analysis

The wedgetrap-derived horizontal transport rates per test set were tested for normal distribution by means of the Shapiro–Wilk test. The homogeneity of variances was asserted using Levene’s test based on the median. Normally distributed test sets were tested by means of analysis of variance (ANOVA) and the Tukey HSD post hoc test to find statistically significant differences between applied gusts. A Pearson correlation analysis was performed to find significant correlations between horizontal transport, airstream parameters (weighted transport capacity Q, number of gusts, gust factor G, test duration, Umean, Umax), and sediment parameters (d50, percentage classes). Statistics were conducted with SPSS 27.0 [43]. MWAC-derived data for vertical distribution of eroded sediment were plotted in Microsoft Excel and trend lines, including coefficient of determination, R2, and formula, were derived to characterize vertical distribution.

3. Results and Discussion

3.1. Generation of Gusts and Steady Air Stream

One, three, and five gusts were applied for mean durations of 22, 33, and 40 s. The mean peak velocities Umax were 7.8, 9.1, and 8.4 m s−1 and mean wind velocities Umean were 1.8, 3.1, and 3.2 m s−1 (Table 1). The steady wind of comparison tests had a Umean of 6.4 m s−1 and was applied for 10 min. The mean gust factors G were 1.2 for steady wind, 4.3 for one gust, 2.9 for three gusts, and 2.6 for five gusts. Minimum velocities between gusts were 1.20 and 1.22 for one and three gusts and 1.82 for five gusts.
Considering gust generation, the setup was able to produce a faster velocity increase than solely the turning on and off of the motor could create. The peak velocity stayed the same for no gust and one gust (Umax 7.5 and 7.8 m s−1); thus, these tests only differed in their change in velocity. Gusts could be applied quite regularly despite slight rhythm changes. Maximum and minimum velocities changed slightly within as well as between the sequence groups (Figure 3). For one gust, the duration of the actual gust was 1–3 s while the fan needed some time to really stop. For one, three, and five gusts, the velocity did not reach 0 m s−1 during the gusts, but ca. 1.2 (one and three gusts) and 1.8 m s−1 (five gusts). Duration between gusts (gust duration) decreased from ca. 10 s (one gust) to ca. 7 s (three gusts) to 5.5 s during five gusts.
Velocity intermittency involves deviations from an average velocity over a given time which may range over several temporal and spatial scales. The velocity of the air stream is generally kept constant in order to generate a logarithmic profile and to prevent an additional interfering parameter. Among Zingg’s [44] criteria for portable wind tunnel design, No. 1. regards a steady air stream. Accordingly, field tests mostly rely on the application of a temporally and spatially homogeneous air stream including a logarithmic wind profile. The application of gusts in mobile wind tunnels was first requested by Raupach and Leys [45] to address the hysteresis regarding the higher shear stress that is needed for initiating compared to sustaining erosion. The authors tested but did not approve the turning vane system applied to their wind tunnel. The created gusts, at 1 s intervals, disturbed the boundary layer for the complete test sequence and decreased vertical turbulences and stress near the ground. In contrast to their approach, the setup presented here focuses on an even smaller temporal and spatial scale by creating a very limited space where the interaction of sediment and gust is located. The test duration was the duration of each respective gust sequence (22–40 s) in order to focus on the impact of gust and to minimize the impact of gustless periods. Apart from the inherent destruction of the tunnel’s logarithmic wind profile by a gust, the tests’ duration was too short for a reasonable measurement of a boundary layer for a steady [46] or gusty air stream [47]. The manual operation of the motor and of the metal sheet required the training of the involved persons. The mean velocity patterns of the gusts were partly related to the relatively high standard deviations per observed value (Figure 3), which is partly caused by the delayed fan reaction to motor shutoff, particularly affecting the end of each test. These irregularities influence the calculated parameters and the statistical analysis including these parameters and must be interpreted accordingly. A velocity measurement interval of 1 s seemed practicable for field application.
The comparison of gust tests with standard steady velocity tests is limited mainly due to the differing test durations leading to uncertainties related to the non-linearity of erosion and the response time to velocity changes. Other wind tunnel studies found the response to velocity changes was closely linked to velocity with a delay of 1 s [48]. Particle velocity reacted faster than the measured flux rate [5]. It was also found that the reaction of sand flow to changes in velocity was faster during the acceleration of air (2–3 s) than during the deceleration of air [49,50]. Since Butterfield [48] applied a much smaller difference between Umax and Umin of ca. 2.1 m s−1, it would be interesting to measure the sediment response to the much higher amplitudes employed in our setup (6.7 (one gust), 7.6 (three gusts), and 6.6 m s−1 (five gusts)). While the direct response of the sediment was invisible within the setup presented here, the total values of collected material show a high consistency over the conducted repetitions. In the experimental setup, gusts could be applied during a regular setup of 10 min to gain comparability to no-gust tests.

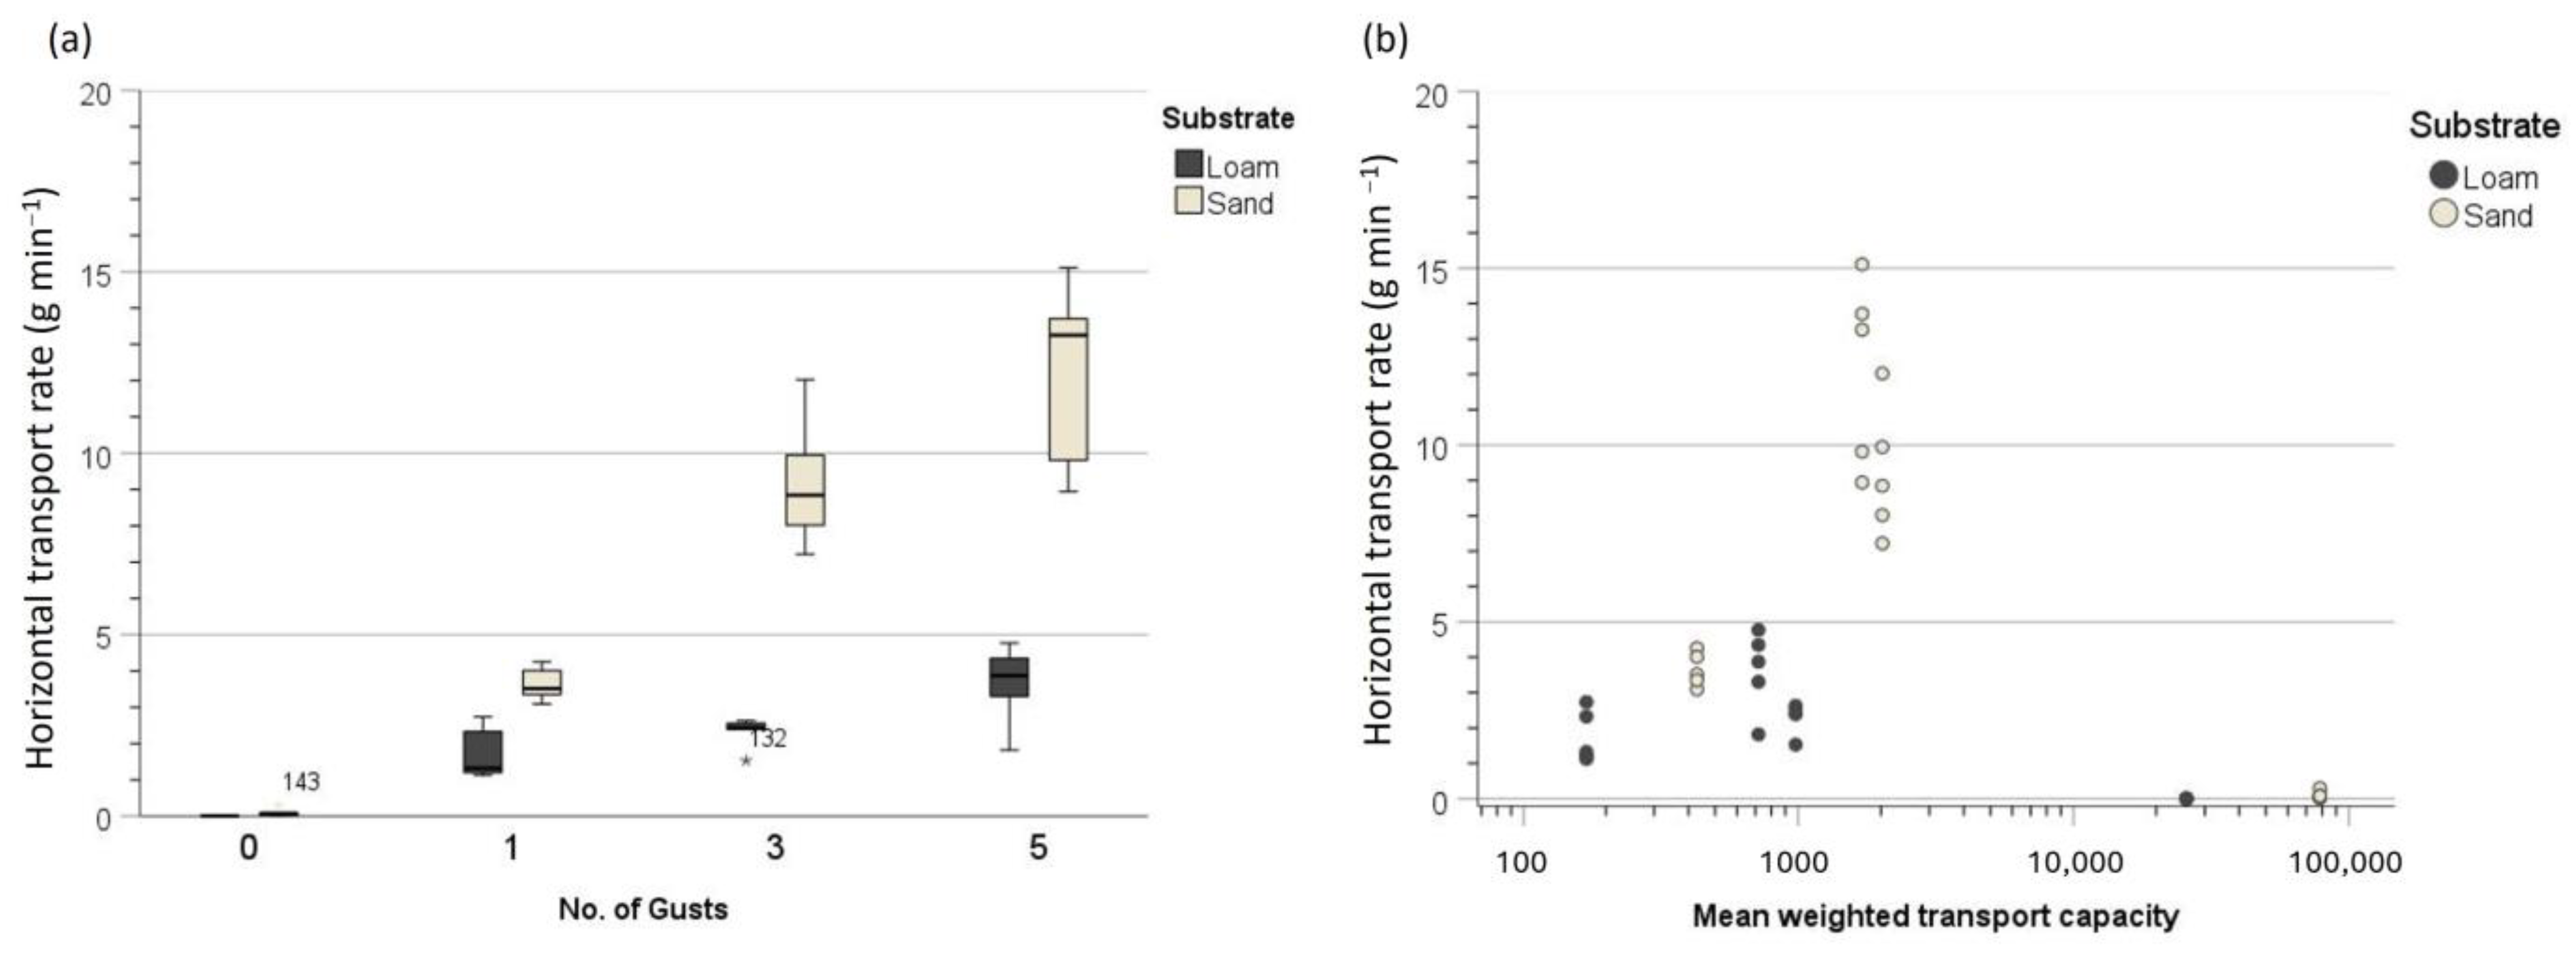
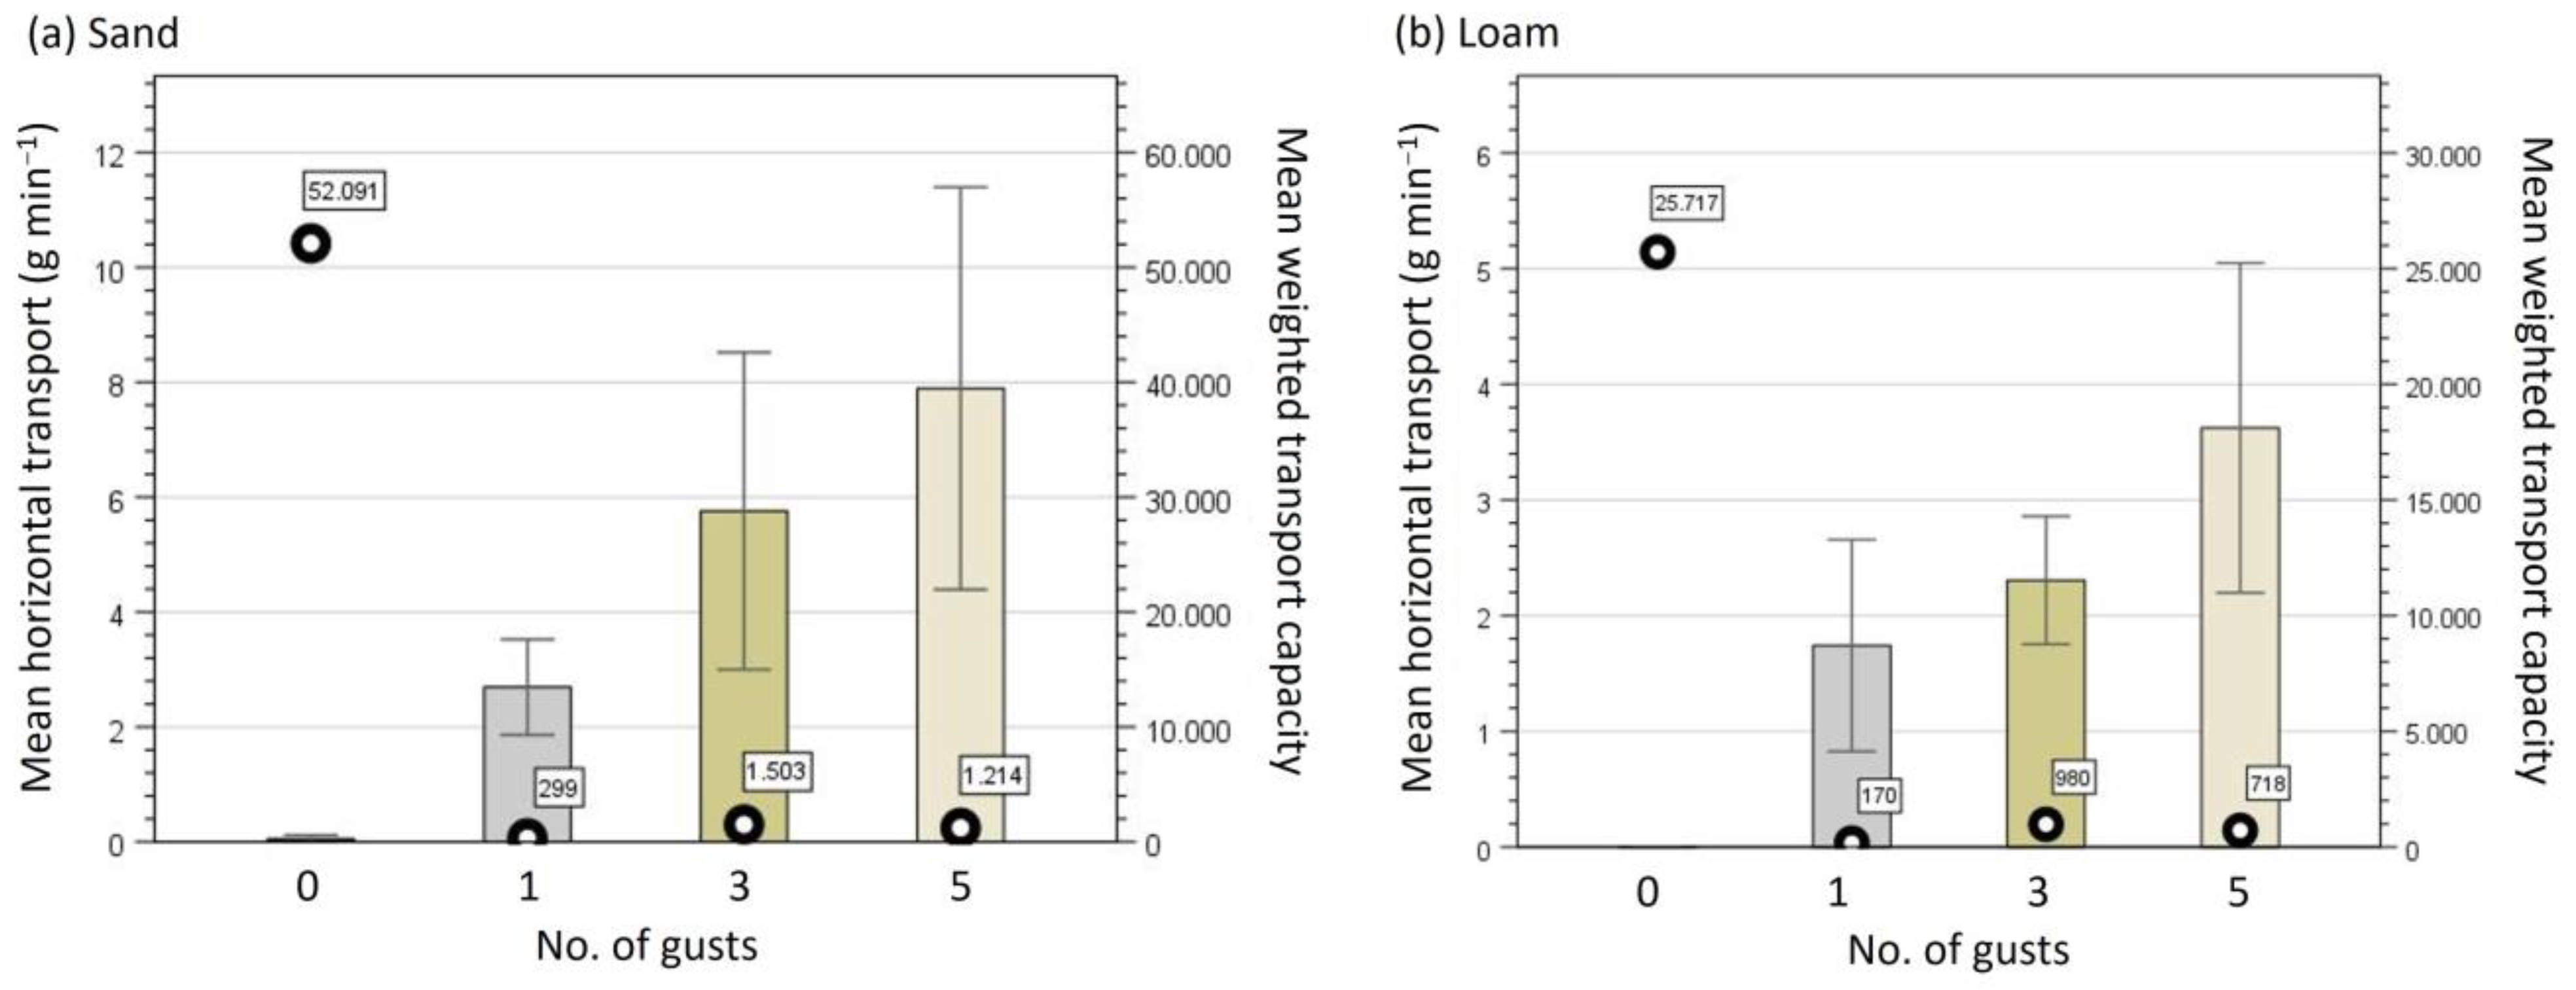
3.2. Horizontal Transport

Mean total eroded sediment and mean horizontal transport rate (g min−1) were higher with gusts compared to the no-gust test and generally higher in sand than in loam (Table 2). Compared with the steady air test without gusts, the rates were much higher in both sediments, with 0.10 and 0.002 g min−1 in sand and loam, respectively (Table 2). In sand, the mean erosion rate (g min−1) increased from no gust (0.10, SD 0.11) through one gust (3.65, SD 0.48) and three gusts (9.21, SD 1.87) to five gusts (12.17, SD 2.65). In loam, the mean erosion rate (g min−1) increased from no gust (0.002, SD 0.001) through one gust (1.74, SD 0.74) and three gusts (2.31, SD 0.45) to five gusts (3.62, SD 1.15).
The erosion rate was found to increase with an increasing number of applied gusts (Figure 4a). This result is in line with Butterfield [48], who measured the saltation of a uniform sand with a temporal resolution of 1 s during the application of an air stream with a sinusoidal velocity pattern. In contrast to the setup presented here, he maintained constant above-threshold velocity and added sand feeding. Only partly did the tests presented here have velocities beyond the sediment-specific threshold velocities. To define the potential erosivity of the applied air stream and gust, the weighted transport capacity was calculated.
The weighted transport capacity Q derived from wind velocity measurements passing respective Ut was highest by far during the no-gust test due to the steady wind velocity that was constantly beyond the Ut of both loam (25,717.5) and sand (78,465.1) (Table 1). It was thus theoretically erosive enough to constantly erode until supply limitation. The transport capacity was, at 169.7 and 980.4, the lowest for one gust with only two and three intervals beyond Ut for loam and sand, respectively. Transport capacity with three gusts was higher than that with five gusts, which was caused by the faster occurrence of the test sequence during manual gust application. Lower transport capacity did not result in lower horizontal transport rates (Figure 4b and Figure 5). Q showed the highest values during tests without gusts, but the horizontal transport rates were lowest for both sediments. Tests with one gust had the lowest Q values due to the very short total duration of U > Ut during the complete sequence (Figure 5). The values for three and five gusts were higher than during one-gust tests but an order of magnitude lower than the values during the 10 min tests with no gusts. While the Q values were higher for three gusts than for five gusts, horizontal transport increased from one gust to five gusts. Transport capacity could not sufficiently represent the actual horizontal transport, which shows the difficulties in characterizing the actual gust and its subsequent impact (erosivity) and may underline the impact of additional effects of gusts on entrainment beyond velocity.
The greatest impact on the horizontal transport rate compared to no-gust wind was observed with one applied gust, with factor 36.5 for sand and 870.0 for loam (Table 2). For sand, factors decreased with an increasing number of applied gusts (three gusts/one gust = 2.1 and five gusts/three gusts = 1.3). For loam, factors slightly increased from 1.3 to 1.6. Despite the above-mentioned uncertainties concerning the air stream, the results are very clear and consistent. The results for sand (0.100 vs. 3.65 g min−1 for no gusts and one gust) support field and laboratory tests on similar material and show that the same effect is found in aggregated loam (0.002 vs. 1.740 g min−1 for no gust and one gust).
Data for both sediment sets (sand, loam) were normally distributed (Shapiro–Wilk p > 0.05) and equal variances could be assumed after Levene’s test (p = 0.051). For all tests on sand, ANOVA found significant differences on the p < 0.001-level (Table 3). Tukey post hoc analysis showed a significant difference (p < 0.001) between eroded sediment and most of the applied numbers of gusts. The only exception was the difference between three and five gusts, which was not significant (p = 0.05). Mean erosion increased with the number of gusts.
Correlation analysis (Table 4) found the strongest correlation with significance of p < 0.001 and the only high loading (0.693) for the applied number of gusts. In the ranking, the sediment characteristic d50 with the second highest loading (0.515) was also found to be highly significant (p < 0.001), whereas mean velocity (Umean) and maximum velocity (Umax) were found significant (p < 0.008) but loaded lower. Gust factor loaded very low and with a lower significance (p > 0.047). A significant negative correlation was found for mean weighted transport capacity (−0.456) since the lowest horizontal transport rate was measured during the longest test without gusts.
The statistical analyses underline that the characteristics of gusts included here do not comprehensively explain the impact of the respective horizontal transport rates. The most pronounced relative impact was found for one gust on loam. This strongly supply-limited sediment was most effectively entrained by one gust and the accompanying turbulences, whereas a uniform air stream with a higher mean velocity (6.4 and 1.8 m s−1 for no gust and one gust) and a similar peak velocity (7.5 and 7.8 m s−1 for no gust and one gust) was hardly erosive. This may mostly be explained by the fact that the gusts entrained larger aggregates (ca. 50% aggregates > 0.84 mm). Even the consecutive gust sequences (three and five gusts) eroded much more material than a uniform air stream both in total and per minute of test duration (Table 2). This finding may reflect the characteristic impact of a gusty, turbulent air stream that entrains dust most effectively, although the action of this air stream is temporally and spatially very limited [12].

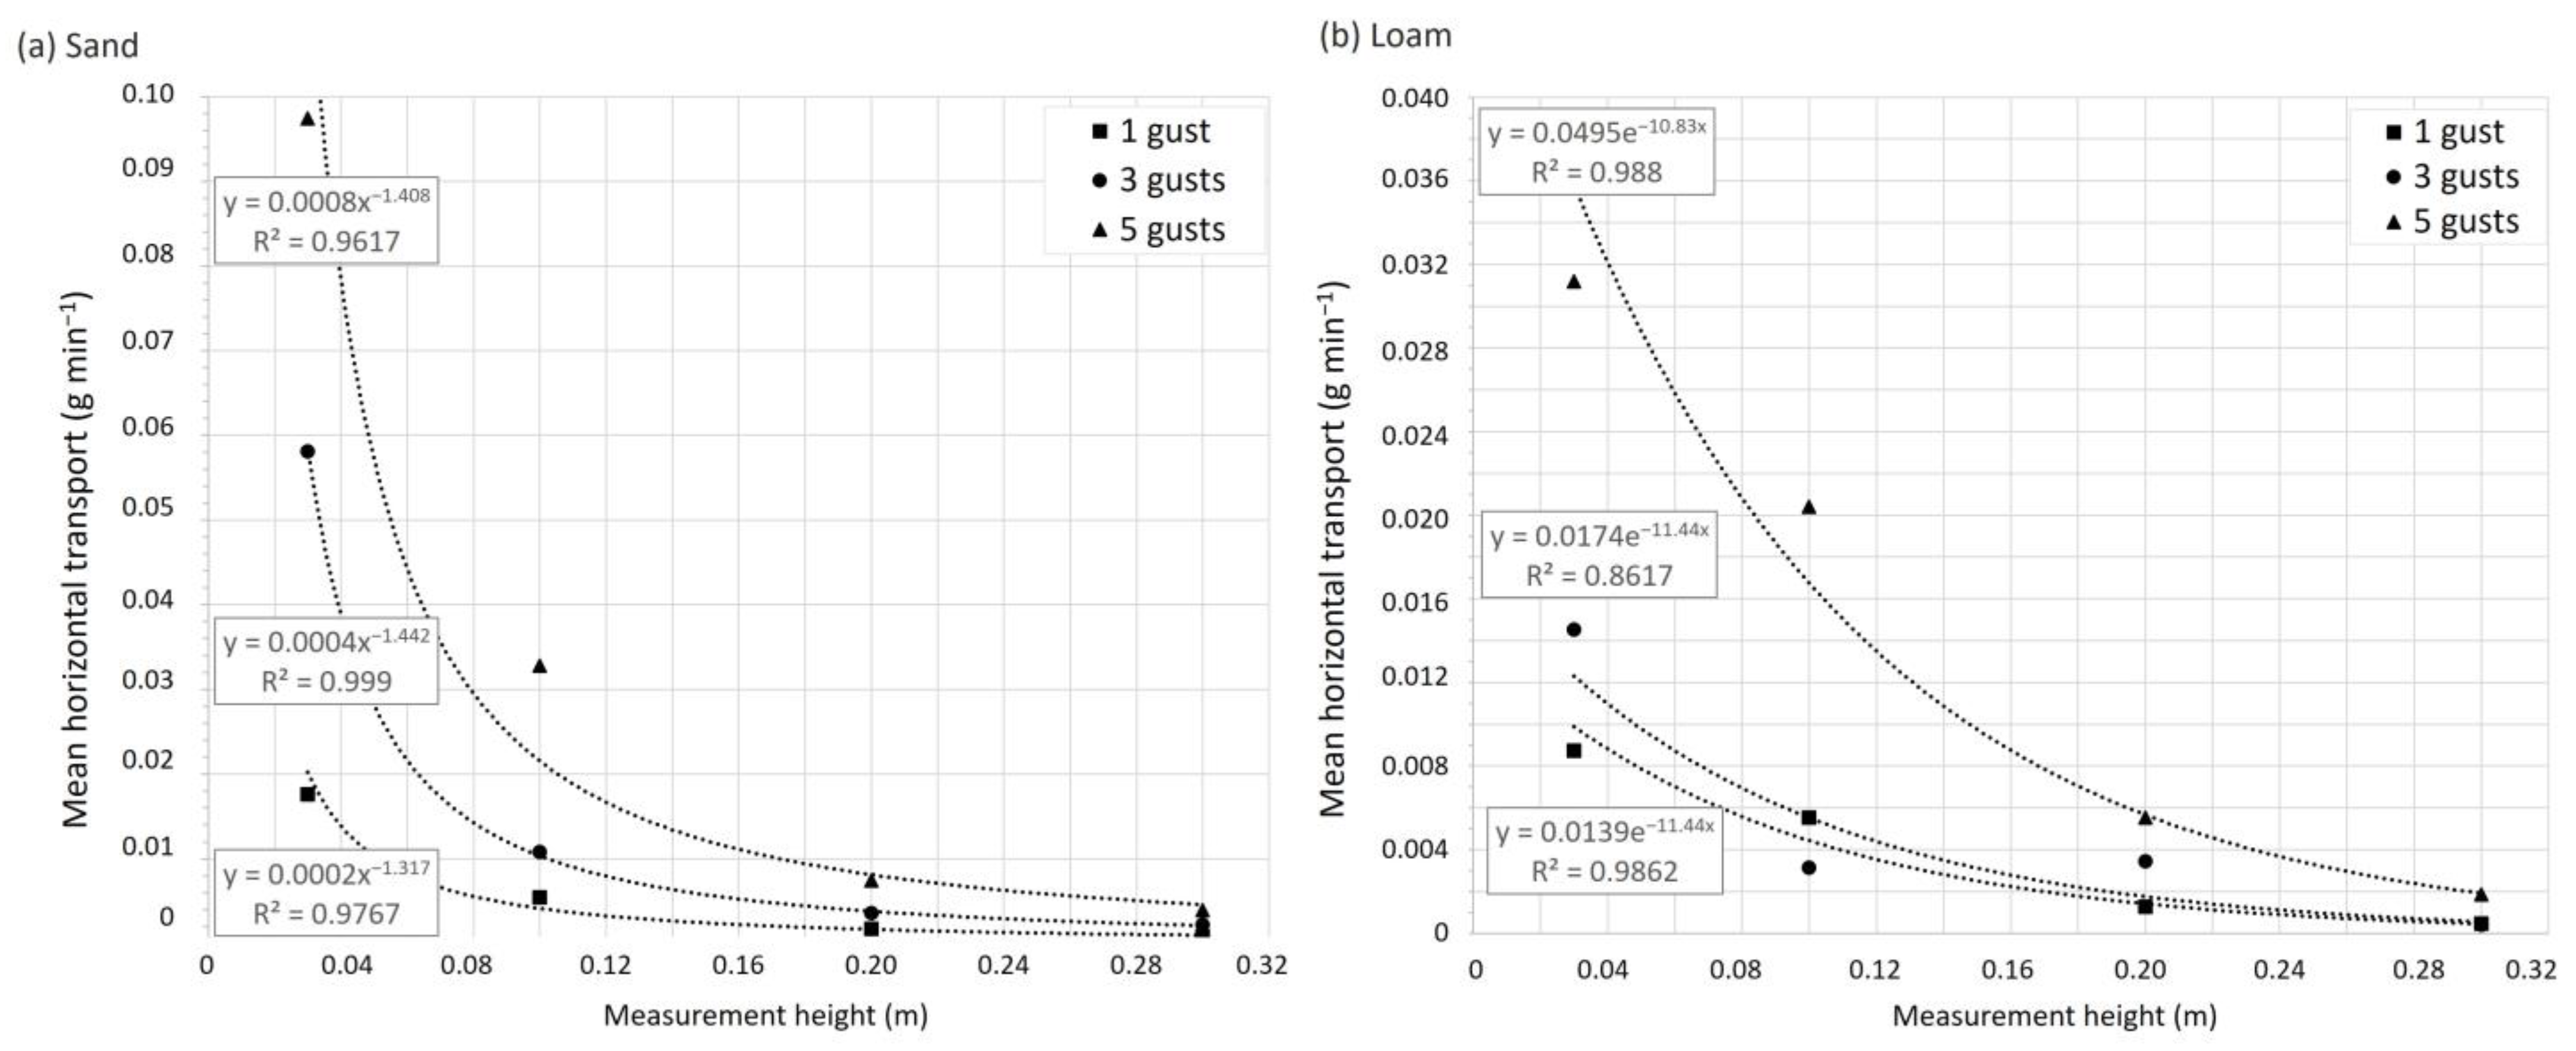
3.3. Vertical Distribution of Eroded Sediment

For gust tests, the rates of sediment collected per height decrease with height and increase with increasing number of gusts both on sand and loam (Figure 6). This distribution is clearer in sand than in loam. The highest rates were measured at 0.03 and the lowest rates at 0.30 m. For sand, the distribution for all gusts is described by a power function with R2 =0.98 for one gust, R2 = 0.99 for three gusts, and R2 = 0.96 for five gusts. For loam, exponential distributions fit best with R2 = 0.99 for one gust, R2 = 0.86 for three gusts, and R2 = 0.99 for five gusts. A linear distribution adequately approached the sediment collected from one-gust tests (R2 = 0.92) and three-gust tests (R2 = 0.94) on loam, which indicates a variation from the expected pattern. The vertical distribution of horizontal transport supports an adequate test setup, including data acquisition by the expected decrease in collected sediment with height.
The results suggest that the initial effects of gusts were achieved: a spatially and temporally very narrow transfer of high-momentum flux and the corresponding creation of areas of strong shear stress on the sediment surface. The setup may be considered useful because it provides an insight into the soil surface’s reaction to an irregular but powerful erosion trigger which cannot be investigated by a regular wind tunnel setup with a steady airstream. The application may particularly be an additional option in environments where aeolian processes are obvious on site but the regular (steady) wind tunnel setup does not induce them. To increase the informative power for a given region or site, specific gust patterns could be defined from recent or past environmental conditions and simulated accordingly. The investigation and quantification of detachment and transport under specific gusts may support the understanding of sand dune development as well as paleo-environmental aeolian processes. Further studies including a larger sediment source could be conducted to investigate the formation and development of aeolian surface structures during gusts.

4. Conclusions

The first research aim was to test a simple technique to generate gusts during a field test setup of a mobile wind tunnel.
The created gusts should be clearly defined in terms of the suddenness of velocity increase as well as by a variation in velocity between the peak and the average of at least 5.00 m s−1. The application of gusts in the mobile wind tunnel proved feasible but was related to uncertainties concerning the applied air stream. Its reliability and reproducibility seemed adequate for one gust but decreased with an increasing number of gusts. Thus, for field application, a no-gust and one-gust sequence should be combined. The setup may be a valuable addition to gain information about this temporally and spatially limited phenomenon. Application of gusts may also be combined with the application of a rain module (wind and rainfall simulator). An advantage of the mobile tunnel setup was the option to modify the structure of the tunnel since it is flexible to some extent, which is not possible in most stationary wind tunnels.
The second research aim was the investigation of the impact of gusts on the entrainment of two sediments. In contrast to tests with a saltation layer, a very local and instantaneous impact was measured. Horizontal transport rates ranged several scales higher for sand and particularly for loam compared with the usually applied wind with constant above-threshold velocity. The rate of sediment erosion increased with the number of applied gusts for both sediments. The number of applied gusts and sediment type correlated best with erosion rates during the tests but did not explain the impact sufficiently. The weighted transport capacity did not align well with the impact of one gust in contrast to a steady wind of a longer duration. This possibly underlines the additional effects of gusts on particle entrainment beyond velocity and hints at a processual scale jump. The clear and consistent results indicate strong effects related to singular gusts and should be tested in further studies.

Funding

This research received no external funding.

Data Availability Statement

The original contributions presented in the study are included in the article, further inquiries can be directed to the corresponding authors.

Conflicts of Interest

The author declares no conflicts of interest.

References

  1. Sherman, D.J. Understanding Wind-Blown Sand: Six Vexations. Geomorphology 2020, 366, 107193. [Google Scholar] [CrossRef]
  2. Stout, J.E.; Zobeck, T.M. The Wolfforth Field Experiment: A Wind Erosion Study. Soil Sci. 1996, 161, 616–632. [Google Scholar] [CrossRef]
  3. Anderson, R.S.; Haff, P.K. Wind Modification and Bed Response during Saltation of Sand in Air. In Proceedings of the Aeolian Grain Transport 1; Barndorff-Nielsen, O.E., Willetts, B.B., Eds.; Springer: Vienna, Austria, 1991; pp. 21–51. [Google Scholar]
  4. Andreotti, B. A Two-Species Model of Aeolian Sand Transport. J. Fluid Mech. 2004, 510, 47–70. [Google Scholar] [CrossRef]
  5. Li, B.; McKenna Neuman, C. A Wind Tunnel Study of Aeolian Sediment Transport Response to Unsteady Winds. Geomorphology 2014, 214, 261–269. [Google Scholar] [CrossRef]
  6. Wyngaard, J.C. Atmospheric Turbulence. Annu. Rev. Fluid Mech. 1992, 24, 205–234. [Google Scholar] [CrossRef]
  7. Mohr, S.; Kunz, M.; Richter, A.; Ruck, B. Statistical Characteristics of Convective Wind Gusts in Germany. Nat. Hazards Earth Syst. Sci. 2017, 17, 957–969. [Google Scholar] [CrossRef]
  8. WMO. Guide to Instruments and Methods of Observation; WMO: Geneva, Switzerland, 2018. [Google Scholar]
  9. Suomi, I.; Lüpkes, C.; Hartmann, J.; Vihma, T.; Gryning, S.-E.; Fortelius, C. Gust Factor Based on Research Aircraft Measurements: A New Methodology Applied to the Arctic Marine Boundary Layer. Q. J. R. Meteorol. Soc. 2016, 142, 2985–3000. [Google Scholar] [CrossRef]
  10. Bagnold, R.A. The Physics of Blown Sand and Desert Dunes; William Morrow: New York, NY, USA, 1941. [Google Scholar]
  11. Shao, Y. Physics and Modelling of Wind Erosion; Springer: Berlin/Heidelberg, Germany, 2008; Volume 37. [Google Scholar]
  12. Klose, M.; Shao, Y. Large-Eddy Simulation of Turbulent Dust Emission. Aeolian Res. 2013, 8, 49–58. [Google Scholar] [CrossRef]
  13. Baas, A.C.W.; Sherman, D.J. Formation and Behavior of Aeolian Streamers. J. Geophys. Res. Earth Surf. 2005, 110. [Google Scholar] [CrossRef]
  14. Davidson-Arnott, R.G.D.; MacQuarrie, K.; Aagaard, T. The Effect of Wind Gusts, Moisture Content and Fetch Length on Sand Transport on a Beach. Geomorphology 2005, 68, 115–129. [Google Scholar] [CrossRef]
  15. Jackson, D.W.T.; McCloskey, J. Preliminary Results from a Field Investigation of Aeolian Sand Transport Using High Resolution Wind and Transport Measurements. Geophys. Res. Lett. 1997, 24, 163–166. [Google Scholar] [CrossRef]
  16. De Oro, L.A.; Buschiazzo, D.E. Threshold Wind Velocity as an Index of Soil Susceptibility to Wind Erosion under Variable Climatic Conditions. Land Degrad. Dev. 2009, 20, 14–21. [Google Scholar] [CrossRef]
  17. Lee, J.A. A Field Experiment on the Role of Small Scale Wind Gustiness in Aeolian Sand Transport. Earth Surf. Process. Landf. 1987, 12, 331–335. [Google Scholar] [CrossRef]
  18. Pfeifer, S.; Schönfeldt, H.-J. The Response of Saltation to Wind Speed Fluctuations. Earth Surf. Process. Landf. 2012, 37, 1056–1064. [Google Scholar] [CrossRef]
  19. Siegmund, N.; Panebianco, J.E.; Avecilla, F.; Iturri, L.A.; Sommer, M.; Buschiazzo, D.E.; Funk, R. From Gustiness to Dustiness—The Impact of Wind Gusts on Particulate Matter Emissions in Field Experiments in La Pampa, Argentina. Atmosphere 2022, 13, 1173. [Google Scholar] [CrossRef]
  20. Bisal, F.; Nielsen, K. Movement of Soil Particles in Saltation. Can. J. Soil Sci. 1962, 42, 81–86. [Google Scholar] [CrossRef]
  21. Lyles, L.; Krauss, R.K. Threshold Velocities and Initial Particle Motion as Influenced by Air Turbulence. Trans. ASAE 1971, 14, 563–566. [Google Scholar] [CrossRef]
  22. Martin, R.L.; Kok, J.F. Wind-Invariant Saltation Heights Imply Linear Scaling of Aeolian Saltation Flux with Shear Stress. Sci. Adv. 2017, 3, e1602569. [Google Scholar] [CrossRef] [PubMed]
  23. Anderson, R.S.; Haff, P.K. Simulation of Eolian Saltation. Science 1988, 241, 820–823. [Google Scholar] [CrossRef]
  24. Shao, Y.; Lu, H. A Simple Expression for Wind Erosion Threshold Friction Velocity. Geophys. Res. 2000, 105, 22437–22443. [Google Scholar] [CrossRef]
  25. Stout, J.E. Effect of Averaging Time on the Apparent Threshold for Aeolian Transport. J. Arid Environ. 1998, 39, 395–401. [Google Scholar] [CrossRef]
  26. Funk, R.; Völker, L.; Deumlich, D. Landscape Structure Model Based Estimation of the Wind Erosion Risk in Brandenburg, Germany. Aeolian Res. 2023, 62, 100878. [Google Scholar] [CrossRef]
  27. DWD. Wetter Und Klima—Deutscher Wetterdienst–Glossar–B–Bö. Available online: https://www.dwd.de/DE/service/lexikon/Functions/glossar.html?lv3=100488&lv2=100310 (accessed on 13 December 2023).
  28. Stout, J.E.; Zobeck, T.M. Intermittent Saltation. Sedimentology 1997, 44, 959–970. [Google Scholar] [CrossRef]
  29. Sterk, G.; Jacobs, A.F.G.; Van Boxel, J.H. The Effect of Turbulent Flow Structures on Saltation Sand Transport in the Atmospheric Boundary Layer. Earth Surf. Process. Landf. 1998, 23, 877–887. [Google Scholar] [CrossRef]
  30. Marzen, M.; Iserloh, T.; De Lima, J.L.M.P.; Ries, J.B. The Effect of Rain, Wind-Driven Rain and Wind on Particle Transport under Controlled Laboratory Conditions. Catena 2016, 145, 47–55. [Google Scholar] [CrossRef]
  31. Marzen, M.; Kirchhoff, M.; Marzolff, I.; Aït Hssaine, A.; Ries, J.B. Relative Quantification of Wind Erosion in Argan Woodlands in the Souss Basin, Morocco. Earth Surf. Process. Landf. 2020, 45, 3808–3823. [Google Scholar] [CrossRef]
  32. Marzen, M.; Kirchhoff, M.; Aït Hssaine, A.; Ries, J.B. Wind Tunnel Tests Reveal Aeolian Relocation Processes Related to Land Cover and Surface Characteristics in the Souss Basin, Morocco. Land 2023, 12, 40. [Google Scholar] [CrossRef]
  33. Fister, W.; Iserloh, T.; Ries, J.B.; Schmidt, R.-G. A Portable Wind and Rainfall Simulator for in Situ Soil Erosion Measurements. Catena 2012, 91, 72–84. [Google Scholar] [CrossRef]
  34. Wirtz, S.; Iserloh, T.; Marzen, M.; Fister, W. Chapter 8 Experimental FIeld Methods to Quantify Soil Erosion by Water and Wind-Driven Rain. In Field Measurement Methods in Soil Science; Wessel-Bothe, S., Weihermüller, L., Eds.; Gebr. Borntraeger Science Publishers: Königsberg, Germany, 2020; pp. 165–190. ISBN 978-3-443-01109-3. [Google Scholar]
  35. Iserloh, T.; Fister, W.; Marzen, M.; Seeger, M.; Kuhn, N.J.; Ries, J.B. The Role of Wind-Driven Rain for Soil Erosion—An Experimental Approach. Z. Geomorphol. Suppl. 2013, 57, 193–201. [Google Scholar] [CrossRef]
  36. Marzen, M.; Iserloh, T.; De Lima, J.L.M.P.; Fister, W.; Ries, J.B. Impact of Severe Rain Storms on Soil Erosion: Experimental Evaluation of Wind-Driven Rain and Its Implications for Natural Hazard Management. Sci. Total Environ. 2017, 590–591, 502–513. [Google Scholar] [CrossRef] [PubMed]
  37. Fryrear, D.W.; Saleh, A.; Bilbro, J.D.; Schomberg, H.M.; Stout, J.E.; Zobeck, T.M. Revised Wind Erosion Equation (RWEQ); Technical Bulletin 1 1998; USDA, Agricultural Research Service: Washington, DC, USA, 1998. [Google Scholar]
  38. Owen, P.R. Saltation of Uniform Grains in Air. J. Fluid Mech. 1964, 20, 225–242. [Google Scholar] [CrossRef]
  39. Köhn, M. Korngrößenanalyse Vermittels Pipettenanalyse. Tonind.-Ztg. 1929, 53, 729–731. [Google Scholar]
  40. Wilson, S.J.; Cooke, R.U. Wind Erosion. In Soil Erosion; Kirkby, M.J., Morgan, R.P.C., Eds.; Wiley: Chichester, UK, 1980; pp. 217–251. [Google Scholar]
  41. Goossens, D. Dry Aeolian Dust Accumulation in Rocky Deserts: A Medium-Term Field Experiment Based on Short-Term Wind Tunnel Simulations. Earth Surf. Process. Landf. 2000, 25, 41–57. [Google Scholar] [CrossRef]
  42. Goossens, D.; Nolet, C.; Etyemezian, V.; Duarte-Campos, L.; Bakker, G.; Riksen, M. Field Testing, Comparison, and Discussion of Five Aeolian Sand Transport Measuring Devices Operating on Different Measuring Principles. Aeolian Res. 2018, 32, 1–13. [Google Scholar] [CrossRef]
  43. IBM Corp. IBM SPSS Statistics for Windows, version 27.0; Released 2020; IBM Corp.: Armonk, NY, USA, 2020. [Google Scholar]
  44. Zingg, A.W. A Portable Wind Tunnel and Dust Collector Developed to Evaluate the Erodibility of Field Surfaces. Agron. J. 1951, 43, 189–191. [Google Scholar] [CrossRef]
  45. Raupach, M.R.; Leys, J.F. Aerodynamics of a Portable Wind Erosion Tunnel for Measuring Soil Erodibility by Wind. Soil Res. 1990, 28, 177–191. [Google Scholar] [CrossRef]
  46. Greeley, R.; Iversen, J.D. Wind as a Geological Process: On Earth, Mars, Venus and Titan; CUP Archive: Cambridge, UK, 1987; ISBN 978-0-521-35962-7. [Google Scholar]
  47. Gregory, J.M.; Wilson, G.R.; Singh, U.B.; Darwish, M.M. TEAM: Integrated, Process-Based Wind-Erosion Model. Environ. Model. Softw. 2004, 19, 205–215. [Google Scholar] [CrossRef]
  48. Butterfield, G.R. Transitional Behaviour of Saltation: Wind Tunnel Observations of Unsteady Winds. J. Arid Environ. 1998, 39, 377–394. [Google Scholar] [CrossRef]
  49. Butterfield, G.R. Grain Transport Rates in Steady and Unsteady Turbulent Airflows. In Proceedings of the Aeolian Grain Transport 1; Barndorff-Nielsen, O.E., Willetts, B.B., Eds.; Springer: Vienna, Austria, 1991; pp. 97–122. [Google Scholar]
  50. Spies, P.-J.; McEwan, I.K.; Butterfield, G.R. One-Dimensional Transitional Behaviour in Saltation. Earth Surf. Process. Landf. 2000, 25, 505–518. [Google Scholar] [CrossRef]
Figure 1. Experimental setup for gust tests inside the mobile wind tunnel test section (MWACs = modified Wilson and Cooke sampler).
Geographies 04 00013 g001
Figure 2. Characteristics of sediments: (a) sand, (b) loam, (c) cumulative particle size distribution.
Geographies 04 00013 g002
Figure 3. Mean velocities for (a) 1 gust, (b) 3 gusts, (c) 5 gusts, (d) 0 gusts with standard deviation for each measurement point.
Geographies 04 00013 g003
Figure 4. Horizontal transport rate for both sediments in relation to (a) number of gusts and (b) weighted transport capacity Q = (U − Ut) × U2. Asterisks mark extreme values.
Geographies 04 00013 g004
Figure 5. Mean horizontal transport (bar) and mean weighted transport capacity (circle) of wind on (a) sand and (b) loam sediment.
Geographies 04 00013 g005
Figure 6. Vertical distribution of mean horizontal transport values for heights 0.03, 0.10, 0.20 and 0.30 m on (a) sand sediment and (b) loam sediment.
Geographies 04 00013 g006
Table 1. Characteristics of air stream and gusts.
No. GustsTest Duration (s)Gust Duration (s) *Umax (m s−1)Umean (m s−1)Gust FactorTransport Capacity Q (Dimensionless)
SandLoam
0600-7.56.41.278,465.125,717.5
12210.07.81.84.3980.4169.7
3337.19.13.12.92024.6980.4
5405.58.43.22.61709.9718.4
* Gust duration = period between 2 minimum velocities Umin; U = velocity.
Table 2. Quantities and rates of eroded sediment for different sediments and gusts.
No. of GustsSandLoam
Mean TotalMean RateDifference to Preceding SequenceMean TotalMean RateDifference to Preceding Sequence
(g)(g min−1)(Factor)(g)(g min−1)(Factor)
01.0100.100 0.0230.002
11.3403.650×36.50.6391.740×870.0
35.0709.210×2.51.2682.310×1.3
58.11012.170×1.32.4153.620×1.6
Table 3. Results of ANOVA for horizontal transport—number of gusts.
Horizontal Transport (g min−1)Sum of SquaresdfMean SquareFSig.
SandBetween Groups441.7103147.23754.646<0.001
Within Groups43.110162.694
Total484.81919
LoamBetween Groups33.781311.26021.892<0.001
Within Groups8.230160.514
Total42.01119
Table 4. Pearson correlation analysis for horizontal transport for all tests.
Pearson CorrelationNo. of GustsTransport Capacityd50UmaxUmeanGust Factor
HorizontalCor.coefficient0.693 **−0.456 **0.515 **0.412 **0.427 **0.316 *
transportSig. (2-tailed)<0.0010.003<0.0010.0080.0060.047
Number404040404040
Correlation is significant on 0.01 (**) or 0.05 (*) level.
Disclaimer/Publisher’s Note: The statements, opinions and data contained in all publications are solely those of the individual author(s) and contributor(s) and not of MDPI and/or the editor(s). MDPI and/or the editor(s) disclaim responsibility for any injury to people or property resulting from any ideas, methods, instructions or products referred to in the content.

