Article

Geovisualization: A Practical Approach for COVID-19 Spatial Analysis

by
Petr Iakovlevitch Ekel
1,2,*,
Sandro Laudares
1,*,
Adriano José de Barros
1,
Douglas Alexandre Gomes Vieira
3,4,
Carlos Augusto Paiva da Silva Martins
1 and
Matheus Pereira Libório
1,3
1
Departments of Computer Science and Geography, Pontifical Catholic University of Minas Gerais, Belo Horizonte 30535-000, Brazil
2
Advanced System Optimization Technologies—Asotech, Belo Horizonte 30380-002, Brazil
3
Handcrafted Technologies—Engenharia Assistida Por Computador (ENACOM), Belo Horizonte 31275-100, Brazil
4
Graduate Program in Mathematical Modeling, Federal Center of Technological Education of Minas Gerais, Belo Horizonte 30421-169, Brazil
*
Authors to whom correspondence should be addressed.
Geographies 2023, 3(4), 763-778; https://doi.org/10.3390/geographies3040041
Submission received: 19 September 2023 / Revised: 8 November 2023 / Accepted: 14 November 2023 / Published: 4 December 2023

Abstract

:
Web Geographic Information Systems (WebGISs) were widely used to monitor COVID-19 cases and deaths during the pandemic. Furthermore, geotechnologies were also very useful in education, public management, tourism, and other areas. Although there are WebGISs with a high level of sophistication, most are simple, consisting of geovisualizers of cases, deaths, and vaccinations. This study develops a WebGIS that offers information about age, comorbidities, and tests, which can be analyzed from specific points such as hospitals, main access roads, regions, or neighborhoods. Although it is not a highly sophisticated solution, the WebGIS developed in this study is especially useful for municipal governments in developing countries like Brazil that do not have patient health data in geographic databases. The WebGIS developed in this study offers public managers essential information for developing effective public policies to combat the COVID-19 pandemic and other epidemiological phenomena such as dengue and malaria.

1. Introduction

Geovisualization has proven to be a valuable and efficient tool for understanding, monitoring, and controlling the spread of COVID-19 in several countries [1,2]. Web Geographic Information Systems (WebGIS) provide mostly simple information such as the location of cases, death counts, and number of vaccinations [3]. Many existing WebGISs are not functional for all countries, especially in developing countries [4].
The review of the literature on COVID-19 geovisualization contained in sixty papers shows that the level of geotechnologies implemented in Brazil is much lower compared to other countries [5]. This geotechnological gap suggests that Brazilian public policies for monitoring, controlling, and reducing the spread of the pandemic are less effective than in countries that have implemented more sophisticated geotechnologies. Furthermore, this discovery suggests that other countries, such as Brazil, are not exploring the full potential of geotechnologies developed worldwide. The concentration of WebGISs developed by researchers from the United States and European countries also suggests that developing countries face additional difficulties in developing their own geotechnologies. WebGIS relies on geographic data that are not always available for developing countries, requiring additional data retrieval efforts [6,7]. Therefore, this lack of geovisualization technologies to monitor the time-space dynamics of the pandemic in developing countries creates possibilities for new fronts of investigation.
The objective of this study is to develop a geotechnology that provides public managers in any country in the world easy-to-interpret and current data about the pandemic. In other words, the study offers a geotechnology that enhances monitoring and control actions for the evolution of the pandemic, which contribute to the development of more efficient public policies to combat COVID-19. In particular, this solution consists of a WebGIS, which deals with spatial and temporal information about COVID-19. The functionalities and contributions of this WebGIS to combat COVID-19 are demonstrated based on the case of a city in Brazil.
These research results contribute to the literature in three ways. First, they deepen and expand the literature related to the use of geotechnologies in combating the COVID-19 pandemic, offering a general overview of the literature and bringing together information about the technological level of existing WebGISs, which countries mostly develop WebGISs, and what are the main science areas and journals associated with the theme. Second, it reveals how to develop a WebGIS from databases without geographic information, offering an example for WebGIS developers from developing countries that face difficulties in obtaining spatial data. Third, it fills the gap pertaining to geovisualization technologies focused on the Brazilian scenario that are capable of dealing with information from different types of pandemics (e.g., dengue and yellow fever), increasing the efficiency of public policies to combat these pandemics [8,9].
The remainder of this study is organized as follows. Section 2 reviews the literature on COVID-19 geovisualization in the world and Brazil. Section 3 provides details on the materials and methods used in developing the solution. Section 4 analyzes and discusses the results. Section 5 presents the final considerations of the study, including its limitations and future research.

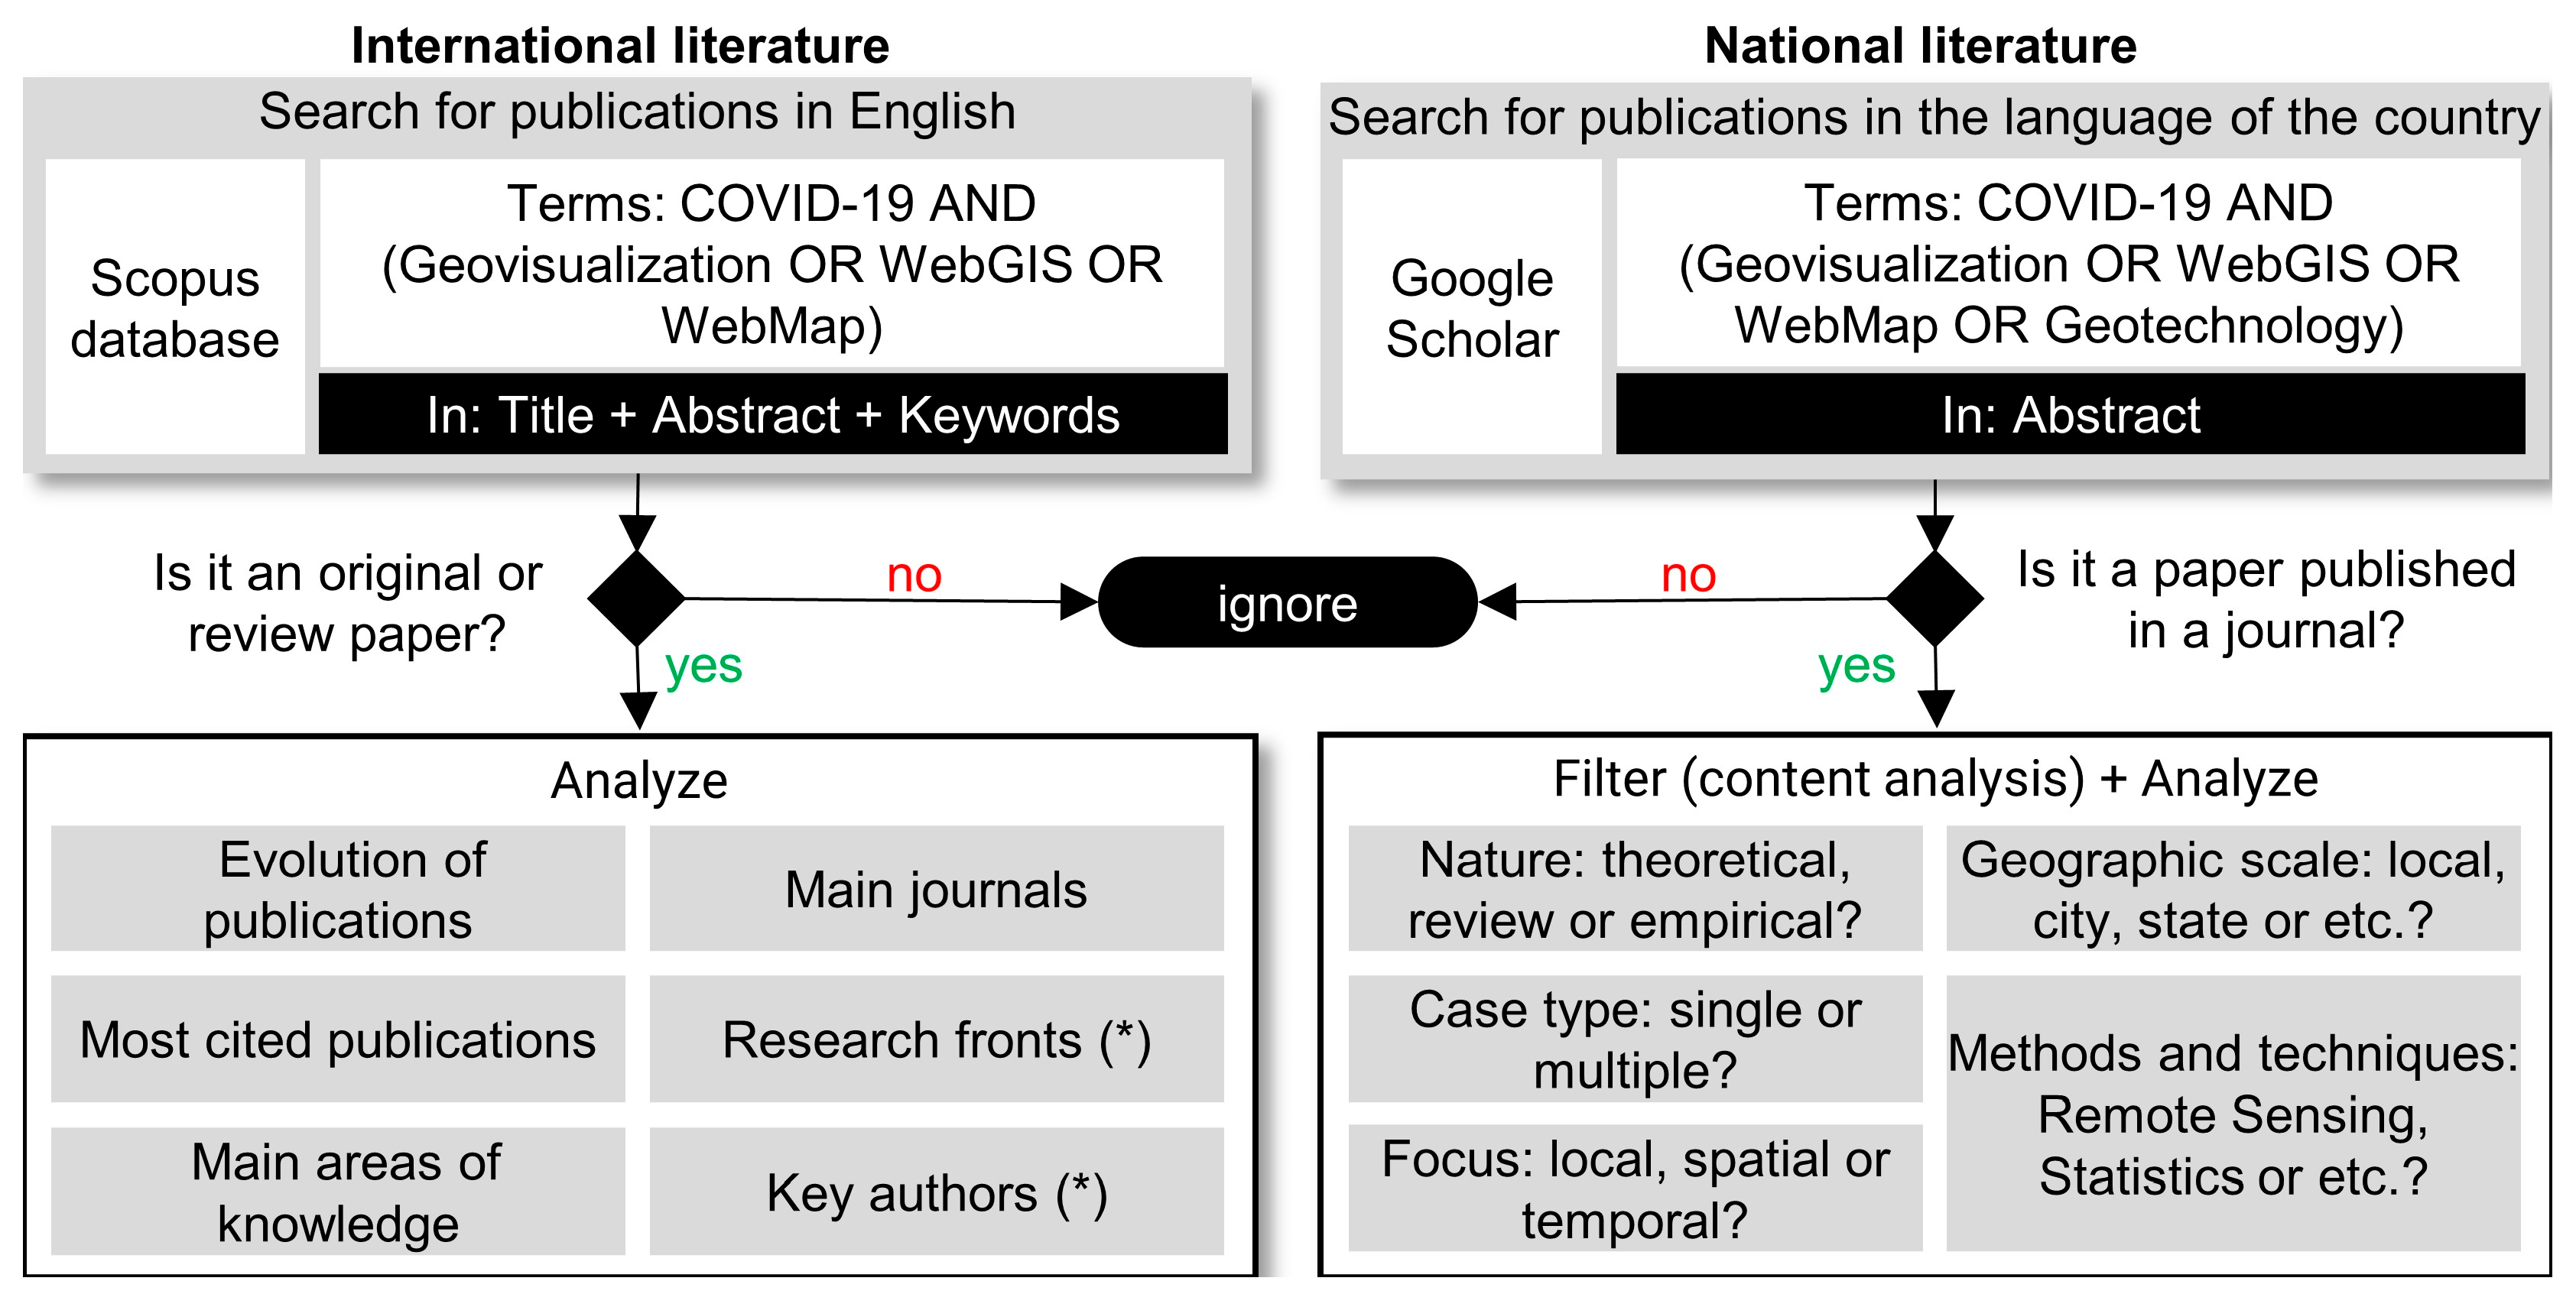
2. Literature Review

The literature review on the geovisualization of COVID-19 was based on two databases: Scopus and Google Scholar. The former was used to search international publications. The latter was used to search national publications. The search for national literature was carried out using terms in Portuguese, such as “Geovisualização” and “Geotecnologia” instead of Geovisualization and Geotechnologies. The search was performed on 25 October 2023, according to the parameters shown in Figure 1. Terms with spaces, e.g., Web GIS, were also considered.
The restrictive search strategy used in this study allows to obtain papers highly aligning with the search objective, while at the same time, it does not capture all of the literature of interest. This strategy is inappropriate for systematic literature reviews, and it is recommended to draw a general overview of the literature to support applied studies [11]. An example of the limitation of this strategy is WebGIS, developed by Zhou et al. [12], to analyze spatio-temporal patterns of human mobility during the COVID-19 pandemic. The search did not capture this paper because it does not explicitly mention the terms WebGIS, Webmap, or Geovisualization in the title, abstract, or keywords.
It is important to highlight that the restrictive search strategy for the national literature is little known. To perform this, the researcher must configure Google Scholar to return only papers in the language of interest. To restrict the search to the paper’s abstract, the researcher must sort the results by date and then select the “abstract” option [11].

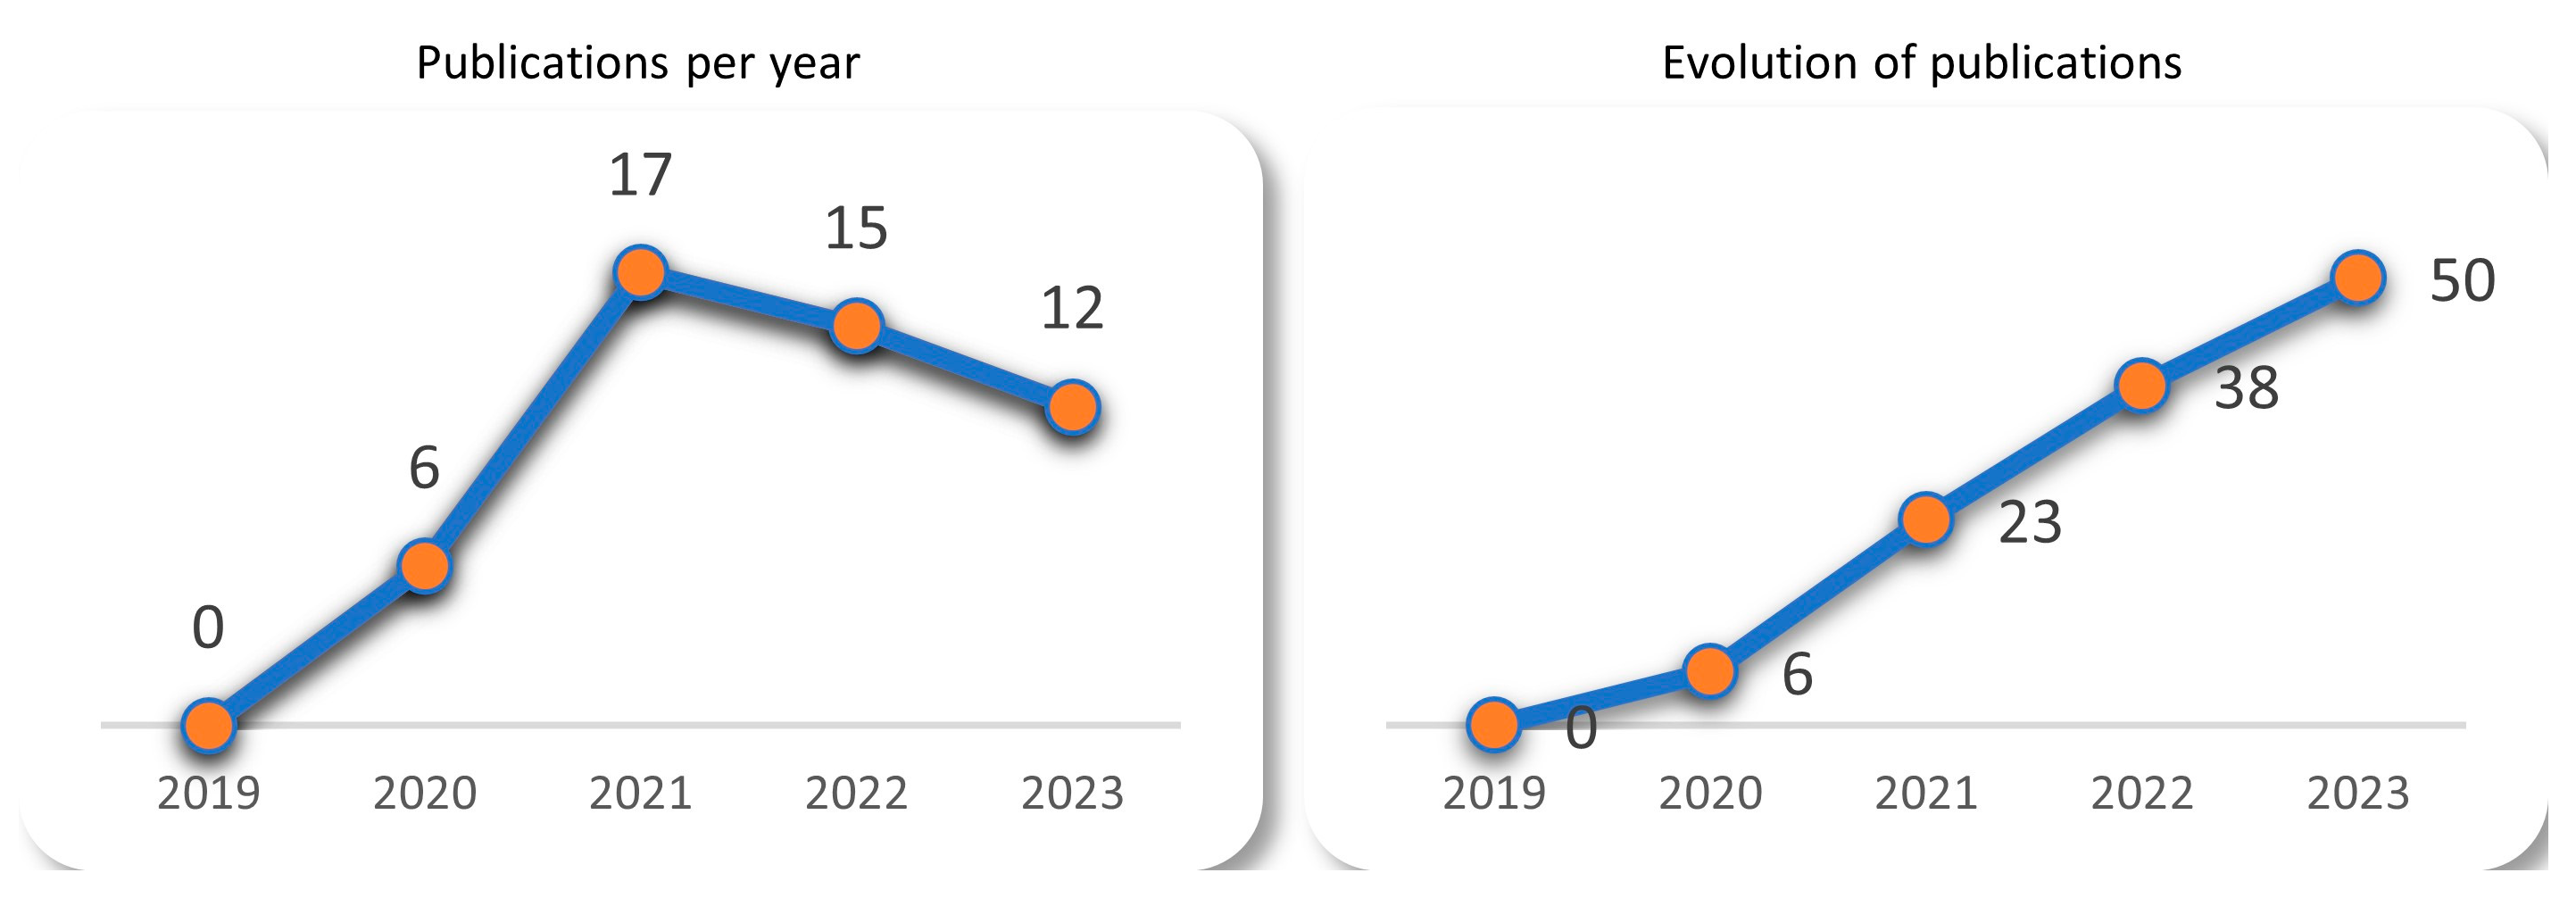
2.1. Geovisualization of COVID-19 in the International Literature

The search for the international literature on COVID-19 geovisualization in the Scopus database on 25 October 2023, using the parameters set in Figure 1, retrieved thirty-three articles. This number cannot be considered low for several reasons. First, the geovisualization of COVID-19 is a novel and highly specific topic. The initial publications on the topic occurred in 2020, with most research being published in 2021 (see Figure 2). Second, many papers do not explicitly cite the search terms in the title, abstract, and keywords. Therefore, the results presented in this study offer a general overview of the literature and are not intended to offer an exact portrait of the state-of-the-art, as is offered by the systematic literature reviews presented by Lan et al. [1] and Ahasan et al. [2].
Figure 2 shows that the emergence of virus mutations [13] and new research fronts, such as the geographic relationship between vaccination and cases of COVID-19 [14], continue to foster research on the geovisualization of COVID-19.

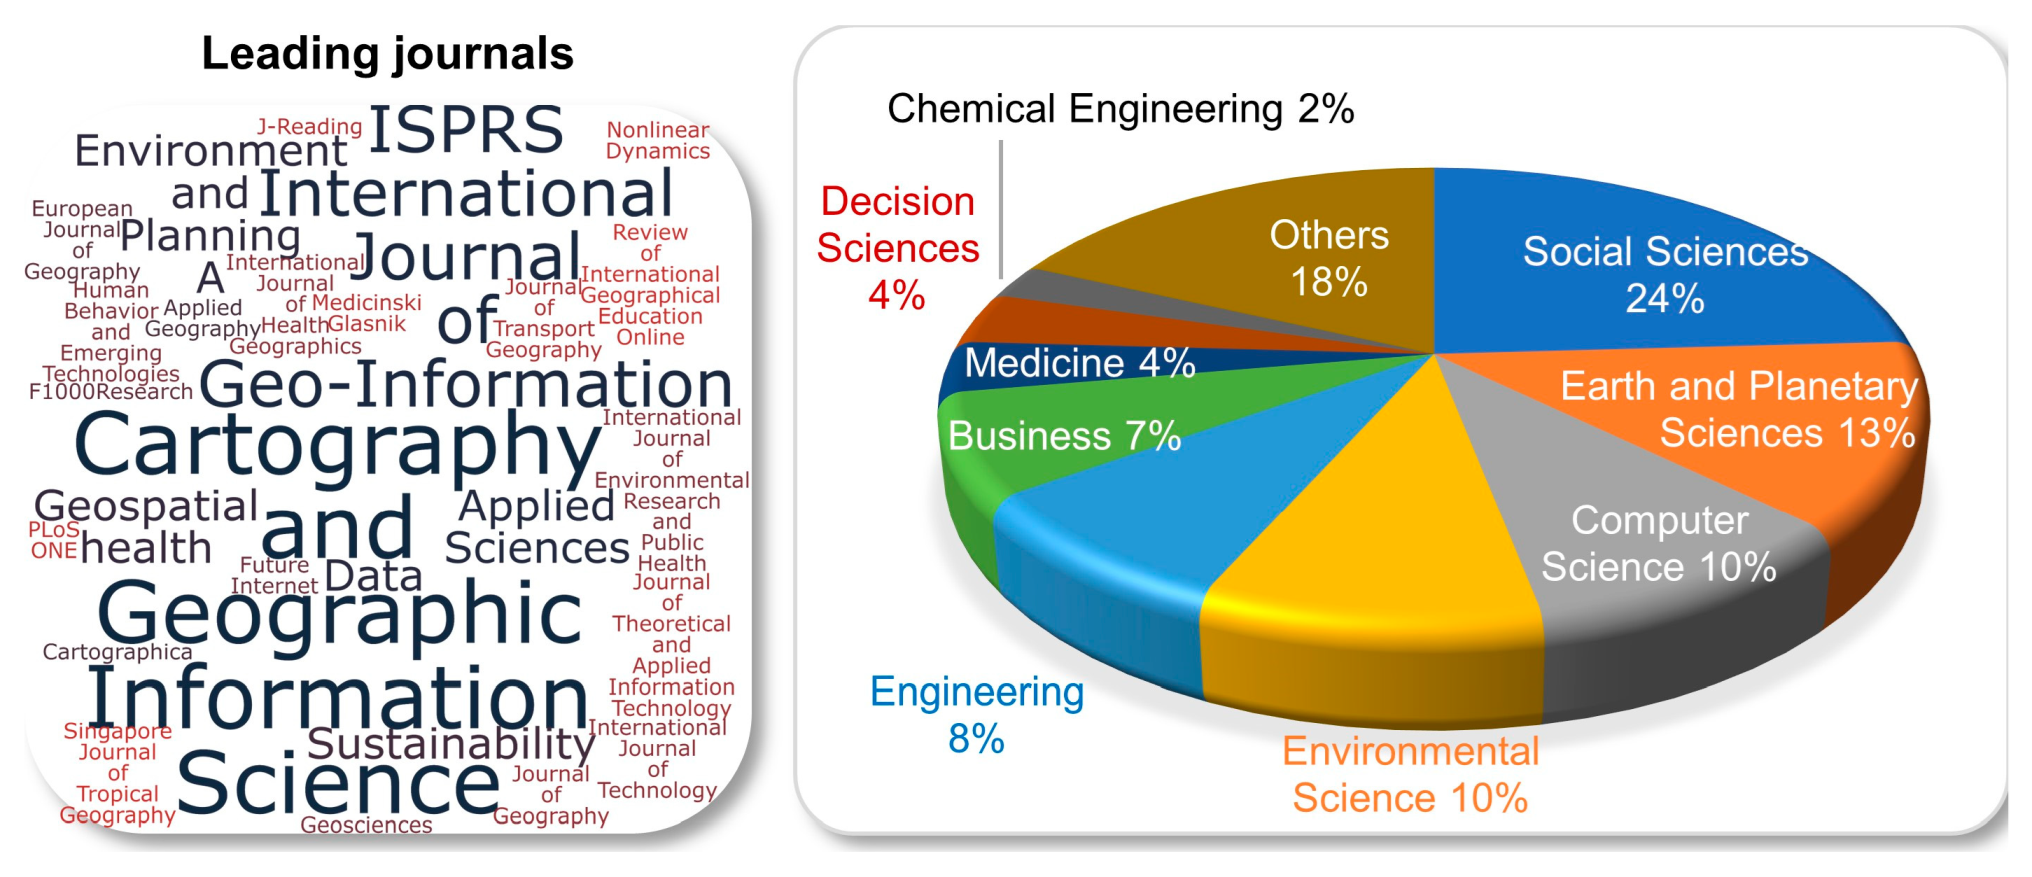
2.2. Leading Journals and Science Areas in the International Literature

The main journals that publish research related to the geovisualization of COVID-19 are in the geography field. Seventy percent of the fifty papers reviewed were published in journals of the geography field. The Cartography and Geographic Information Science is the journal with the largest number of publications, with four papers, followed by the ISPRS International Journal of Geo-Information, with three publications.
In addition to geography journals, health journals (e.g., Journal of Infection and Public Health and F1000Research) and multidisciplinary journals (e.g., PLoS ONE and Applied Sciences) are reference journals for researchers with four papers each. The journals indicated with the largest letters in Figure 3 published the largest number of research on COVID-19 geovisualization.
The areas of science with the highest number of articles on the geovisualization of COVID-19 are Social Sciences, Earth and Planetary Sciences, Computer Sciences, and Environmental Sciences. These four areas contribute to 24%, 13%, 10%, and 10% of the publications on the topic, respectively (see Figure 3).

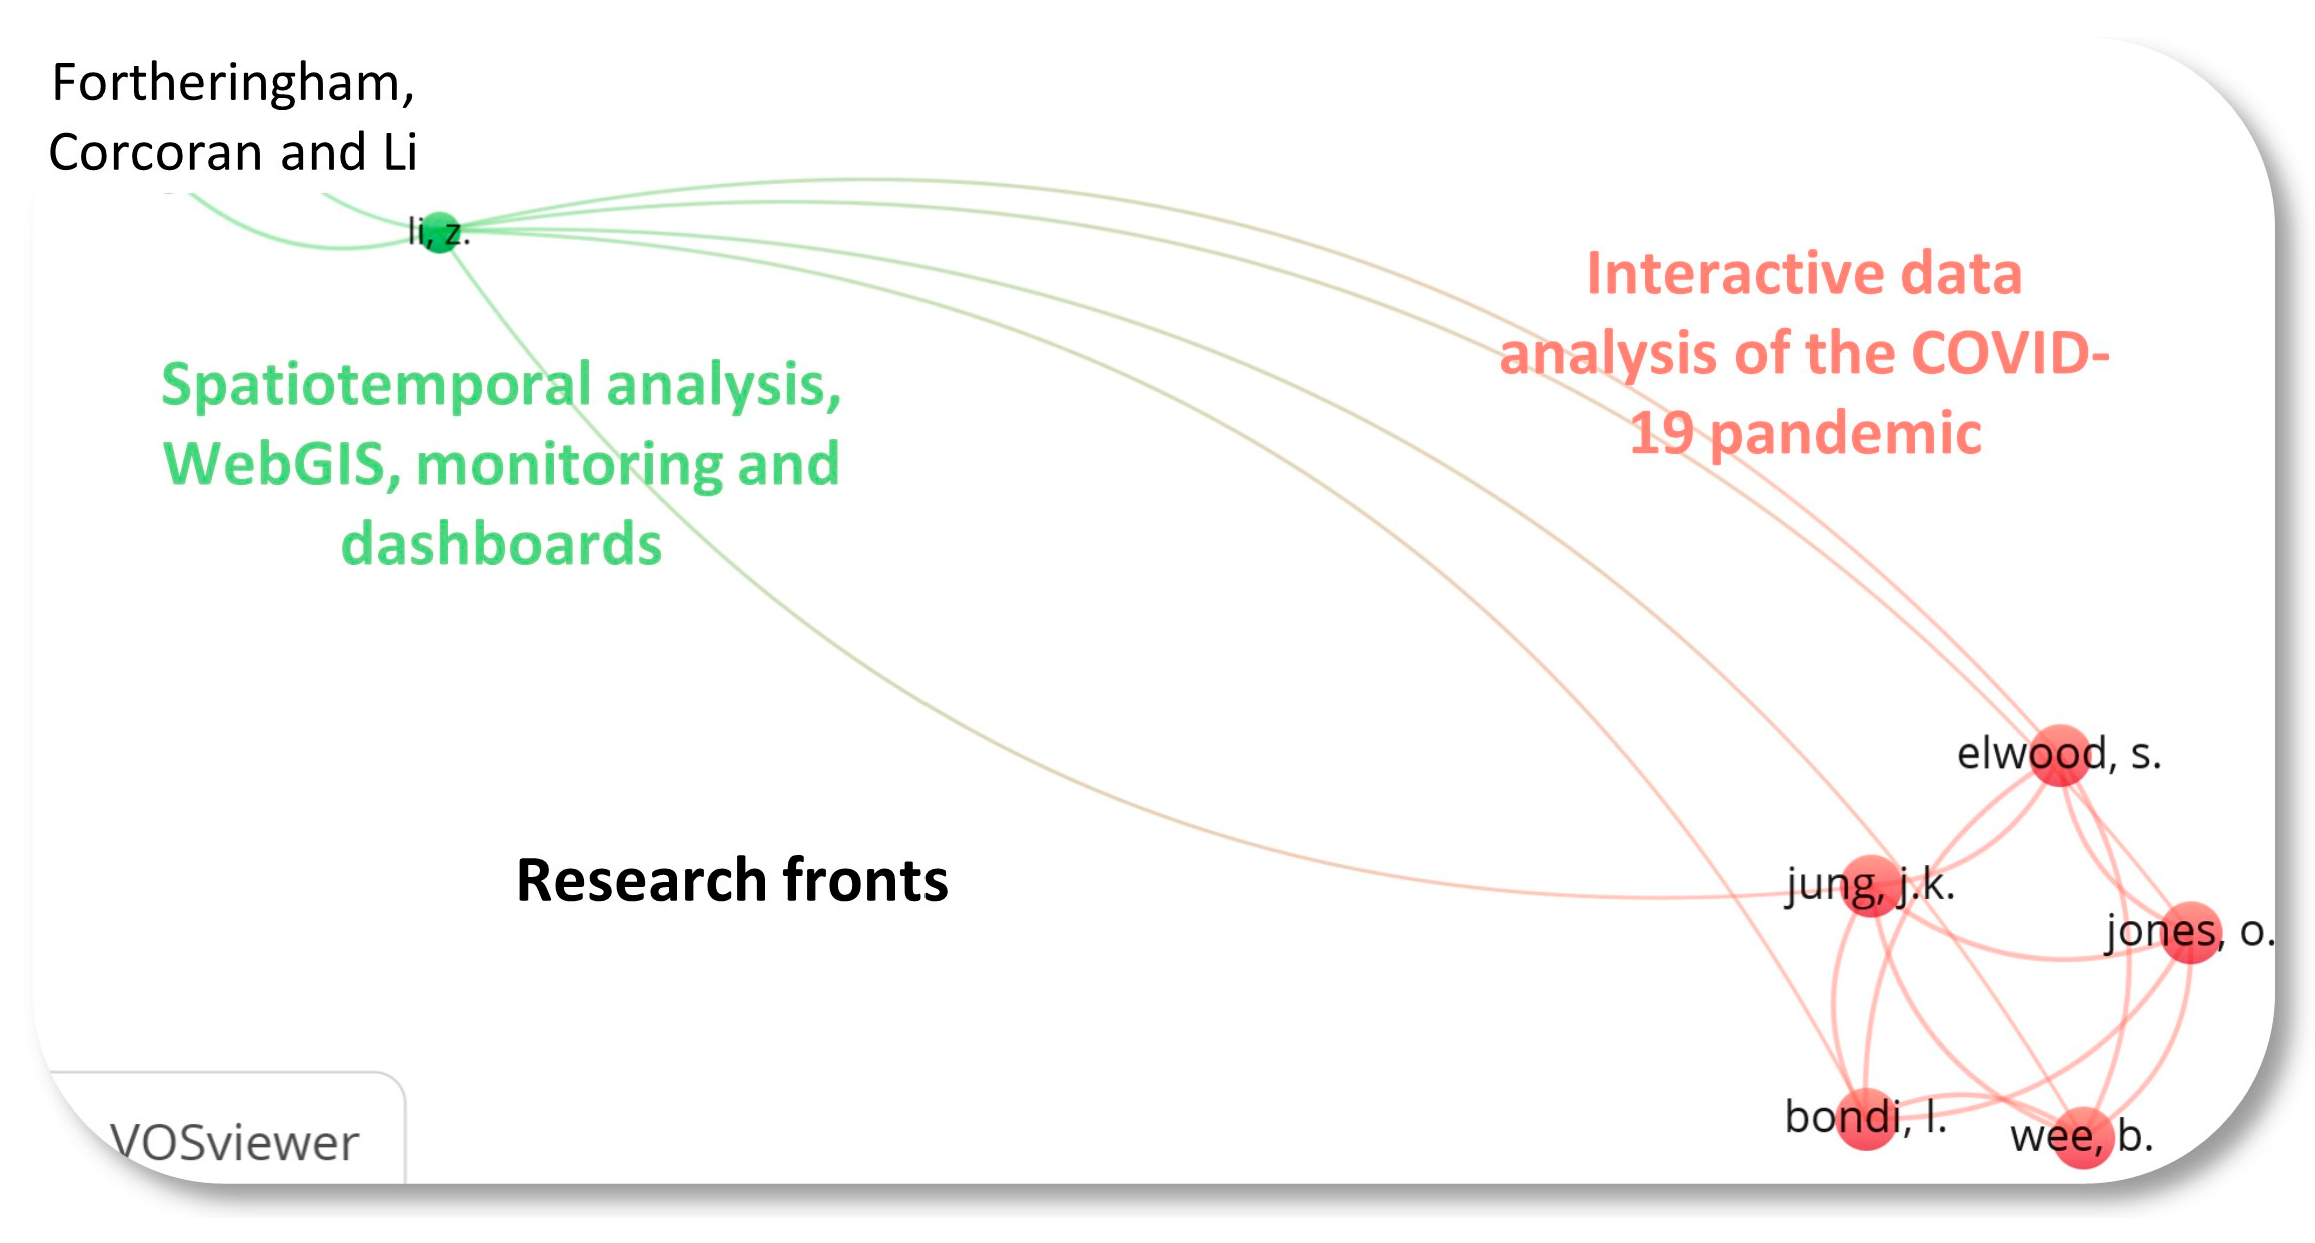
2.3. Co-Citation Analysis of the International Literature

According to Small [14], p. 265, “The co-citation analysis is defined from the frequency with which two documents are cited together.” Through co-citation analysis, it is possible to “identify specific scientific specialties,” offering “a new way of studying the structure of specialties of science” [14].
Particularly, the co-citations analysis performed in VOSviewer, shown in Figure 4, indicates that the international literature on COVID-19 geovisualization is divided into two research fronts.
The first research front is associated with the network established by the study by Jung and Elwood [15]. Papers on this research front focus on analyzing COVID-19 data through interactive geotechnologies. The second research front is associated with papers that cite Fotheringham [16] and Li et al. [17]. Papers from this second research front are concerned with analyzing and developing geotechnologies capable of analyzing the temporal evolution of COVID-19.

2.4. International WebGIS Applications

Eleven articles retrieved in the search (see Figure 1) have more than ten citations. Kim [18] developed a WebGIS for prioritizing decision-making concerning infectious disease control policies considering economic shutdowns. Iyanda et al. [19] examined the health and social determinants of COVID-19 in 175 countries through a spatial epidemiological approach, offering a model that supports the development of public health programs and epidemiological surveillance. Pászto et al. [20] investigated the transformations in the behavior of groups of citizens, considering locations and mobility reports from Google Mobility. Zhai et al. [21] used geovisualization to analyze the mobility pattern in the cities of the United States, showing that people from poorer regions reduced mobility more than people from wealthier regions. Gavurova et al. [22] developed a risk assessment WebGIS for pandemics. The WebGIS is built based on fuzzy sets and offers valuable information for decision-makers in the COVID-19 pandemic. Zhou et al. [23] used geovisualization to investigate behaviors among public transport users before and after events related to COVID-19. Balla et al. [24] created a WebGIS to visualize spatial and temporal information on water quality to provide public services during the pandemic. Ponjavic et al. [25] developed a WebGIS to monitor the effectiveness of control measures in preventing the spread of COVID-19. Pasquaré et al. [26,27] developed a WebGIS that enables virtual tours in tourist and geographic heritage destinations during the COVID-19 pandemic.
Two papers with more than ten citations review the literature on the geovisualization of COVID-19. Ahasan et al. [2] reviewed 79 papers and showed that WebGISs had been widely used to visualize and monitor COVID-19 in several countries. Lan et al. [1] revealed that cyclicality and seasonality are temporal elements that are still relatively unexplored. The authors suggest filling this gap by developing animated and interactive technologies capable of simultaneously exploring time and space. Paszto et al. [20] analyzed 30 WebGIS applications for data analysis and interpretation developed during the COVID-19 pandemic. Their study shows the high value of using data from Google’s Community Mobility Reports as a source of information about people’s behavior during the pandemic.
Other studies also make valuable contributions to the literature. Martínez-Hernández [28] held workshops with students to create virtual walks in cities with the aim of developing skills in Geography. Beuren et al. [29] developed a WebGIS aimed at the geovisualization of epidemiological information. The results show that WebGIS offers valuable information for COVID-19 control measures, mainly locally. Marques da Costa et al. [30] developed a WebGIS that allows the dynamic and interactive analysis of variables and indicators on the evolution of the pandemic from a multiscale perspective. Li et al. [31] developed an approach for visualizing the risk of COVID-19 contamination from the perspective of each individual’s exposure. Steger [32] explored geovisualization to analyze children’s well-being in light of the COVID-19 pandemic. Pala et al. [33] developed a WebGIS for interactive data analysis (e.g., health, economic, and sociopolitical) related to COVID-19. Torres-Ruiz et al. [34] developed a WebGIS recommending medical health facilities based on a citizen’s profile.
Recent studies offer relevant innovations to the literature. For example, the consideration of vaccination [14,35], the use of chorematic maps [36], the detection of emerging contagion clusters [3], the detection of mass mobility patterns carrying passengers during the pandemic [37] and analyzing the effectiveness of existing WebGISs [38].
The majority of publications developed WebGISs to monitor the spread of COVID-19 [4,39,40,41,42,43]. However, the literature also shows that many studies develop WebGIS for a purpose not associated with monitoring COVID-19. A total of eight papers developed geotechnologies for educational purposes [44,45,46,47,48,49,50,51]. The literature review also identified geotechnologies for public resource management [52] and tourism [53].
Additionally, for research aimed at developing geotechnologies, it is important to highlight research that generates data that can be incorporated into WebGISs. Konicek et al. [6] show how to extract data from social media, while Minghini et al. [7] show how to update pharmacy location data. Similarly, MacTavish et al. [54] show how to incorporate perspective graphs to geovisualize global COVID-19 data.
Finally, the content analysis of the fifty articles identified in the search returned one paper that did not fit into the literature of interest [55].

2.5. Geovisualization and WebGIS Applications on COVID-19 in the Brazilian Literature

The investigation of abstracts of the ten papers that cite “COVID-19” AND (“Geovisualization” OR “WebGIS” OR “WebMap” OR “Geotechnology”) enabled the selection of only two papers that developed some type of geotechnology (WebGIS or geovisualizer) to monitor COVID-19 in the Brazilian scenario. Notably, the search uses the terms in Portuguese: “Geovisualização” and “Geotecnologia”. In turn, WebGISs and geovisualizers were developed in eight other studies for tourism, public resource management, and teaching purposes.
Although not aimed at combating COVID-19, these geotechnologies offer very interesting contributions that are as follows:
  • Better manage the accumulation of solid waste [56];
  • Provide virtual trips in public parks [57];
  • Analyze changes in population mobility as a result of the pandemic [58];
  • Facilitate the education process during the pandemic [59,60,61,62,63].
The two analyzed papers develop geotechnologies to geovisualize the evolution of the pandemic. Bandeira et al. [5] analyze the pre-vaccine COVID-19 incidence and mortality rates in the neighborhoods of Natal City. The authors show that COVID-19 incidence rates are higher in neighborhoods with better socioeconomic and environmental indicators. Palhares and Hermano [64] analyze the spatial distribution of COVID-19 in Belo Horizonte City. The authors show that the COVID-19 contagion is associated with mobility restriction policies and social and economic factors.

2.6. Literature Summary

Regardless of its limitations, this literature review suggests that the benefits of geovisualization are not appropriate for public managers in developing countries like Brazil. Table 1 shows that most existing WebGISs were configured to portray the reality of European countries, the United States, and Canada. Researchers from these countries produced 68% of the retrieved literature.
These results suggest a lack of geotechnologies that assist public managers in developing countries in monitoring the pandemic. This is an interesting finding not only because it indicates that developed countries have appropriated more of the benefits of these geotechnologies. The development of a WebGIS depends heavily on data availability. Furthermore, the functionality implemented in WebGIS is defined by users. Developed countries have more data available, favoring the development of more sophisticated functionality.
Developing countries have significant data limitations and are unlikely to be able to implement the same functionalities. Furthermore, the reality (the average age of the population, income, and health system) of developing countries is very different from that of developed countries; thus, public managers in these countries have different priorities and analytical interests.
It is also important to highlight cases where WebGISs do not work for developing countries [4], where obtaining data for more sophisticated spatial analyses is not trivial [6,7], and where few users understand existing WebGISs [38].
Therefore, the WebGIS developed in this study is an interesting example because it can be adapted to other countries with limitations in data availability and realities (educational level and government resources) similar to Brazil.

3. Materials and Methods
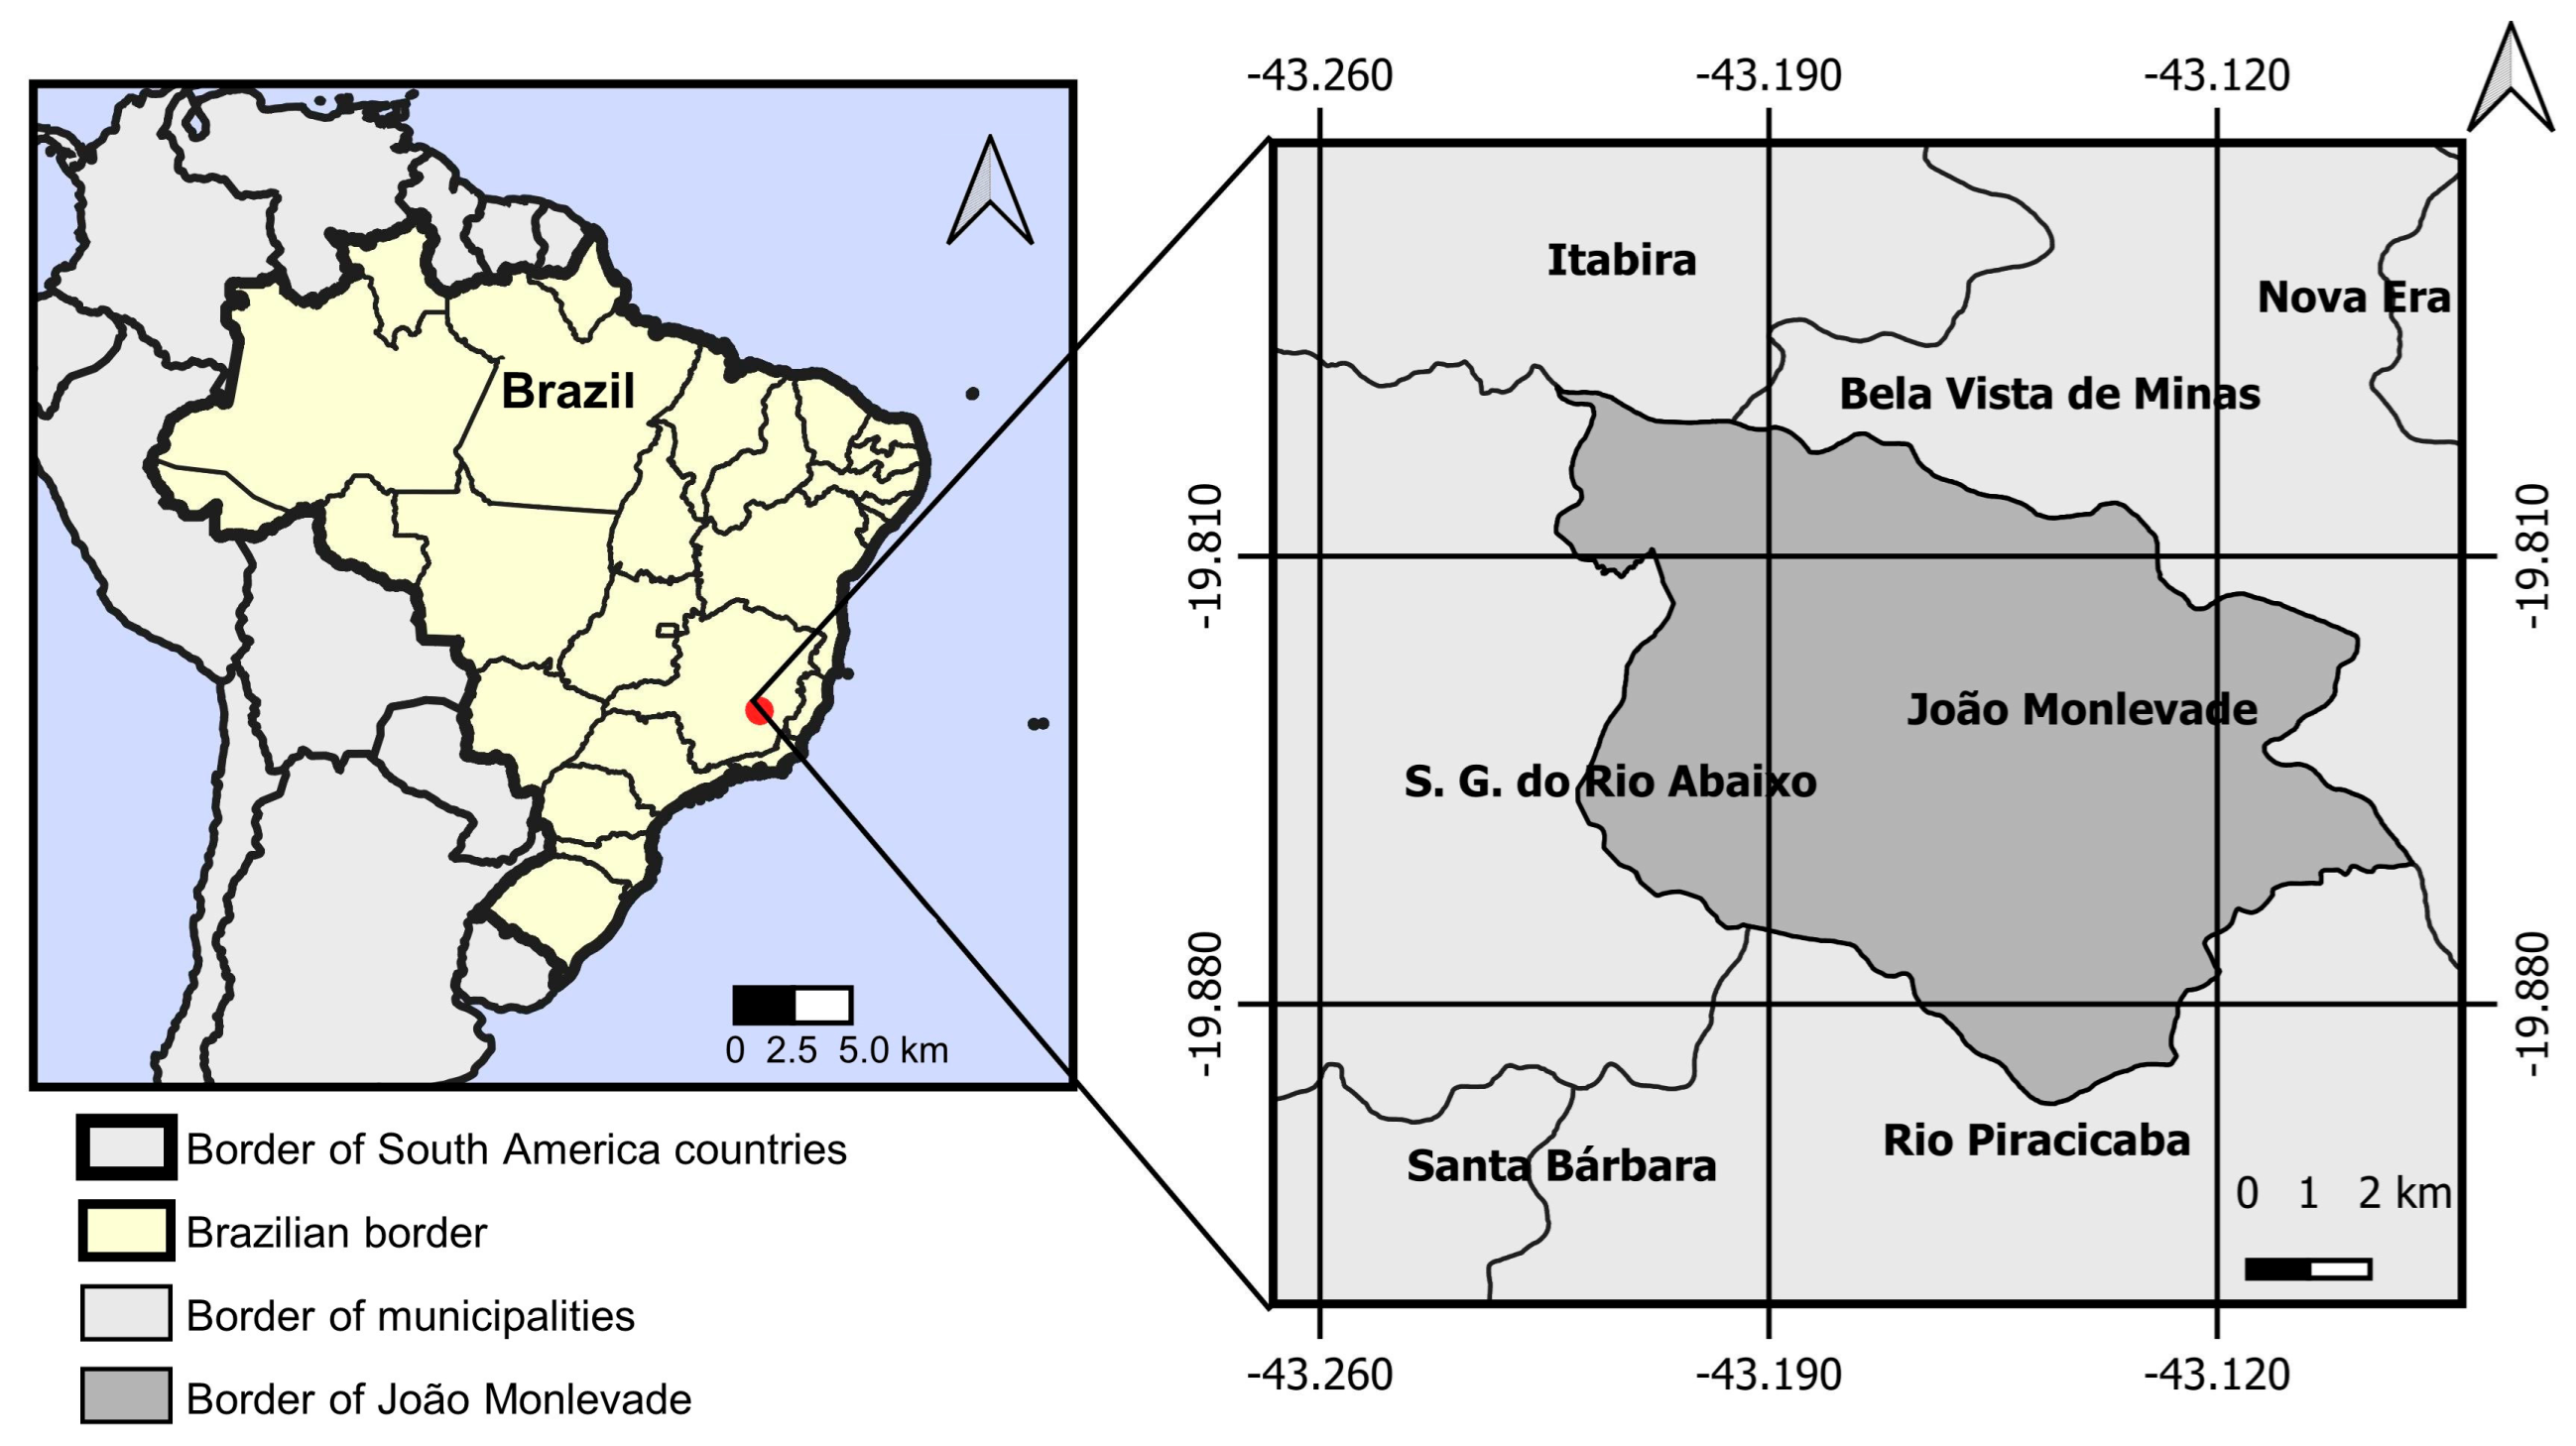
The geotechnology proposed in this study was developed in two stages: (1) data collection and (2) WebGIS. The latter comprises three substages. The WebGIS features were tested in João Monlevade. The availability of data (cases and deaths) was the choice criterion used to select the municipality of Minas Gerais, Brazil.

3.1. Study Area

João Monlevade is a municipality of 80,903 inhabitants, located in the State of Minas Gerais, Southeastern Brazil (Figure 5). The municipality has a demographic density of 742.35 people per km2, according to estimates of the Brazilian Institute of Geography and Statistics (IBGE, [65]).
The city’s population increased by 10% compared to the last demographic census in 2010 [66]. The number and percentage of the occupied labor force in the last census was 21,356 people, that is, 27% of the population. This proportion of occupied labor force concerning the total population is quite high. João Monlevade is 78th in the ranking of the 853 municipalities in the state of Minas Gerais [65]. The average monthly salary of formal workers in the state of Minas Gerais in 2023 is 2.1 minimum wages (i.e., approximately US$554.4).
The Human Development Index of João Monlevade (0.758) is the 72nd highest among the 853 municipalities in the state of Minas Gerais. João Monlevade also has a prominent position in economic terms, occupying 89th place among the state’s municipalities in relation to Gross Domestic Product per capita (BRL 41,476.05 per inhabitant/year) [65].
A study carried out in João Monlevade shows that existing geotechnologies for monitoring the pandemic are not very interactive, limiting the scope of analysis for public managers [67].

3.2. Data Collection

The data used in this study were collected between April 2020 and December 2021. During this period, 17,265 records of cases and deaths due to COVID-19 were entered into the database. These data were acquired from the City Hall. The database collates three types of information:
  • Domicile: complete address (city, state, street, number, and neighborhood).
  • Patient: age group, sex, and age.
  • General: notification date, symptoms (e.g., fever), and epidemiological week. (Epidemiological weeks is a standardized counting system of weeks to compare annual data. By international convention, the first week of the year contains the largest number of days in January, and the last week contains the largest number of days in December [68].)
  • Health: Severe Acute Respiratory Infection (SARI), comorbidity, Polymerase Chain Reaction (PCR) or rapid tests, and suspected cases.

3.3. Description of Development Stages

The WebGIS was developed in four substeps: (1) WebGIS users and requirements; (2) Definition of the technological architecture; (3) Data and interaction modeling; and (4) Prototyping.
WebGIS users and requirements substage is subdivided into the assessment of users’ needs and the definition of the WebGIS functionalities and interactivities.
Firstly, managers from João Monlevade city hall designated analysts from the health department as target users of WebGIS. These analysts were consulted about their primary analysis needs. In response to this consultation, analysts pointed to the geovisualization of the dispersion of cases of contagious diseases, such as COVID-19 and dengue, including information on the number of confirmed cases, incidence locations, and risk factors as the primary needs to be incorporated into WebGIS. Based on these needs, the functionalities and interactivities of WebGIS were defined.
The substage of technological architecture definition is subdivided into three parts. The first part involves configuring connections between databases (e.g., spreadsheets containing patient data, government health, demographic, and spatial data infrastructure) and functionality interfaces using the ArcGIS library of functions and Javascript codes in HyperText Markup Language (HTML). These connections make it possible to integrate functionalities with data available in generic layers and with style configuration files and other characteristics to be used by the application. In the second part of the definition of technological architecture, the connection to the database of the municipality’s health department is carried out. In particular, the WebGIS is connected with the city epidemiological systems databases (National System of Notifiable Diseases and the Epidemiological Surveillance System). The access to the original data is customized to enable georeferencing and data storage. The connection is made from the server’s Internet Protocol address, port number, database login, and access password. The third part involves configuring the dashboards containing the charts and maps. This configuration is performed through ArcGIS Application Programming Interface (API) components that implement these functionalities. The HTML pages of the dashboards were coded using the Cascade Style Sheet, allowing the definition of the style of the page (e.g., font sizes and types, background, font colors, among others). The dashboard charts (pizza, line, and columns) were designed and constructed by processing the data in the database. Notably, the WebGIS is entirely configurable at the beginning since all connections are made directly in the ArcGIS API javascript code, with queries designed for the National System of Notifiable Diseases and the Epidemiological Surveillance System database, with attributes such as gender, age, and registration date.
The third substage (data and interaction modeling) is associated with data modeling with geographic attributes, features, and interface components. First, the COVID-19 case and death data tables for João Monlevade are georeferenced by address. Second, the following functionalities are configured, i.e., search by address, location identification, the definition of the search form (by distance or by radius), the definition of the presentation of the selected points and their respective information, and the changes in levels of zoom. Third, the following components of the WebGIS interface are defined, i.e., base map style and zoom change, query layers (e.g., police stations, hospitals, and planning regions), search address field, and the radius of the search. Among the functionalities is the aggregation of geographic data, such as the sum of cases contained within a given radius or the sum of cases contained within a line, point, or polygon buffer. For each result format, a specific geographic model is used (e.g., centrality and dispersion analysis). The screen components are customized using widgets from the ArcGIS online javascript API. This command API can be accessed through the link: https://developers.arcgis.com/javascript/latest/sample-code/ (accessed on 19 November 2023). The widgets’ source code is easily changed from the ArcGIS javascript API. An example of this functionality is the search for addresses on the map (search widget).
Finally, the prototyping substage involves configuring the platform in ArcGIS online, identifying the Javascript API features to be used, and creating the web application. Figure 6 presents the operational framework consolidating the COVID-19 geovisualization WebGIS development stages in João Monlevade.

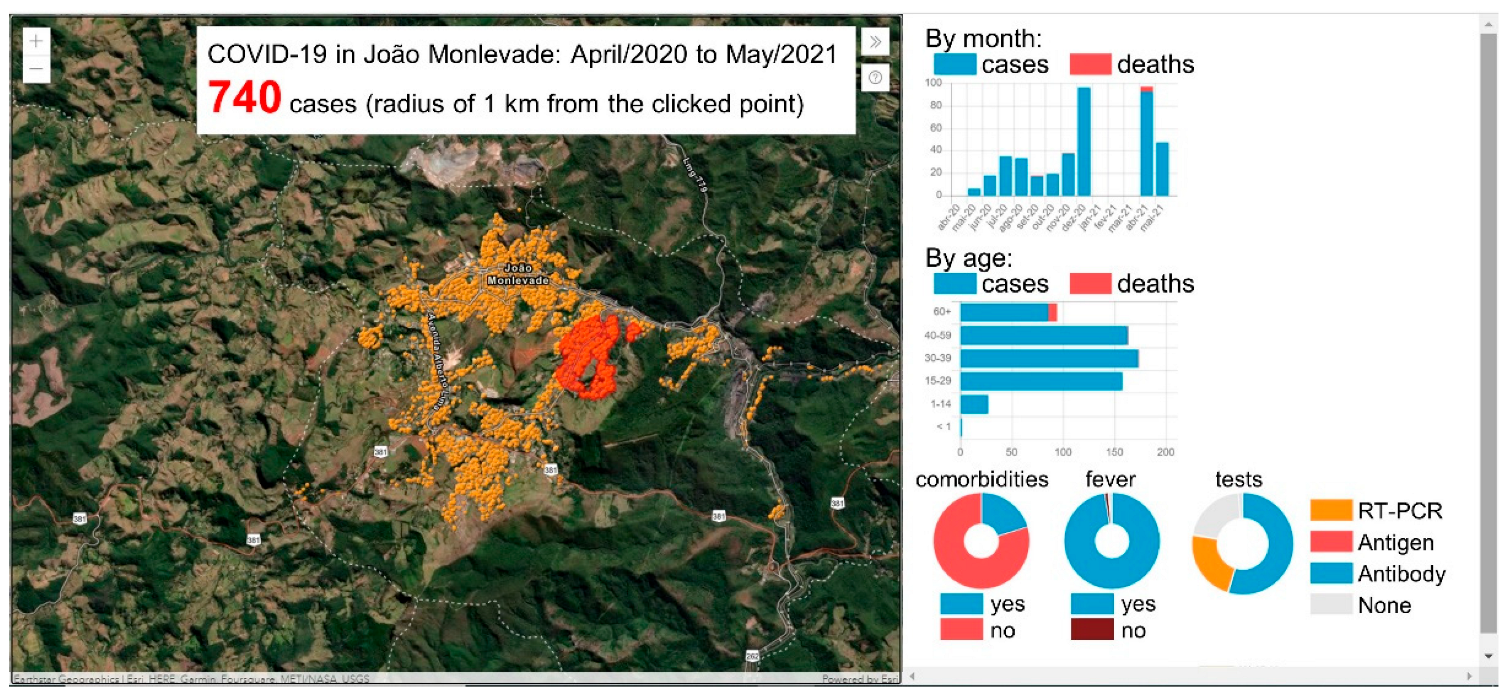
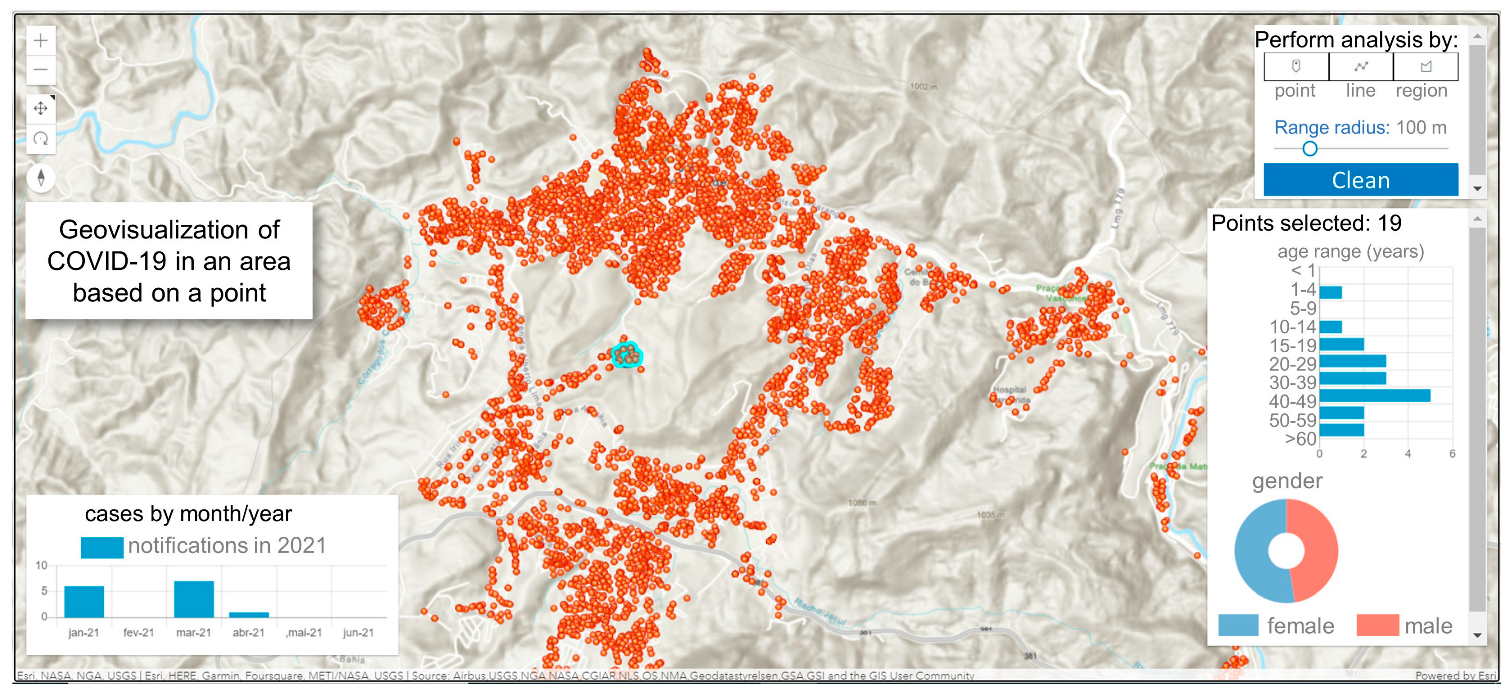
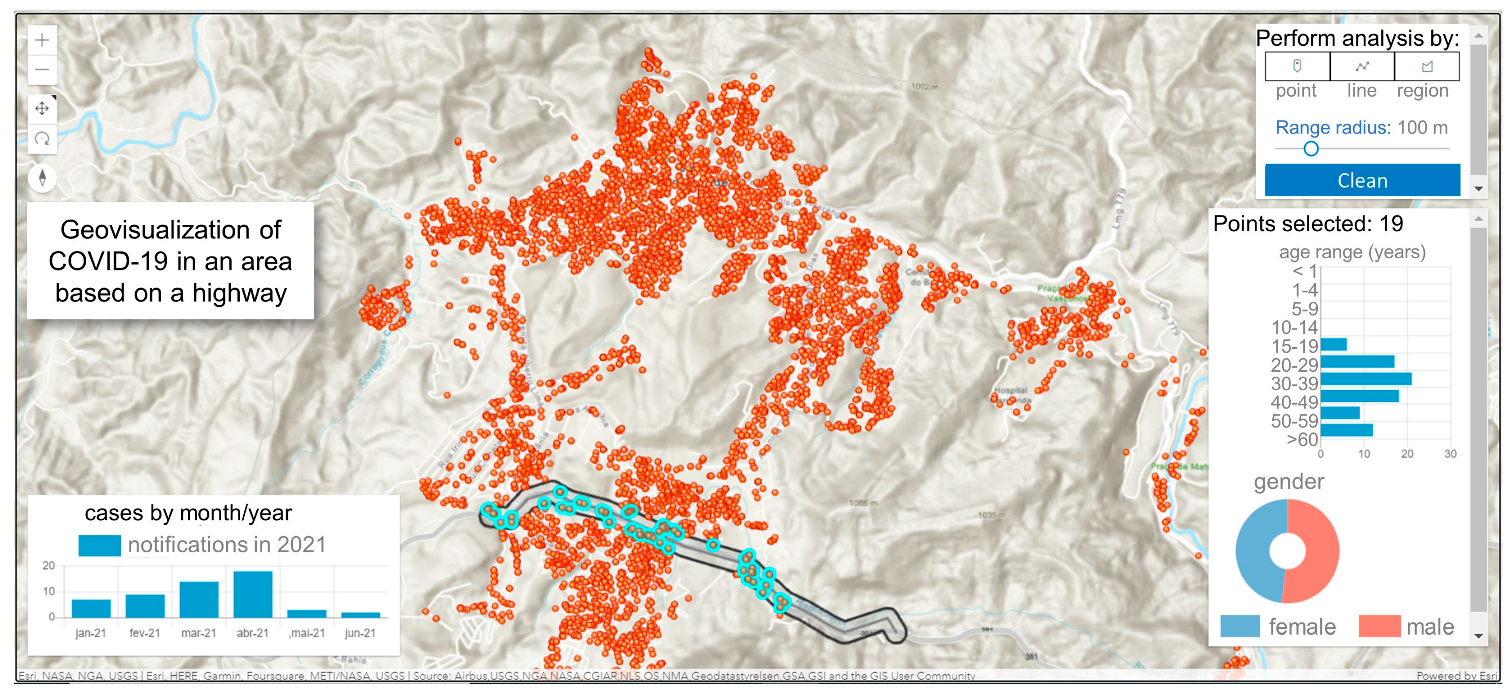
4. Results and Analysis

The developed WebGIS offers two COVID-19 geovisualization dashboards. The first dashboard in Figure 7 shows the total number of COVID-19 cases registered in the municipality within a radius of 1 km from the selected map location. In this dashboard, it is possible to analyze the monthly evolution and the age profile of the number of cases and deaths due to COVID-19 and obtain information on the patients’ health.
The dashboard offers significant information for planning the health system, helping the decision-making process by public managers. Information such as the population’s average age, the proportion of older people, and the incidence of comorbidities are directly and positively related to the number of hospitalizations and deaths [69]. Therefore, analyzing the evolution of COVID-19 associated with patients’ profiles helps public managers plan their actions, anticipate decisions on expanding hospital beds, test the population, and adjust the rules for the movement of people.
The second COVID-19 geovisualization panel allows the user to choose three possible spatial analyses: by point, line, or region (see icons in the upper right part of Figure 8, Figure 9 and Figure 10). The first spatial analysis, possible through selecting the “point” icon, is the evolution of the number of cases in the last six months and the age and gender profile of these cases. The data recovery radius is not fixed as in the first dashboard, permitting the reduction or expansion of the analysis region, as shown in Figure 8.
The dashboard is limited to the analysis of the number of cases. Moreover, it offers valuable information for public managers, as it allows for analyzing the incidence of COVID-19 in specific places with a large concentration of people, such as pharmacies and hospitals.
Public managers can also benefit from the analysis offered in this dashboard to understand the evolution of COVID-19 around avenues, highways, and other access corridors in the city, as shown in Figure 9.
This dashboard allows the creation of specific routes inside or outside the city. Then, it is possible to change the radius of influence of this route according to the interests and needs of public managers. The dashboard also allows obtaining information for specific areas, as shown in Figure 10.
Notably, the health and demographic information presented on the dashboard does not allow for deeper analyses, for example, the relationship between COVID-19 cases and deaths and social factors [69,70].
However, public managers can carry out more sophisticated spatial analyses, including social and mobility data, as in the WebGIS listed in Table 2, connecting the data in the dashboards with census data in Geographic Information Systems.
Table 2 indicates that the proposed WebGIS does not incorporate advanced functionalities and is not classified as a solution associated only with COVID-19 data. This finding indicates several improvement points to be incorporated into the WebGIS while revealing that the WebGIS has more features than most of the reviewed WebGISs.
Due to the city hall’s data protection policy and restrictions, only the first dashboard is available for public access. The links below provide access to the first dashboard, where users can see how the WebGIS works and access the explanatory video, which demonstrates the main interactive elements of the WebGIS.
The WebGIS has been operational since January 2023. It has been used mainly to georeference and analyze the dispersion of COVID-19 cases. Furthermore, notifications have been sent to analysts when new cases are located close to other cases. Feedback from health department analysts can be considered positive, highlighting the ease of use and diversity of WebGIS functionalities.

Policy Highlights

The WebGIS developed in this rstudy contributes to the improvement of epidemic control policies such as COVID-19, yellow fever and dengue, filling the gap of geotechnologies aimed at developing countries, which have limitations in relation to data. Among the main differences of the proposed WebGIS is the association of COVID-19 data with demographic data (age and gender) and the population’s health, including the recording of tests and comorbidities. In particular, the data contained in the dashboard can help public health managers carry out specific and very targeted actions. Based on the location, age, and comorbidities of patients, it is possible to propose mobility policies for populations at a higher risk of death. Furthermore, the data contained in the dashboard allow public health managers to develop flexible and, at the same time, effective mobility actions based on the demographic and health characteristics of each area.
The WebGIS enables the monitoring of pandemics in specific spatial geometries. This functionality makes it possible to analyze the dynamics of pandemics around health system facilities, avenues, highways, neighborhoods, and slums. This functionality is highly relevant to ensure agility in planning policies to combat the pandemic and other diseases with endemic and pandemic potential, such as the influenza virus, dengue, and yellow fever.
WebGIS features are easy to use, enabling relevant analyses. This is relevant because healthcare professionals do not know about Geographic Information Systems.

5. Conclusions

This study reviews the literature on WebGISs utilized for the monitoring and control of COVID-19 in Brazil and around the world. The results of this literature review show that WebGISs were widely utilized during the COVID-19 pandemic. The geotechnologies used during the pandemic period were not restricted to monitoring, controlling, and combating the pandemic. The usefulness of geotechnologies was not limited to monitoring COVID-19, expanding to areas of education, tourism, and waste management, in Brazil and around the world.
This study also developed a WebGIS that offers two interactive geovisualization dashboards, and it is easy to use, is based on updated data, and allows multiple space–time analyses of COVID-19. This WebGIS presents two points of originality.
The developed geovisualization dashboards have features that allow analyzing the space–time evolution of COVID-19, taking into account patient information. This is relevant information for tackling the pandemic, such as age and comorbidity correlated with the chances of hospitalization and death from COVID-19.
Another point of originality is the possibility of monitoring the evolution of deaths and cases due to COVID-19 from areas defined using specific spatial geometries. The geovisualization dashboard allows for analyzing the dynamics of COVID-19 around hospitals, shopping centers, avenues, highways, neighborhoods, and communities. This functionality is highly relevant to ensure flexibility in planning policies to combat the pandemic. For example, governments can establish mobility restrictions for neighborhoods, allocate health professionals and equipment considering the age and comorbidity of the population in regions of the city, and identify priority areas for testing or vaccination campaigns.
Among the limitations of the developed WebGIS, it must be mentioned that dashboards only allow monthly temporal analyses. Furthermore, spatial analyses consider the entire dataset. In addition to seeking to overcome these limitations, future investigations may include functionalities to predict the evolution of COVID-19 [69,70,71,72,73]. Another functionality to be considered in future research is the inclusion of other diseases with endemic and pandemic potentials, such as yellow fever, dengue, and flu.

Author Contributions

Conceptualization, P.I.E.; Data curation, A.J.d.B.; Methodology, C.A.P.d.S.M.; Software, S.L.; Supervision, D.A.G.V.; Writing—original draft, P.I.E. and M.P.L.; Writing—review and editing, C.A.P.d.S.M. All authors have read and agreed to the published version of the manuscript.

Funding

This research was carried out with the support of the National Council for Scientific and Technological Development of Brazil (CNPq) under Productivity grants 311922/2021-0 (Ekel, P.I.E.), 314800/2021-2 (VIEIRA, D.A.G.V.) and Postdoctoral fellowship 151518/2022-0 (Libório, M.P.L.).

Data Availability Statement

The data used in the research is available at https://data.mendeley.com/datasets/gpcby5k2nz/1 (accessed on 19 November 2023).

Conflicts of Interest

All authors declare that they have no affiliation with or involvement in any organization or entity with any financial or non-financial interest in the subject matter or materials discussed in this manuscript. The paper reflects the author’s research and analysis wholly and truthfully. The paper properly credits the meaningful contributions of co-authors and co-researchers. No human participants or animals are involved in this research.

References

  1. Lan, Y.; Desjardins, M.R.; Hohl, A.; Delmelle, E. Geovisualization of COVID-19: State of the Art and Opportunities. Cartogr. Int. J. Geogr. Inf. Geovis. 2021, 56, 2–13. [Google Scholar] [CrossRef]
  2. Ahasan, R.; Alam, M.S.; Chakraborty, T.; Hossain, M.M. Applications of GIS and geospatial analyses in COVID-19 research: A systematic review. F1000Research 2020, 9, 1379. [Google Scholar] [CrossRef] [PubMed]
  3. Lan, Y.; Delmelle, E. A web-based analytical framework for the detection and visualization space-time clusters of COVID-19. Cartogr. Geogr. Inf. Sci. 2023, 1–19. [Google Scholar] [CrossRef]
  4. Supriatna, F.Z.; Ardiansyah, N.R.; Semedi, S.J.M.; Rahatiningtyas, T.N.S. Communicating the High Susceptible Zone of COVID-19 and its Exposure to Population Number through a Web-GIS Dashboard for Indonesia Cases. Int. J. Technol. 2022, 13, 706–716. [Google Scholar] [CrossRef]
  5. Bandeira, E.D.; Lucena, S.V.; Navoni, J.A.; de Souza, J.R.; Tavares, J.L. Análise Espacial das Taxas de Incidência e Mortalidade da COVID-19 e os Impactos do Saneamento no Munícipio de Natal-RN. In Proceedings of the XIX Congresso Nacional de Meio Ambiente, Poços de Caldas, Brazil, 21–22 September 2022. [Google Scholar]
  6. Konicek, J.; Netek, R.; Burian, T.; Novakova, T.; Kaplan, J. Non-spatial data towards spatially located news about COVID-19: A semi-automated aggregator of pandemic data from (social) media within the Olomouc Region, Czechia. Data 2020, 5, 76. [Google Scholar] [CrossRef]
  7. Minghini, M.; Sarretta, A.; Napolitano, M. Openstreetmap contribution to local data ecosystems in COVID-19 times: Experiences and reflections from the Italian case. Data 2022, 7, 39. [Google Scholar] [CrossRef]
  8. Magalhães SS, A.; Machado, C.J. Conceitos Epidemiológicos e as Pandemias Recentes: Novos Desafios. Cad. Saúde Colet. 2014, 22, 109–110. [Google Scholar] [CrossRef]
  9. Silva, F.S.; Libório, M.P.; Haddad, P.B. Relação geográfica entre índice de vulnerabilidade social e a transmissão da dengue: Estudo de caso de Praia Grande, São Paulo. Rev. Espinhaço 2018, 7, 39–48. [Google Scholar]
  10. Van Eck, N.; Waltman, L. Software survey: VOSviewer, a computer program for bibliometric mapping. Scientometrics 2010, 84, 523–538. [Google Scholar] [CrossRef]
  11. Libório, M.P.; Martins CA, P.; Laudares, S.; Ekel, P.I. Method of preparing an international and national literature review for novice researchers. MethodsX 2023, 10, 102165. [Google Scholar] [CrossRef]
  12. Zhou, M.; Fu, Q.; Li, Y.; Wang, Y.; Wang, X.; Hu, W. Discovering spatiotemporal flow patterns: Where the origin–destination map meets empirical orthogonal function decomposition. Cartogr. Geogr. Inf. Sci. 2023, 50, 113–129. [Google Scholar] [CrossRef]
  13. Odunsi, O.M.; Salisu, U.O.; Taiwo, A.O.; Odufuwa, B.O.; Badiora, A.I.; Onanuga, M.Y.; Fasina, O.S.; Dada, O.T.; Ogunseye, N.O.; Momodu, S.O.; et al. Geo-Visualisation of COVID-19 Pandemic and Vaccination in Nigeria: A Regional Approach. J. Geovis. Spat. Anal. 2023, 7, 29. [Google Scholar] [CrossRef]
  14. Small, H. Co-citation in the scientific literature: A new measure of the relationship between two documents. J. Am. Soc. Inf. Sci. 1973, 24, 265–269. [Google Scholar] [CrossRef]
  15. Jung, J.K.; Elwood, S. Extending the qualitative capabilities of GIS: Computer-aided qualitative GIS. Trans. GIS 2010, 14, 63–87. [Google Scholar] [CrossRef]
  16. Fotheringham, A.S. A new set of spatial-interaction models: The theory of competing destinations. Environ. Plan. A Econ. Space 1983, 15, 15–36. [Google Scholar] [CrossRef]
  17. Li, T.; Corcoran, J.; Pullar, D.; Robson, A.; Stimson, R. A geographically weighted regression method to spatially disaggregate regional employment forecasts for South East Queensland. Appl. Spat. Anal. Policy 2009, 2, 147–175. [Google Scholar] [CrossRef]
  18. Kim, D. Visualizing the regional patterns of two crises: The COVID-19 outbreak and decreasing MSME sales during three different phases of 2020 in Korea. Environ. Plan. A Econ. Space 2021, 53, 1591–1593. [Google Scholar] [CrossRef]
  19. Iyanda, A.E.; Adeleke, R.; Lu, Y.; Osayomi, T.; Adaralegbe, A.; Lasode, M.; Chima-Adaralegbe, N.J.; Osundina, A.M. A retrospective cross-national examination of COVID-19 outbreak in 175 countries: A multiscale geographically weighted regression analysis (January 11–June 28, 2020). J. Infect. Public Health 2020, 13, 1438–1445. [Google Scholar] [CrossRef]
  20. Pászto, V.; Burian, J.; Macku, K. COVID-19 data sources: Evaluation of map applications and analysis of behavior changes in europe’s population. Geografie 2020, 125, 171–209. [Google Scholar] [CrossRef]
  21. Zhai, W.; Liu, M.; Peng, Z.R. Social distancing and inequality in the United States amid COVID-19 outbreak. Environ. Plan. A Econ. Space 2021, 53, 3–5. [Google Scholar] [CrossRef]
  22. Gavurova, B.; Kelemen, M.; Polishchuk, V. Expert model of risk assessment for the selected components of smart city concept: From safe time to pandemics as COVID-19. Socioecon. Plan. Sci. 2022, 82, 101253. [Google Scholar] [CrossRef]
  23. Zhou, J.; Wu, J.; Ma, H. Abrupt changes, institutional reactions, and adaptive behaviors: An exploratory study of COVID-19 and related events’ impacts on Hong Kong’s metro riders. Appl. Geogr. 2021, 134, 102504. [Google Scholar] [CrossRef] [PubMed]
  24. Balla, D.; Zichar, M.; Kiss, E.; Szabó, G.; Mester, T. Possibilities for Assessment and Geovisualization of Spatial and Temporal Water Quality Data Using a WebGIS Application. ISPRS Int. J. Geo-Inf. 2022, 11, 108. [Google Scholar] [CrossRef]
  25. Ponjavic, M.; Karabegovic, A.; Ferhatbegovic, E.; Tahirovic, E.; Uzunovic, S.; Travar, M.; Pilav, A.; Mulić, M.; Karakaš, S.; Avdić, N.; et al. Spatio-temporal data visualization for monitoring of control measures in the prevention of the spread of COVID-19 in Bosnia and Herzegovina. Med. Glas. 2020, 17, 265–274. [Google Scholar]
  26. Pasquaré Mariotto, F.; Antoniou, V.; Drymoni, K.; Bonali, F.L.; Nomikou, P.; Fallati, L.; Karatzaferis, O.; Vlasopoulos, O. Virtual geosite communication through a webgis platform: A case study from santorini island (Greece). Appl. Sci. 2021, 11, 5466. [Google Scholar] [CrossRef]
  27. Pasquaré Mariotto, F.; Corti, N.; Drymoni, K. Advanced Technologies for Geosite Visualization and Valorization: A Review. Appl. Sci. 2023, 13, 5598. [Google Scholar] [CrossRef]
  28. Martínez-Hernández, C.; Piskorski, R.; Stoffelen, A. Designing online workshops for teacher trainees: Heritage mapping with Web GIS Story Maps. Eur. J. Geogr. 2023, 14, 68–78. [Google Scholar] [CrossRef]
  29. Beuren, A.T.; de Freitas, H.J.T.; Naves, T.F.; Flórez, H.A.R.; Sepúlveda, G.P.L.; da Silva Soares, A.; de Lima Soares, T.W. Plataforma de Monitoramento Inteligente da COVID-19. Res. Soc. Dev. 2022, 11, e580111436659. [Google Scholar] [CrossRef]
  30. Marques da Costa, N.; Mileu, N.; Alves, A. Dashboard comprime_compri_mov: Multiscalar spatio-temporal monitoring of the COVID-19 pandemic in Portugal. Future Internet 2021, 13, 45. [Google Scholar] [CrossRef]
  31. Li, J.; Wang, X.; He, Z.; Zhang, T. A personalized activity-based spatiotemporal risk mapping approach to the COVID-19 pandemic. Cartogr. Geogr. Inf. Sci. 2021, 48, 275–291. [Google Scholar] [CrossRef]
  32. Steger, A.; Evans, E.; Wee, B. Emotional cartography as a window into children’s well-being: Visualizing the felt geographies of place. Emot. Space Soc. 2021, 39, 100772. [Google Scholar] [CrossRef]
  33. Pala, D.; Parimbelli, E.; Larizza, C.; Cheng, C.; Ottaviano, M.; Pogliaghi, A.; Đukić, G.; Jovanović, A.; Milićević, M.; Urošević, V.; et al. A new interactive tool to visualize and analyze COVID-19 data: The periscope atlas. Int. J. Environ. Res. Public Health 2022, 19, 9136. [Google Scholar] [CrossRef] [PubMed]
  34. Torres-Ruiz, M.; Quintero, R.; Guzman, G.; Chui, K.T. Healthcare Recommender System Based on Medical Specialties, Patient Profiles, and Geospatial Information. Sustainability 2022, 15, 499. [Google Scholar] [CrossRef]
  35. Liu, F.; Nie, X.; Wu, A.; Zhao, Z.; Ma, C.; Ning, L.; Zhu, Y.; Wang, L.; Guo, X.; Li, X. Data assimilation method for improving the global spatiotemporal predictions of epidemic dynamics yielded by an ensemble Kalman filter and Metropolis–Hastings sampling. Nonlinear Dyn. 2023, 111, 15573–15589. [Google Scholar] [CrossRef]
  36. Meddah, F.; Guerroudji, W.H. A chorem-based approach to visualizing COVID-19-related data. Cartogr. Geogr. Inf. Sci. 2023, 1–14. [Google Scholar] [CrossRef]
  37. Chen, M.; Yan, Y.; Feng, C.C.; Chen, S.; Wang, J.; Ye, M. Understanding the mobility patterns of Mass Rapid Transit (MRT) passengers amid COVID-19 in Singapore using smart card data. Singap. J. Trop. Geogr. 2023, 44, 414–437. [Google Scholar] [CrossRef]
  38. Rezk, A.A.; Hendawy, M. Informative cartographic communication: A framework to evaluate the effects of map types on users’ interpretation of COVID-19 geovisualizations. Cartogr. Geogr. Inf. Sci. 2023, 1–18. [Google Scholar] [CrossRef]
  39. Li, R. Visualizing COVID-19 information for public: Designs, effectiveness, and preference of thematic maps. Hum. Behav. Emerg. Technol. 2021, 3, 97–106. [Google Scholar] [CrossRef]
  40. Schmidt, F.; Dröge-Rothaar, A.; Rienow, A. Development of a Web GIS for small-scale detection and analysis of COVID-19 (SARS-CoV-2) cases based on volunteered geographic information for the city of Cologne, Germany, in July/August 2020. Int. J. Health Geogr. 2021, 20, 40. [Google Scholar] [CrossRef]
  41. Tiwari, A.; Aljoufie, M. A qualitative geographical information system interpretation of mobility and COVID-19 pandemic intersection in Uttar Pradesh, India. Geospat. Health 2021, 16, 124–136. [Google Scholar] [CrossRef]
  42. Sadoun, B.; Al-Bayari, O.; Al-Tawara, S. Open Source GIS Solution: An Overview of the Architecture of Free Open Source Web GIS. Jordan J. Earth Environ. Sci. 2022, 13, 74–81. [Google Scholar]
  43. Phang, P.; Yap, M.Y.; Zakaria, S.; Labadin, J. Geo-visualization of Sarawak COVID-19 Publicly Available Data Employing Open-source Geospatial Software. Univers. J. Public Health 2023, 11, 34–49. [Google Scholar] [CrossRef]
  44. Heintzman, R. Interactive Geovisualizations (iGEO): A new approach to teaching and learning physical geography. Rev. Int. Geogr. Educ. Online 2020, 10, 664–683. [Google Scholar] [CrossRef]
  45. Heintzman, R.; Brandi, A.; Kelley, M.; Marvin, M.C. A Physical Geography Lab’s Online Transition: Student and Instructor Insights Using iGEO Video Games during the Pandemic. J. Geogr. 2023, 122, 1–9. [Google Scholar] [CrossRef]
  46. Geraghty, E.; Kerski, J. The impact of COVID-19 on geography, GIS, and education. J-READING J. Res. Didat. Geogr. 2020, 2, 53–66. [Google Scholar]
  47. Casquero-Modrego, N.; Núñez-Andrés, M.A.; Iniesto-Alba, M.J. Effects of small-group learning on the assessment of professional skills through a PBL activity. Trans. GIS 2022, 26, 1735–1753. [Google Scholar] [CrossRef]
  48. Elalami, M.E.; Elshafei, I.A.; Abdelkader, H.E. Location-Based Services Using Web-Gis by An Android Platform to Improve Students’ Navigation During COVID-19. J. Theor. Appl. Inf. Technol. 2022, 100, 3441–3456. [Google Scholar]
  49. Kafarski, K.; Kazak, J.K. Erasmus Staff mobility in the building of a European network: The case of a Central European university. Sustainability 2022, 14, 4949. [Google Scholar] [CrossRef]
  50. Puertas-Aguilar, M.Á.; Álvarez-Otero, J.; de Lázaro-Torres, M.L. The challenge of teacher training in the 2030 agenda framework using geotechnologies. Educ. Sci. 2021, 11, 381. [Google Scholar] [CrossRef]
  51. Martínez-Hernández, C.; Stoffelen, A.; Piskorski, R. Obtaining geographical competences through online cartography of familiar and unfamiliar urban heritage: Lessons from student workshops. J. Geogr. High. Educ. 2022, 1–20. [Google Scholar] [CrossRef]
  52. Gaie, C. Providing detailed information on national policies to cope with the COVID-19 pandemic. Digit. Gov. Res. Pract. 2020, 2, 1–11. [Google Scholar] [CrossRef]
  53. Fassoulas, C.; Nikolakakis, E.; Staridas, S. Digital tools to serve geotourism and sustainable development at Psiloritis UNESCO Global Geopark in COVID times and beyond. Geosciences 2022, 12, 78. [Google Scholar] [CrossRef]
  54. MacTavish, M.; Wecker, L.; Samavati, F. Perspective Charts in a Multi-Foci Globe-Based Visualization of COVID-19 Data. ISPRS Int. J. Geo-Inf. 2022, 11, 223. [Google Scholar] [CrossRef]
  55. Medeiros, E.; Valente, B. Assessing impacts of public policies towards environmental sustainability in an EU region: North of Portugal. Eur. Plan. Stud. 2023, 1–20. [Google Scholar] [CrossRef]
  56. Mesquita, A.L.; de Souza, M.B.; Cardoso, P.M.; Braga, T.G.M.; Paiva, P.F.P.R. Gestão de Resíduos Sólidos durante a pandemia da COVID-19 no município de Belém (PA). Rev. Bras. Educ. Ambient. RevBEA 2022, 17, 150–165. [Google Scholar] [CrossRef]
  57. Santos Costa, S.S.; do Nascimento, M.A.L.; da Silva, M.L.N. Roteiro virtual pelos Geossítios do Geoparque Aspirante Seridó: Ferramentas cartográficas livres do Google® para Geoeducação. Terrae Didat. 2022, 18, e022004. [Google Scholar] [CrossRef]
  58. Leão AL, F.; Dalgallo, A.Z.; Kanashiro, M. Mudanças no comportamento de caminhada durante a pandemia de COVID-19 no Brasil. In Proceedings of the XIX Encontro Nacional de Tecnologia do Ambiente Construído, Canela, Brasil, 9–11 November 2022; Volume 19, pp. 1–10. [Google Scholar]
  59. Freitas Pereira, A.C.; Cândido, R.G. Ensino Virtual de Cartografia Digital Diante da Pandemia COVID-19. In Diálogos Sobre a Docência Universitária: Desafios e Superações do Grupo de Estudos de Práticas em Ensino (GEPE) Sobre A; Torres, A.C.P.L.G.C., Faquin, E.S., Moura, J.D.P.M., Eds.; Pedro & João Editors; Docência Universitária: São Carlos, Brasil, 2022; 274p. [Google Scholar]
  60. Machado, B.H.F.; da Silva, P.M.; da Silva, T.M.; da Silva Leal, S.P.; Vargas, K.B.; de Sousa, G.M. Geopasseios virtuais como alternativa de imersão no campus da UFRRJ e FLONA Mário Xavier durante a pandemia. Rev. Bras. Extensão Univ. 2022, 13, 291–301. [Google Scholar] [CrossRef]
  61. Antero, R.; Lima, M.P.; da Silva Ferreira, N.; de Souza, J.V.S.A.; Barbosa, L.S. Geotecnologias como recurso didático nas aulas remotas de geografia: Experiências do pibid na semana do meio ambiente. DESAFIOS-Rev. Interdiscip. Univ. Fed. Tocantins 2023, 125–139. [Google Scholar] [CrossRef]
  62. Dantas, S.; Mesquita, D.; Silva, J. Alfabetização cartográfica no Ensino Fundamental:: A retomada do processo pós ensino remoto emergencial. Metodol. Aprendizado 2023, 6, 247–255. [Google Scholar] [CrossRef]
  63. Habowski, J.; Sccoti, A.; Siqueira, J. Relatos e experiências: Oficina remota de introdução ao software Qgis na XII Semana Acadêmica de geografia da Universidade Federal de Santa Maria. Metodol. Aprendizado 2023, 6, 165–174. [Google Scholar] [CrossRef]
  64. Palhares, R.H.; Hermano, V.M. Geotecnologias aplicadas no mapeamento da COVID-19: Uma abordagem metodológica em Belo Horizonte-MG. GEOgraphia 2023, 25, 1–17. [Google Scholar]
  65. IBGE—Instituto Brasileiro de Geografia e Estatística. Cidades e Estados. 2023. Available online: https://www.ibge.gov.br/cidades-e-estados (accessed on 23 January 2023).
  66. IBGE—Instituto Brasileiro de Geografia e Estatística. Censo Demográfico. Censo. 2010. Available online: https://censo2010.ibge.gov.br/ (accessed on 23 January 2023).
  67. Barros, A.J.; Monteiro Romão, E.; Laudares, S.; Aldighieri Moraes, R.; Guimarães Gomes, G. The interdisciplinarity of geography and geoprocessing in the mapping of COVID 19 cases in the municipality of João Monlevade-Minas Gerais. Res. Soc. Dev. 2020, 9, e8309109173. [Google Scholar] [CrossRef]
  68. Bastos, L.S.; Niquini, R.P.; Lana, R.M.; Villela, D.A.; Cruz, O.G.; Coelho, F.C.; Codeço, C.T.; Gomes, M.F. COVID-19 and hospitalizations for SARI in Brazil: A comparison up to the 12th epidemiological week of 2020. Cad. Saude Publica 2020, 36, e00070120. [Google Scholar] [CrossRef] [PubMed]
  69. Libório, M.P.; Martinuci, O.D.S.; Bernardes, P.; Krohling, N.C.A.C.C.; Castro, G.; Guerra, H.L.; Ribeiro, E.A.; Fonzar, U.J.V.; Francisco, Í.D.C. Social vulnerability and COVID-19 in Maringá, Brazil. Spat. Inf. Res. 2023, 31, 51–59. [Google Scholar] [CrossRef]
  70. Libório, M.P.; Ekel, P.Y.; de Abreu, J.F.; Laudares, S. Factors that most expose countries to COVID-19: A composite indicators-based approach. GeoJournal 2022, 87, 5435–5449. [Google Scholar] [CrossRef] [PubMed]
  71. Fochezatto, A.; Sanguinet, E.R.; Batistela, P.; Valdes, R. Income Leakage Regional Effects: Supply and Demand Shocks during the Pandemic in Brazil and Chile. Geographies 2023, 3, 654–672. [Google Scholar] [CrossRef]
  72. Owuor, I.; Hochmair, H.H. Temporal Relationship between Daily Reports of COVID-19 Infections and Related GDELT and Tweet Mentions. Geographies 2023, 3, 584–609. [Google Scholar] [CrossRef]
  73. Wang, K.; Zhao, X. The Impact of COVID-19 Lockdowns on Satellite-Observed Aerosol Optical Thickness over the Surrounding Coastal Oceanic Areas of Megacities in the Coastal Zone. Geographies 2021, 1, 381–397. [Google Scholar] [CrossRef]
Figure 1. Search settings on which the preparation of the literature review was based. Note: (*) content created using VOSviewer [10].
Geographies 03 00041 g001
Figure 2. Annual evolution and evolution trend of the literature retrieved with the adopted search parameters.
Geographies 03 00041 g002
Figure 3. Research on the geovisualization of COVID-19 (the main areas of science and journals).
Geographies 03 00041 g003
Figure 4. The geovisualization of COVID-19 research fronts (the international literature retrieved with search parameters adopted in the study).
Geographies 03 00041 g004
Figure 5. Location map of the municipality of João Monlevade, Brazil.
Geographies 03 00041 g005
Figure 6. The operational framework of the development of the COVID-19 Geovisualization WebGIS in João Monlevade.
Geographies 03 00041 g006
Figure 7. COVID-19 spatio-temporal monitoring dashboard (cases by month, age, and other patient health information) for a fixed radius from a point. Note: the radius distance is not editable on this dashboard.
Geographies 03 00041 g007
Figure 8. COVID-19 spatio-temporal monitoring dashboard (cases by age group, gender, and month) for a specific location based on a point (e.g., commercial point or hospital).
Geographies 03 00041 g008
Figure 9. COVID-19 spatio-temporal monitoring dashboard (cases by age group, gender, and month) for a specific itinerary (e.g., street, avenue, or highway).
Geographies 03 00041 g009
Figure 10. COVID-19 spatio-temporal monitoring dashboard (cases by age group, gender, and month) for a specific region (e.g., neighborhood or census tract).
Geographies 03 00041 g010
Table 1. Region of origin of the authors of the papers retrieved based on the search parameters adopted in this study.
RegionNumber
Europe33
Asia17
North America 117
Africa5
Latin America2
1 Excluding Mexico, which was included as Latin America.
Table 2. Spatial analysis carried out by the WebGIS reviewed in the study.
WebGIS Associated withPapersReferences
Other data (e.g., tourism and education)21Balla et al. [24], Pasquaré et al. [26,27], Heintzman [44], Geraghty and Kerski [46], Casquero-Modrego et al. [47], Elalami et al. [48], Kafarski and Kazak [49], Heintzman et al. [45], Martínez- Hernández et al. [28], Puertas-Aguilar et al. [50], Martínez- Hernández et al. [51], Gaie [52], Fassoulas et al. [53], Mesquita et al. [56], Santos Costa et al. [57], Leão et al. [58], Freitas Pereira et al. [59], Machado et al., [60], Antero et al. [61], Dantas et al. [62], and Habowski et al. [63].
Only COVID-19 data11Beuren et al. [29], Marques da Costa et al. [30], Meddah and Guerroudji [36], Li [39], Schmidt et al. [40], Tiwari and Aljoufie [41], Supriatna et al. [4], Sadoun et al. [42], Phang et al. al. [43], MacTavish et al. [54], and Bandeira et al. [5].
Health, social, and demographic data9Kim [18], Iyanda et al. [19], Zhai et al. [21], Gavurova et al. [22], Li et al. [31], Steger [32], Pala et al. [33], Palhares and Hermano [64], and Lan and Delmelle [3].
Mobility, satellite, and social media data8Pászto et al. [20], Zhai et al. [21], Zhou et al. [23], Ponjavic et al. [25], Chen et al. [37], Zhou et al. [12], Konicek et al. [6], and Minghini et al. [7].
Health system data3Liu et al. [35], Odunsi et al. [14], and Torres-Ruiz et al. [34].
Non-spatial analysis3Ahasan et al. [2], Lan et al. [1], and Rezk and Hendawy [38].
Note: The study by Medeiros and Valente [55] does not fit into any of the above categories.
Disclaimer/Publisher’s Note: The statements, opinions and data contained in all publications are solely those of the individual author(s) and contributor(s) and not of MDPI and/or the editor(s). MDPI and/or the editor(s) disclaim responsibility for any injury to people or property resulting from any ideas, methods, instructions or products referred to in the content.

